soil water characteristic estimates by texture and … water characteristics-paper.pdf · soil...
TRANSCRIPT
Soil Water Characteristic Estimates by Texture and Organic Matter forHydrologic Solutions
K. E. Saxton and W. J. Rawls
ABSTRACTHydrologic analyses often involve the evaluation of soil water in-
filtration, conductivity, storage, and plant-water relationships. To de-fine the hydrologic soil water effects requires estimating soil watercharacteristics for water potential and hydraulic conductivity using soilvariables such as texture, organic matter (OM), and structure. Field orlaboratory measurements are difficult, costly, and often impractical formany hydrologic analyses. Statistical correlations between soil texture,soil water potential, and hydraulic conductivity can provide estimatessufficiently accurate for many analyses and decisions. This study de-veloped new soil water characteristic equations from the currentlyavailable USDA soil database using only the readily available vari-ables of soil texture and OM. These equations are similar to thosepreviously reported by Saxton et al. but include more variables andapplication range. They were combined with previously reported rela-tionships for tensions and conductivities and the effects of density,gravel, and salinity to form a comprehensive predictive system of soilwater characteristics for agricultural water management and hydro-logic analyses. Verification was performed using independent datasets for a wide range of soil textures. The predictive system was pro-grammed for a graphical computerized model to provide easy appli-cation and rapid solutions and is available at http://hydrolab.arsusda.gov/soilwater/Index.htm.
HYDROLOGIC ANALYSES are commonly achieved bycomputer simulation of individual processes, then
combined into more comprehensive results and ana-lyzed by statistics or time series. This contrasts withearlier methodology, which relied heavily on statisticalanalyses of measured hydrologic data. While modernmethods do not ignore available data, simulation of theindividual processes and recombination into landscapeand watershed responses often reveals additional detailsbeyond that previously available, particularly wheredata are limited or not available.A significant percentage of most precipitation infil-
trates to become stored soil water, which is either re-turned to the atmosphere by plant transpiration andevaporation or is conducted to lower levels and groundwater. As a result, modern simulation and analyses ofhydrologic processes relies heavily on appropriate de-scriptions of the soil water holding and transmission char-acteristics of the soil profile.Soil science research has developed an extensive un-
derstanding of soil water and its variability with soil
characteristics (Van Genuchten and Leij, 1992). Appli-cation of this knowledge is imperative for hydro-logic simulation within natural landscapes. However,hydrologists often do not have the capability or time toperform field or laboratory determinations. Estimatedvalues can be determined from local soil maps andpublished water retention and saturated conductivityestimates, but these methods often do not providesufficient range or accuracy for computerized hydro-logic analyses.
The texture based method reported by Saxton et al.(1986), largely based on the data set and analyses ofRawls et al. (1982), has been successfully applied to awide variety of analyses, particularly those of agricul-tural hydrology and water management, for example,SPAW model (Saxton and Willey, 1999, 2004, 2006).Other methods have provided similar results but withlimited versatility (Williams et al., 1992; Rawls et al.,1992; Stolte et al., 1994). Recent results of pedotrans-fer functions (Pachepsky and Rawls, 2005) are an exam-ple of modern equations that cannot be readily appliedbecause the input requirements are beyond that cus-tomarily available for hydrologic analyses. Currentlyavailable estimating methods have proven difficult toassemble and apply over a broad range of soil types andmoisture regimes. Therefore, the objectives of this studywere to (1) update the Saxton et al. (1986) soil water ten-sion equations with new equations derived from a largeUSDA soils database using only commonly availablevariables of soil texture and OM, (2) incorporate theimproved conductivity equation of Rawls et al. (1998),and (3) combine these with the effects of bulk density,gravel, and salinity to provide a broadly applicable pre-dictive system.
LITERATURE REVIEWEstimating soil water hydraulic characteristics from
readily available physical parameters has been a long-term goal of soil physicists and engineers. Several equa-tions commonly applied to hydrologic analyses weresummarized by Rawls et al. (1992; Table 5.1.1) andHillel(1998). These included those developed by Campbell(1974), Brooks and Corey (1964), Van Genuchten (1980)and others. Many early trials were sufficiently success-ful with limited data sets to suggest that there were sig-nificant underlying relationships between soil watercharacteristics and parameters such as soil texture(Gupta and Larson, 1979; Arya and Paris, 1981; Williamset al., 1983; Ahuja et al., 1985, 1999; Rawls et al., 1998;Gijsman et al., 2002). More recent studies have eval-uated additional variables and relationships (Vereeckenet al., 1989; Van Genuchten and Leij, 1992; Pachepskyand Rawls, 2005).
K.E. Saxton, Saxton Engineering and Associates, 1250 SW CampusView, Pullman WA 99163; W.J. Rawls, USDA-ARS Hydrology andRemote Sensing Lab, Bldg. 007, Rm. 104, BARC-W, Beltsville, MD20705. Received 8 Apr. 2005. *Corresponding author ([email protected]).
Published in Soil Sci. Soc. Am. J. 70:1569–1578 (2006).Soil & Water Management & Conservation, Soil Physicsdoi:10.2136/sssaj2005.0117ª Soil Science Society of America677 S. Segoe Rd., Madison, WI 53711 USA
Repro
duced
from
Soil
Scie
nce
Socie
tyof
Am
erica
Journ
al.
Publis
hed
by
Soil
Scie
nce
Socie
tyof
Am
erica.
All
copyrights
reserv
ed.
1569

Several estimating methods developed in recent yearshave shown that generalized predictions can be madewith usable, but variable, accuracy (Rawls et al., 1982;Saxton et al., 1986; Williams et al., 1992; Stolte et al.,1994; Kern, 1995). Nearly all of these methods involvemultiple soil descriptors, some of which are often notavailable for practical applications. Most were derivedby statistical correlations, although more recent analyseshave explored neural network analysis (Schaap et al.,1998) or field descriptions and pedotransfer functions(Grossman et al., 2001; Rawls and Pachepsky, 2002).Gijsman et al. (2002) reported an extensive review of
eight modern estimating methods applicable to hydro-logic and agronomic analyses. They observed significantdiscrepancy among the methods due to the regional databasis or methods of analyses thus creating doubt on thevalue of lab-measured water retention data for cropmodels. They concluded that…“ an analysis with a set offield-measured data showed that the method of Saxtonet al. (1986) performed the best….” Thus an enhance-ment of the Saxton et al. (1986) method is an appropriateextension to improve the field applications of soil watercharacteristic estimates with improved data basis andsupplemented by recently derived relationships of con-ductivity and including appropriate local adjustmentsfor OM, density, gravel, and salinity.
METHODOLOGYAn extensive laboratory data set of soil water char-
acteristics was obtained from the USDA/NRCS Na-tional Soil Characterization database (Soil Survey Staff,2004) consisting of approximately 2000 A-horizon and2000 B-C horizon samples (B-C a subset of 6700). Thedata for each sample included soil water content at 33-and 1500-kPa tensions; bulk densities; sand (S), silt andclay (C) particle sizes; and OM. These data were devel-oped with standard laboratory procedures (USDA-SCS,1982; Klute, 1986) with reviews and approval for consis-tency and accuracy.The B-C horizon data had much less average OM
content than that of the A horizon, 0.6 vs. 2.8% (w)1,respectively. Preliminary correlations showed that com-bining B-C horizon samples with those of the A-horizonsignificantly masked the effect of OM. Because textureand OM are primary variables affecting soil watercontent, only the A-horizon data were used to developregression equations.Samples with “extreme” values were omitted from the
data. Excluded were those with bulk density , 1.0 and. 1.8 g cm23, OM . 8 % (w) and clay . 60% (w). Thisreduced the A-horizon data set from 2149 to 1722samples. Samples outside the density range may havebeen the result of tillage or compaction causing them tobe unlike natural soils. The high OM samples were con-sidered from an “organic” soil whose water character-istics would not be representative of typical mineralsoils. Soils of very high clay content often have pore
structure and mineralogical effects different than thosecontaining higher portions of S or silt fractions.
The soil water retention data were correlated withvariables of S, C, and OM and their interactions (Hahn,1982, p. 218). Density was not included as a correla-tion variable because it was highly variable within theA-horizon data set and is not commonly available forapplications. Regression equations were developed formoisture held at tensions of 1500, 33, 0 to 33 kPa, andair-entry tensions. Air-entry values were estimated fromthe sample data by the exponential form of the Campbellequation (Rawls et al., 1992, Table 5.1.1). Saturationmoisture (us) values were estimated from the reportedsample bulk densities assuming particle density of2.65 g cm23.
Standard regression methods minimize the statisticalerror about a model equation. However, the best equa-tion form is often unknown and may not adequatelyrepresent the data, thus does not provide a satisfactorypredictive equation. Multi-variable linear analyses areparticularly suspect in this regard because one or moreof the variables may not be linearly correlated withthe dependent variables. This “lack-of-fit” was partiallycompensated for by applying a second correlation to theprediction deviations by the first correlation resulting intwo combined dependent equations, the second beinglinear or nonlinear.
Finally, the newmoisture tension equations were com-bined with the conductivity equations of Rawls et al.(1998) and additional equations for density, gravel, andsalinity effects. The results of the derived correlationequations were compared with three independent datasets representative of a wide range of soils to verify theircapability for field applications. A companion com-puter model and graphical interface of the equationsprovides rapid computations and displays for hydro-logic applications.
PREDICTION EQUATIONSNew predictive equations to estimate soil water con-
tent at selected tensions of 1500, 33, 0 to 33, and ce kPaare summarized in Table 1 (Eq. [1]–[4])2. Variable de-finitions are shown in Table 2. The coefficient ofdetermination (R2) and standard error of estimate (Se)define the data representation and expected predic-tive accuracy.
Moisture at the selected tensions was correlated withS, C, and OM plus interactions while air-entry tension(bubbling pressure), ce, was correlated with S, C, anduS-33 plus interactions. Supplemental analyses of theinitial predictive errors provided “lack of fit” second-ary adjustment equations for each equation as definedin methodology.
Graphical results of the correlations are shown inFig. 1 for soil moisture and air entry. The best moisturecorrelation was obtained for u1500 (R2 5 0.86) withprogressively more variability for u33 (R2 5 0.63) and
1%w indicates decimal percent by weight basis, and %v indicatesdecimal percent by volume basis. 2 Equations throughout the text are referenced to those in Table 1.
Repro
duced
from
Soil
Scie
nce
Socie
tyof
Am
erica
Journ
al.
Publis
hed
by
Soil
Scie
nce
Socie
tyof
Am
erica.
All
copyrights
reserv
ed.
1570 SOIL SCI. SOC. AM. J., VOL. 70, SEPTEMBER–OCTOBER 2006

u(S-33) (R2 5 0.36). Air-entry pressures, ce, were reason-
ably well estimated (R2 5 0.74).Preliminary correlations for uS with both A- and BC-
horizon data showed poor results (R2 , 0.25). Thesevalues were based on reported sample densities whichwere likely subject to factors such as tillage, compactionor roots and worms, which are not related to the cor-relation variables of texture and OM (Rawls, 1983;Grossman et al., 2001). As shown in Fig. 1C, the u(S-33)correlation was slightly better (R2 5 0.36) than for us,thus us equations were developed as the combination ofthose for u33 1 u(S-33), plus a small S adjustment derivedby an error analyses (Eq. [5]).A normal (average) density (rN) can be computed
from the estimated us assuming a particle density of 2.65(Eq. [6]). To accommodate local variations of soil den-sity by structure or management, a density adjustment
factor (DF) with a range of 0.9 to 1.3 was incorporatedto estimate values of rDF, uS-DF, u33-DF, and u(S-33)DF(Eq. [7]–[10]).
To form a full-range computational scheme, themoisture-tension relationship was represented by threetension segments of 1500–33, 33-ce, and ce–0, kPa. The1500- to 33-kPa range was estimated by an exponentialequation (Eq. [11]) with A and B parameters developedfrom the logarithmic form using estimated values u1500and u33 (Eq. [14]–[15]). The 33-ce kPa segment wasassumed linear (Eq. [12]) based on common experiencethat the exponential form often poorly represents theselow tensions and a linear segment is an acceptable sub-stitute for most applications. The ce–0 range was set ata constant moisture of uS (Eq. [13]). Example moisture-tension relationships using Eq. [11] through [15] areshown in Fig. 2.
Saturated (KS) and unsaturated (Ku) conductivityequations (Eq. [16]–[17]) were adapted from those ofRawls et al. (1998) and Campbell (1974). TheKS equation,of the form suggested by Kozeny–Carman (Carman,1956) and Ahuja et al. (1984), is a power function ofmoisture held at low tensions within the larger poreswhich most effectively conduct water. The value of l(Eq. [18]) is the inverse of the exponential tension-moisture curve slope B (Eq. [15]).
Several published equations have represented Ku toestimate the decrease of water conductivity as soil waterbecomes less than saturation (Brooks and Corey, 1964;
Table 2. Equation symbol definitions.
Symbol Definition
A, B Coefficients of moisture-tension, Eq. [11]C Clay, %wDF Density adjustment Factor (0.9–1.3)EC Electrical conductance of a saturated soil extract,
dS m21 (dS/m 5 mili-mho cm21)FC Field Capacity moisture (33 kPa), %vOM Organic Matter, %wPAW Plant Avail. moisture (33–1500 kPa, matric soil), %vPAWB Plant Avail. moisture (33–1500 kPa, bulk soil), %vS Sand, %wSAT Saturation moisture (0 kPa), %vWP Wilting point moisture (1500 kPa), %vuY Moisture at tension Y, %vu1500t 1500 kPa moisture, first solution, %vu1500 1500 kPa moisture, %vu33t 33 kPa moisture, first solution, %vu33 33 kPa moisture, normal density, %vu33-DF 33 kPa moisture, adjusted density, %vu(S-33)t SAT-33 kPa moisture, first solution, %vu(S-33) SAT-33 kPa moisture, normal density %vu(S-33)DF SAT-33 kPa moisture, adjusted density, %vuS Saturated moisture (0 kPa), normal density, %vuS-DF Saturated moisture (0 kPa), adjusted density, %vYu Tension at moisture u, kPaYet Tension at air entry, first solution, kPaYe Tension at air entry (bubbling pressure), kPaKS Saturated conductivity (matric soil), mm h21
Kb Saturated conductivity (bulk soil), mm h21
Ku Unsaturated conductivity at moisture u, mm h21
rN Normal density, g cm23
rB Bulk soil density (matric plus gravel), g cm23
rDF Adjusted density, g cm23
l Slope of logarithmic tension-moisture curvea Matric soil density/gravel density (2.65) 5 r/2.65Rv Volume fraction of gravel (decimal), g cm23
Rw Weight fraction of gravel (decimal), g g21
8O Osmotic potential at u 5 uS, kPa8Ou Osmotic potential at u , uS, kPa
Table 1. Equation summary for soil water characteristic estimates.†
Variable Equation R2/Se Eq.
Moisture Regressions
u1500 u1500 5 u1500t 1 (0:14 3 u1500t 2 0:02) 0.86/0.02 1u1500t 5 20:024S 1 0:487C 1 0:006OM
1 0:005(S 3 OM) 2 0:013(C 3 OM)1 0:068(S 3 C) 1 0:031
u33 u33 5 u33t 1 [1:283(u33t)2 2 0:374(u33t)2 0:015] 0.63/0.05 2u33t 5 20:251S 1 0:195C 1 0:011OM
1 0:006(S 3 OM) 2 0:027(C 3 OM)1 0:452(S 3 C) 1 0:299
u(S-33) uS233 5 u(S233)t 1 (0:636u(S233)t 2 0:107) 0.36/0.06 3u(S233)t 5 0:278S 1 0:034C 1 0:022OM
2 0:018(S3OM)2 0:027(C3OM)2 0:584(S 3 C) 1 0:078
Ye Ye 5 Yet 1 (0:02Y2et 2 0:113Yet 2 0:70) 0.78/2.9 4
Yet 5 221:67S 2 27:93C 2 81:97uS2331 71:12(S 3 uS233) 1 8:29(C 3 uS233)1 14:05(S 3 C) 1 27:16
uS uS 5 u33 1 u(S233) 2 0:097S 1 0:043 0.29/0.04 5rN rN 5 (1 2 uS)2:65 6
Density Effects
rDF rDF 5 rN 3 DF 7uS-DF uS2DF 5 1 2 (rDF=2:65) 8u33-DF u332DF 5 u33 2 0:2(uS 2 uS2DF) 9u(S-33)DF u(S233)DF 5 uS2DF 2 u332DF 10
Moisture-Tension
Y(1500-33) Yu 5 A(u)2B 11Y(33-Ye) Yu 5 33:0 2 [(u 2 u33)(33:0 2 Ye)=(uS 2 u33)] 12u(Ye-0) u 5 uS 13A A 5 exp(ln33 1 Blnu33) 14B B 5 [ln(1500) 2 ln(33)]=[ln(u33) 2 ln(u1500)] 15
Moisture–Conductivity
KS KS 5 1930(us 2 u33)(32l) 16
Ku Ku 5 KS(u=uS)[3 1 (2=l)] 17
l l 5 1=B 18Gravel Effects
Rv Rv 5 (aRw)=[1 2 Rw(1 2 a)] 19rB rB 5 rN(1 2 Rv) 1 (Rv 3 2:65) 20PAWB PAWB 5 PAW(1 2 Rv) 21
Kb/Ks Kb=Ks 51 2 Rw
[1 2 Rw(1 2 3a=2)]22
Salinity Effects
8O 8O 5 36EC 23
8Ou 8Ou 5uS
u(36EC) 24
†All symbols defined in Table 2.
Repro
duced
from
Soil
Scie
nce
Socie
tyof
Am
erica
Journ
al.
Publis
hed
by
Soil
Scie
nce
Socie
tyof
Am
erica.
All
copyrights
reserv
ed.
1571SAXTON & RAWLS: SOILWATER CHARACTERISTICS ESTIMATES

Campbell, 1974; Van Genuchten, 1980). We selected thesimpler one reported by Campbell (1974) that does notrequire an estimate of residual moisture. Examplemoisture-conductivity relationships by Eq. [16]–[18]are shown in Fig. 3.Gravel content may be expressed as either bulk soil
weight (%w) or volume (%v) basis. These can be inter-changed by Eq. [19]. Water characteristics of gravellysoils can be estimated using results of Eq. [1] through[18] for the matric soil, then modified for gravel content.Bulk density, rb, and plant available water for the bulksoil (PAWB), are adjusted by Eq. [20] and [21].Conductivity reduction by gravel has been estimated
using a thermal corollary equation in which non-conducting portions were randomly spaced within a con-ducting medium, thus assumed similar to gravel or rockswithin a matric soil with flow only in the matric por-tion (Peck and Watson, 1979; Flint and Childs, 1984;
Brakensiek et al., 1984, 1986). The ratio of saturated con-ductivity for the bulk soil, Kb, to that of the matric soil,Ks, is shown as Eq. [22]. This approach does not considerthe common occurrence of additional macroporeswithin gravelly soils, but this effect can be representedby a density reduction (DF , 1.0) to reflect additionalporosity with increased conductivity.
Salinity, measured as electrical conductance (EC) ofthe saturated solution, effects osmotic potential (CO) asrepresented by Eq. [23] (Tanji, 1990). As soil water isreduced by evapotranspiration from that at saturation,the EC measurement standard, the chemical quantitywill generally remain near constant causing a linear in-crease in concentration and osmotic potential, althoughthis process may be modified by chemical interactionssuch as by forming precipitates or bonds. Osmotic po-tential for a partially saturated soil is represented byEq. [24].
Fig. 1. Measured u1500, u33, u(S-33), and Ye versus predicted values by correlation Eq. [1]–[4].
Fig. 2. Example moisture-tension relationships estimated by Eq. [11]–[15]. Fig. 3. Example unsaturated conductivities estimated by Eq. [16]–[18].
Repro
duced
from
Soil
Scie
nce
Socie
tyof
Am
erica
Journ
al.
Publis
hed
by
Soil
Scie
nce
Socie
tyof
Am
erica.
All
copyrights
reserv
ed.
1572 SOIL SCI. SOC. AM. J., VOL. 70, SEPTEMBER–OCTOBER 2006

PREDICTION VERIFICATIONThe derived moisture prediction equations were veri-
fied by comparisons with mean texture class values ofseveral data sets. A 2000 sample subset of the USDAB-Chorizon data, companion with the correlated A-horizondata, provided average values for USDA soil textureclasses and were compared with estimated values by thecorrelation equations (Eq. [1]–[6]). The average OMwas 0.6%w compared with 2.8%w for the A-horizon.Mean u1500 values were closely predicted (Fig. 4A) whilethe u33 values (Fig. 4B) had a slight bias in the drierrange. As expected, the uS values (Fig. 4C) were leastaccurately estimated, a result of the poorest correlation(Eq. [6]), yet useful for many applications.The data reported by Rawls et al. (1998) provided a
second independent comparison over the full texturerange as shown in Fig. 5. The estimated moisture valuescompare well with the reported class averages for allthree tensions (Fig. 5A, B, C). The conductivity values
(Fig. 5D) are quite comparable, partially the result of thesimilar moisture estimates and applying the same con-ductivity equation.
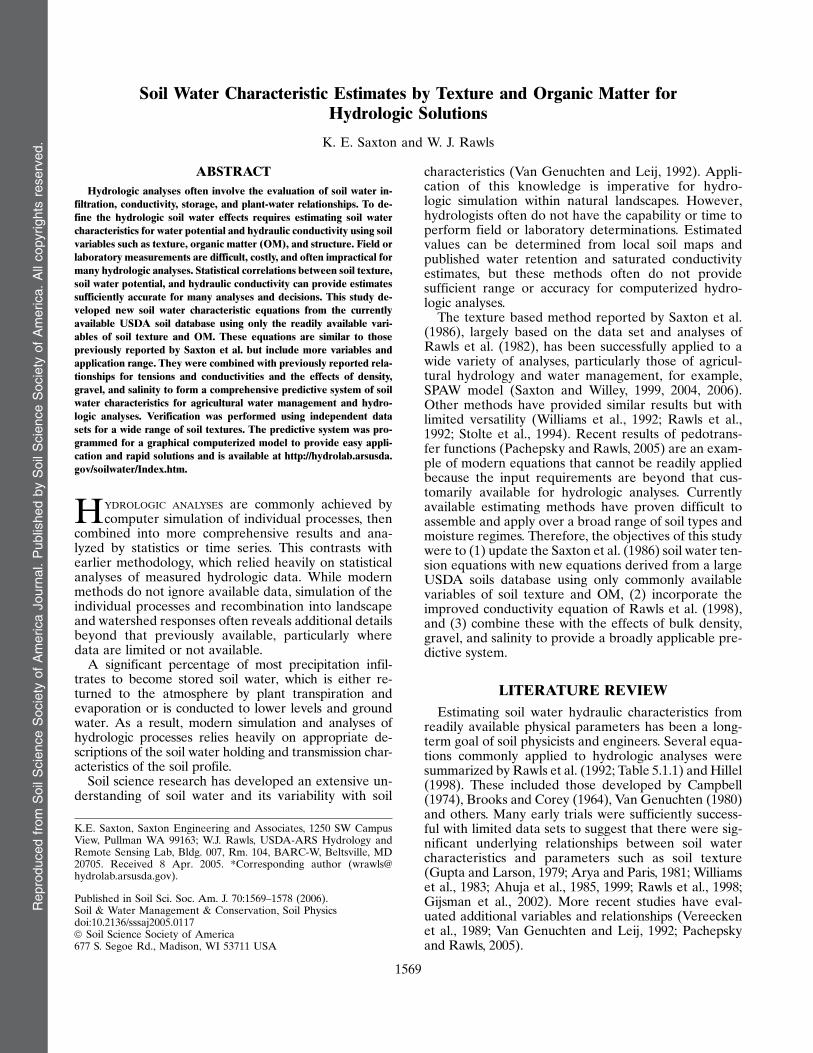
The predictive equations reported by Saxton et al.(1986) were based on mean texture class data summa-rized byRawls et al. (1982), another independent data set.The equations of Table 1 provide similar values of u1500and u33 compared with the Saxton et al. (1986) equations(Fig. 6A, B) but represent a larger, more reliable databasewith additional variables. The variability of uS and KSestimates by the two methods (Fig. 6C, D) indicateimprovement from those of the 1986 equations which hadbeen derived by an analysis of minimal data. As a result,the system of equations in Table 1 compared with thoseof Saxton et al. (1986) provide improved estimates ofvarying magnitude for both tensions and conductivitiesdepending on the parameter selected and the propertiesof the soil being evaluated.
Gijsman et al. (2002, Table 7) compared seven com-monly used estimating methods with field measureddata for three tension moistures of three major texturesoil classes. The Saxton et al. (1986) method was themost accurate based on a RMSE (Root Mean SquareError) of 0.009 compared with a 0.025 average for allmethods. The equations of Table 1 provide improvedestimates to those of Saxton et al. (1986) used in thiscomparison, plus they include the effects of OM, density,gravel, and salinity.
VARIABLE EFFECTSIt is well recognized that soil texture is the dominant
effect for soil water characteristics. However, four ad-ditional variables (OM, density, gravel, salinity) that canhave important effects were included in the completeestimation method. Organic matter was included in theregression equations, thus its effect was directly repre-sented by Eq. [1] through [6]. Soil density strongly re-flects a soils structure and large pore distribution, thushas a particularly significant effect on saturation andhydraulic conductivity. Soils with gravel-size particles(.2 mm) lose a portion of their water holding and con-ductance capacity, and saline soils pose an additionalosmotic pressure restriction to plant water uptake.
Organic MatterIncreased OM generally produces a soil with in-
creased water holding capacity and conductivity, largelyas a result of its influence on soil aggregation and as-sociated pore space distribution (Hudson, 1994). Theeffect of OM was represented in Eq. [1] through [6] as adependent variable. These equations should not be ap-plied beyond 8%w OM because these samples wereomitted from the analyzed data set.
Water content at high tensions, for example, 1500 kPa,is determined largely by texture, thus there is mini-mal influence by aggregation and OM. The effects ofOM changes for wetter moisture contents vary with thesoil texture, particularly clay. Organic matter effectsare similar to those of clay, thus those textures with
Fig. 4. Measured texture class averages of u1500, u33, and uS for B-Chorizon data versus estimates by Eq. [1]–[6].
Repro
duced
from
Soil
Scie
nce
Socie
tyof
Am
erica
Journ
al.
Publis
hed
by
Soil
Scie
nce
Socie
tyof
Am
erica.
All
copyrights
reserv
ed.
1573SAXTON & RAWLS: SOILWATER CHARACTERISTICS ESTIMATES

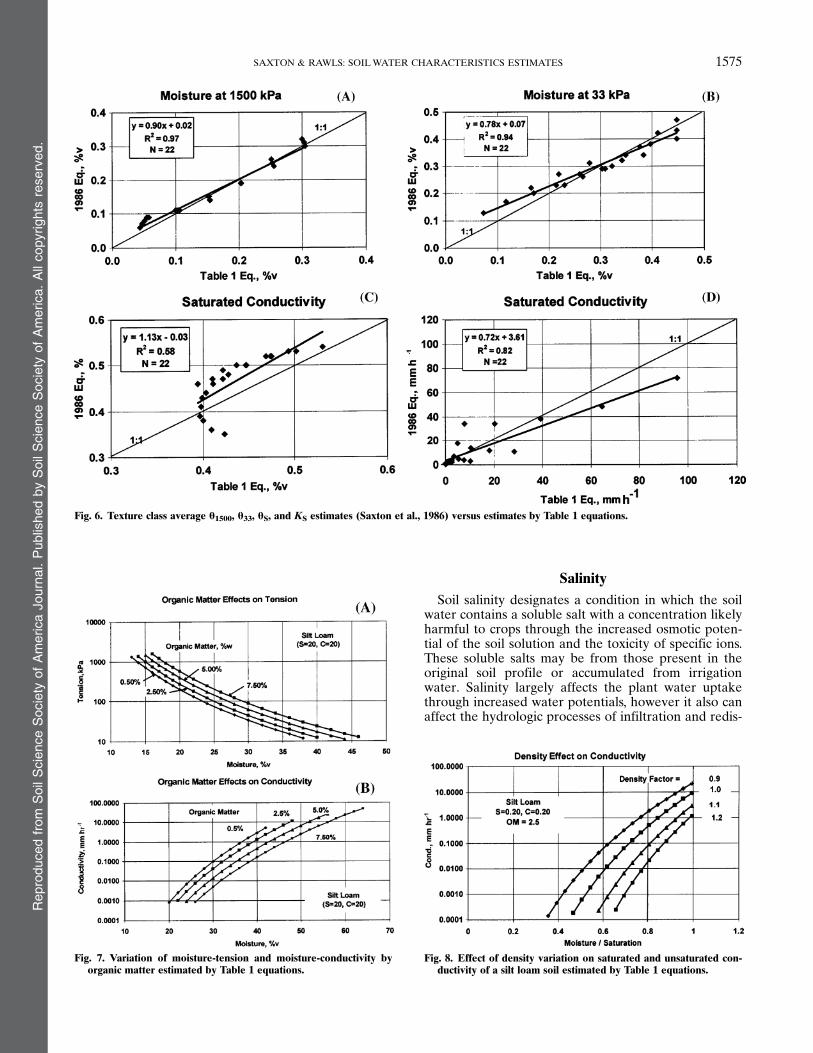
high clay content mask the effects of increased OM.Rawls et al. (2003) showed similar results. Example OMeffects on moisture-tension and moisture-conductivityrelationships are shown for a silt loam soil in Fig. 7 (Aand B). The OM effect on both KS and Ku readily fol-lows from the changes to uS and l (Eq. [16]–[17]).
DensityEstimated uS and rN values (Eq. [5]–[6]) are based on
the regression equations of u33 and u(S-33) (Eq. [2]–[3]),which had significant data variability (Fig. 1B). To ac-commodate moisture estimates for soils with variationsfrom thedata set averagedensity estimatedby textureandOM, rN, a density adjustment factor (DF) was added tothe estimating procedures to provide a density slightlyless to significantly more than average with a scale of0.9 to 1.3 multiplied times rN (Eq. [7]). This range wasselected from those most common within the data set andthose experiencedbyhydrologic applications. The densityvalues at the texture extremes may be the most likely torequire adjustments, for example, sands and clays.A largeadjustment of density could cause Eq. [10] to becomenegative, thus a minimum difference of 0.5%v was set tolimit the DF value in these cases.The change of u33 with density change is not well
documented. Some speculate that the u33 sized pores arecompressed, resulting in decreased water content, whileothers suggest that larger pores are compressed to theu33 size causing increased water content. By segregat-
ing the USDA A-horizon data set into texture classes,dividing samples of each class as below or above thenormal density for the class, and correcting for OM var-iation of each subgroup, a ratio of relative changes bydensity, Du33/DuS, was determined. While quite vari-able, there was a trend to slightly decrease u33 with de-creased uS by increased density as represented by Eq. [9].
As density is adjusted, uS, u33, and l are changedresulting in KS and Ku changes (Eq. [16]–[17]). The loamsoil example in Fig. 8 shows estimated KS and Ku valuesfor DF values of 0.9 to 1.2 (210 to +20%) shifts to rep-resent soils more loose or compacted than average.
GravelLarge diameter (.2.0 mm) gravel particles and
small rocks present in agricultural soils decrease theamount of soil matrix in which water can be stored orconducted. The water characteristics of the fine texturedmatric soil surrounding the gravel particles can be esti-mated by Eq. [1] to [18]. Bulk soil gravel content may beexpressed as either a weight or volume basis and areinterchangeable by Eq. [19].
Bulk density, PAW and Ks are properties of the bulksoil, matric soil plus gravel. Soils with gravel have de-creased available water and hydraulic conductivity andincreased bulk density as represented for bulk soil esti-mates by Eq. [19] through [22]. Example gravel (%w)relationships to bulk density, conductivity, and gravelvolume are shown in Fig. 9.
Fig. 5. Texture class average u1500, u33, uS, and KS (Rawls et al., 1998) versus estimates by Table 1 equations.
Repro
duced
from
Soil
Scie
nce
Socie
tyof
Am
erica
Journ
al.
Publis
hed
by
Soil
Scie
nce
Socie
tyof
Am
erica.
All
copyrights
reserv
ed.
1574 SOIL SCI. SOC. AM. J., VOL. 70, SEPTEMBER–OCTOBER 2006
SalinitySoil salinity designates a condition in which the soil
water contains a soluble salt with a concentration likelyharmful to crops through the increased osmotic poten-tial of the soil solution and the toxicity of specific ions.These soluble salts may be from those present in theoriginal soil profile or accumulated from irrigationwater. Salinity largely affects the plant water uptakethrough increased water potentials, however it also canaffect the hydrologic processes of infiltration and redis-
Fig. 6. Texture class average u1500, u33, uS, and KS estimates (Saxton et al., 1986) versus estimates by Table 1 equations.
Fig. 7. Variation of moisture-tension and moisture-conductivity byorganic matter estimated by Table 1 equations.
Fig. 8. Effect of density variation on saturated and unsaturated con-ductivity of a silt loam soil estimated by Table 1 equations.
Repro
duced
from
Soil
Scie
nce
Socie
tyof
Am
erica
Journ
al.
Publis
hed
by
Soil
Scie
nce
Socie
tyof
Am
erica.
All
copyrights
reserv
ed.
1575SAXTON & RAWLS: SOILWATER CHARACTERISTICS ESTIMATES

tribution through chemical induced changes of structureand aggregation.Osmotic plus matric potentials increase the total en-
ergy required for plant water uptake at all moisturelevels and effectively reduces PAW by making waterless readily available (Tanji, 1990). Secondary effects ofionic mineral nutrition and toxicity may also be presentcreating additional plant stress beyond the water po-tentials. Applying Eq. [24] demonstrates the relative in-fluence of salinity on matric-plus-osmotic tensions asshown in Fig. 10.
HYDROLOGIC APPLICATIONSA sequential solution of the derived Eq. [1] through
[24] will estimate soil water characteristics applicable tomany common hydrologic and water management solu-tions with minimum input values of S, C, and OM. Equa-tions and parameters are estimated for the full rangemoisture–tension and moisture–conductivity relation-ships which also provide several standard moisture val-ues such as wilting point (WP), field capacity (FC), SAT,PAW, rn, andKS.Average texture andOMvalues, such asfrom Rawls et al. (1998), or local references, will oftenprovide useful hydrologic solutions. More specific inputvalues are available in soil series descriptions and an-alyses published by theUSDA-NRCS and available fromthe USDA or Extension offices.If published input data are not available and deemed
necessary, it may be necessary to obtain the assistance of
an experienced soil scientist to make a qualified judg-ment of the textures and OM, or sample the soil profileby major horizons and perform a laboratory analyses.Texture determinations require deflocculating the soilparticles with a chemical such as sodium metaphosphatefollowed by a settling procedure in water with hydrom-eter or pipette measurements (USDA–SCS, 1982). Me-chanical screens can define the sand fraction (.50 mm),but not the silt and clay fractions. Bulk densities canreadily be determined by taking a relatively undisturbedcore of known volume, oven drying at 1058C (2208F)and weighing the removed soil. Gravel and salinity var-iations by Eq. [19] through [24] require additional in-put measurements.
The derived equations were incorporated into a graph-ical computer program to readily estimate water holdingand transmission characteristics (Fig. 11). Texture is se-lected from the texture triangle and slider bars adjust forOM, salinity, gravel, and density. The results are dynam-ically displayed in text boxes and on a moisture-tensionand moisture-conductivity graph as the inputs are varied.This provides a rapid and visual display of the estimatedwater holding and transmission characteristics over abroad range of variables.
The derived equations were also programmed as thewater characteristic estimates in the SPAW hydrologicmodel (Saxton and Willey, 2006) as a replacement forthose reported by Saxton et al. (1986). For comparison,equations of Saxton et al. (1986) and those of Table 1 areoptions in the SPAW model and the graphical interface(Fig. 11) and available at http://hydrolab.arsusda.gov/soilwater/Index.htm. Example soil water characteristicvalues estimated by the programmed texture triangleare shown in Table 3.
Recognizing that the derived equations (Table 1) arebased on a minimum of variables and a statistical av-erage, it is likely that the equation solutions will varysomewhat from specific field or laboratory data. If site-specific data are available, it is prudent to calibrate themodel results by adjusting the input values within ac-ceptable limits to provide similar water characteristic
Fig. 9. Example gravel estimates for gravel volume, bulk density andsaturated conductivity versus gravel percent by weight (.2-mmdiam.).
Fig. 10. Matric-plus-osmotic tension versus moisture for varying levelsof salinity estimated by Table 1 equations.
Fig. 11. Graphical input screen for the soil water characteristic modelof Table 1 equations.
Repro
duced
from
Soil
Scie
nce
Socie
tyof
Am
erica
Journ
al.
Publis
hed
by
Soil
Scie
nce
Socie
tyof
Am
erica.
All
copyrights
reserv
ed.
1576 SOIL SCI. SOC. AM. J., VOL. 70, SEPTEMBER–OCTOBER 2006

estimates. Using the regression deviations of Fig. 1 as aguide, slight adjustments of the clay texture will usuallybring the WP values to close agreement since OM andS have little effect. The FC values will be most effectedby C andOM adjustments. A density factor (DF) changewill largely affect uS and KS, with FC slightly modified.The model estimates will approximate each of the mea-sured values to a varying degree, thus the user mustassess those most important to the application and ad-just the model inputs accordingly.
SUMMARYStatistical analyses were conducted using measured
soil water properties for a broad range of soils providedby the current USDA soils database. Prediction equa-tions were derived for soil moisture tensions of 0, 33, and1500 kPa and air-entry based on commonly availablevariables of soil texture and OM. These were combinedwith equations of conductivity, plus the effects of density,gravel, and salinity, to provide a water characteristicmodel useful for a wide range of soil water and hydrologicapplications. Statistical analyses of laboratory data ap-proximate those of any specific soil type and charac-teristic, thus local knowledge and data should be used ifavailable to calibrate the predictions by varying the inputparameters within acceptable limits. A graphical com-puter program was developed which readily providesequation solutions and is available at http://hydrolab.arsusda.gov/soilwater/Index.htm. This predictive systemenhances the opportunity to integrate the extensive avail-able knowledge of soil water characteristics into hydro-logic and water management analyses and decisions.
ACKNOWLEDGMENTS
We pay special tribute to Christopher Robinson, RogerNelson, and Ralph Roberts, research associates, who providedsignificant insight and dedication to the analyses and devel-oped the companion computer model which significantly en-hanced the methodology and applicability.
REFERENCESAhuja, L.R., J.W. Naney, R.E. Green, and D.R. Nielsen. 1984. Mac-
roporosity to characterize spatial variability of hydraulic conduc-
tivity and effects of land management. Soil Sci. Soc. Am. J. 48:699–702.
Ahuja, L.R., J.W. Naney, and R.D. Williams. 1985. Estimating soilwater characteristics from simpler properties or limited data. SoilSci. Soc. Am. J. 49:1100–1105.
Ahuja, L.R., W.J. Rawls, D.R. Nielsen, and R.D. Williams. 1999.Determining soil hydraulic properties and their field variabilityfrom simpler measurements. p. 1207–1233. In R. W. Skaggs and J.Van Schilfgaarde (ed.). Agricultural drainage. ASA Monogr. No.38, ASA, Madison, WI.
Arya, L.M., and J.F. Paris. 1981. A physioempirical model to predictthe soil moisture characteristic from particle-size distribution andbulk density data. Soil Sci. Soc. Am. J. 45:1023–1030.
Brakensiek, D.L., W.J. Rawls, and G.R. Stephenson. 1984. Determin-ing the saturated hydraulic conductivity of a soil containing rockfragments. Soil Sci. Soc. Am. J. 50:834–835.
Brakensiek, D.L., W.J. Rawls, and G.R. Stephenson. 1986. A note ondetermining soil properties for soils containing rock fragments.J. Range Manage. 39(5):408–409.
Brooks, R.H., and A.T. Corey. 1964. Hydraulic properties of porousmedia. Hydrology Paper No. 3, Colorado StateUniv., Ft. Collins, CO.
Campbell, G.S. 1974. A simple method for determining unsaturatedconductivity from moisture retention data. Soil Sci. 117:311–314.
Carman, P.C. 1956. Flow of gases through porous media. AcademicPress, Inc., New York.
Flint, A.L., and S. Childs. 1984. Physical properties of rock frag-ments and their effect on available water in skeletal soils. p. 91–103.In J.D. Nicols et al (ed.) Erosion and productivity of soils containingrock fragments. SSSA Spec. Pub. 13. SSSA, Madison, WI.
Gijsman, A.J., S.S. Jagtap, and J.W. Jones. 2002. Wading through aswamp of complete confusion: How to chose a method for esti-mating soil water retention parameters for crop models. Eur. J.Agron. 18:75–105.
Grossman, R.B., D.S. Harms, C.A. Seybold, and J.E. Herrick. 2001.Coupling use-dependent and use-invariant data for soil qual-ity evaluation in the United States. J. Soil Water Conserv. 56(1):63–68.
Gupta, S.C., and W.E. Larson. 1979. Estimating soil water retentioncharacteristics from particle size distribution, organic matter con-tent, and bulk density. Water Resour. Res. 15:1633–1635.
Hahn, C.T. 1982. Statistical methods in hydrology. Iowa StateUniv. Press.
Hillel, D. 1998. Environmental soil physics. Academic Press, SanDiego., CA.
Hudson, B. 1994. Soil organic matter and available water capacity.J. Soil Water Conserv. 49:189–193.
Kern, J.S. 1995. Evaluation of soil water retention models based onbasic soil physical properties. Soil Sci. Soc. Am. J. 59:1134–1141.
Klute, A. (ed.). 1986. Methods of soil analysis. Part I. 2nd ed. ASA.Monogr. No. 9, ASA and SSSA, Madison, WI.
Pachepsky, Y.A., and W.J. Rawls (ed.). 2005. Development of pedo-transfer functions in soil hydrology. Elsevier. Development in SoilScience, V 30.m Amsterdam, The Netherlands.
Peck, A.J., and D. Watson. 1979. Hydraulic conductivity and flow in
Table 3. Example estimated water characteristic values for texture classes at 2.5%w organic matter (OM), no salinity, gravel or densityadjustment.
Texture class† Sand Clay Wilt pt. Field cap Saturation Plant avail. Saturated conductivity Matric density
1500 kPa 33 kPa 0 kPa%w %v mm h21 g cm23
Sa 88 5 5 10 46 5 108.1 1.43LSa 80 5 5 12 46 7 96.7 1.43SaL 65 10 8 18 45 10 50.3 1.46L 40 20 14 28 46 14 15.5 1.43SiL 20 15 11 31 48 20 16.1 1.38Si 10 5 6 30 48 25 22.0 1.38SaCL 60 25 17 27 43 10 11.3 1.50CL 30 35 22 36 48 14 4.3 1.39SiCL 10 35 22 38 51 17 5.7 1.30SiC 10 45 27 41 52 14 3.7 1.26SaC 50 40 25 36 44 11 1.4 1.47C 25 50 30 42 50 12 1.1 1.33
† Sa, sand; L, loam; Si, silt; C, clay.
Repro
duced
from
Soil
Scie
nce
Socie
tyof
Am
erica
Journ
al.
Publis
hed
by
Soil
Scie
nce
Socie
tyof
Am
erica.
All
copyrights
reserv
ed.
1577SAXTON & RAWLS: SOILWATER CHARACTERISTICS ESTIMATES

non-uniform soil. Conf. Proc., Workshop on Soil Physics and FieldHeterogeneity, CSIRO Canberra, Australia.
Rawls, W.J. 1983. Estimating soil bulk density from particle size anal-yses and organic matter content. Soil Sci. 135:123–125.
Rawls, W.J., L.R. Ahuja, and D.L. Brakensiek. 1992. Estimating soilhydraulic properties from soils data. p. 329–340. In M.Th. VanGenuchten et al. (ed.) Indirect methods for estimating the hydraulicproperties of unsaturated soils. Univ. of California, Riverside, CA.
Rawls, W.J., L.R. Ahuja, D.L. Brakensiek, and A. Shirmohammadi.1992. Infiltration and soil water movement. p. 5.1–5.5. InD.R. Maid-ment (ed.) Handbook of hydrology. McGraw-Hill, Inc., New York.
Rawls, W.J., D.L. Brakensiek, and K.E. Saxton. 1982. Estimation ofsoil water properties. Trans. ASAE 25:1316–1320.
Rawls, W.J., D. Gimenez, and R. Grossman. 1998. Use of soil texture,bulk density and slope of the water retention curve to predictsaturated hydraulic conductivity. Trans. ASAE 41:983–988.
Rawls, W.J., and Y.A. Pachepsky. 2002. Using field topographic de-scriptors to estimate soil water retention. Soil Sci. 167:423–435.
Rawls, W.J., Y.A. Pachepsky, J.C. Ritchie, T.M. Sobecki, and H.Bloodworth. 2003. Effect of Soil Organic Carbon on Soil WaterRetention. Geoderma 116:61–76.
Saxton, K.E., W.J. Rawls, J.S. Romberger, and R.I. Papendick. 1986.Estimating generalized soil water characteristics from texture.Trans. ASAE 50:1031–1035.
Saxton, K.E., and P.H. Willey. 1999. Agricultural wetland and pondhydrologic calculations using the SPAW-II Model. Conf. Proc.,ASAE. Toronto, ON, 18–21 July 1999. ASAE, St. Joseph, MI.
Saxton, K.E., and P.H. Willey. 2004. Agricultural wetland and pondhydrologic analyses using the SPAW model. Conf. Proc., Self-sustaining solutions for streams, watersheds and wetlands, 12–15Sept. 2004, ASAE. St. Joseph, MI.
Saxton, K.E., and P.H. Willey. 2006. The SPAW model for agricul-tural field and pond hydrologic simulation. p. 401–435. In V.P.
Singh and D.K. Frevert (ed.) Watershed models. CRC Press, BocaRaton, Fl.
Schaap, M.G., F.J. Leij, and M.Th., van Genuchten. 1998. Neural net-work analyses for hierarchical prediction of soil hydraulic proper-ties. Soil Sci. Soc. Am. J. 62:847–855.
Soil Survey Staff. 2004. National soil characterization data. NRCSNational Soil Survey Center, Lincoln, NE.
Stolte, J., J.I. Freijer, W. Bouten, C. Dirksen, J.M. Halbertsma, J.C.Van Dam, J.A. van Den Berg, G.J. Veerman, and J.H.M. Wosten.1994. Comparison of six methods to determine unsaturated soilhydraulic conductivity. Soil Sci. Soc. Am. J. 58:1596–1603.
Tanji, K.K. 1990. Agricultural salinity assessment and management.ASCE, New York.
USDA-SCS. 1982. Procedures for collecting soil samples and methodsof analysis for soil survey. Soil Survey Investigations Report I,Washington, DC.
Van Genuchten, M.Th. 1980. A closed-form equation for predictingthe hydraulic conductivity of unsaturated soils. Soil Sci. Soc. Am. J.44:892–898.
Van Genuchten, M.Th., and F.J. Leij. 1992. On estimating the hy-draulic properties of unsaturated soils. p. 1–14. In M.Th. VanGenuchten et al. (ed.) Indirect methods for estimating the hy-draulic properties of unsaturated soils. Univ. of California,Riverside, CA.
Vereecken, H., J. Maes, J. Feyen, and P. Darius. 1989. Estimating thesoil moisture retention characteristic from texture, bulk density, andcarbon content. Soil Sci. 148:389–403.
Williams, R.D., L.R. Ahuja, and J.W. Naney. 1992. Comparison ofmethods to estimate soil water characteristics from soil texture,bulk density, and limited data. Soil Sci. 153:172–184.
Williams, J., R.E. Prebble, W.T. Williams, and C.T. Hignett. 1983. Theinfluence of texture, structure, and clay mineralogy on the soilmoisture characteristic. Aust. J. Soil Res. 21:15–32.
Repro
duced
from
Soil
Scie
nce
Socie
tyof
Am
erica
Journ
al.
Publis
hed
by
Soil
Scie
nce
Socie
tyof
Am
erica.
All
copyrights
reserv
ed.
1578 SOIL SCI. SOC. AM. J., VOL. 70, SEPTEMBER–OCTOBER 2006