evaluation of soil texture determination using soil
TRANSCRIPT
Evaluation of soil texture determination using soil fraction data resultingfrom laser diffraction method**
András Makó1,2*, Brigitta Szabó1,2, Kálmán Rajkai1, József Szabó1, Zsófia Bakacsi1, Viktória Labancz3, Hilda Hernádi2, and Gyöngyi Barna1
1Institute for Soil Sciences and Agricultural Chemistry, Centre for Agricultural Research, Hungarian Academy of Sciences,H-1022 Budapest, Herman O. Street 15, Hungary
2University of Pannonia Georgikon Faculty, H-8360 Keszthely, Deák F. Street 16, Hungary3Szent István University, Department of Soil Science and Agricultural Chemistry, H-2100 Gödöllő, Páter K. Street 1, Hungary
Received September 14, 2018; accepted April 30, 2019
Int. Agrophys., 2019, 33, 445-454doi: 10.31545/intagr/113347
*Corresponding author e-mail: [email protected]**This research has been implemented with the support pro-vided from the National Research, Development and Innovation Fund of Hungary, financed under the K 119475 (2016-2020) and KH124765 (2017-2019) funding scheme, and by a common grant from the Hungarian and Polish Academy of Sciences (Grant No. NKM-108/2017) (2017-2019).
A b s t r a c t. There are global aspirations to harmonize soil par-ticle-size distribution data measured by the laser diffraction method and by traditional sedimentation techniques, e.g. sieve-pipette methods. The need has arisen therefore to build up a database, con-taining particle-size distribution values measured by the sieving and pipette method according to the Hungarian standard (sieve-pipette methods-MSZ) and the laser diffraction method according to a widespread and widely used procedure. In our current publica-tion, 155 soil samples measured with sieve-pipette methods-MSZ and laser diffraction method (Malvern Mastersizer 2000, HydroG dispersion unit) were compared. Through the application of the usual size limits at the laser diffraction method, the clay fraction was under- and the silt fraction was overestimated compared to the sieve-pipette methods-MSZ results, and subsequently the soil texture classes were determined according to the results of both methods also differed significantly from each other. Based on our previous experience, the extension of the upper size limit of the clay fraction from 2 to 7 µm increases the comparability of sieve-pipette methods-MSZ and laser diffraction method, in this way the texture classes derived from the particle-size distributions were also more in accordance with each other. The difference between the results of the two kinds of particle-size distribution measure-ment methods could be further reduced with the pedotransfer functions presented.
K e y w o r d s: laser diffraction, particle-size distribution, pedotransfer function, soil texture triangle
INTRODUCTION
The accurate and precise analysis of particle-size dis-tribution (PSD) is important in soil science, geology and sedimentology (Miller and Schaetzl, 2011). Most fre-quently, 0.25-2 mm particles are separated by wet sieving. The under 0.25 mm separation of different-sized particles is based on sedimentation, applying either the pipette or hydrometer method (Gee and Bauder, 1986; Allen, 1990; ISO 11277:2009(E)).
Stokes’ law is applied to calculate how much time is needed for a particle with a given diameter to settle in a sus- pension. In settlement, it is assumed that: (a) soil parti-cles are rigid, spherical and smooth, (b) soil particles have similar densities, (c) particle-to-particle interference and boundary effects from the walls of the sedimentation col-umn are negligible, (d) particle sizes are small enough to ensure that the induced fluid flow is within the laminar flow regime. When particles have irregular shape then deviations from the Stokes’ equation are expected, which is character-istic of silty and clayey particles (Clifton et al., 1999).
The laser diffraction method (LDM) for particle-size analysis was introduced by Allen (1990). LDM is being applied more and more often in soil science for soil PSD determination (Bieganowski et al., 2018); however, the labour-intensive pipette or hydrometer methods are the ones prescribed in internationally accepted standards for
© 2019 Institute of Agrophysics, Polish Academy of Sciences
A. MAKÓ et al.446
soil PSD analysis and therefore they are still the most wide-ly used methods. LDM calculates the PSD according to the laser beam diffraction angle and intensity using different models (de Boer et al., 1987). LDM provides the PSD in volume % which is identical with weight % if the shape of the particles are considered to be spherical and they have similar densities (Bieganowski et al., 2012). One of the advantages of LDM analysis is that the PSD of a large number of samples can be measured in less time than with other currently used methods. Laser diffractometers, which have recently been made available, provide a relatively wide measurement range – from fractions of micrometers to several millimeters. Several small categories (bins) can be measured, which serves to provide almost continuous PSD data (Miller and Schaetzl, 2011). The disadvantage of LDM is its higher cost than other PSD measurement techniques (Ryżak and Bieganowski, 2011). The precision of the analysis is influenced by sample preparation, pre-treatment, the optical properties of the particles, parameter settings of the equipment and type of theory used for the evaluation (Ryżak and Bieganowski, 2011; Sochan et al., 2012; Madarász et al., 2012; Bieganowski et al., 2018).
Several papers compare the LDM with the sieve-pipette method (SPM) (e.g. Konert and Vandenberghe, 1997; Yang et al., 2015; Makó et al., 2017) and/or the hydrometer meth-od (e.g. Di Stefano et al., 2010; Ryżak and Bieganowski, 2010; Orzechowski et al., 2014; Fenton et al., 2015; Fisher et al., 2017). Based on the results of the comparisons LDM tends to underestimate the proportion of the clay fraction and overestimates the silt fraction (Miller and Schaetzl, 2011; Orzechowski et al., 2014; Yang et al., 2015) com-pared to SPM. Sand fractions measured by LDM and SPM do not differ significantly (Orzechowski et al., 2014). The main reasons for these results, based on the literature, may be summarized as follows: (a) the shape of the clay and silt particles are different from the spherical form, (b) the estimated optical indices of the soil particles are incorrect, (c) the dispersion of soil aggregates are insufficient, (d) the representativeness of all fractions are inappropriate (e.g. too many or too few sand particles in the suspension to be measured) (Konert and Vandenberghe, 1997; Fedotov et al., 2007; Polakowski et al., 2014; Bieganowski et al., 2018). The differences obtained using SPM and LDM may have a significant impact on soil texture classifications (Sochan et al., 2012).
Several authors have attempted to change the range of the LDM fraction sizes to match them to the results obtained by SPM. First Konert and Vandenberghe (1997) ascertained that the < 2 µm clay content measured using SPM is equivalent to the < 8 µm fraction in the case of LDM measurements. This 8 µm clay/silt fraction boundary was also found by Fenton et al. (2015). During the exami-nation of different types of clays Pabst et al. (2000) found an LDM clay/silt size range boundary of 3-5 µm to be the most accurate in comparison with SPM. According to
Buurman et al. (2001) the optimum LDM clay/silt fraction boundary may vary from 2 to 8 µm depending on the type of sediment. Vandecasteele and De Vos (2003) found on a Belgian soil database that the 0-6 µm LDM clay fraction showed the best agreement with the 0-2 µm clay content recorded using SPM. Fisher et al. (2017) found 9 µm to be the most applicable value for the clay-silt boundary. In the case of calcareous soils a value of 4 µm was recommended by Kerry et al. (2009) as the upper limit of the LDM clay fraction. During an SPM-LDM comparative analysis of a representative European soil database the clay/silt frac-tion boundary was given as 6.6 µm for samples with organic matter (OM), and 5.8 µm for those samples where OM was removed (Makó et al., 2017). For dune samples, Sitzia et al. (2017) found that the LDM clay fraction under 4.6 µm showed a good correlation with SPM clay content. It is rarely, it is advised to also change the silt/sand bound-ary. Fisher et al. (2017) suggested changing the upper silt boundary from 20 µm to 26 µm to obtain a better corre-lation between the results of the hydrometer methods and LDM. Makó et al. (2017) proposed 60.3 µm for samples with OM, and 69.2 µm for samples without OM as the silt/sand boundary.
Several authors have made an effort to create models for converting LDM PSD data to SPM PSD data (Di Stefano et al., 2010; Yang et al., 2015). Most of these conversion equations, however, were based on small local soil datasets and may not be applied on a national or continental scale. Recently, specific pedotransfer functions (PTFs) with dif-ferent input requirements were developed by Makó et al. (2017) for continental scale applications in Europe to con-vert data from LDM to SPM.
The aims of the present paper are to 1) present an optimized conversion technique between the PSD data measured according to two well-defined methods (SPM and LDM), 2) show how the accuracy of the conversion method may be verified, with special regard for the accu-racy of the classifications into texture classes based on the PSD results obtained with different methods.
MATERIALS AND METHODS
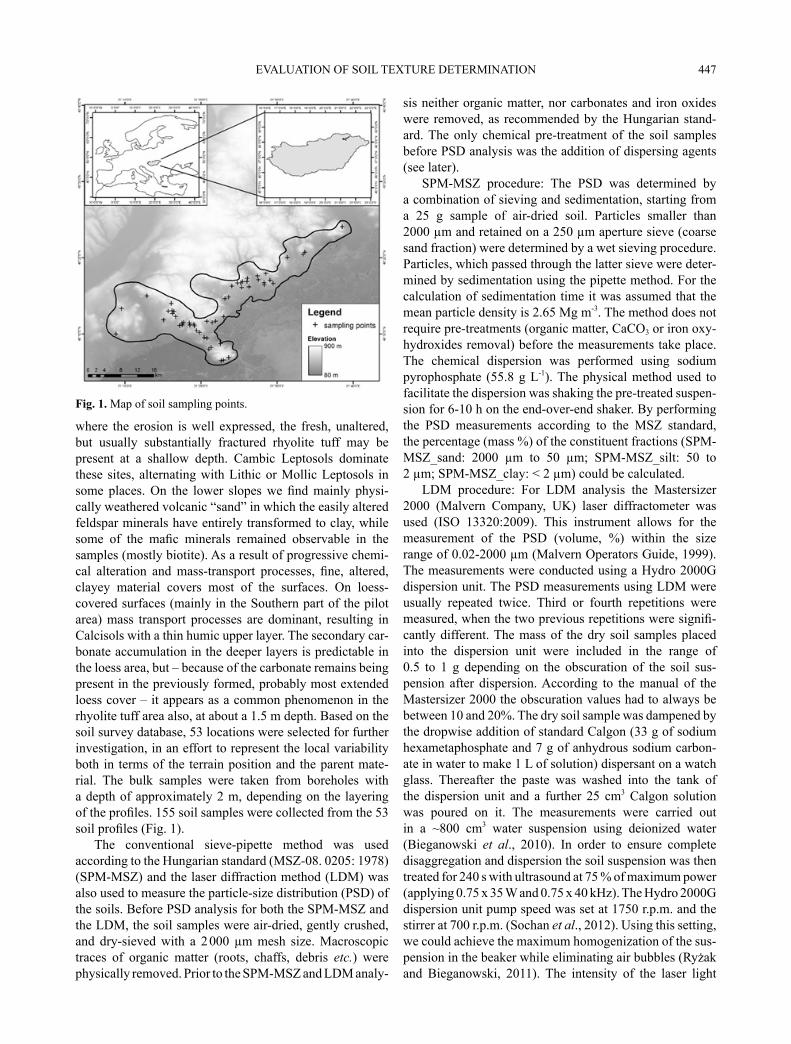
A comprehensive soil survey campaign was carried out in 2014 and 2015 in the Tokaj Wine Region, North-Hungary (Fig. 1). The Tokaj Region is one of the most famous wine regions in Hungary, the vineyards cover the foothills of the volcanic Tokaj Mountains (the elevation goes up to 700 m, Baltic). As a result of both natural and human-induced land-scape evolution, the Tokaj Region has a spatially diverse and unique terroir both in the pedological-geological and climatic sense. The differently weathered rhyolite tuff and windblown loess are common parent materials. In the region of the rhyolite parent material, the combined effect of the progressive alteration of tuff and the slope position results in diverse soil sequences. On the elevated position,
EVALUATION OF SOIL TEXTURE DETERMINATION 447
where the erosion is well expressed, the fresh, unaltered, but usually substantially fractured rhyolite tuff may be present at a shallow depth. Cambic Leptosols dominate these sites, alternating with Lithic or Mollic Leptosols in some places. On the lower slopes we find mainly physi-cally weathered volcanic “sand” in which the easily altered feldspar minerals have entirely transformed to clay, while some of the mafic minerals remained observable in the samples (mostly biotite). As a result of progressive chemi-cal alteration and mass-transport processes, fine, altered, clayey material covers most of the surfaces. On loess-covered surfaces (mainly in the Southern part of the pilot area) mass transport processes are dominant, resulting in Calcisols with a thin humic upper layer. The secondary car-bonate accumulation in the deeper layers is predictable in the loess area, but – because of the carbonate remains being present in the previously formed, probably most extended loess cover – it appears as a common phenomenon in the rhyolite tuff area also, at about a 1.5 m depth. Based on the soil survey database, 53 locations were selected for further investigation, in an effort to represent the local variability both in terms of the terrain position and the parent mate-rial. The bulk samples were taken from boreholes with a depth of approximately 2 m, depending on the layering of the profiles. 155 soil samples were collected from the 53 soil profiles (Fig. 1).
The conventional sieve-pipette method was used according to the Hungarian standard (MSZ-08. 0205: 1978) (SPM-MSZ) and the laser diffraction method (LDM) was also used to measure the particle-size distribution (PSD) of the soils. Before PSD analysis for both the SPM-MSZ and the LDM, the soil samples were air-dried, gently crushed, and dry-sieved with a 2 000 µm mesh size. Macroscopic traces of organic matter (roots, chaffs, debris etc.) were physically removed. Prior to the SPM-MSZ and LDM analy-
sis neither organic matter, nor carbonates and iron oxides were removed, as recommended by the Hungarian stand-ard. The only chemical pre-treatment of the soil samples before PSD analysis was the addition of dispersing agents (see later).
SPM-MSZ procedure: The PSD was determined by a combination of sieving and sedimentation, starting from a 25 g sample of air-dried soil. Particles smaller than 2000 µm and retained on a 250 µm aperture sieve (coarse sand fraction) were determined by a wet sieving procedure. Particles, which passed through the latter sieve were deter-mined by sedimentation using the pipette method. For the calculation of sedimentation time it was assumed that the mean particle density is 2.65 Mg m-3. The method does not require pre-treatments (organic matter, CaCO3 or iron oxy-hydroxides removal) before the measurements take place. The chemical dispersion was performed using sodium pyrophosphate (55.8 g L-1). The physical method used to facilitate the dispersion was shaking the pre-treated suspen-sion for 6-10 h on the end-over-end shaker. By performing the PSD measurements according to the MSZ standard, the percentage (mass %) of the constituent fractions (SPM-MSZ_sand: 2000 µm to 50 µm; SPM-MSZ_silt: 50 to 2 µm; SPM-MSZ_clay: < 2 µm) could be calculated.
LDM procedure: For LDM analysis the Mastersizer 2000 (Malvern Company, UK) laser diffractometer was used (ISO 13320:2009). This instrument allows for the measurement of the PSD (volume, %) within the size range of 0.02-2000 µm (Malvern Operators Guide, 1999). The measurements were conducted using a Hydro 2000G dispersion unit. The PSD measurements using LDM were usually repeated twice. Third or fourth repetitions were measured, when the two previous repetitions were signifi-cantly different. The mass of the dry soil samples placed into the dispersion unit were included in the range of 0.5 to 1 g depending on the obscuration of the soil sus-pension after dispersion. According to the manual of the Mastersizer 2000 the obscuration values had to always be between 10 and 20%. The dry soil sample was dampened by the dropwise addition of standard Calgon (33 g of sodium hexametaphosphate and 7 g of anhydrous sodium carbon-ate in water to make 1 L of solution) dispersant on a watch glass. Thereafter the paste was washed into the tank of the dispersion unit and a further 25 cm3 Calgon solution was poured on it. The measurements were carried out in a ~800 cm3 water suspension using deionized water (Bieganowski et al., 2010). In order to ensure complete disaggregation and dispersion the soil suspension was then treated for 240 s with ultrasound at 75 % of maximum power (applying 0.75 x 35 W and 0.75 x 40 kHz). The Hydro 2000G dispersion unit pump speed was set at 1750 r.p.m. and the stirrer at 700 r.p.m. (Sochan et al., 2012). Using this setting, we could achieve the maximum homogenization of the sus-pension in the beaker while eliminating air bubbles (Ryżak and Bieganowski, 2011). The intensity of the laser light
Fig. 1. Map of soil sampling points.
A. MAKÓ et al.448
registered with the particular detectors of the measurement system was converted to PSD according to the Mie theory, and the following optical setting parameters were used: a refraction index of 1.52 and an absorption index of 0.1 for the dispersed phase, and a refraction index of 1.33 for water as the dispersing phase. The laser light wavelength in the apparatus was 466 nm for blue and 633 nm for red light. All of the measurements lasted for 60 s (30 s for blue and 30 s for red light) (Ryżak and Bieganowski, 2010). The selected algorithms of the PSD calculation were the follow-ing: 1) general purpose analysis (GPA), 2) irregular shape ratio (ISR) (Malvern Operators Guide, 1999).
A dataset (N = 325) was built from the PSD measure-ments, which includes besides the SPM-MSZ and LDM PSD data the results of basic soil analyses and a description of the soil samples. The basic soil properties were meas-ured according to the Hungarian standards (Buzás, 1993). To obtain LDM particle size fractions similar to those of the pipette method, first the nearest fraction boundaries were chosen, and the fractions 1.90 and 52.5 µm – values closest to 2 and 50 μm – were used from the distribution data (“original LDM fraction boundaries”). The original LDM PSD fractions were accordingly LDM_sand: 2 000 to 52.5 µm, LDM_silt: 52.5 to 1.90 µm, LDM_clay: < 1.9 µm.
Fourteen possible clay fractions were calculated from the PSD results obtained by LDM using an upper boundary ranging from 1.4 to 10.0 µm (1.4, 1.6, 1.9, 2.2, 2.9, 3.3, 3.8, 4.4, 5.0, 5.8, 6.6, 7.6, 8.7 and 10.0 µm, respectively). In the same way, 12 possible sand fractions were considered using a lower boundary ranging from 30.2 to 138.4 µm (30.2, 34.7, 39.8, 45.7, 52.5, 60.3, 69.2, 79.4, 91.2, 104.7, 120.2 and 138.2 µm, respectively). In order to optimize the thresholds, close to the optimal clay/silt boundary (between 6.6 and 7.6 µm) and optimal silt/sand boundary (between 45.7 and 52.5 µm) different fraction boundaries were exam-ined using linear interpolation with a resolution 0.1 µm. The calculated clay, silt and sand fractions with various boundaries were used as dependent variables against the conventional clay, silt and sand fraction measured with SPM-MSZ (< 2.0 µm, 2-50 µm and 50-2000 µm, correspond-ingly). Lin’s concordance correlation coefficient (CCC) computation (Lin, 1989) between the PSD results of SPM and LDM data for each dataset were performed to opti-mize the clay, silt and sand fraction boundaries of the LDM measurements. Lin’s CCC measurements indicate how well a new set of observations (LDM PSD measurements) reproduce an original set (SPM-MSZ PSD), so that it may be used to assess the effectiveness of the laser measurement methods (Fisher et al., 2017; Makó et al., 2017). Lin’s CCC indicates perfect agreement if its value is 1, and the evalu-ation criteria can be divided into the following categories: 0.21-0.40 fair; 0.41-0.60 moderate; 0.61-0.80 substantial and 0.81-1.00 almost perfect. The resulting “modified opti-
mum LDM fraction boundaries” were used to calculate the modified clay, silt and sand fractions (LDM_claymod, LDM_siltmod and LDM_sandmod, respectively).
One of the potential applications of the datasets presented above is to develop methods for calculating con- ventional (SPM-MSZ) PSD data from more easily measu- red LDM PSD data and possibly consider other simply measurable soil parameters as well. In order to express the relationship between the results of the SPM-MSZ and LDM, pedotransfer functions (PTFs) were derived. We focused on the prediction method based on input soil data, which are available from LDM measurements and from basic soil tests. A linear regression with a backward elimination method (SPSS Statistics, Regression, Linear regression; SPSS, 2004) was used for the development of PTFs, because accuracy and reliability of that statisti-cal method was found to be appropriate in our previous research (Makó et al., 2017). Multiple linear regression equations were constructed to correlate the PSD fractions – clay and silt separately – of SPM-MSZ (SPM-MSZ_clay, SPM-MSZ_silt – mass %) with those measured by LDM, using the modified optimum LDM clay and silt fractions (LDM_claymod; LDM_siltmod – volume %) calculated with the modified optimum LDM fraction boundaries, result-ing in the closest relationship with SPM measurements during Lin’s CCC analysis. In order to predict the SPM-MSZ clay fraction (SPM-MSZ_claypred) apart from the LDM_claymod we also used the following soil pro- perties as regressed variables: the modified optimum LDM sand content (LDM_sandmod – volume %), humus (mass %) and calcium-carbonate (CaCO3 – mass %) con-tent, pH(H2O). The prediction of SPM-MSZ_siltpred was performed based on LDM_siltmod, LDM_sandmod, humus, CaCO3 and pH(H2O). In addition to the above, transformed soil parameters were calculated and linear, quadratic, recip-rocal and common base logarithms of the soil properties involved were also used in the regression analysis. The pre-dicted SPM-MSZ sand fraction was in all cases obtained as follows: SPM-MSZ_sandpred = 100 – (SPM-MSZ_claypred + SPM-MSZ_siltpred), where SPM-MSZ_sandpred, SPM-MSZ_claypred and SPM-MSZ_siltpred are the predicted SPM-MSZ sand, clay and silt fractions, respectively (mass %). The accuracy of the developed PTFs was investigated first in the traditional way based on the evaluation of the coefficients of determination (R2) and root mean square errors (RMSE) (mass %):
where: yi stands for the SPM-MSZ_clay, SPM-MSZ_silt or SPM-MSZ_sand values, ŷi is the predicted SPM-MSZ_claypred, SPM-MSZ_siltpred or SPM-MSZ_sandpred, N is the total number of samples. Thereafter Lin’s CCC computa-tion between the PSD results of SPM-MSZ and predicted SPM-MSZ (SPMpred) data was also performed. The RMSE
EVALUATION OF SOIL TEXTURE DETERMINATION 449
and Lin’s CCC computations were also performed for comparison between the measured SPM-MSZ and LDM fractions both for the original and the modified fraction boundary values.
The samples of the dataset were categorized into USDA textural classes in R (R Core Team, 2013), with a ‘soil-texture’ package (Moeys, 2014). Before assignment to these types, the determined sand, silt, and clay fraction percentages were first normalized and if their sum was not equal to 100%, their values were corrected. The textural classes, which were determined from the measured LDM (using different fraction boundaries) and predicted SPM-MSZ PSD data were compared with measured SPM-MSZ data. The percentage correspondence between the textural classes was then evaluated. The differences between the USDA texture classes calculated from predicted and meas-ured SPM-MSZ were visualized in a texture triangle also with the ‘soiltexture’ package. The two-dimensional kernel density estimation procedure was used in R to visualize and assess the structure of the soil texture data (Moeys, 2014). The kernel density estimation approximates the probability density function of a random variable and it is a popular tool for encoding the density of observations and for plotting the shape of a distribution (Venables and Ripley, 2002). It essentially finds dense regions of points and therefore it is also able to perform density-based clustering, where intra-cluster similarity is maximized and intercluster similarity is minimized.
The particle-size data is compositional (the sum of the particle size fractions is 100%), accordingly an increase in one fraction will certainly lead to a decrease in other fractions. Therefore, we assessed in a new way the cor-respondence between the different PSD results. This assessment is based on the soil texture triangles. Using the TT.css2xy function of the ’soiltexture’ package, the mea- sured and predicted texture data (three fraction data) were converted into x-y coordinates. This allowed for the cal-culation of the distance between the measured SPM-MSZ and LDM PSD or a measured and predicted SPM-MSZ PSD of each sample in the soil texture triangle. Using this dimensionless ‘distance’ variable we evaluated the similar-ity between the soil textures derived from SPM-MSZ and LDM PSD data in cases of selection between the different size fraction boundaries or the correspondence between the soil textures determined from the measured and predicted SPM-MSZ PSD. The significance of difference between the differently measured/derived PSD data was tested and compared the calculated ‘distance’ parameter with the One-Way ANOVA, Duncan and Tamhane’s T2 Post Hoc Tests (SPSS, 2004).
RESULTS AND DISCUSSION
The selected soil samples show a wide range of varia-tion in some soil properties (Table 1).
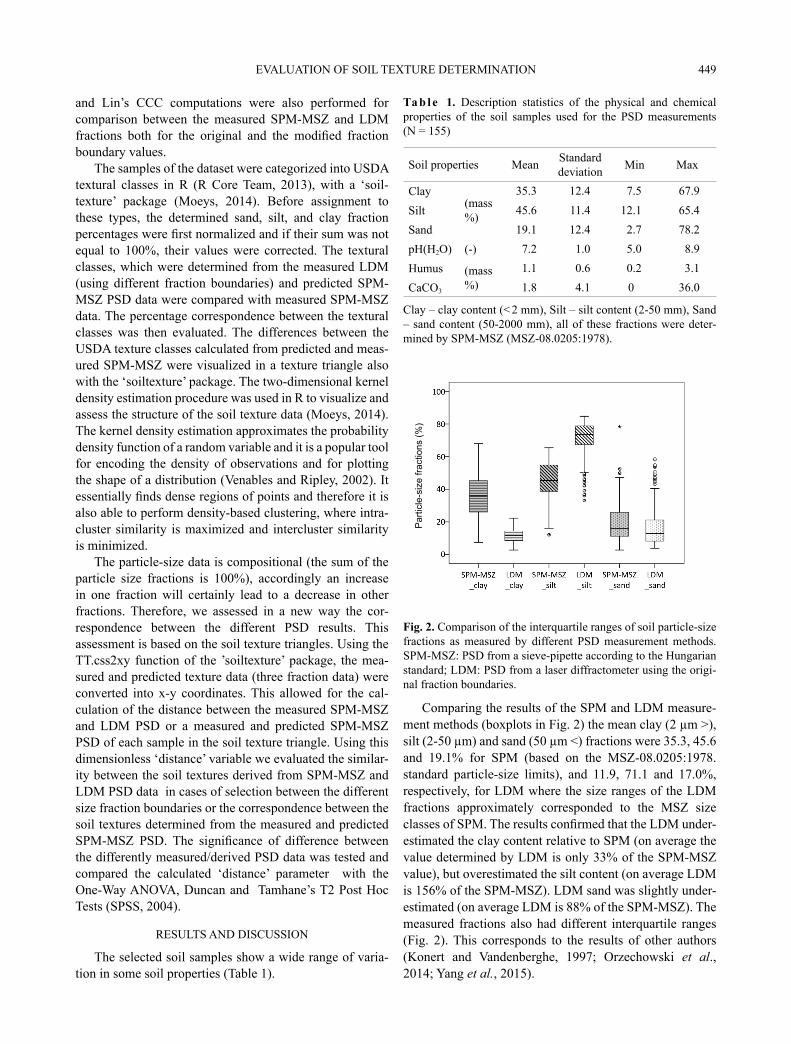
Comparing the results of the SPM and LDM measure-ment methods (boxplots in Fig. 2) the mean clay (2 µm >), silt (2-50 µm) and sand (50 µm <) fractions were 35.3, 45.6 and 19.1% for SPM (based on the MSZ-08.0205:1978. standard particle-size limits), and 11.9, 71.1 and 17.0%, respectively, for LDM where the size ranges of the LDM fractions approximately corresponded to the MSZ size classes of SPM. The results confirmed that the LDM under-estimated the clay content relative to SPM (on average the value determined by LDM is only 33% of the SPM-MSZ value), but overestimated the silt content (on average LDM is 156% of the SPM-MSZ). LDM sand was slightly under-estimated (on average LDM is 88% of the SPM-MSZ). The measured fractions also had different interquartile ranges (Fig. 2). This corresponds to the results of other authors (Konert and Vandenberghe, 1997; Orzechowski et al., 2014; Yang et al., 2015).
Ta b l e 1. Description statistics of the physical and chemical properties of the soil samples used for the PSD measurements (N = 155)
Soil properties Mean Standard deviation Min Max
Clay(mass%)
35.3 12.4 7.5 67.9Silt 45.6 11.4 12.1 65.4Sand 19.1 12.4 2.7 78.2pH(H2O) (-) 7.2 1.0 5.0 8.9Humus (mass
%)1.1 0.6 0.2 3.1
CaCO3 1.8 4.1 0 36.0
Clay – clay content (< 2 mm), Silt – silt content (2-50 mm), Sand – sand content (50-2000 mm), all of these fractions were deter-mined by SPM-MSZ (MSZ-08.0205:1978).
Fig. 2. Comparison of the interquartile ranges of soil particle-size fractions as measured by different PSD measurement methods. SPM-MSZ: PSD from a sieve-pipette according to the Hungarian standard; LDM: PSD from a laser diffractometer using the origi-nal fraction boundaries.
Par
ticle
-siz
e fra
ctio
ns (%
)
A. MAKÓ et al.450
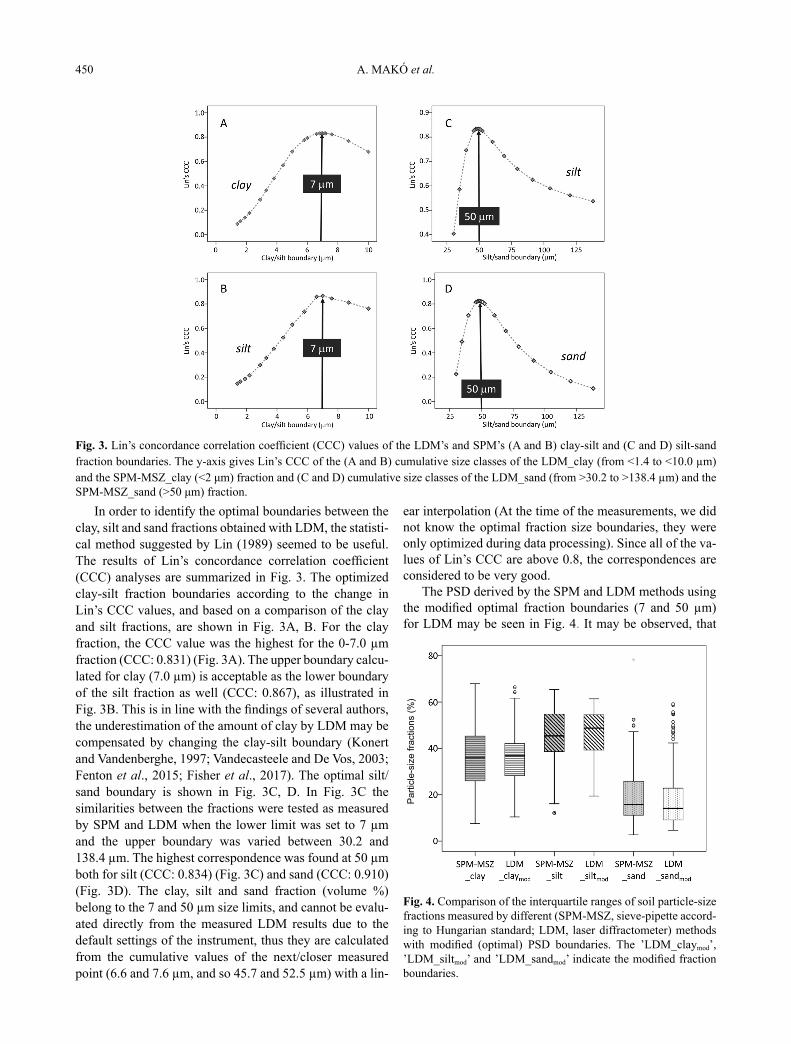
In order to identify the optimal boundaries between the clay, silt and sand fractions obtained with LDM, the statisti-cal method suggested by Lin (1989) seemed to be useful. The results of Lin’s concordance correlation coefficient (CCC) analyses are summarized in Fig. 3. The optimized clay-silt fraction boundaries according to the change in Lin’s CCC values, and based on a comparison of the clay and silt fractions, are shown in Fig. 3A, B. For the clay fraction, the CCC value was the highest for the 0-7.0 µm fraction (CCC: 0.831) (Fig. 3A). The upper boundary calcu-lated for clay (7.0 µm) is acceptable as the lower boundary of the silt fraction as well (CCC: 0.867), as illustrated in Fig. 3B. This is in line with the findings of several authors, the underestimation of the amount of clay by LDM may be compensated by changing the clay-silt boundary (Konert and Vandenberghe, 1997; Vandecasteele and De Vos, 2003; Fenton et al., 2015; Fisher et al., 2017). The optimal silt/sand boundary is shown in Fig. 3C, D. In Fig. 3C the similarities between the fractions were tested as measured by SPM and LDM when the lower limit was set to 7 µm and the upper boundary was varied between 30.2 and 138.4 µm. The highest correspondence was found at 50 µm both for silt (CCC: 0.834) (Fig. 3C) and sand (CCC: 0.910) (Fig. 3D). The clay, silt and sand fraction (volume %) belong to the 7 and 50 µm size limits, and cannot be evalu-ated directly from the measured LDM results due to the default settings of the instrument, thus they are calculated from the cumulative values of the next/closer measured point (6.6 and 7.6 µm, and so 45.7 and 52.5 µm) with a lin-
ear interpolation (At the time of the measurements, we did not know the optimal fraction size boundaries, they were only optimized during data processing). Since all of the va- lues of Lin’s CCC are above 0.8, the correspondences are considered to be very good.
The PSD derived by the SPM and LDM methods using the modified optimal fraction boundaries (7 and 50 µm) for LDM may be seen in Fig. 4. It may be observed, that
Fig. 3. Lin’s concordance correlation coefficient (CCC) values of the LDM’s and SPM’s (A and B) clay-silt and (C and D) silt-sand fraction boundaries. The y-axis gives Lin’s CCC of the (A and B) cumulative size classes of the LDM_clay (from <1.4 to <10.0 µm) and the SPM-MSZ_clay (<2 μm) fraction and (C and D) cumulative size classes of the LDM_sand (from >30.2 to >138.4 µm) and the SPM-MSZ_sand (>50 μm) fraction.
Fig. 4. Comparison of the interquartile ranges of soil particle-size fractions measured by different (SPM-MSZ, sieve-pipette accord-ing to Hungarian standard; LDM, laser diffractometer) methods with modified (optimal) PSD boundaries. The ’LDM_claymod’, ’LDM_siltmod’ and ’LDM_sandmod’ indicate the modified fraction boundaries.
Par
ticle
-siz
e fra
ctio
ns (%
)
EVALUATION OF SOIL TEXTURE DETERMINATION 451
the amounts of each fraction determined by the different methods are significantly more similar after the fraction boundary optimization than they were without boundary modification (Fig. 2).
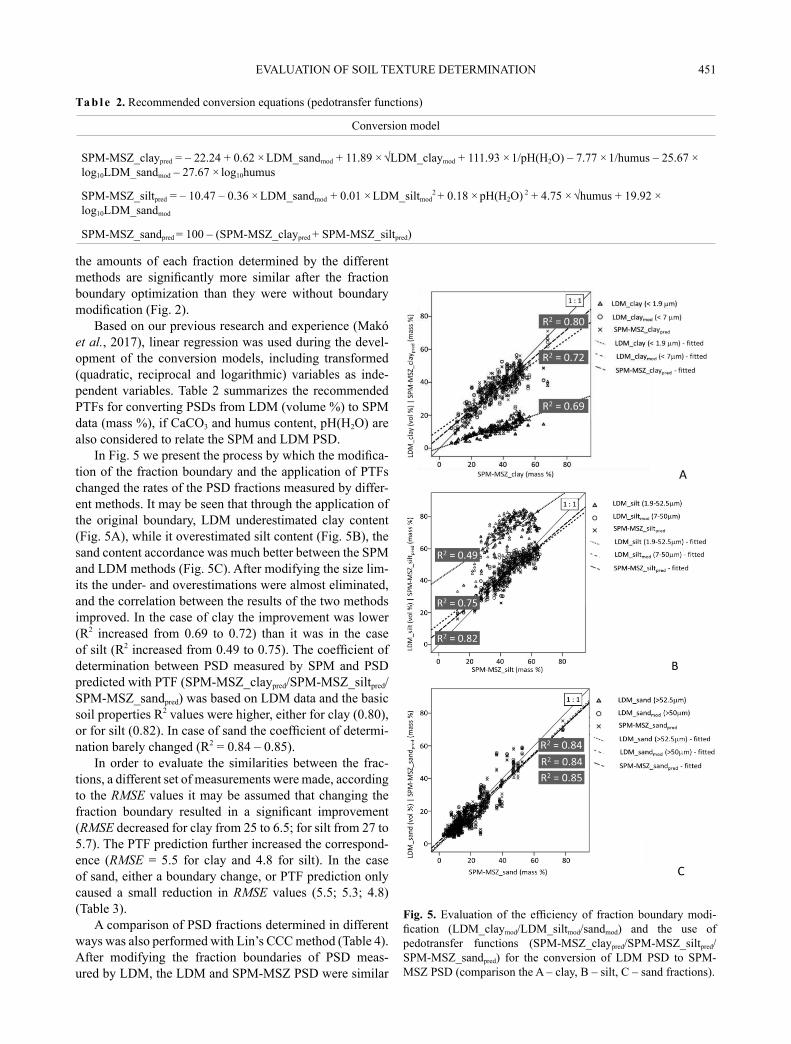
Based on our previous research and experience (Makó et al., 2017), linear regression was used during the devel-opment of the conversion models, including transformed (quadratic, reciprocal and logarithmic) variables as inde-pendent variables. Table 2 summarizes the recommended PTFs for converting PSDs from LDM (volume %) to SPM data (mass %), if CaCO3 and humus content, pH(H2O) are also considered to relate the SPM and LDM PSD.
In Fig. 5 we present the process by which the modifica-tion of the fraction boundary and the application of PTFs changed the rates of the PSD fractions measured by differ-ent methods. It may be seen that through the application of the original boundary, LDM underestimated clay content (Fig. 5A), while it overestimated silt content (Fig. 5B), the sand content accordance was much better between the SPM and LDM methods (Fig. 5C). After modifying the size lim-its the under- and overestimations were almost eliminated, and the correlation between the results of the two methods improved. In the case of clay the improvement was lower (R2 increased from 0.69 to 0.72) than it was in the case of silt (R2 increased from 0.49 to 0.75). The coefficient of determination between PSD measured by SPM and PSD predicted with PTF (SPM-MSZ_claypred/SPM-MSZ_siltpred/SPM-MSZ_sandpred) was based on LDM data and the basic soil properties R2 values were higher, either for clay (0.80), or for silt (0.82). In case of sand the coefficient of determi-nation barely changed (R2 = 0.84 – 0.85).
In order to evaluate the similarities between the frac-tions, a different set of measurements were made, according to the RMSE values it may be assumed that changing the fraction boundary resulted in a significant improvement (RMSE decreased for clay from 25 to 6.5; for silt from 27 to 5.7). The PTF prediction further increased the correspond-ence (RMSE = 5.5 for clay and 4.8 for silt). In the case of sand, either a boundary change, or PTF prediction only caused a small reduction in RMSE values (5.5; 5.3; 4.8) (Table 3).
A comparison of PSD fractions determined in different ways was also performed with Lin’s CCC method (Table 4). After modifying the fraction boundaries of PSD meas-ured by LDM, the LDM and SPM-MSZ PSD were similar
Fig. 5. Evaluation of the efficiency of fraction boundary modi-fication (LDM_claymod/LDM_siltmod/sandmod) and the use of pedotransfer functions (SPM-MSZ_claypred/SPM-MSZ_siltpred/SPM-MSZ_sandpred) for the conversion of LDM PSD to SPM-MSZ PSD (comparison the A – clay, B – silt, C – sand fractions).
Ta b l e 2. Recommended conversion equations (pedotransfer functions)
Conversion model
SPM-MSZ_claypred = – 22.24 + 0.62 × LDM_sandmod + 11.89 × √LDM_claymod + 111.93 × 1/pH(H2O) – 7.77 × 1/humus – 25.67 ×
log10LDM_sandmod – 27.67 × log10humus
SPM-MSZ_siltpred = – 10.47 – 0.36 × LDM_sandmod + 0.01 × LDM_siltmod2 + 0.18 × pH(H2O) 2 + 4.75 × √humus + 19.92 ×
log10LDM_sandmod
SPM-MSZ_sandpred = 100 – (SPM-MSZ_claypred + SPM-MSZ_siltpred)
A. MAKÓ et al.452
(Lin’s CCC increased for clay from 0.14 to 0.83; for silt from 0.19 to 0.85). When PTFs were also used to trans-form LDM PSD to SPM-MSZ PSD the similarity further improved (Lin’s CCC for clay: 0.89, for silt: 0.90, which means almost perfect agreement). There was no significant Lin’s CCC increase for the sand fraction.
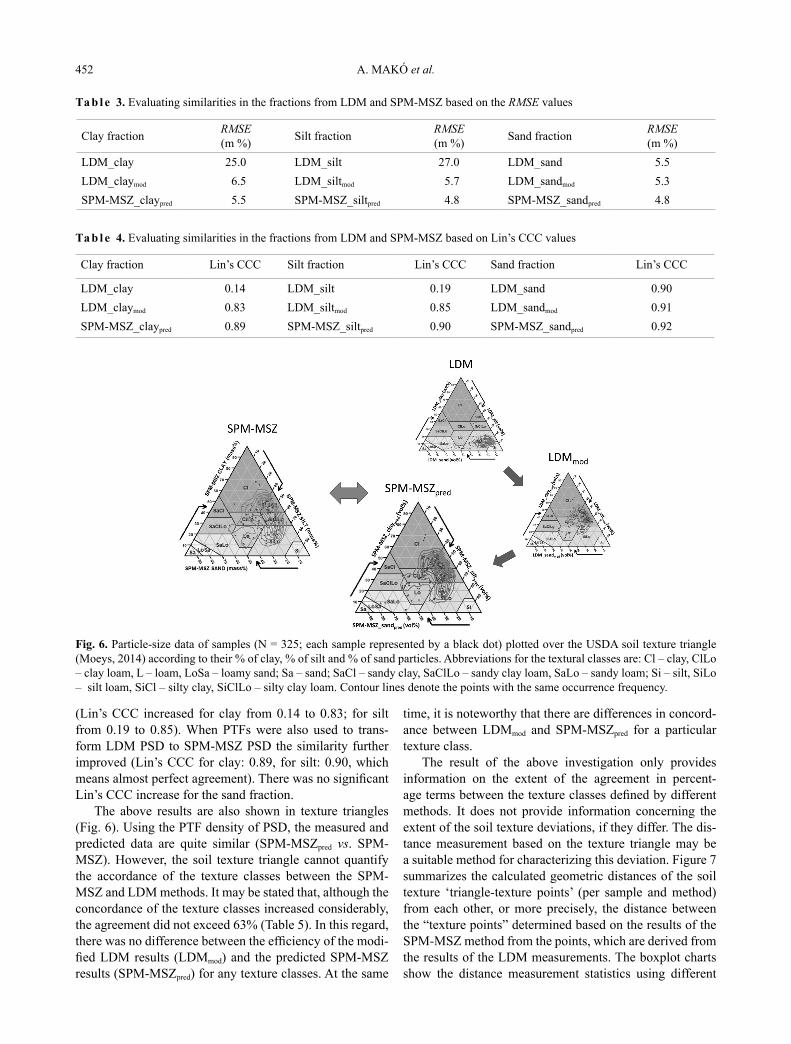
The above results are also shown in texture triangles (Fig. 6). Using the PTF density of PSD, the measured and predicted data are quite similar (SPM-MSZpred vs. SPM-MSZ). However, the soil texture triangle cannot quantify the accordance of the texture classes between the SPM-MSZ and LDM methods. It may be stated that, although the concordance of the texture classes increased considerably, the agreement did not exceed 63% (Table 5). In this regard, there was no difference between the efficiency of the modi-fied LDM results (LDMmod) and the predicted SPM-MSZ results (SPM-MSZpred) for any texture classes. At the same
time, it is noteworthy that there are differences in concord-ance between LDMmod and SPM-MSZpred for a particular texture class.
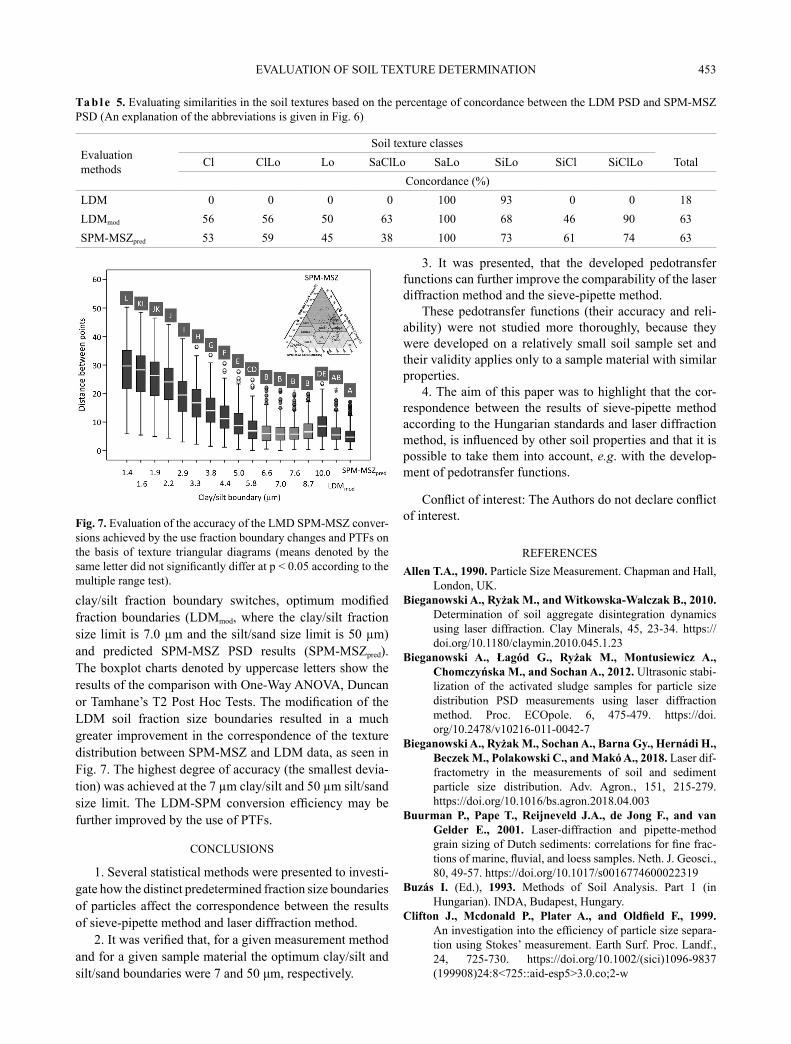
The result of the above investigation only provides information on the extent of the agreement in percent-age terms between the texture classes defined by different methods. It does not provide information concerning the extent of the soil texture deviations, if they differ. The dis-tance measurement based on the texture triangle may be a suitable method for characterizing this deviation. Figure 7 summarizes the calculated geometric distances of the soil texture ‘triangle-texture points’ (per sample and method) from each other, or more precisely, the distance between the “texture points” determined based on the results of the SPM-MSZ method from the points, which are derived from the results of the LDM measurements. The boxplot charts show the distance measurement statistics using different
Ta b l e 3. Evaluating similarities in the fractions from LDM and SPM-MSZ based on the RMSE values
Clay fraction RMSE(m %) Silt fraction RMSE
(m %) Sand fraction RMSE(m %)
LDM_clay 25.0 LDM_silt 27.0 LDM_sand 5.5LDM_claymod 6.5 LDM_siltmod 5.7 LDM_sandmod 5.3SPM-MSZ_claypred 5.5 SPM-MSZ_siltpred 4.8 SPM-MSZ_sandpred 4.8
Ta b l e 4. Evaluating similarities in the fractions from LDM and SPM-MSZ based on Lin’s CCC values
Clay fraction Lin’s CCC Silt fraction Lin’s CCC Sand fraction Lin’s CCC
LDM_clay 0.14 LDM_silt 0.19 LDM_sand 0.90LDM_claymod 0.83 LDM_siltmod 0.85 LDM_sandmod 0.91SPM-MSZ_claypred 0.89 SPM-MSZ_siltpred 0.90 SPM-MSZ_sandpred 0.92
Fig. 6. Particle-size data of samples (N = 325; each sample represented by a black dot) plotted over the USDA soil texture triangle (Moeys, 2014) according to their % of clay, % of silt and % of sand particles. Abbreviations for the textural classes are: Cl – clay, ClLo – clay loam, L – loam, LoSa – loamy sand; Sa – sand; SaCl – sandy clay, SaClLo – sandy clay loam, SaLo – sandy loam; Si – silt, SiLo – silt loam, SiCl – silty clay, SiClLo – silty clay loam. Contour lines denote the points with the same occurrence frequency.
EVALUATION OF SOIL TEXTURE DETERMINATION 453
clay/silt fraction boundary switches, optimum modified fraction boundaries (LDMmod, where the clay/silt fraction size limit is 7.0 µm and the silt/sand size limit is 50 µm) and predicted SPM-MSZ PSD results (SPM-MSZpred). The boxplot charts denoted by uppercase letters show the results of the comparison with One-Way ANOVA, Duncan or Tamhane’s T2 Post Hoc Tests. The modification of the LDM soil fraction size boundaries resulted in a much greater improvement in the correspondence of the texture distribution between SPM-MSZ and LDM data, as seen in Fig. 7. The highest degree of accuracy (the smallest devia-tion) was achieved at the 7 µm clay/silt and 50 µm silt/sand size limit. The LDM-SPM conversion efficiency may be further improved by the use of PTFs.
CONCLUSIONS
1. Several statistical methods were presented to investi-gate how the distinct predetermined fraction size boundaries of particles affect the correspondence between the results of sieve-pipette method and laser diffraction method.
2. It was verified that, for a given measurement method and for a given sample material the optimum clay/silt and silt/sand boundaries were 7 and 50 μm, respectively.
3. It was presented, that the developed pedotransfer functions can further improve the comparability of the laser diffraction method and the sieve-pipette method.
These pedotransfer functions (their accuracy and reli-ability) were not studied more thoroughly, because they were developed on a relatively small soil sample set and their validity applies only to a sample material with similar properties.
4. The aim of this paper was to highlight that the cor-respondence between the results of sieve-pipette method according to the Hungarian standards and laser diffraction method, is influenced by other soil properties and that it is possible to take them into account, e.g. with the develop-ment of pedotransfer functions.
Conflict of interest: The Authors do not declare conflict of interest.
REFERENCESAllen T.A., 1990. Particle Size Measurement. Chapman and Hall,
London, UK. Bieganowski A., Ryżak M., and Witkowska-Walczak B., 2010.
Determination of soil aggregate disintegration dynamics using laser diffraction. Clay Minerals, 45, 23-34. https://doi.org/10.1180/claymin.2010.045.1.23
Bieganowski A., Łagód G., Ryżak M., Montusiewicz A., Chomczyńska M., and Sochan A., 2012. Ultrasonic stabi-lization of the activated sludge samples for particle size distribution PSD measurements using laser diffraction method. Proc. ECOpole. 6, 475-479. https://doi.org/10.2478/v10216-011-0042-7
Bieganowski A., Ryżak M., Sochan A., Barna Gy., Hernádi H., Beczek M., Polakowski C., and Makó A., 2018. Laser dif-fractometry in the measurements of soil and sediment particle size distribution. Adv. Agron., 151, 215-279. https://doi.org/10.1016/bs.agron.2018.04.003
Buurman P., Pape T., Reijneveld J.A., de Jong F., and van Gelder E., 2001. Laser-diffraction and pipette-method grain sizing of Dutch sediments: correlations for fine frac-tions of marine, fluvial, and loess samples. Neth. J. Geosci., 80, 49-57. https://doi.org/10.1017/s0016774600022319
Buzás I. (Ed.), 1993. Methods of Soil Analysis. Part 1 (in Hungarian). INDA, Budapest, Hungary.
Clifton J., Mcdonald P., Plater A., and Oldfield F., 1999. An investigation into the efficiency of particle size separa-tion using Stokes’ measurement. Earth Surf. Proc. Landf., 24, 725-730. https://doi.org/10.1002/(sici)1096-9837 (199908)24:8<725::aid-esp5>3.0.co;2-w
Ta b l e 5. Evaluating similarities in the soil textures based on the percentage of concordance between the LDM PSD and SPM-MSZ PSD (An explanation of the abbreviations is given in Fig. 6)
Evaluation methods
Soil texture classesTotal Cl ClLo Lo SaClLo SaLo SiLo SiCl SiClLo
Concordance (%)LDM 0 0 0 0 100 93 0 0 18LDMmod 56 56 50 63 100 68 46 90 63SPM-MSZpred 53 59 45 38 100 73 61 74 63
Fig. 7. Evaluation of the accuracy of the LMD SPM-MSZ conver-sions achieved by the use fraction boundary changes and PTFs on the basis of texture triangular diagrams (means denoted by the same letter did not significantly differ at p < 0.05 according to the multiple range test).
A. MAKÓ et al.454
de Boer G.B.J., de Weerd C., Thoenes D., and Goossens H.W.J., 1987. Laser diffraction spectrometry: Fraunhofer diffraction versus Mie scattering. Part. Part. Syst. Charact., 4, 14-19. https://doi.org/10.1002/ppsc.19870040104
Di Stefano C., Ferro V., and Mirabile S., 2010. Comparison between grain-size analyses using laser diffraction and sedi- mentation methods. Biosyst. Eng., 106, 205-215. https://doi.org/10.1016/j.biosystemseng.2010.03.013
Fedotov G.N., Shein E.V., Putlyaev V.I., Arkhangel’skaya T.A., Eliseev A.V., and Milanovskii E.Y., 2007. Physicochemical bases of differences between the sedimen-tometric and laser-diffraction techniques of soil particle-size analysis. Eurasian Soil Sci., 40, 281-288. https://doi.org/10.1134/s1064229307030064
Fenton O., Vero S., Ibrahim T.G., Murphy P.N.C., Sherriff S.C., and Huallacháin D.Ó., 2015. Consequences of using different soil texture determination methodologies for soil physical quality and unsaturated zone time lag estimates. J. Contam. Hydrol., 182, 16-24.https://doi.org/10.1016/j.jconhyd.2015.07.004
Fisher P., Aumann C., Chia K., Halloran N.O., and Chandra S., 2017. Adequacy of laser diffraction for soil particle size analysis. PLoS ONE, 12(5): e0176510.https://doi.org/10.1371/journal.pone.0176510
Gee G.W. and Bauder J.W., 1986. Particle-Size Analysis. In: Methods of soil analysis. Part 1. Physical and mineralogical methods (Ed. A. Klute). American Society of Agronomy, Madison, WI, USA. https://doi.org/10.2136/sssabooks-er5.1.2ed.c15
International Organization for Standardization, 2009. ISO 11277: Soil quality – determination of particle size distribution in mineral soil material – Method by sieving and sedimenta-tion. https://doi.org/10.3403/30202674
International Organization for Standardization, 2009. ISO 13320: Particle size analysis – Laser diffraction methods.
Kerry R., Rawlins B.G., Olivier M.A., and Lacinska A.M., 2009. Problems with determining the particle size distribu-tion of chalk soil and some of their implications. Geoderma, 152, 324-337. https://doi.org/10.1016/j.geoderma.2009.06.018
Konert M. and Vandenberghe J., 1997. Comparison of laser grain size analysis with pipette and sieve analysis: a solu-tion for the underestimation of the clay fraction. Sedimen- tology, 44, 523-535.https://doi.org/10.1046/j.1365-3091.1997.d01-38.x
Lin L., 1989. A concordance correlation coefficient to evaluate reproducibility. Biometrics, 45, 255-268.https://doi.org/10.2307/2532051
Madarász B., Jakab G., Szalai Z., and Juhos K., 2012. Examination of sample preparation methods for the laser grain size analysis of soils with high organic matter content. Agrokem Talajtan, 61, 381-398.https://doi.org/10.1556/agrokem.60.2012.2.11
Makó A., Tóth G., Weynants M., Rajkai K., Hermann T., and Tóth B., 2017. Pedotransfer functions for converting laser diffraction particle-size data to conventional values. Eur. J. Soil Sci., 68, 769-782. https://doi.org/10.1111/ejss.12456
Malvern Operators Guide, 1999. Malvern Instruments Ltd., Malvern, UK.
Miller B.A. and Schaetzl R.J., 2011. Precision of soil particle size analysis using laser diffractometry. Soil Sci. Soc. Am. J., 76, 1719-1727. https://doi.org/10.2136/sssaj2011.0303
Moeys J., 2014. The soil texture wizard: R functions for plotting, classifying, transforming and exploring soil texture data. http://cran.r-project.org/web/packages/soiltexture/vignettes/soiltexture_vignette.pdf
MSZ-08.0205:1978. Investigation of hydrophysical properties of soils (in Hungarian). Budapest, Hungary.
Orzechowski M., Smólczyński S., Długosz J., and Poźniak P., 2014. Measurements of texture of soils formed from glaci-olimnic sediments by areometric method, pipette method and laser diffraction method. Soil Sci. Ann., 65, 72-79. https://doi.org/10.2478/ssa-2014-0011
Pabst W., Kunes K., Havrda J., and Gregorová E., 2000. A note on particle size analyses of kaolins and clays. J. Eur. Ceram. Soc., 20, 1429-1437.https://doi.org/10.1016/s0955-2219(00)00016-9
Polakowski C., Sochan A., Bieganowski A., Ryżak M., Földényi R., and Tóth J., 2014. Influence of the sand par-ticle shape on particle size distribution measured by laser diffraction method. Int. Agrophys., 28, 195-200.https://doi.org/10.2478/intag-2014-0008
R Core Team, 2013. R: A language and environment for statistical computing. R Foundation for Statistical Computing, Vienna, Austria. URL http://www.R-project.org/
Ryżak M. and Bieganowski A., 2010. Determination of particle size distribution of soil using laser diffraction – comparison with areometric method. Int. Agrophys., 24, 177-181.
Ryżak M. and Bieganowski A., 2011. Methodological aspects of determining soil particle-size distribution using the laser diffraction method. J. Plant Nutr. Soil Sci., 174, 624-633.https://doi.org/10.1002/jpln.201000255
Sitzia L., Bertran P., Sima A., Chery P., Queffelec A., and Rousseau D.D., 2017. Dynamics and sources of last glacial aeolian deposition in southwest France derived from dune patterns, grain-size gradients and geochemistry, and recon-struction of efficient wind directions. Quat. Sci. Rev., 170, 250-268. https://doi.org/10.1016/j.quascirev.2017.06.029
Sochan A., Bieganowski A., Ryżak M., Dobrowolski R., and Bartmiński P., 2012. Comparison of soil texture deter-mined by two dispersion units of Mastersizer 2000. Int. Agrophys., 26, 99-102.https://doi.org/10.2478/v10247-012-0015-9
SPSS, 2004. SPSS for Windows, Version 13.0. SPSS Inc. Chicago, IL, USA.
Vandecasteele B. and De Vos B., 2003. Relationship between soil textural fractions determined by the sieve-pipette meth-od and laser diffractometry. IBW Bb R 2003.010.
Venables W.N. and Ripley B.D., 2002 (Eds). Modern Applied Statistics with S. Springer Science + Business Media, New York, USA.
Yang X., Zhang Q., Li X., Jia X., Wei X., and Shao M., 2015. Determination of soil texture by laser diffraction method. Soil Sci. Soc. Am. J., 79, 1556-1566.https://doi.org/10.2136/sssaj2015.04.0164