case study: soil water express modelling - … · case study: soil water express modelling ... give...
TRANSCRIPT

Case Study:
Soil Water Express ModellingIntroduction In 2015, the Coomandook Agricultural Bureau (the Bureau) successfully obtained a grant from South Australian Murray-Darling
Basin Natural Resources Management (SAMDB NRM) Board.
The grant enabled the group to better understand four of the Coomandook districts predominant soil types by investing in
research and development on local soils. Soil Water Express (SWE) modelling was identified as a tool to do this. The model
took into account the selected soils texture class and chemical attributes. From this data, it simulated the unconstrained and
constrained plant available water capacity (PAWC) for each soil type. This case study outlines the processes the Bureau took to
have confidence in the simulations being accurate, using existing results they obtained.
Background
South Australian Murray-Darling Basin Natural Resources Management Board granted money to the Bureau to build knowledge and
capacity around the regions soils. The Bureau felt their soils were unique to the region and production capability was being
limited through constraints, with successful production increases seen by growers in other regions from current and innovative
techniques, not being achieved locally.
The Bureau and Natural Resources SAMDB Sustainable Farming team worked together on targeted projects to increase the
knowledge around four predominant soil types;
brown loam over calcrete rubble
sandy loam over deep sand with some calcareous sandy clay and rubble below 40 centimetres
deep grey loam over calcrete rubble
deep sand.
A consultant was engaged to carry out; soil testing, excavate four soil pits and characterise the soil type and report against the
challenges and barriers to production.
Natural Resources SAMDB increased its weather station and soil moisture monitoring network. A weather station was
established at Sherlock, and four soil moisture probes installed on the targeted soils at Moorlands and Coomandook. The
Coorong Tatiara Local Action Planning committee produced the Coomandook Compendium on the regions past and present
agricultural studies, trials and research.
The Coomandook Agricultural Bureau elected to use SWE with funds provided by the SAMDB NRM Board grant. Previous soil
testing had provided the Bureau soil testing results which was believed could be used with the SWE simulator.
Links to the weather station and soil moisture monitoring networks, and Coomandook compendium can be found in ‘Links’.
Method Soil Water Express required the physical and chemical parameters of the soil to be entered, to run the simulations. Simulations
give insight to soil water availability throughout the root zone. Soil testing was conducted to a depth of 90 cm and split
between 7 depth zones (0-10cm, 10-20cm, 20-30cm, 30-40cm, 40-50cm, 50-70cm and 70-90cm).
Physical soil parameters required;
soil texture class and the makeup of sand, silt and clay percentage
estimated rock percentage
bulk density. (Can increase the accuracy of the simulation however due to difficulty of measuring bulk density in the
field, the model automatically adjusts for this based on the identified texture class).

Chemical soil parameters required;
estimated sodium percentage (ESP)
electrical conductivity (EC)
chloride content (Cl)
boron content (B).
The physical and chemical parameters were entered into the model to obtain a simulation of constrained and unconstrained
plant available water (PAW). Unconstrained PAW allows plant access to 100% of the PAW in the soil whereas constrained PAW
shows limited PAW due to chemical and/or physical barriers. Constraining barriers could be high salt or boron levels or large
percentages of rock within the soil. Click the link to view Soil Water Express.
Discussion In March 2015, soil testing was conducted and
samples bulked and sent for hand texturing to
determine soil texture class and chemical analysis,
occurring as part of the soil moisture probe
installations. This initial data was used to populate
the model. Hand texturing was completed and the
identified texture class compared to a soils texture
triangle (figure 1). It was thought that this would
guide the amount of sand, silt and clay percentages
of the soil. Rock percentage was estimated during
the hand texturing process.
Chemical analysis results were populated into the
chemical fields section of the simulator. Fields
required were exchangeable sodium percentage
(ESP), electrical conductivity (EC), Chloride (Cl) and
Boron (B). Chemical data fields were available for six
of the seven zones between 10-90cm, however the
analysis did not provide ESP, Cl or B for the 0-10cm
zone. The missing data values were derived from the
10-20cm zone to complete the 0-10cm chemical data fields. EC was available for all seven zones.
Figure 1 – Australian texture triangle
Coomandook Ag Bureau members attending the soil pit day held April 2015

Figure 2 shows the first simulation produced with the results previously obtained by the Bureau. It was quickly recognised that
the simulated texture classes specified by SWE (figure 3) did not match hand texturing results as a different texture classing
system had been used. Whilst simulated texture classes were similar, more investigation went into how to better match hand
texturing results and the model texture classes leading to an increase in accurate results. Soil Water Express designers were
contacted to define soil particle size composition percentages set for each texture class. The belief was a better understanding
of texture class boundaries in SWE would allow more accurate matching of hand texturing results compared to simulated texture
classes.
Key points seen in the first simulation (figure 2);
Plant available water capacity (PAWC) of 51mm approximately
56% of the unconstrained PAWC of 90mm.
Trend lines of constrained and unconstrained crop lower limits
(CLL) or crop wilting point and Drained Upper Limits (DUL) or
field capacity are shown in the graph.
PAWC, otherwise known as the bucket, is the area between the
CLL and DUL. Constrained PAWC (solid line) soil profile
summary shows a higher PAWC in the top 0-30cm of the profile,
reducing as you move deeper in the profile. This is reflected in a
narrowing of the CLL and DUL between 35-80cm. Higher rock
percentage content of the soil is mainly responsible for this
narrowing.
Unconstrained PAWC (dashed line) mirrors the constrained PAWC in the top 0-30cm of soil profile due to the limited
constraints. 30-90cm unconstrained PAWC deviates greatly from constrained PAWC. Mostly, PAWC is constrained at
depth and if constraints could be reduced, this would increase the plants ability to access water.
Average water available per cm of soil is 0.6mm/cm for this simulation.
Depth Zone Hand Texture Class
0-10cm Loam
10-20cm Clay Loam
20-30cm Clay Loam
30-40cm Loam
40-50cm Clay Loam
50-70cm Clay Loam
70-90cm Clay Loam
Figure 2 – Coomandook Flat Initial Soil Water Express simulation Version 1
Figure 3 – Coomandook Flat Hand Texture
Class
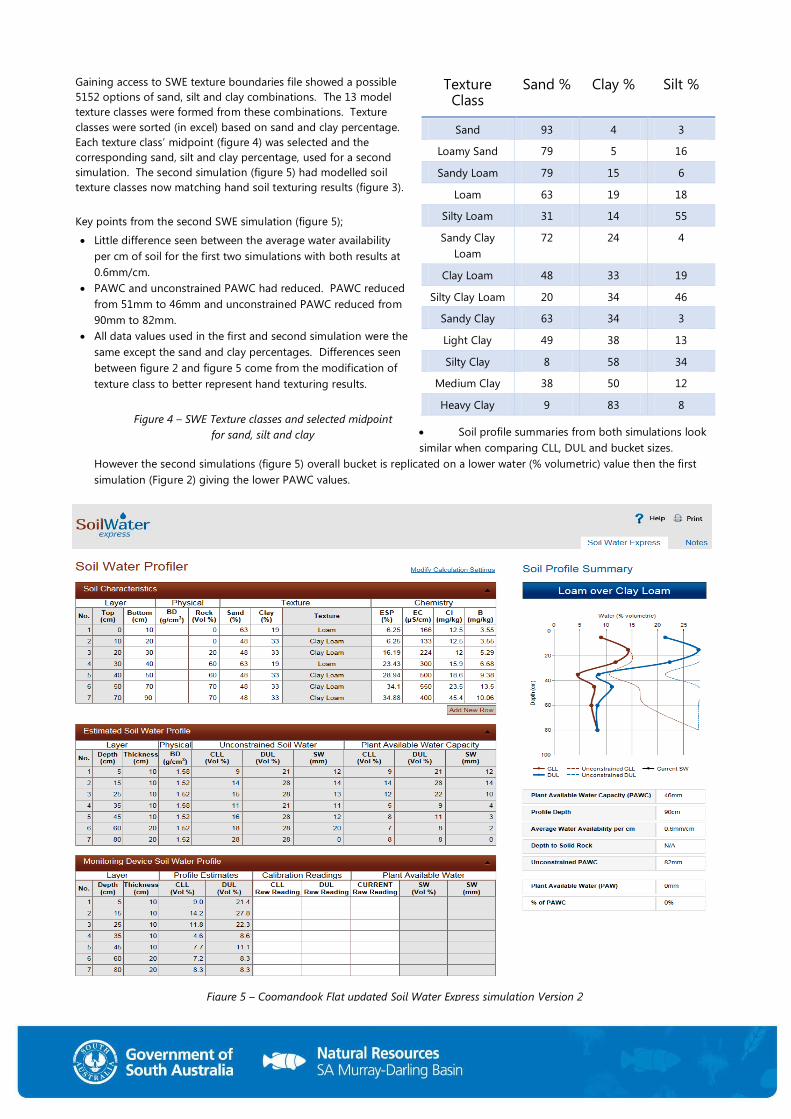
Gaining access to SWE texture boundaries file showed a possible
5152 options of sand, silt and clay combinations. The 13 model
texture classes were formed from these combinations. Texture
classes were sorted (in excel) based on sand and clay percentage.
Each texture class’ midpoint (figure 4) was selected and the
corresponding sand, silt and clay percentage, used for a second
simulation. The second simulation (figure 5) had modelled soil
texture classes now matching hand soil texturing results (figure 3).
Key points from the second SWE simulation (figure 5);
Little difference seen between the average water availability
per cm of soil for the first two simulations with both results at
0.6mm/cm.
PAWC and unconstrained PAWC had reduced. PAWC reduced
from 51mm to 46mm and unconstrained PAWC reduced from
90mm to 82mm.
All data values used in the first and second simulation were the
same except the sand and clay percentages. Differences seen
between figure 2 and figure 5 come from the modification of
texture class to better represent hand texturing results.
Soil profile summaries from both simulations look
similar when comparing CLL, DUL and bucket sizes.
However the second simulations (figure 5) overall bucket is replicated on a lower water (% volumetric) value then the first
simulation (Figure 2) giving the lower PAWC values.
Texture Class
Sand % Clay % Silt %
Sand 93 4 3
Loamy Sand 79 5 16
Sandy Loam 79 15 6
Loam 63 19 18
Silty Loam 31 14 55
Sandy Clay
Loam
72 24 4
Clay Loam 48 33 19
Silty Clay Loam 20 34 46
Sandy Clay 63 34 3
Light Clay 49 38 13
Silty Clay 8 58 34
Medium Clay 38 50 12
Heavy Clay 9 83 8
Figure 4 – SWE Texture classes and selected midpoint
for sand, silt and clay
Figure 5 – Coomandook Flat updated Soil Water Express simulation Version 2

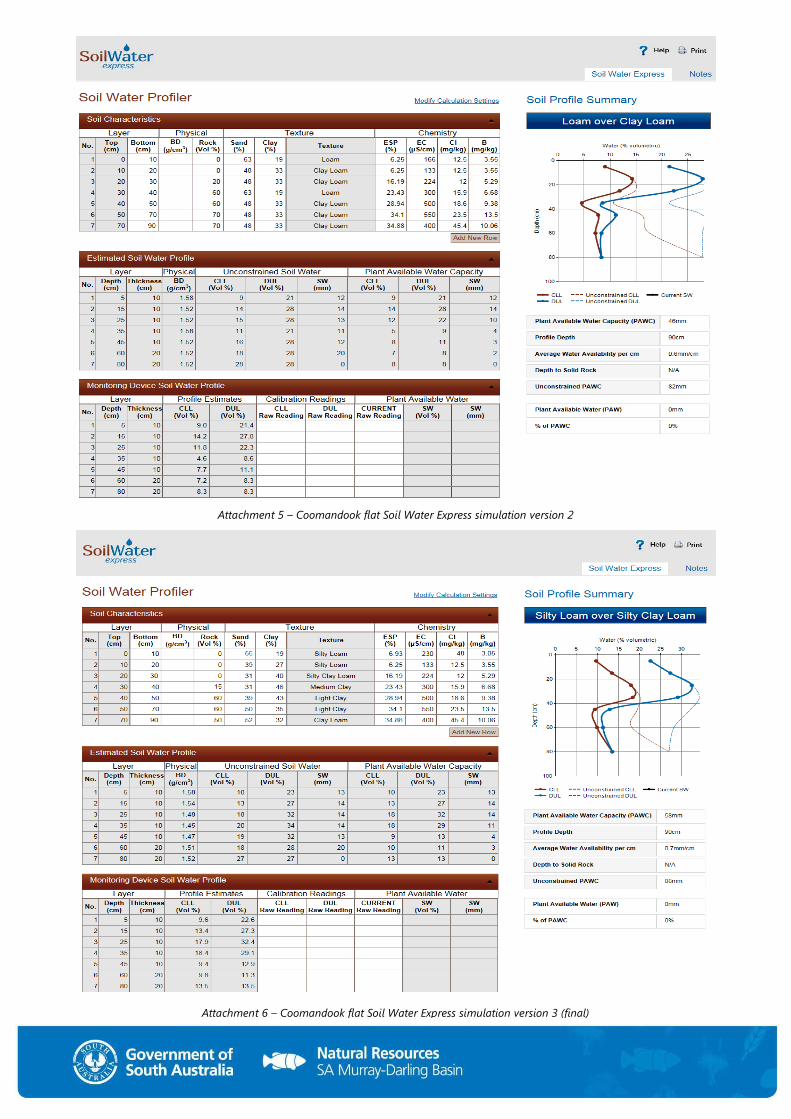
Similarities were seen in the first two results, however there was enough difference to doubt which simulation was the most
accurate. The Bureau began to understand sand and clay percentages were two very important drivers of SWE. To date
investigation has been based on retro fitting existing results to a model which required precise information. Results were
reviewed to establish the accuracy of the data parameters used and a plan to re-test the inaccurate components.
The review showed the physical soil components were based around estimations and open to human error. To increase
accuracy, additional soil samples were taken from all sites, at each of the seven depth zones. Samples were sent for particle size
analysis (PSA). This process sieves the soil into sand, silt and clay particles and measures their percentages based on the overall
sample weight. Chemical analysis and PSA was tested on the 0 – 10cm zone as these were not previously available for this
depth zone. The two sets of soil tests were merged to populate the model and to run a third simulation using the PSA as the
basis for soil texture determination.
Key points seen in the third SWE simulation (figure 6);
Increase in both PAWC to 58mm and average water availability per cm of soil to 0.7mm/cm.
PAWC in the third simulation was 13 – 26% greater than the first and second simulation. This is considered a large
difference in a non-irrigated farming system.
Unconstrained PAWC was at 88mm, a similar value to the first (figure 2 – 90mm) and second (figure 5 – 82mm)
simulation.
Unconstrained PAWC was 34% larger than constrained PAWC and reflected in the soil profile summary graph.
The model’s chemical thresholds had ESP values greater than 15%, considered a constraint. As such, ESP levels at 20-30cm
could start to limit crop production, becoming constrained at depths of 30cm and below. This in conjunction with an increase in
rock percentage is responsible for narrowing PAWC.
To build accuracy and confidence into the models simulated results, the Bureau had created 3 different simulations. Each
simulation used more accurate data to produce results. By building confidence in the model through more detailed and
accurate testing, costs linked to extra soil testing resulted in increased expenses.
Figure 6 – Coomandook Flat Soil Water Express simulation Version 3

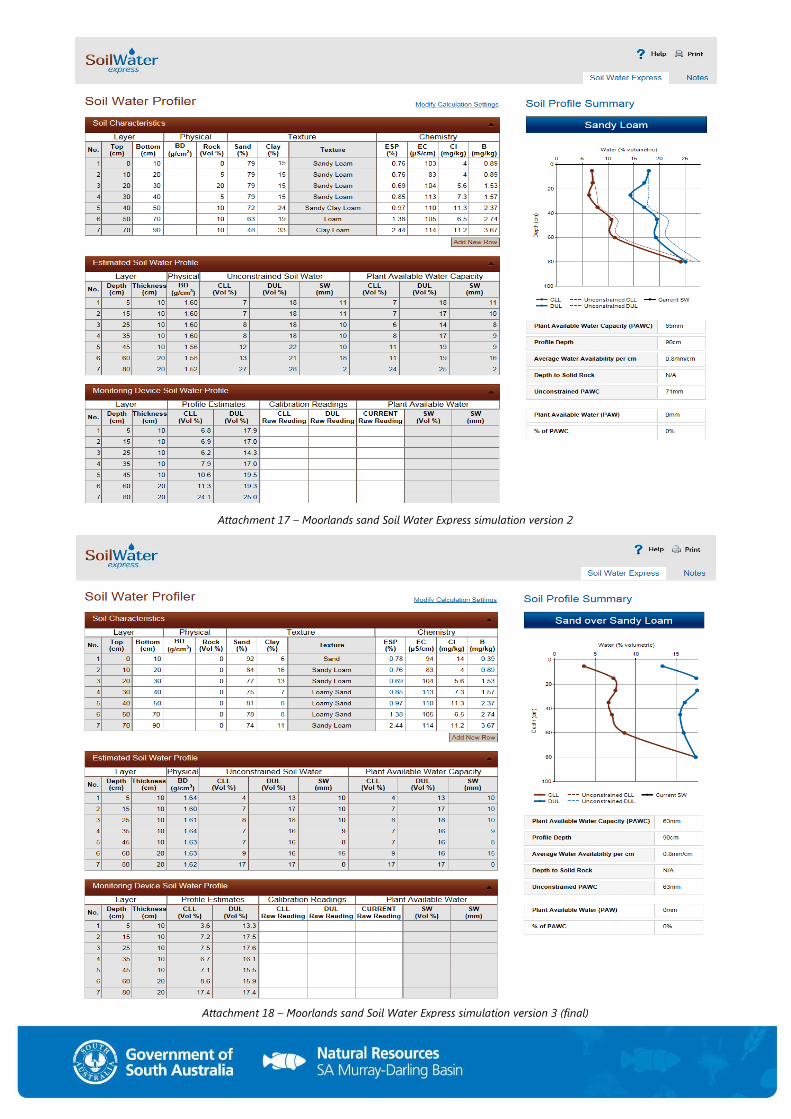
Results Soil Water Express simulations were run for each of the four predominant soil types and in each case, the final simulation which
incorporated PSA into the results gave vastly different PAWC compared to the first two. On the higher clay content (flats) soil
types, variations could be seen between PAWC, unconstrained PAWC and average water availability per cm of soil for the third
SWE simulation including PSA (attachment 4 & 10).
The sandier soil type profile summary graphs displaying PAWC also varied in the third simulation compared to the first and
second, however this was not as larger change as seen in the higher clay content (flats) soils. Values of PAWC, unconstrained
PAWC and average water availability per cm did not vary as greatly also for the sandier soil types as had been the case for the
flats (attachment 7 & 13).
Each site was tested to 90cm deep and seven zones segregated from this depth. At the time of sampling, soil testing cost the
Bureau $410 per site. The Bureau used some soil test results obtained earlier in the year, reducing the overall cost. If previous
soil tests were unavailable, each site would cost approximately $750 for soil analysis. Contractor fees and soil sampling trailer
costs could increase testing of each site. Overall cost per site could be lowered if the amount of soil depth zones were reduced.
Four to five zones could offer similar results and be more cost effective. An opportunity exists for testing the parameters in
addition to soil testing activities performed on farm throughout the year as a cost saving measure.
The use of SWE increased the knowledge base of the Bureau’s growers by giving a better understanding of the investigated soils
total water holding capacities, and constraints on plant available water moving deeper through the profile. Confidence was
increased in making seasonal decisions on post nitrogen fertiliser application rates, heavily dependent on soil moisture and
potential yield benefit. The simulations highlighted where the crops roots will be concentrated throughout the season and
potential effects of wet or dry springs.
Conclusion
Soil Water Express was suggested to the Coomandook Ag Bureau as a tool in which to better understand a soils water holding
capacity and limitations. The Bureau felt its use could add value to the investigation of four of the regions soil types undertaken
in 2015. The initial soil testing parameters the Bureau obtained did not meet the SWE requirements and testing parameters to
ensure accurate and reliable results gained.
Particularly in this scenario but with other opportunities to better understand the effects chemical and physical barriers have on
production, it is important to have a clear understanding of;
what you wish to test for or discover prior to undertaking the testing
which model, simulator or tool will enable you to do this
the benefits this tool will bring as well as time spent understanding the limitations or challenges
what specific testing parameters are needed by the tool to obtain accurate and reliable results.
Producers or groups using soil testing to guide decisions throughout the crop growing season should consider using SWE as a
tool to understand a particular soils potential water holding capacity as influenced by chemical and physical constraints. It
should be used in conjunction with other available simulators. Soil testing is an expense to producers and can be costly to
undertake. A farmer can add value to soil tests by using one set of data to populate multiple reliable simulators. Often these
simulators are at low or minimal cost to the producer. It is important to identify early each tool to ensure one set of soil tests
can be used for multiple models. This ensures testing will capture all data required so that one round of soil test results can be
used in multiple models. Time must be spent to accurately understand parameters required before undertaking testing. This
provides opportunity to specify extra testing measurements that might be required from the laboratory to meet the needs of the
simulator. Using several tools to aid in decisions will increase the ability of the producer to learn more about production
challenges and influences, helping them plan for and reduce risk.
After investigating how to build accuracy in the results obtained by SWE, the Coomandook Ag Bureau benefited from the
simulations. Soil Water Express highlighted to the group some limitations in the soils which cannot be changed easily, and
demonstrated how a producing crop would interact with this soil type. Producers can use this knowledge to make beneficial
management decisions aiding in crop establishment and crop production.

Links & Abbreviations Natural Resources SAMDB soil moisture network – http://aqualab-data.dyndns.info/secure/livedata/list.jsf?template=trend
Natural Resources SAMDB weather station network –
http://aws.naturalresources.sa.gov.au/samurraydarlingbasin/
Coomandook Compendium –
https://www.coorong.sa.gov.au/coomandook
Soil Water Express – www.apsim.info/swe/Default.aspx
PAW – Plant Available Water
ESP – Estimated Sodium Percentage
EC – Electrical Conductivity
Cl - Chloride
B - Boron
NR SAMDB – Natural Resources South Australian Murray-
Darling Basin
PAWC – Plant Available Water Capacity
The Bureau – Coomandook Agricultural Bureau
PSA – Particle Size Analysis
SWE – Soil Water Express
Coomandook agricultural members discussing the sandy soil
profile at Coomandook
Brown loam over calcrete rubble soil pit at Moorlands

Acknowledgments
This project is supported by the Coomandook Agricultural Bureau and the South Australian Murray-Darling Basin Natural
Resources Management Board through funding from the Australian Government’s National Landcare Program.
Attachments
Attachment 1 – Cookes Plain Soil Testing Results
Attachment 2 – Cookes Plain SWE simulation final
Attachment 3 – Coomandook Flat Soil Testing Results
Attachment 4 – Coomandook Flat SWE simulation Version 1
Attachment 5 – Coomandook Flat SWE simulation Version 2
Attachment 6 – Coomandook Flat SWE simulation Version 3
Attachment 7 – Coomandook Sand Soil Testing Results
Attachment 8 – Coomandook Sand SWE simulation Version 1
Attachment 9 – Coomandook Sand SWE simulation Version 2
Attachment 10 – Coomandook Sand SWE simulation Version 3
Copyright
This work is copyright. Apart from any use permitted under the Copyright
Act 1968 (Cwlth), no part may be reproduced by any process without prior
written permission from the South Australian Murray-Darling Basin Natural
Resources Management Board. Requests and enquiries concerning
reproduction and rights should be directed to the Regional Manager,
Natural Resources SA Murray-Darling Basin, PO Box 2343, Murray Bridge SA
5253.
Disclaimer statement:
The South Australian Murray-Darling Basin Natural Resources Management
Board and the Government of South Australia, their employees and their
servants do not warrant, or make any representation, regarding the use or
results of the information contain herein as to its correctness, accuracy,
currency or otherwise. The South Australian Murray-Darling Basin Natural
Resources Management Board and the Government of South Australia,
their employees and their servants expressly disclaim all liability or
responsibility to any person using the information or advice herein
Attachment 10 – Coomandook Sand SWE simulation Version 3
Attachment 11 – Moorlands Flat Soil Testing Results
Attachment 12 – Moorlands Flat SWE simulation Version 1
Attachment 13 – Moorlands Flat SWE simulation Version 2
Attachment 14 – Moorlands Flat SWE simulation Version 3
Attachment 15 – Moorlands Sand SWE Soil Testing Results
Attachment 16 – Moorlands Sand SWE simulation Version 1
Attachment 17 – Moorlands Sand SWE simulation Version 2
Attachment 18 – Moorlands Sand SWE simulation Version 3
For more information Mark May
Sustainable Farming Project Officer
Natural Resources Centre
2 Wade St Berri SA 5343
P (08) 8580 1800
www.naturalresources.sa.gov.au/samurraydarlingbasin

Parameters UNIT
COOKES PLAINS
WHEAT 0-10
COOKES PLAINS
WHEAT 10-20
COOKES PLAINS
WHEAT 20-30
COOKES PLAINS
WHEAT 30-40
COOKES PLAINS
WHEAT 40-50
COOKES PLAINS
WHEAT 50-70
COOKES PLAINS
WHEAT 70-90
pH Water 7.53 7.79 8.35 8.46 8.55 8.55 8.85
pH CaCl 6.97 7.20 7.68 7.75 7.97 7.92 8.04
EC 1:5 uS/cm 0.07 0.05 0.06 0.06 0.08 0.13 0.14
Exchangable Ca c.mol/kg 4.30 2.67 2.27 2.86 6.03 23.26 24.62
Exchangable Mg c.mol/kg 0.70 0.49 0.47 0.55 1.19 4.01 3.83
Exchangable K c.mol/kg 0.18 0.21 0.22 0.18 0.28 1.06 0.53
Exchangable Na c.mol/kg 0.08 0.06 0.05 0.06 0.12 0.43 0.48 Exchangable Na (ESP) % 1.46 1.65 1.70 1.70 1.58 1.49 1.63
eCEC c.mol/kg 5.26 3.43 3.01 3.66 7.61 28.76 29.47
B mg/kg 0.32 0.17 0.15 0.19 0.35 1.32 1.69
Cl mg/kg 14.00 14.00 16.00 15.00 11.00 14.00 19.00
Gravel % % <1 <1 <1 <1 <1 <1 30.00
Sand % (>0.63um) % 94.00 93.00 94.00 92.00 78.00 63.00 69.00
Silt % % 5.00 4.00 4.00 5.00 4.00 5.00 13.00
Clay % % <3 3.00 <3 <3 18.00 32.00 18.00
Attachment 2 – Cookes Plain Soil Water Express simulation final
Attachment 1 – Cookes Plain Soil Testing Results

Parameters UNIT
COOMANDOOK FLAT
BARLEY 0-10
COOMANDOOK FLAT
BARLEY 10-20
COOMANDOOK FLAT
BARLEY 20-30
COOMANDOOK FLAT
BARLEY 30-40
COOMANDOOK FLAT
BARLEY 40-50
COOMANDOOK FLAT
BARLEY 50-70
COOMANDOOK FLAT
BARLEY 70-90
pH Water 8.60 9.20 9.60 9.80 10.00 10.20 10.10
pH CaCl 7.90 8.30 8.50 8.60 8.70 8.70 8.90
EC 1:5 uS/cm 165.00 133.00 224.00 300.00 500.00 550.00 400.00 Exchangable Ca c.mol/kg 29.31 18.76 12.51 7.68 6.86 5.10 4.51 Exchangable Mg c.mol/kg 8.18 9.55 11.83 8.95 10.06 8.78 5.79 Exchangable K c.mol/kg 1.04 0.63 0.87 0.89 1.05 1.27 1.35 Exchangable Na c.mol/kg 2.87 1.93 4.87 5.36 7.32 7.84 6.24 Exchangable Na (ESP) % 6.93 6.25 16.19 23.43 28.94 34.10 34.88
eCEC c.mol/kg 41.40 30.87 30.08 22.88 25.29 22.99 17.89
B mg/kg 3.05 3.55 5.29 6.68 9.37 13.50 10.06
Cl mg/kg 48.00 12.50 12.00 15.90 18.60 23.50 45.40
Gravel % <1 <1 <1 15.00 60.00 60.00 50.00 Sand (>0.63um) % 55.00 39.00 31.00 31.00 39.00 50.00 52.00
Silt % 26.00 34.00 29.00 23.00 18.00 15.00 16.00
Clay % 19.00 27.00 40.00 46.00 43.00 35.00 32.00
Attachment 4 – Coomandook flat Soil Water Express simulation version 1
Attachment 3 – Coomandook flat soil testing results
Attachment 5 – Coomandook flat Soil Water Express simulation version 2
Attachment 6 – Coomandook flat Soil Water Express simulation version 3 (final)

Parameters UNIT
COOMANDOOK SAND
BARLEY 0-10
COOMANDOOK SAND
BARLEY 10-20
COOMANDOOK SAND
BARLEY 20-30
COOMANDOOK SAND
BARLEY 30-40
COOMANDOOK SAND
BARLEY 40-50
COOMANDOOK SAND
BARLEY 50-70
COOMANDOOK SAND
BARLEY 70-90
pH Water 7.88 7.00 7.20 7.60 7.90 8.10 8.90
pH CaCl 7.23 6.40 6.50 6.90 7.20 7.40 8.20
EC 1:5 uS/cm 43.00 25.00 27.00 25.00 32.00 52.00 71.00 Exchangable Ca c.mol/kg 2.35 1.41 1.05 1.00 2.59 5.84 6.27 Exchangable Mg c.mol/kg 0.68 0.40 0.31 0.33 0.90 2.39 2.03 Exchangable K c.mol/kg 0.09 0.08 0.09 0.10 0.19 0.51 0.38 Exchangable Na c.mol/kg 0.06 0.04 0.02 0.03 0.07 0.13 0.08 Exchangable Na (ESP) % 1.75 2.07 1.36 2.05 1.87 1.47 0.91
eCEC c.mol/kg 3.18 1.93 1.47 1.46 3.75 8.87 8.76
B mg/kg 0.22 0.24 0.23 0.19 0.28 0.58 0.66
Cl mg/kg 12.00 7.10 2.20 1.30 3.40 3.20 1.10
Gravel % <1 <1 <1 <1 <1 <1 <1 Sand (>0.63um) % 96.00 96.00 95.00 83.00 78.00 81.00 84.00
Silt % <3 <3 <3 <3 5.00 <3 4.00
Clay % <3 3.00 3.00 15.00 17.00 19.00 12.00
Attachment 8 – Coomandook sand Soil Water Express simulation version 1
Attachment 7 – Coomandook sand soil testing results

Attachment 9 – Coomandook sand Soil Water Express simulation version 2
Attachment 10 – Coomandook sand Soil Water Express simulation version 3 (final)

Parameters UNIT
MOORLANDS FLAT
CANOLA 0-10
MOORLANDS FLAT
CANOLA 10-20
MOORLANDS FLAT
CANOLA 20-30
MOORLANDS FLAT
CANOLA 30-40
MOORLANDS FLAT
CANOLA 40-50
MOORLANDS FLAT
CANOLA 50-70
MOORLANDS FLAT
CANOLA 70-90
pH Water 8.36 8.90 9.20 9.30 9.70 9.80 9.90
pH CaCl 7.78 7.90 8.20 8.20 8.50 8.50 8.50
EC 1:5 uS/cm 176.00 149.00 205.00 285.00 293.00 361.00 451.00
Exchangable Ca c.mol/kg 14.61 14.12 12.02 10.52 8.25 7.15 5.89
Exchangable Mg c.mol/kg 2.03 1.82 3.27 4.15 4.90 4.88 4.39
Exchangable K c.mol/kg 1.05 0.58 0.40 0.32 0.36 0.43 0.49
Exchangable Na c.mol/kg 0.22 0.98 1.58 2.12 2.82 3.64 4.05 Exchangable Na (ESP) % 1.22 5.60 9.15 12.39 17.27 22.61 27.33
eCEC c.mol/kg 17.90 17.50 17.27 17.11 16.33 16.10 14.82
B mg/kg 0.80 2.19 3.02 3.91 6.15 7.63 8.29
Cl mg/kg 8.00 31.00 247.90 290.50 284.40 432.00 428.20
Gravel % 1.00 <1 <1 40.00 10.00 <1 10.00
Sand (>0.63um) % 80.00 79.00 76.00 72.00 69.00 70.00 73.00
Silt % 10.00 12.00 11.00 16.00 17.00 18.00 16.00
Clay % 10.00 9.00 13.00 12.00 14.00 12.00 11.00
Attachment 12 – Moorlands flat Soil Water Express simulation version 1
Attachment 11 – Moorlands flat soil testing results

Attachment 13 – Moorlands flat Soil Water Express simulation version 2
Attachment 14 – Moorlands flat Soil Water Express simulation version 3 (final)

Parameters UNIT
MOORLANDS SAND LUPINS
0-10
MOORLANDS SAND LUPINS
10-20
MOORLANDS SAND LUPINS
20-30
MOORLANDS SAND LUPINS
30-40
MOORLANDS SAND LUPINS
40-50
MOORLANDS SAND LUPINS
50-70
MOORLANDS SAND LUPINS
70-90
pH Water 8.02 8.90 9.00 9.10 9.10 9.20 9.50
pH CaCl 7.44 8.20 8.20 8.20 8.20 8.30 8.40
EC 1:5 uS/cm 103.00 83.00 104.00 113.00 110.00 105.00 114.00
Exchangable Ca c.mol/kg 5.31 6.89 10.09 8.71 9.95 8.21 6.83
Exchangable Mg c.mol/kg 1.26 1.64 2.17 2.37 3.69 4.81 5.38
Exchangable K c.mol/kg 0.44 0.58 0.64 0.52 0.59 0.55 0.58
Exchangable Na c.mol/kg 0.05 0.07 0.09 0.10 0.14 0.19 0.32 Exchangable Na (ESP) % 0.78 0.76 0.69 0.85 0.97 1.38 2.44
eCEC c.mol/kg 7.07 9.18 12.99 11.70 14.37 13.76 13.11
B mg/kg 0.39 0.89 1.53 1.57 2.37 2.74 3.67
Cl mg/kg 14.00 4.00 5.60 7.30 11.30 6.50 11.20
Gravel % <1 <1 <1 <1 <1 <1 <1
Sand (>0.63um) % 92.00 84.00 77.00 75.00 81.00 78.00 74.00
Silt % <3 <3 10.00 18.00 11.00 14.00 15.00
Clay % 6.00 16.00 13.00 7.00 8.00 8.00 11.00
Attachment 16 – Moorlands sand Soil Water Express simulation version 1
Attachment 15 – Moorlands sand soil testing results
Attachment 17 – Moorlands sand Soil Water Express simulation version 2
Attachment 18 – Moorlands sand Soil Water Express simulation version 3 (final)