me3ow: soil and water engineering course introduction
TRANSCRIPT

ME3OW: SOIL AND WATER ENGINEERING
COURSE INTRODUCTION

Details of Lecturer
Course Lecturer: Dr. E.I. Ekwue Room Number: 216 Main Block,
Faculty of Engineering
Email: [email protected] , Tel. No. : 662 2002 Extension 3171 Office Hours: 9 a.m. to 12 Noon. (Tue,
Wed and Friday)

Course Outline Soil constituents, texture, structure and
plasticity. Phase relations. Soil water content and potential. Soil compression, strength and stress-strain relations. Prediction of forces on soil engaging tools.
Hydrologic cycle. Rainfall measurement and
analysis. Stream flow measurement. Runoff analysis. Open channel flow and channel design for steady uniform flow. Introductory ground water hydrology. Computer applications.
Course Objectives On Completion of this course, students should
be able to:
(i) Understand the basic engineering properties of soils and how these affect the trafficability of soils.
(ii) Understand the principles related to the occurrence of water on the earth's surface and how this affects the flow of water in soils thereby affecting the strength and deformation behaviour of soils.
(iii) Predict forces required to pull mechanical implements through the soil.

Course Objectives Contd.
(iv) Measure hydrologic processes and be able to analyze problems relating to these processes like rainfall and water runoff.
(v) Design channels required for irrigation,
drainage, soil conservation, flood control and other water-related projects.
(vi) Have a basic understanding of the occurrence, flow and yield of groundwater

Teaching Strategies The course will be taught via
Lectures. Lectures will also involve the solution of tutorial questions. Tutorial questions are designed to complement and enhance both the lectures and the students appreciation of the subject.
Course work assignments will be reviewed with the students.

Lecture Times
Monday: 11.10 a.m. to 12.00 noon Tuesday: 1.00 to 1.50 p.m.
Attendance at the Lectures is Compulsory.
Special Lab Sessions and Tutorials may be arranged.
.
Reading Material
(i) Smith, G.N. (1990). Elements of Soil Mechanics, Blackwell Science, 6th Edition or latest Edition.
(ii) Wanielista, M., Kersten, R., and Eaglin, R. (1997). Hydrology, Water Quantity and Quality Control, John Wiley, 1st Edition.
(iii) Course comprehensive note book and other handouts and tutorial sheets.

COURSE WORK
1. One Mid-Semester Test (20%);
2. End of Semester 1 Examination
(80%).

CHAPTER ONE
INTRODUCTION TO SOIL PHYSICS
1.1 RELEVANCE OF SOIL PHYSICS IN ENGINEERING
The objective of studying Soil Physics in Engineering is to present the basic scientific principles influencing the nature and behaviour of soils as well as to discuss those management aspects which are particularly relevant to the soil design Engineer.

Food Production Chain
Looking at the food production chain, two food types exist:
(a) From plants – carbohydrates, proteins etc; (b) Animal Food Plants have roots and the roots are in the soil.
Development of plants depends on three soil factors: (a) Soil Type: texture (the relative sizes of soil
mineral components) (b) Soil Structure: how soils are bonded together (c) Soil Fertility: Largely depends on soil organic
matter
Soil Texture and Structure Introduced
Soil texture and soil structure are very important because they determine the kind of crops to be grown, whether there will be erosion, whether to apply water to crops, the kind of machinery to use and so on.
Organic matter from plants and animals helps to build up or improve soil structure.
Organic matter also helps to improve the water holding capacity of the soil.
The soil type can be controlled using farm machinery. Soil structure can be changed with soil machinery . Soil structure studies is important in order to determine the amount
of load and the type of machinery to be used in a particular soil.

1.1 SOIL CONSTITUENTS
There are Four basic Soil Constituents: (a) Mineral Material: Sand, clay and silt (b) Organic matter - very valuable (c) Water (d) Air

SOIL CONSTITUENTS
Soil Constituents
The mineral matter and organic matter make up the solid contents of the soil while the water and the air represent the soil pores.
From a structural point of view, air is irrelevant but it helps in aeration for plant growth.
In an average agricultural soil, half will be solid solids, 45% minerals and about 5% organic matter. The other 50% which is called soil pores or voids will occupy 50%.
Voids are dynamic and we can get 20 – 30% air and 30 – 20% water by volume.
Excess water will lead to soil saturation and will cause death of plants as poor aeration is obtained.

PROPORTIONS OF SOIL CONSTITUENTS
45%
5%30%
20%
MINERALSOMWaterAir
Mineral (Inorganic) Component of the Soil
Except in the case of organic soils, most of a soil’s solid framework consists of mineral particles.
(a) They are variable in size and composition. They can vary from small rock particles to colloids.
(b) The mineral can be raw (quartz and other primary materials – coarse fractions which have not changed from parent material)
(c)They can also be silicate clays and iron oxides formed by the breakdown and weathering of less resistant minerals as soil formation progressed. These are called secondary minerals.
Mineral Component Contd.
The mineral particles present in soils are extremely variable in size.
The larger soil particles, which include stones, gravel and coarse sands, are generally rock fragments of various kinds.
Excluding the larger rock fragments such as stones and gravel, soil particles range in size over four orders of magnitude: from 2 mm to less than 0.0002 mm in diameter.
Sand Particles
(a) Sand particles are visible to the naked eye and vary in size from (2.0 to 0.05 mm).
They are gritty when rubbed between fingers. Sand particles do not adhere to one another and are therefore not sticky.

Silt and Clay Particles
(b) Silt particles are smaller than sand and range from (0.05 to 0.002 mm).
The silt particles are too small to be seen without a microscope. It feels smooth but not sticky, even when wet.
(c) Clays are the smallest class of mineral particles (< 0.002 mm).
They adhere together to form a sticky mass when wet and form hard clods when dry.

Classification of Soil Constituents
USDA ISSS
ROCKS > 2 mm > 2 mm
SAND 0.05 to 2 mm 0.02 to 2 mm
SILT 0.002 to 0.05 mm
0.002 to 0.02 mm
CLAY < 0.002 mm < 0.002 mm

Soil Texture
This refers to the relative proportions of the various soil separates (sand, silt and clay) in a soil.
Terms such as sandy loam, silty clay, and clay loam are used to identify soil texture.
The various soil components can be separated using Mechanical Analysis.
Sand can be separated by sieving. For silt and clay, separation is by the rate of
settling which can be obtained in a pipette or hydrometer analysis.
Soil Texture Contd.
They are put in a solution and the time of settling is noted.
From the Mechanical analysis, the proportions of sand, silt and clay are obtained.
The actual soil texture is determined using the Soil Textural Triangle ( Fig. 1.1.)
e.g. for a soil with 50% sand, 20% silt and 30% clay, the texture is Sandy Clay Loam.


1.1.1 COLLOIDAL MATERIAL
The smaller particles (< 0.001 mm) of clay ( and similar sized organic particles) have colloidal properties and can be seen with an electronic microscope.
The colloidal particles have a very large area per unit weight so there are enough surface charges to which water and ions can be attracted.
These charges make them adhere together. Humus improves the water holding capacity of the soil.
WATER
Water is held in the soil at various degrees of tenacity which varies with the amount of water present.
The tension force of water in unsaturated soils has been described by several expressions such as soil-pull, the force of suction and capillary tension. Suction can be defined as the force per unit area that must be exerted to remove water from the soil. Suction or tension is measured in bars.
When the soil is saturated or nearly so, the amount of suction is almost zero, but as the soil water depletes, greater amount of energy must be applied to extract water.
The soil can be initially saturated and if it is drained, field capacity can be reached. Some water is still held by surface tension.
Field Capacity
Field Capacity is greatest amount of water the soil can hold under drainage.
For most soils, it is obtained after two days of drainage after the soil was saturated by heavy rain or irrigation.
It is the optimum amount of water needed for agriculture.

Permanent Wilting Point and Available Water
Below Field capacity, the plant finds it more and more difficult to extract water until the suction or tension reaches 15 atmospheres permanent wilting point is obtained, which is the maximum tension the plant can exert on the soil to extract water.
Available water is the difference between the moisture contents at field capacity and permanent wilting point.
Clay holds more water but the plants exert more tension to extract water more than sand.

SOIL AIR (a) From a mechanical point of view, air is
irrelevant as it cannot support load. Soil air is different from atmospheric air. It is found in voids around the soil solids.
(b) Soil air has a very high relative humidity when compared with atmospheric air
c) It has high carbon dioxide levels and low oxygen levels in comparison with atmospheric air

Aeration Effects (a) Aeration affects root development by three main
factors (i) By oxygen content: There is restricted root
development if oxygen falls below 9%. If it drops to less than 5%, root development ceases.
(ii) Carbon dioxide content: the roots will survive up
to 9 to 10%. The optimum is < 1%. By-Products of anaerobic decomposition: Hydrogen
sulphide is very toxic at low concentrations and kills roots. Methane and hydrogen are all right at reasonable concentration
SOIL STRUCTURE This is a field term that describes the
aggregation of the soil primary particles. Managing soil is managing soil structure. The soil structural types include:
(a) Massive Structure: No aggregation
e.g. big block of clay or mass of sand grains. In clay, the more the dryness, the deeper the cracks from the surface and the following structure is obtained:
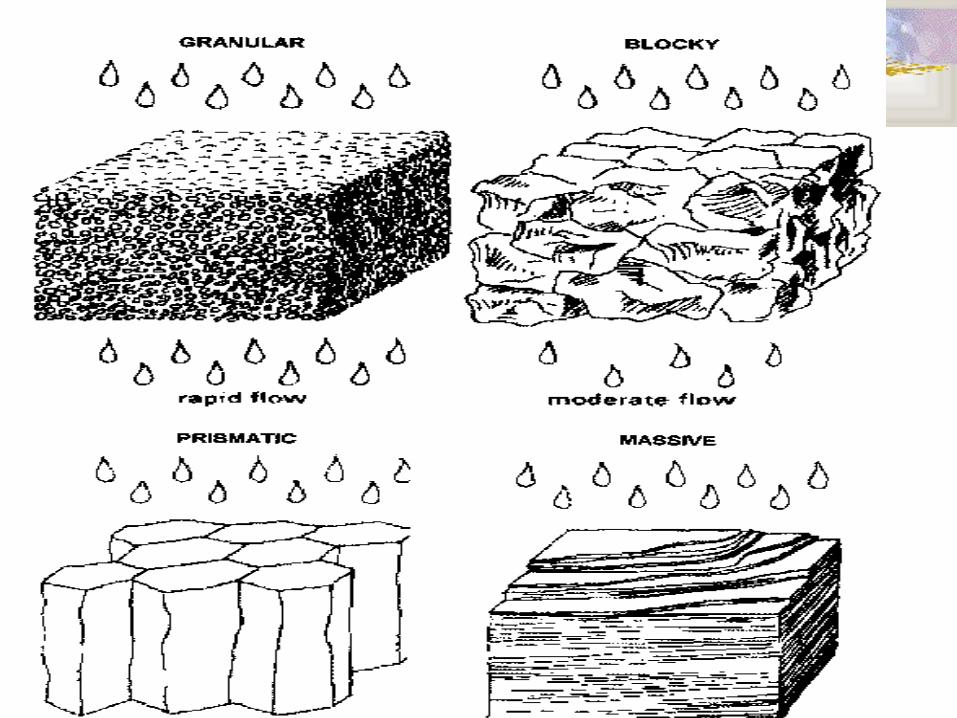

Soil Structural Types Contd.
(b) Prismatic or Columnar Structure : Caused by vertical cracking
If there is secondary horizontal cracks, the following structure is obtained:
(C) Blocky Structure: (b) If the blocky structure is worked upon by man,
the spheriodal or granular or crumb structure is obtained.
(c) Platelike Structure

Methods of Describing Soil Structure:
1.3.2 Describing structure is difficult but the following methods can be used:
(i) Virtual Account using the above terminologies and stating size ranges can be adopted. Absolute quantification is not possible.
(ii) Clod Size Distribution: Especially using photographs. The sizes can be read using a scale. Aerial, digital or stereo photographs can also be used.
(iii) Dry Sieving: This is aggregate grading and can only be adopted for dry soils as wet soils cannot be dry-sieved. Obtain a grading curve.
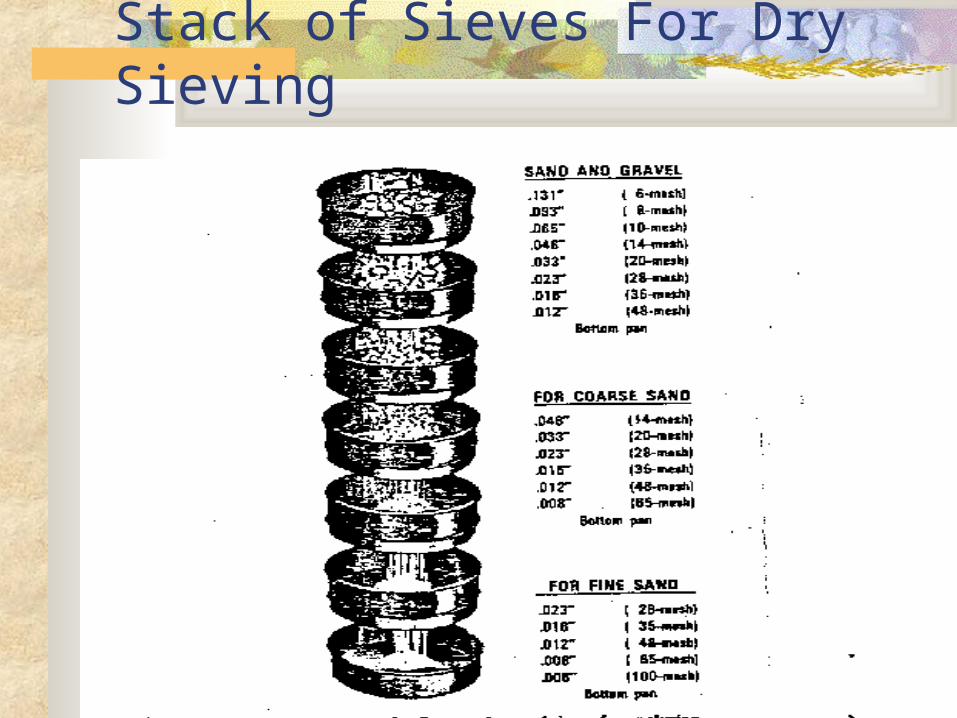
Stack of Sieves For Dry Sieving


Aggregate Stability: This is practically very important due
to the following effects: (i) Rainfall (iii) Tillage tools and wheels (iv) Water tables There is a threshold value above which
it is impossible to have aggregate stability. Crops need small aggregates so that they can be stable.

Tests For Aggregate Stability
(i) Wet Sieving: Preparing soil aggregates of a given size e.g. 4 – 5 mm, putting them on a set of sieves and agitating in water. The percentage of soil aggregates that are retained on each sieve are obtained so that water stable aggregates > a particular sieve size e.g. 5 mm can be computed.

Tests For Aggregate Stability Contd. (i) Drop Tests: Water drops, say 3 mm
diameter are dropped on a soil aggregate of a given size say 4 to 5 mm placed on a sieve of about 3 mm size.
The number of water drops needed to break down each aggregate so that it can be washed through the sieve size is used as an index of water aggregate stability. Many replications are needed for each soil.
(ii) Childes/Haines Method: Flood with water from below and compare for various soils. This is not a popular method.

SOIL PHASE RELATIONS
Air
Water
Solids
Va
Vw
Vs
Vp
V
Va is the Volume of air, Vw is the Volume of waterVs is the Volume of solids, Vp is the Volume of pores (water & air)
V is the total volume (air, water and solids)

Definitions: Density of Solid
Particles, Dp (Particle density):
(a) It is defined as the mass per unit volume of soil solids usually expressed as g/cm3 or Mg/m3 .
i.e. Particle density = Ms/Vs where Ms is the mass
of dry soil Particle density is essentially the same as the
specific gravity of a soil substance and varies within a narrow range of 2.60 to 2.75 g/cm3 with the average being assumed as 2.65 g/cm3 for a typical soil with 1 to 5% organic matter content.
Montmorillonite can have a particle density of 2.74 g/cm3, quartz , 2.65 and kaolinite, 2.61 g/cm3.

(b) Bulk Density, Db:
It is defined as the mass of a unit volume of dry soil. This includes both solids and pores. i.e. bulk density = Ms/V ; Ms is the mass of dry soil and V is the total volume of undisturbed soil.
The major method of measuring bulk density in the field is to collect a known volume of undisturbed soil (V) in a soil core, and drying it in the oven to remove all the water to obtain Ms. The values of bulk density range from 1.0 for loose open soil to 1.7 g/cm3 for compacted soil.
Values of bulk density are mainly affected by soil texture (sandy soils have more density than silty and clay soils), degree of soil aggregation and is reduced by soil organic matter content.

c) Porosity
It is defined as the proportion of the volume of soil pores (air and water) in comparison with the total volume of soil.
i.e. Porosity, P = Volume of Pores, Vp / V It normally ranges from 0.2 (20%) to 0.6
(60%). One of the main reasons for measuring soil
bulk density is that this value can be used to calculate soil porosity.
For the same particle density, the lower the bulk density, the higher the porosity.

Derivation of Formula Used to Calculate Porosity of Soil
Solving for Ms gives: Ms = Dp x Vs and Ms = Db (Vs + Vp)
Therefore: Dp x Vs = Db (Vs + Vp) and
`Since;
Since: Pore space + Solid space = 1 and Pore space (Porosity) = 1 – Solid space , then:
By definition Particle density DM
Vand Bulk density D
M
V Vps
sb
s
s p
: , ,
V
V V
D
Ds
s p
b
p
V
V Vsolid space then solid space
D
Ds
s p
b
p
Porosity PD
Db
p
, 1
More Definitions of Soil Phase Relations
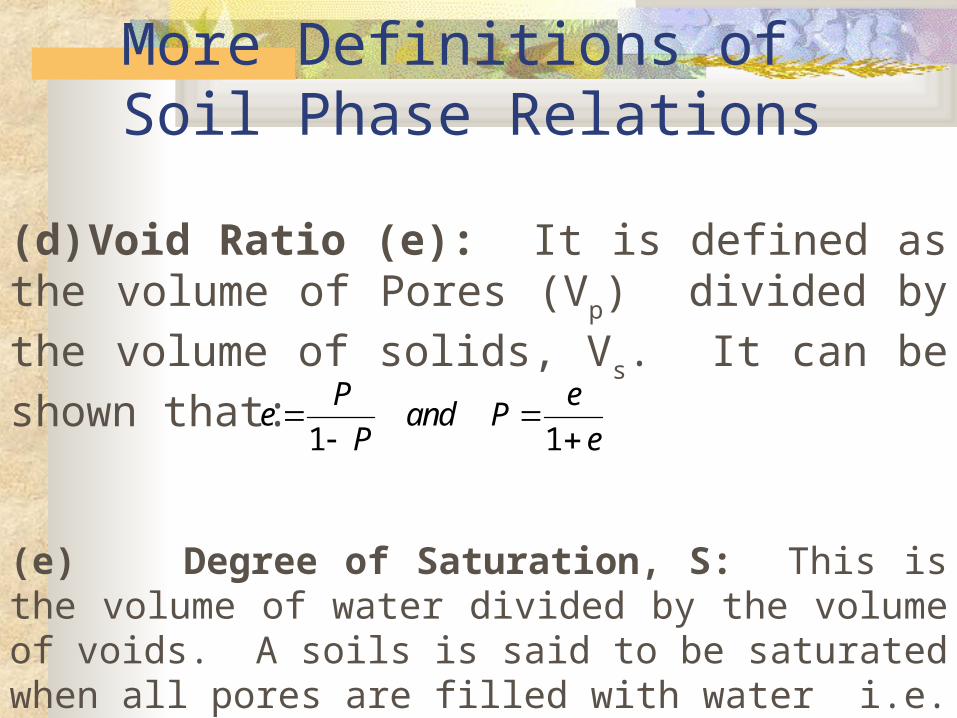
(d) Void Ratio (e): It is defined as the volume of Pores (Vp) divided by the volume of solids, Vs. It
can be shown that:
(e) Degree of Saturation, S: This is the volume of water divided by the volume of voids. A soils is said to be saturated when all pores are filled with water i.e. when: Vw = Vp
eP
Pand P
e
e
1 1

Soil Wetness This can be expressed by mass or by
volume. (i) By Mass (Pm) – gravimetric system: This
is equal to: Weigh soil, put in oven at 105 oC for about
48 hours; weigh again and obtain the weight of water by subtraction.
A good soil should have moisture contents between 5 and 60% and for peat or organic soils, it can be greater than 100%.

Soil Wetness by Volume
(ii) Volumetric water content, Pv. This is equal to:
Recall that volume = mass/density i.e.
Since Dw = 1
i.e. Pv = Pm x Db where Db is the bulk density of the soil.
PV
V V V
V
V
Volume of water
Total volume of undisturbed soil samplevw
s a w
w
PM D
M Dand P
M
Mx Dv
w w
s bv
w
sb
/
/
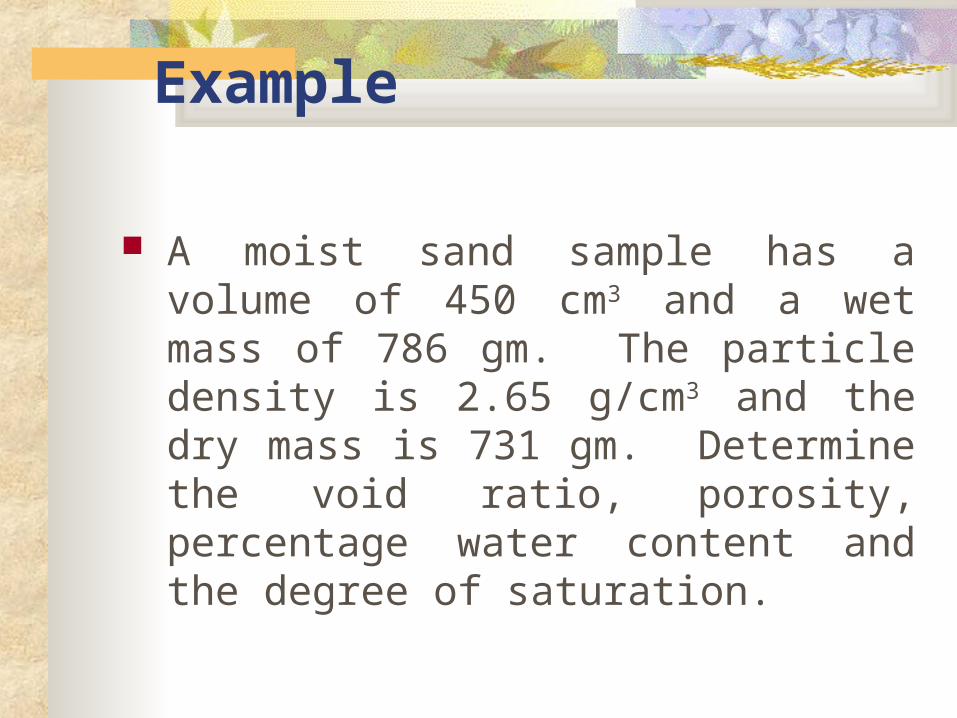
Example
A moist sand sample has a volume of 450 cm3 and a wet mass of 786 gm. The particle density is 2.65 g/cm3 and the dry mass is 731 gm. Determine the void ratio, porosity, percentage water content and the degree of saturation.

Solution:
Mass of water = 786 – 731 = 55 gm Volume of water = Mw/Dw = 55 cm3,
assuming Dw = 1gm/cm3
Mass of solids = 731 gm and Volume of solids = Ms/Ds = 731/2.65 = 275.85 cm3
Volume of air, Va = V – Vs – Vw = 450 – 275.85 – 55 = 119.15 cm3.
Volume of pores, Vp = Vw + Va = 55 + 119.15 = 174.15 cm3

Solution Concluded
(a) Void ratio, e = Vp/Vs = 174.15/275.85 = 0.63
(b) Porosity, P = Vp/V = 174.15/450 = 0.30
c) Percentage water content = Mw/Ms = (55/731) x 100 = 7.52%
(d) Degree of saturation = Vw/Vp = 55 / 175.15 = 31.4%
SOIL PROPERTIES AND MOISTURE CONTENT
Moisture content is a critical factor for soil behaviour.
In a soil tillage context, it is not a good measure e.g. 40% moisture content does not say anything about the degree of wetness.
For clay, the soil may be moist at 40% moisture content, but for sandy loam soil, it can be flowing as a liquid.
Soil tension is also not useful.
Soil Consistency
Soil consistency is the best parameter for predicting soil behaviour during tillage operations.
For instance, all soils behave in the same way at the same consistency limit.
If the plastic limit of the soil is 35% and it is cultivated at 30%, then the condition is friable.

Soil Consistency Contd.
Soil Consistency describes how a soil behaves in contact with water.
It can be referred to as rheology. Consistency is the nature and behaviour of a soil.
It states whether the soil is hard, friable, firm, plastic or liquid when it comes in contact with water.

Diagram Depicting Soil Consistency
CementedHarshHard
FriablePlastic
StickyLiquidMud
VeryHard
Very WetIncreasing Moisture Content
Shrinkage limit
Lower PlasticLimit (Plastic Limit)
Upper PlasticLimit (Liquid Limit)

Soil Consistency

Soil Consistency Contd.
The soil can behave as a solid or fluid depending on moisture content.
When dry, the soil has a cemented, harsh or hard consistency.
When very wet, it is sticky, liquid and muddy. The two extremes are not good for soil
cultivation, one too wet and the other too dry. In-between is better.
First, there is the friable zone in which the soil can be manipulated easily. It is the ideal soil working zone.

Soil Consistency Concluded
Most soils with clay have plastic limits between the friable and sticky or liquid zones.
Sand has not got any plastic limit because sand particles are inert and have no links with water.
Same goes for silt. For a soil with up to 10% clay content, clay
begins to dominate soil behaviour and plasticity sets in.

Atterberg Limits
Atterberg defined limits of the plastic limits as follows:
(a) Lower Plastic Limit: (LPL): Also called Plastic Limit. Significant water has been added to provide a film around each particle. Film cohesion is at a maximum just above the lower plastic limit. It is the minimum moisture content at which the soil may be puddled.
In the laboratory, the LPL or plastic limit is determined by adding soil moisture and at each point, rolling the soil out and remoulding up until it breaks out at 10 mm length and 3 mm diameter. For higher moisture content, it can be longer.

Diagrams For Lower Plastic Limit
Moisture Content
Cohesion
LPL UPL
3 mm diameter10 mm
Upper Plastic Limit (UPL)
This is also called liquid limit. This signifies the moisture content at which the water films are so thick that the film cohesion is decreased and the soil mass can flow under an applied load.
The point of maximum adhesion called the sticky point is almost the same as the UPL.

Diagram of Upper Plastic Limit
Sticky Point
Adhesion Lubrication
FrictionPhase
Force
Moisture Content

Determination of Upper Plastic Limit
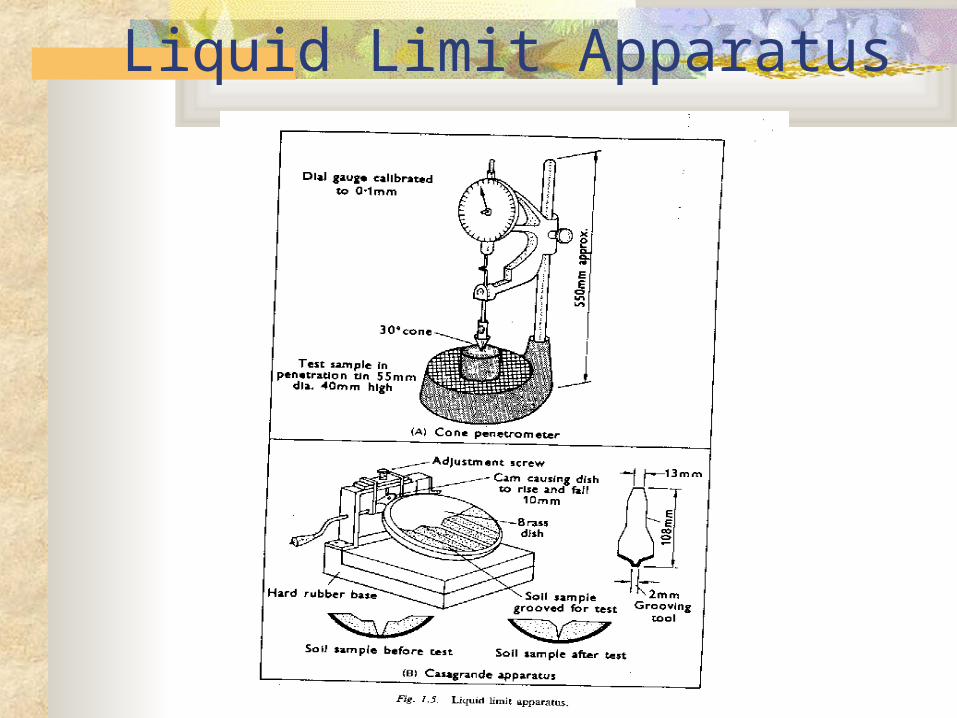
(i) Drop Cone Penetrometer: The soil is prepared in a core. A cone penetrometer is dropped and allowed to penetrate the soil. The UPL is the soil state or condition where the depth of penetration is 20 mm measured with standard methods.
(ii) Cassangrande Apparatus: The soil is put into a cup. A V-shaped groove of given dimensions is made on the soil and the cup is cranked so that it falls through 1 cm onto a rubber base, twice per second. The impact blows causes the soil to flow and close the groove. The UPL is reached when the soil is closed a distance of 12.5 mm by 25 blows.
Liquid Limit Apparatus

Plasticity Number or Index
It is the difference between the upper and lower plastic limits.
It gives the range of soil moisture where the soil will behave plastically.
The larger the plasticity index, the smaller the apparent friable zone.
If it is ten percent for instance, the soil is good for cultivation.
If it is 100 to 150, then the soil is bad for working.

Factors that Affect the Atterberg Limits
(a) Clay Content: The higher the clay content, the higher the LPL, UPL and the plasticity number. Increase in plasticity number is due to the greater rate of increase of UPL more than LPL.
(b) Nature of Exchangeable Cations: The ions linked to clay affect the orientation of water molecules.
Some like phosphate lowers LPL as it discourages thick oriented water layers while others like sodium encourages thick water layers and therefore increase the three Atterberg limits.

Factors that Affect the Atterberg Limits Concluded (c) Nature of the Clay Mineral: The nature
of the clay mineral affects the swelling and shrinking nature of the clay and the Atterberg limits. For montmorillonite, there is a lot of swelling and shrinkling and the plastic limits are very high in comparison with the non-swelling illite or kaoline clays.
(d) Organic Matter: For higher Organic matter content of the soil, higher lower plastic limits are obtained. The soil becomes difficult to work as organic matter level falls.