soil and land mapping - department of environment, water ... · soil and land mapping soil and land...
TRANSCRIPT
Soil and Land Mapping
SOIL AND LAND INFORMATION SHEET
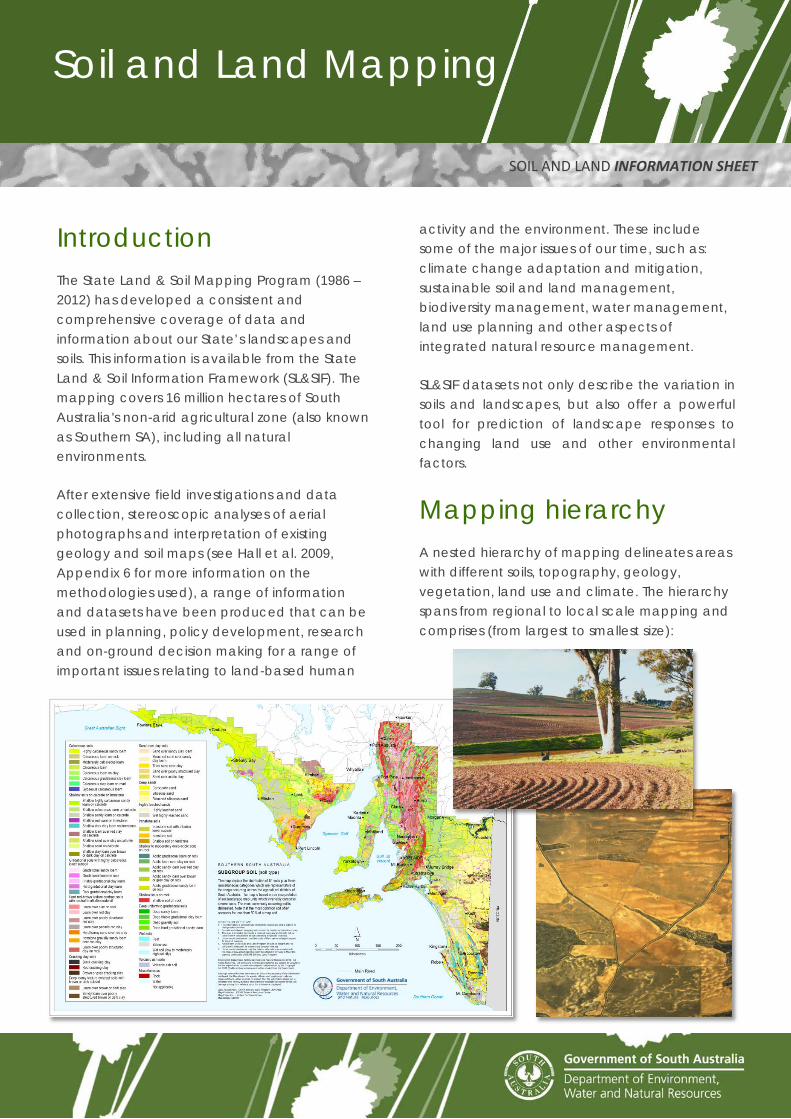
Introduction The State Land & Soil Mapping Program (1986 – 2012) has developed a consistent and comprehensive coverage of data and information about our State’s landscapes and soils. This information is available from the State Land & Soil Information Framework (SL&SIF). The mapping covers 16 million hectares of South Australia's non-arid agricultural zone (also known as Southern SA), including all natural environments.
After extensive field investigations and data collection, stereoscopic analyses of aerial photographs and interpretation of existing geology and soil maps (see Hall et al. 2009, Appendix 6 for more information on the methodologies used), a range of information and datasets have been produced that can be used in planning, policy development, research and on-ground decision making for a range of important issues relating to land-based human
activity and the environment. These include some of the major issues of our time, such as: climate change adaptation and mitigation, sustainable soil and land management, biodiversity management, water management, land use planning and other aspects of integrated natural resource management.
SL&SIF datasets not only describe the variation in soils and landscapes, but also offer a powerful tool for prediction of landscape responses to changing land use and other environmental factors.
Mapping hierarchy A nested hierarchy of mapping delineates areas with different soils, topography, geology, vegetation, land use and climate. The hierarchy spans from regional to local scale mapping and comprises (from largest to smallest size):
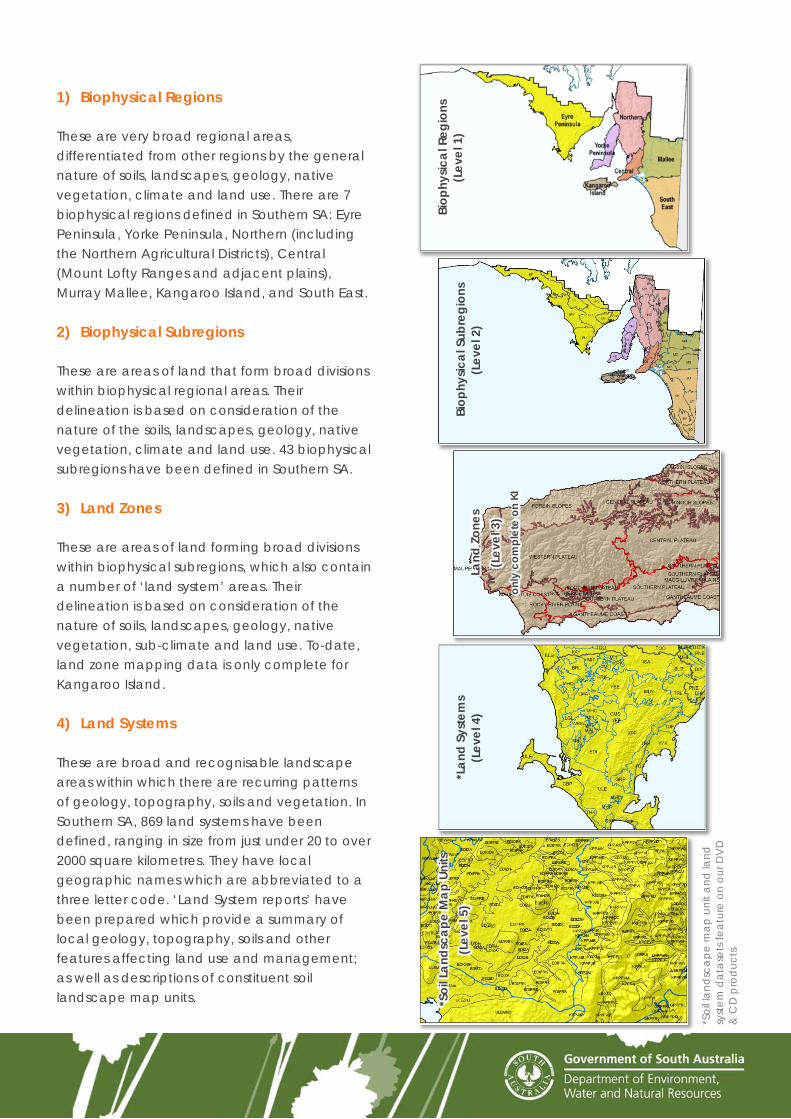
1) Biophysical Regions
These are very broad regional areas, differentiated from other regions by the general nature of soils, landscapes, geology, native vegetation, climate and land use. There are 7 biophysical regions defined in Southern SA: Eyre Peninsula, Yorke Peninsula, Northern (including the Northern Agricultural Districts), Central (Mount Lofty Ranges and adjacent plains), Murray Mallee, Kangaroo Island, and South East.
2) Biophysical Subregions
These are areas of land that form broad divisions within biophysical regional areas. Their delineation is based on consideration of the nature of the soils, landscapes, geology, native vegetation, climate and land use. 43 biophysical subregions have been defined in Southern SA.
3) Land Zones
These are areas of land forming broad divisions within biophysical subregions, which also contain a number of ‘land system’ areas. Their delineation is based on consideration of the nature of soils, landscapes, geology, native vegetation, sub-climate and land use. To-date, land zone mapping data is only complete for Kangaroo Island.
4) Land Systems
These are broad and recognisable landscape areas within which there are recurring patterns of geology, topography, soils and vegetation. In Southern SA, 869 land systems have been defined, ranging in size from just under 20 to over 2000 square kilometres. They have local geographic names which are abbreviated to a three letter code. ‘Land System reports’ have been prepared which provide a summary of local geology, topography, soils and other features affecting land use and management; as well as descriptions of constituent soil landscape map units.
Biop
hysic
al R
egio
ns
(Lev
el 1
) Bi
ophy
sical
Sub
regi
ons
(Lev
el 2
)
*Soi
l land
sca
pe m
ap
unit
and
land
sy
stem
dat
ase
ts fe
atur
e on
our
DV
D
& C
D p
rod
ucts
.
*Lan
d Sy
stem
s (L
evel
4)
*Soi
l Lan
dsca
pe M
ap U
nits
(L
evel
5)
Land
Zon
es
(Lev
el 3
) on
ly c
ompl
ete
on K
I
5) Soil Landscape Map Units
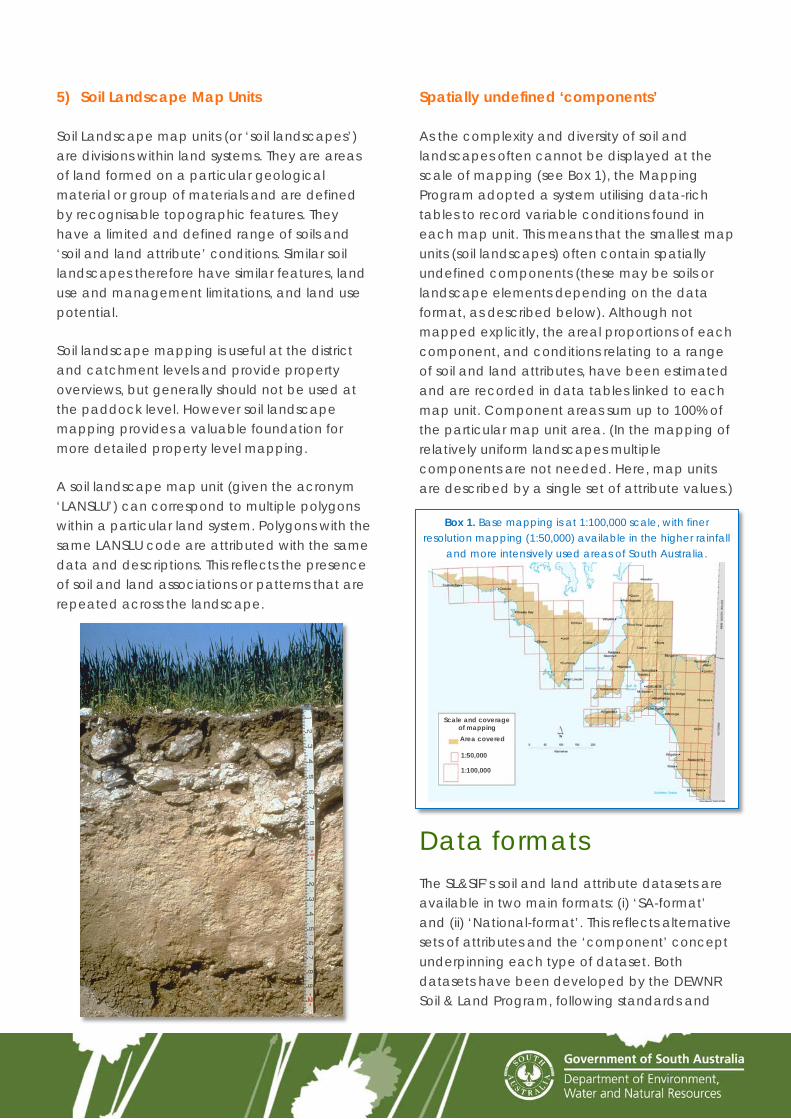
Soil Landscape map units (or ‘soil landscapes’) are divisions within land systems. They are areas of land formed on a particular geological material or group of materials and are defined by recognisable topographic features. They have a limited and defined range of soils and ‘soil and land attribute’ conditions. Similar soil landscapes therefore have similar features, land use and management limitations, and land use potential.
Soil landscape mapping is useful at the district and catchment levels and provide property overviews, but generally should not be used at the paddock level. However soil landscape mapping provides a valuable foundation for more detailed property level mapping.
A soil landscape map unit (given the acronym ‘LANSLU’) can correspond to multiple polygons within a particular land system. Polygons with the same LANSLU code are attributed with the same data and descriptions. This reflects the presence of soil and land associations or patterns that are repeated across the landscape.
Spatially undefined ‘components’
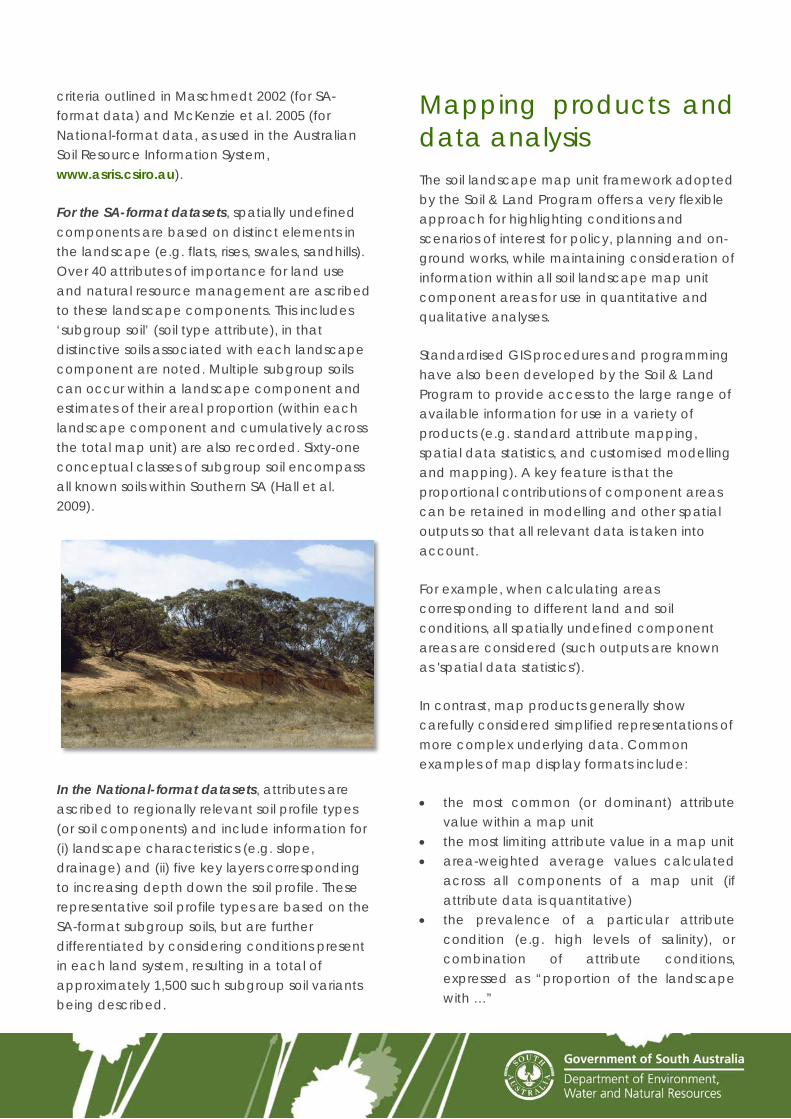
As the complexity and diversity of soil and landscapes often cannot be displayed at the scale of mapping (see Box 1), the Mapping Program adopted a system utilising data-rich tables to record variable conditions found in each map unit. This means that the smallest map units (soil landscapes) often contain spatially undefined components (these may be soils or landscape elements depending on the data format, as described below). Although not mapped explicitly, the areal proportions of each component, and conditions relating to a range of soil and land attributes, have been estimated and are recorded in data tables linked to each map unit. Component areas sum up to 100% of the particular map unit area. (In the mapping of relatively uniform landscapes multiple components are not needed. Here, map units are described by a single set of attribute values.)
Data formats The SL&SIF’s soil and land attribute datasets are available in two main formats: (i) ‘SA-format’ and (ii) ‘National-format’. This reflects alternative sets of attributes and the ‘component’ concept underpinning each type of dataset. Both datasets have been developed by the DEWNR Soil & Land Program, following standards and
Box 1. Base mapping is at 1:100,000 scale, with finer resolution mapping (1:50,000) available in the higher rainfall
and more intensively used areas of South Australia.
Scale and coverage of mapping Area covered
1:50,000
1:100,000
criteria outlined in Maschmedt 2002 (for SA-format data) and McKenzie et al. 2005 (for National-format data, as used in the Australian Soil Resource Information System, www.asris.csiro.au).
For the SA-format datasets, spatially undefined components are based on distinct elements in the landscape (e.g. flats, rises, swales, sandhills). Over 40 attributes of importance for land use and natural resource management are ascribed to these landscape components. This includes ‘subgroup soil’ (soil type attribute), in that distinctive soils associated with each landscape component are noted. Multiple subgroup soils can occur within a landscape component and estimates of their areal proportion (within each landscape component and cumulatively across the total map unit) are also recorded. Sixty-one conceptual classes of subgroup soil encompass all known soils within Southern SA (Hall et al. 2009).
In the National-format datasets, attributes are ascribed to regionally relevant soil profile types (or soil components) and include information for (i) landscape characteristics (e.g. slope, drainage) and (ii) five key layers corresponding to increasing depth down the soil profile. These representative soil profile types are based on the SA-format subgroup soils, but are further differentiated by considering conditions present in each land system, resulting in a total of approximately 1,500 such subgroup soil variants being described.
Mapping products and data analysis The soil landscape map unit framework adopted by the Soil & Land Program offers a very flexible approach for highlighting conditions and scenarios of interest for policy, planning and on-ground works, while maintaining consideration of information within all soil landscape map unit component areas for use in quantitative and qualitative analyses.
Standardised GIS procedures and programming have also been developed by the Soil & Land Program to provide access to the large range of available information for use in a variety of products (e.g. standard attribute mapping, spatial data statistics, and customised modelling and mapping). A key feature is that the proportional contributions of component areas can be retained in modelling and other spatial outputs so that all relevant data is taken into account.
For example, when calculating areas corresponding to different land and soil conditions, all spatially undefined component areas are considered (such outputs are known as 'spatial data statistics').
In contrast, map products generally show carefully considered simplified representations of more complex underlying data. Common examples of map display formats include:
• the most common (or dominant) attribute value within a map unit
• the most limiting attribute value in a map unit • area-weighted average values calculated
across all components of a map unit (if attribute data is quantitative)
• the prevalence of a particular attribute condition (e.g. high levels of salinity), or combination of attribute conditions, expressed as “proportion of the landscape with …”
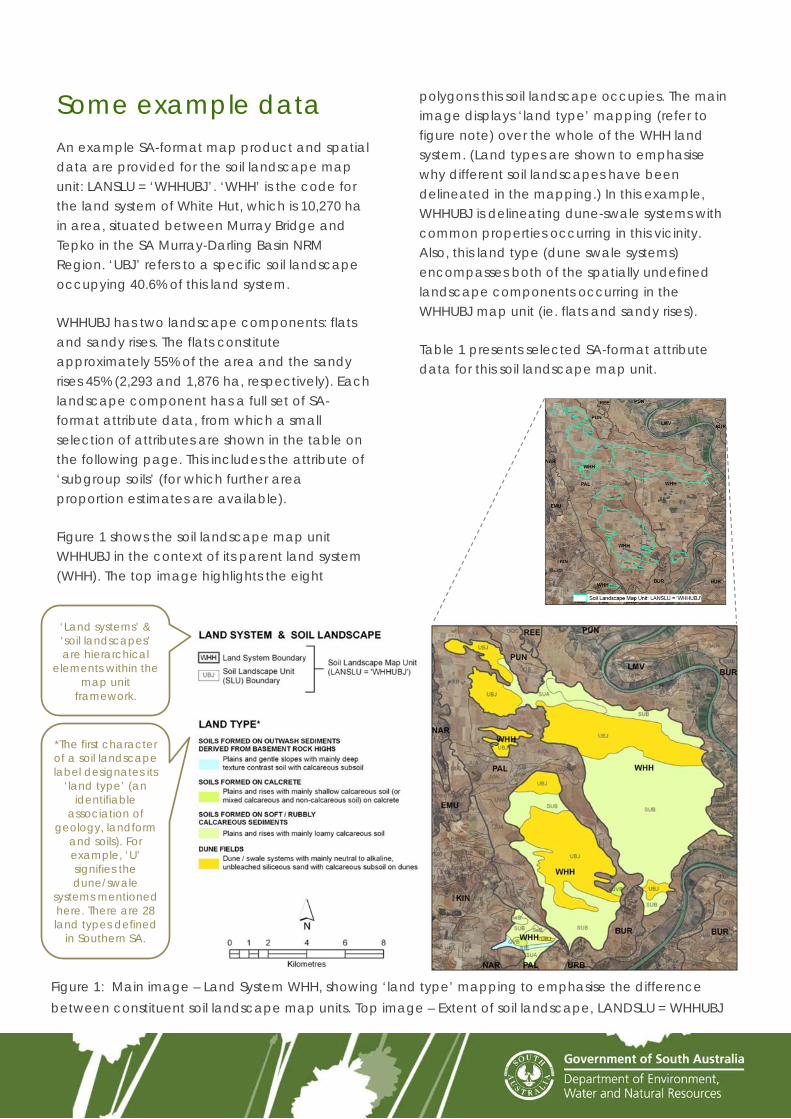
Some example data An example SA-format map product and spatial data are provided for the soil landscape map unit: LANSLU = ‘WHHUBJ’. ‘WHH’ is the code for the land system of White Hut, which is 10,270 ha in area, situated between Murray Bridge and Tepko in the SA Murray-Darling Basin NRM Region. ‘UBJ’ refers to a specific soil landscape occupying 40.6% of this land system.
WHHUBJ has two landscape components: flats and sandy rises. The flats constitute approximately 55% of the area and the sandy rises 45% (2,293 and 1,876 ha, respectively). Each landscape component has a full set of SA-format attribute data, from which a small selection of attributes are shown in the table on the following page. This includes the attribute of ‘subgroup soils’ (for which further area proportion estimates are available).
Figure 1 shows the soil landscape map unit WHHUBJ in the context of its parent land system (WHH). The top image highlights the eight
polygons this soil landscape occupies. The main image displays ‘land type’ mapping (refer to figure note) over the whole of the WHH land system. (Land types are shown to emphasise why different soil landscapes have been delineated in the mapping.) In this example, WHHUBJ is delineating dune-swale systems with common properties occurring in this vicinity. Also, this land type (dune swale systems) encompasses both of the spatially undefined landscape components occurring in the WHHUBJ map unit (ie. flats and sandy rises).
Table 1 presents selected SA-format attribute data for this soil landscape map unit.
Figure 1: Main image – Land System WHH, showing ‘land type’ mapping to emphasise the difference between constituent soil landscape map units. Top image – Extent of soil landscape, LANDSLU = WHHUBJ
‘Land systems’ & ‘soil landscapes’ are hierarchical
elements within the map unit
framework.
*The first character of a soil landscape label designates its
‘land type’ (an identifiable
association of geology, landform
and soils). For example, ‘U’ signifies the dune/swale
systems mentioned here. There are 28 land types defined
in Southern SA.
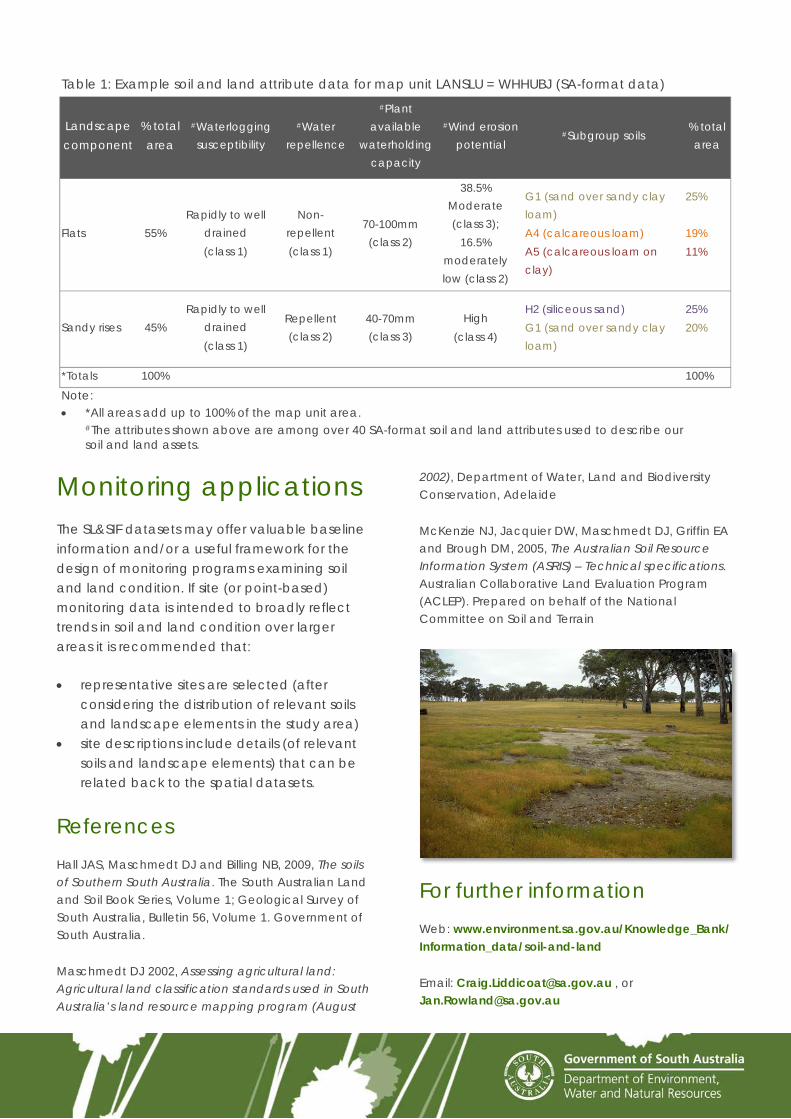
Monitoring applications The SL&SIF datasets may offer valuable baseline information and/or a useful framework for the design of monitoring programs examining soil and land condition. If site (or point-based) monitoring data is intended to broadly reflect trends in soil and land condition over larger areas it is recommended that:
• representative sites are selected (after considering the distribution of relevant soils and landscape elements in the study area)
• site descriptions include details (of relevant soils and landscape elements) that can be related back to the spatial datasets.
References Hall JAS, Maschmedt DJ and Billing NB, 2009, The soils of Southern South Australia. The South Australian Land and Soil Book Series, Volume 1; Geological Survey of South Australia, Bulletin 56, Volume 1. Government of South Australia.
Maschmedt DJ 2002, Assessing agricultural land: Agricultural land classification standards used in South Australia’s land resource mapping program (August
2002), Department of Water, Land and Biodiversity Conservation, Adelaide
McKenzie NJ, Jacquier DW, Maschmedt DJ, Griffin EA and Brough DM, 2005, The Australian Soil Resource Information System (ASRIS) – Technical specifications. Australian Collaborative Land Evaluation Program (ACLEP). Prepared on behalf of the National Committee on Soil and Terrain
For further information Web: www.environment.sa.gov.au/Knowledge_Bank/ Information_data/soil-and-land
Email: [email protected] , or [email protected]
Table 1: Example soil and land attribute data for map unit LANSLU = WHHUBJ (SA-format data)
Landscape component
% total area
#Waterlogging susceptibility
#Water repellence
#Plant available
waterholding capacity
#Wind erosion potential
#Subgroup soils % total area
Flats 55% Rapidly to well
drained (class 1)
Non- repellent (class 1)
70-100mm (class 2)
38.5% Moderate (class 3);
16.5% moderately low (class 2)
G1 (sand over sandy clay loam) A4 (calcareous loam) A5 (calcareous loam on clay)
25% 19% 11%
Sandy rises 45% Rapidly to well
drained (class 1)
Repellent (class 2)
40-70mm (class 3)
High (class 4)
H2 (siliceous sand) G1 (sand over sandy clay loam)
25% 20%
*Totals 100% 100%
Note: • *All areas add up to 100% of the map unit area.
#The attributes shown above are among over 40 SA-format soil and land attributes used to describe our soil and land assets.