induction of the wafl/cipl protein and apoptosis inhuman · proc. natl. acad. sci. usa vol. 93, pp....
TRANSCRIPT
Proc. Natl. Acad. Sci. USAVol. 93, pp. 265-268, January 1996Medical Sciences
Induction of the WAFl/CIPl protein and apoptosis in humanT-cell leukemia virus type I-transformed lymphocytes aftertreatment with Adriamycin by using a p53-independent pathwayRONALD B. GARTENHAUS*, PING WANG, AND PETER HOFFMANNDepartments of Medicine and Pathology, Division of Hematology/Oncology, Long Island Jewish Medical Center, The Long Island Campus for the AlbertEinstein College of Medicine, New Hyde Park, NY 11040
Communicated by Eugene P. Cronkite, Brookhaven National Laboratory, Upton, NY, August 25, 1995
ABSTRACT The WAFl/CIPl protein has been identifiedas a downstream mediator of the tumor suppressor p53 inregulating cell cycle progression through a GI-phase check-point. Recent work has implicated the functional status of p53as a critical determinant in the apoptotic response of certaincell lines to DNA damaging agents. By using human T-cellleukemia virus type I-transformed lymphoid cell lines thatdiffer in their level and function of wild-type p53, we investi-gated the induction of WAFl/CIPl and apoptosis after ex-posure to Adriamycin, a genotoxic agent. We found thatregardless of the p53 status in these cell lines, WAF1/CIP1RNA was rapidly induced in response to Adriamycin treat-ment. An elevated level of WAFI/CIP1 protein was observedas well. Additionally, we demonstrated that apoptosis wasinduced in all cell lines analyzed despite some having func-tionally inactive p53 protein. Our data suggest that a p53-independent pathway may play a role in the apoptotic responseobserved in some cell lines after exposure to DNA damagingagents.
Human T-cell leukemia virus type I (HTLV-I), the etiologicagent of adult T-cell leukemia transforms human T cells bothin vitro and in vivo (1-3). We (24) and others (4-7) havedemonstrated elevated steady-state levels in tumor suppressorp53 protein in several HTLV-I-transformed cell lines despitehaving a wild-type sequence in the p53 coding region usuallyassociated with inactivating mutations. The mechanism re-sponsible for the increased stabilization of p53 in these cells ispresently unknown. Recently, our group has shown that levelsof p53 protein were consistently higher in interleukin 2 (IL-2)-independent HTLV-I-transformed cell lines compared withIL-2-dependent ones and that the observed increase in p53protein level correlated with its functional inactivation (24).The gene for the WAF1/CIP1 protein has been identified as
a downstream target of p53 in regulating cell cycle progressionthrough a GI-phase checkpoint (8, 9). Additionally, the pres-ence of a functional p53 protein has been implicated as acritical determinant in the apoptotic response of certain celllines to DNA damaging agents (10, 11). We wished to examinewhether differences in the p53 status of HTLV-I-transformedlymphocytes, the in vitro correlate of the malignant cell of adultT-cell leukemia would translate into different responses totreatment with the genotoxic agent Adriamycin. By usingseveral HTLV-I-transformed cell lines that differed in theirIL-2 requirement and functional status of p53, we studied theinduction of WAF1/CIP1 at the RNA and protein level afterexposure to Adriamycin. We also measured cytotoxicity andapoptosis by using an MTT assay and DNA fragmentationassays. Our findings indicate that Adriamycin can induceWAFl/CIPl and apoptosis in a p53-independent manner.
The publication costs of this article were defrayed in part by page chargepayment. This article must therefore be hereby marked "advertisement" inaccordance with 18 U.S.C. §1734 solely to indicate this fact.
PBL N1185 MT2
WY2 4 1610 2 4 161 i24 ,ug
2 ,ug
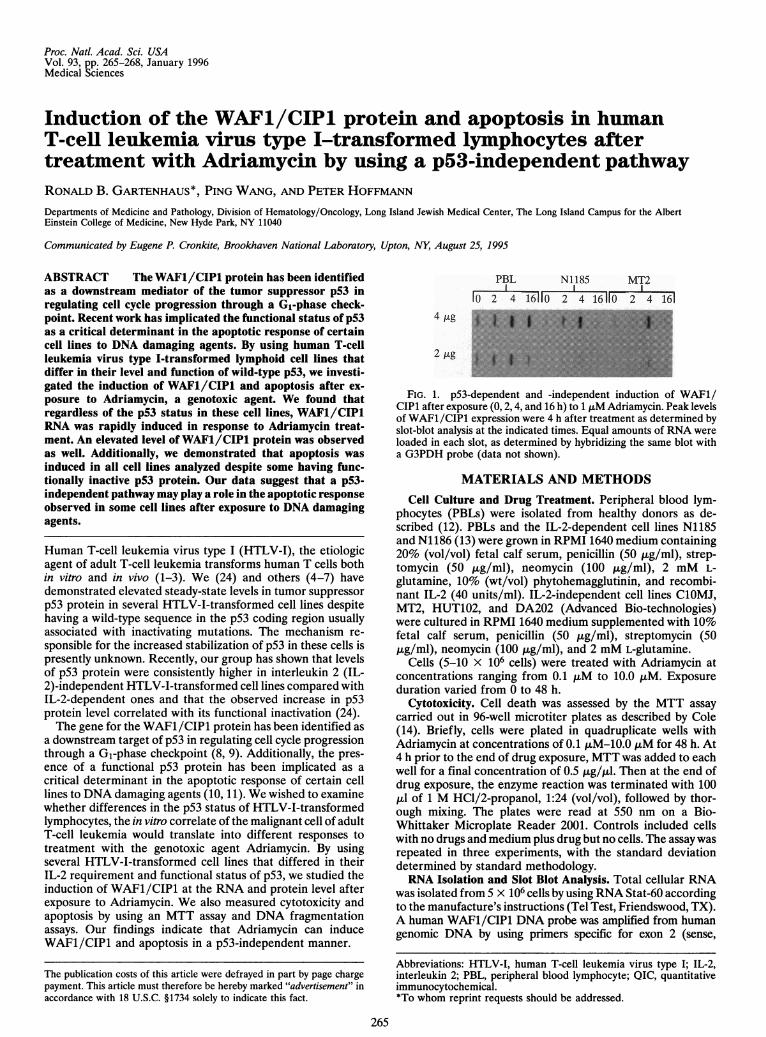
FIG. 1. p53-dependent and -independent induction of WAFl/CIP1 after exposure (0, 2,4, and 16 h) to 1 AM Adriamycin. Peak levelsof WAFl/CIPl expression were 4 h after treatment as determined byslot-blot analysis at the indicated times. Equal amounts of RNA wereloaded in each slot, as determined by hybridizing the same blot witha G3PDH probe (data not shown).
MATERIALS AND METHODSCell Culture and Drug Treatment. Peripheral blood lym-
phocytes (PBLs) were isolated from healthy donors as de-scribed (12). PBLs and the IL-2-dependent cell lines N1185and Ni 186 (13) were grown in RPMI 1640 medium containing20% (vol/vol) fetal calf serum, penicillin (50 jig/ml), strep-tomycin (50 ,ug/ml), neomycin (100 ,ug/ml), 2 mM L-glutamine, 10% (wt/vol) phytohemagglutinin, and recombi-nant IL-2 (40 units/ml). IL-2-independent cell lines C1OMJ,MT2, HUT102, and DA202 (Advanced Bio-technologies)were cultured in RPMI 1640 medium supplemented with 10%fetal calf serum, penicillin (50 ,ug/ml), streptomycin (50,ug/ml), neomycin (100 ,ug/ml), and 2 mM L-glutamine.
Cells (5-10 x 106 cells) were treated with Adriamycin atconcentrations ranging from 0.1 ,uM to 10.0 ,uM. Exposureduration varied from 0 to 48 h.
Cytotoxicity. Cell death was assessed by the MTT assaycarried out in 96-well microtiter plates as described by Cole(14). Briefly, cells were plated in quadruplicate wells withAdriamycin at concentrations of 0.1 ,uM-10.0 ,uM for 48 h. At4 h prior to the end of drug exposure, MTT was added to eachwell for a final concentration of 0.5 ,ug/,ll. Then at the end ofdrug exposure, the enzyme reaction was terminated with 100,ul of 1 M HCl/2-propanol, 1:24 (vol/vol), followed by thor-ough mixing. The plates were read at 550 nm on a Bio-Whittaker Microplate Reader 2001. Controls included cellswith no drugs and medium plus drug but no cells. The assay wasrepeated in three experiments, with the standard deviationdetermined by standard methodology.RNA Isolation and Slot Blot Analysis. Total cellular RNA
was isolated from S x 106 cells by using RNA Stat-60 accordingto the manufacture's instructions (Tel Test, Friendswood, TX).A human WAF1/CIP1 DNA probe was amplified from humangenomic DNA by using primers specific for exon 2 (sense,
Abbreviations: HTLV-I, human T-cell leukemia virus type I; IL-2,interleukin 2; PBL, peripheral blood lymphocyte; QIC, quantitativeimmunocytochemical.*To whom reprint requests should be addressed.
265

266 Medical Sciences: Gartenhaus et al.
3h 6h 16h 24h 48h
blo
0: : 0 0 CD 4. 0z 4 14 14 14 - 4 -
PBL109
N1185WAFI {
MT2
FIG. 2. Protein levels of WAF1/CIP1 after exposure to 1-10 ,uMAdriamycin. As early as 3 h after treatment, WAFl/CIPl proteinlevels increased relative to the low basal levels observed. Adriamycinat 1 ,uM was effective in increasing the level of WAFl/CIPl protein.At 10 ,uM Adriamycin, the level of protein expressed decreased due tothe increasing cytotoxicity at this dose.
5'-CGGGATCCGGCGCCATGTCAGAACCGGC-3'; anti-sense, 5'-CGGAATTCCATGCTGGTCTGCCGCCGTT-TTCG-3'). A control cDNA probe G3PDH was generated byusing primers obtained from Clontech. The automated temper-ature cycling program was performed as below: Step-cycle file for30 cycles at 94°C for 1 min, 60°C for 2 min, and 72°C for 3 min;time-delay file, 72°C for 7 min; soak cycle, 4°C. Slot-blot hybrid-ization was carried out with three dilutions 1:2 (4 pug to 1 pig).Prehybridization, hybridization, and washing conditions were asdescribed (15).
Protein Extraction and Western Blot Analysis. Treated cells(5-10 x 106 cells) were washed twice with PBS. Cell pellet waslysed with lysate buffer (10 mM Tris-HCl, pH 7.4/150 mMNaCl/1 mM EDTA/0.1% SDS/150mM Phenylmethylsulfonylfluoride). Total protein concentration in each sample wasdetermined by using a micro BCA method (Pierce) accordingto the suppliers instructions. Protein at 25 ,tg per well wasfractionated by electrophoresis in a Tris/glycine PAGE gel(Novex, San Diego) under denaturing reducing conditions.Transfer to supported nitrocellulose filter was carried out byusing a Millipore electroblotting apparatus (Millipore). Thefilters were incubated first with WAF1 (Ab-1), a monoclonalantibody to WAF1/CIP1 (Oncogene Science), and then asecondary antibody (Goat anti-mouse IgG) conjugated withhorseradish peroxidase was added. Chemiluminescence wasperformed with ECL (Amersham) according to the manufac-turer's instruction. The filters were then exposed to x-ray filmand the autoradiographs were analyzed by laser densitometryusing a personal densitometer (Molecular Dynamics).DNA Fragmentation Assays. Apoptosis was characterized by
DNA fragmentation analyzed either by agarose gel electro-phoresis of low molecular weight DNA (16) or immunoper-oxidase detection of digoxigenin-labeled genomic DNA (17).Briefly, untreated or treated cells (24-48 h) were fixed insuspension with 70% ethanol for the agarose gel electrophore-sis assay. The cells were then centrifuged at 800 x g for 5 minand the ethanol was thoroughly removed. The cell pellets (1-2x 10⁶ cells) were resuspended in 40 ,ul of phosphate/citrate(PC) buffer (192 parts of 0.2 M Na2HPO4/8 parts of 0.1 Mcitric acid, pH 7.8) at room temperature for 30 min. Aftercentrifugation at 1000 x g for 5 min, the supernatant was
transferred to new tubes and concentrated by vacuum. Threemicroliters of 0.25% Nonidet P-40 (Sigma) was then added,followed by 3 gl of RNase A (Sigma; 1 mg/ml). After a 30-minincubation at 37°C, 3 gl of proteinase K (1 mg/ml; BoehringerManheim), was added and incubated for an additional 30 minat 37°C. Finally, 12 ,ul of loading buffer [0.25% bromophenolblue/0.25% xylene cyanol FF/30% (vol/vol) glycerol] wasadded and the mixture was analyzed on a 0.8% agarose gel at2 V/cm for 16 h. After staining with ethidium bromide (5,ug/ml), the DNA in the gels was visualized under UV light andphotographed. Measurement of DNA fragmentation by theimmunoperoxidase assay was carried out using the Apop Tagdetection kit (Oncor) according to the suppliers instructionswith slight modification as described below. Cell suspensionwas fixed in 10% (vol/vol) formalin for 5 min then the slidepreparation was counterstained with methyl green at pH 5.5for 10 min. This was washed in three changes of distilled water,followed by three changes of absolute alcohol.
Apoptosis was relatively graded utilizing the quantitativeimmunocytochemical (QIC) score obtained from the CAS-200Image Analysis System (Cell Analysis Systems, Elmhurst, IL).The zero point was established utilizing a sham preparation inwhich IL-2-deprived PBL-109 lymphocytes were stained forapoptosis in the absence of terminal deoxynucleotidyltrans-ferase. All cell preparations were then microscopically exam-ined at 400X magnification in real time and subject to randomfield image analysis of five microscopic fields for each prep-aration. This allowed between 500 and 1000 cells to beexamined for each cell preparation. The QIC score wasdetermined by taking the percentage of the summed totaloptical density for the positive apoptotic nuclear area dividedby the summed total optical density of all the nuclei andmultiplying the resulting apoptotic density expressed as apercentage times the percentage of positively stained nucleararea. The product was then divided by 10. Since percentageswere utilized, the absolute numbers of cells examined wereirrelevant to the final QIC score.
RESULTSWAFl/CIPI Expressions in HTLV-I-Transformed Lym-
phocytes. HTLV-I-transformed lymphocytes have been re-ported to have elevated levels of p53 protein when comparedto normal PBLs (refs. 4-7, 24). The growth factor requirementof various HTLV-I-transformed lymphocytes differs withsome requiring IL-2 supplementation whereas others may not.We have recently demonstrated that IL-2-independent celllines have functionally inactive p53 protein associated withelevated steady-state levels (24). By using these phenotypicallydistinct cell lines, we investigated the ability of Adriamycin toinduce WAFI/CIPI expression in cell lines deficient in func-tional p53 protein.
After exposure to Adriamycin, total RNA was extracted fromIL-2-dependent and IL-2-independent cell lines at various timesand analyzed for WAFl/CIPl expression by slot blot and North-ern blot analysis. As demonstrated in Fig. 1, the level of messagepeaked at 4 h with comparable levels in N1185 and MT2 cells.Similar results were observed in other IL-2-dependent and IL-2-independent cell lines examined (data not shown).A parallel set of experiments was carried out to assess the
level of WAFl/CIPl protein induced by Adriamycin treat-
+ +oC oC 0
0D 0 -4 V
m m m m -P X v v Z
00
z
+ +
4 < <z 0
I ++± N
+-, -, 0 0
_) CH
WAFi - M~uWM1 _ .. .... ..a~~~~~~~~~~~~~~... ..........77
FIG. 3. Survey of IL-2-dependent and IL-2-independent cell lines revealing induction ofWAFl/CIPl protein after exposure to 1 uM Adriamycinfor 48 h.
..i.t-
Proc. Natl. Acad. Sci. USA 93 (1996)

Proc. Natl. Acad. Sci. USA 93 (1996) 267
Table 1. Cytotoxicity assay
Cell IL-2 Adriamycinline requirement 0.1 JIM 1.0 ,uM 10.0 ,uM
PBL109 + 65.4 ± 7.4 13.6 ± 3.4 6.6 ± 1.8PBL110 + 72.1 ± 32.9 26.3 ± 13.7 13.2 ± 6.7N1185 + 86.1 ± 8.1 41.9 ± 24.7 14.0 ± 4.8N1186 + 68.1 ± 14.6 21.3 ± 3.5 9.3 ± 2.5DA202 - 72.7 ± 3.1 40.9 ± 4.08 9.5 ± 0.9MT2 - 63.7 ± 6.6 41.3 ± 9.6 13.8 ± 1.9C1OMJ - 67.9 ± 7.9 8.3 ± 0.4 6.0 ± 0.3HUT102 - 56.7 ± 8.8 13.0 ± 0.9 7.9 ± 3.6
As demonstrated in the MTT assay and expressed as percent viablecells, chemosensitivity to Adriamycin across three orders of magnitudeof drug concentration did not correlate with the p53 status of therespective cell lines. Normal donor lymphocytes (PBL109 andPBL110) served as controls.
ment. Total cellular protein was prepared and analyzed byWestern blot revealing low basal levels ofWAF1/CIP1 proteinbut increasing as early as 3 h after drug exposure (Fig. 2).These results were obtained in both IL-2-dependent andIL-2-independent cell lines (Fig. 3). Interestingly, both IL-2-dependent cell lines demonstrated a greater relative increasein WAF1/CIP1 expression after drug treatment than theIL-2-independent cell lines. These findings support the pres-ence of a p53-independent pathway involved in the inductionof WAF1/CIP1 after Adriamycin treatment of HTLV-I-transformed lymphocytes.
Cytotoxicity and Apoptosis. Previous work has suggestedthat the presence of functional p53 is a strong determinant ofresponse to chemotherapy in transformed cell lines (10, 11).We wished to examine whether this was a universal prereq-uisite; therefore, by using HTLV-I-transformed lymphocytesdiffering in their functional p53 status, we examined thecytotoxic effect of Adriamycin. We analyzed the chemosensi-tivity of these cell lines by using the MTT assay with normaldonor lymphocytes serving as controls. Since prior studiesreported that higher doses ofDNA damaging agents could killchemoresistant cell lines despite having inactive p53 (18-21),we carried out our studies across three orders of magnitude ofdrug concentration. As displayed in Table 1, there is nocorrelation with cell viability and p53 status.An earlier report (11) demonstrated that the induction of
wild-type p53 and WAFI/CIPI correlated with G1 arrest andsusceptibility of cells to apoptosis after exposure to ionizingradiation and etoposide. We observed the induction of WAFl/CIP1 in cells with functionally inactive p53 after exposure to thegenotoxic agent Adriamycin. This finding prompted us to exam-ine whether apoptosis would occur in these cells by a p53-
c4 cs N1185 N1186 DA202 MT2 C1OMJ HUT102
c -ooo O-oO-o .oo
bp'988500400
FIG. 4. DNA oligomer formation observed on a 0.8% agarose gel.The cell lines were treated for 24 h with 0.1 ,LM-10 ,uM Adriamycinand then low molecular weight DNA was isolated for agarose gelelectrophoresis. Note the dose-response increase in DNA ladderformation. PBL with (+) or without (-) IL-2 was used as a positivecontrol for DNA ladder formation.
4*40'
*
t:' a. **.
Nl- Ste*
gF * ) j . r~0,0
at 0A.- #6* &, I t^.i6 10 *A
4IIt*
~~~~~~~, )~
0
el *,a:.I*t
FIG. 5. Immunoperoxidase detection of digoxigenin-labeledgenomic DNA staining positive for the apoptotic nuclear area. (X400.)Untreated cell lines showing only occasional positively staining nuclei:A, Nl 185; C, N1186; E, MT2; G, HutlO2. Cell lines treated with 1 ,uMAdriamycin demonstrating significant numbers of positively stainingnuclei: B, N1185; D, N1186; F, MT2; H, HutlO2. (See Table 2 forquantitation.)
independent pathway. By using an immunohistochemistry assaythat labels 3'-OH DNA ends generated by DNA fragmentationand an agarose DNA ladder assay, we measured the induction ofapoptosis in cell lines with functional and inactive p53 proteins.As depicted in Fig. 4, there is a strong dose-response
relationship in the formation of DNA oligomers consistentwith internucleosomal cleavage. While we did observe somebackground levels ofDNA ladder formation in untreated cells,this was far less than that observed in treated cell lines. Weused an additional assay to validate our findings of DNAfragmentation considered to be a hallmark of apoptosis. Fig.5 and Table 2 show a marked increase in DNA fragments in cellnuclei. Both of the above assays independently confirm thepresence of apoptosis in Adriamycin-treated cells.
Table 2. Apoptotic score
Apoptotic score (QIC)
Adriamycin Fold increaseCell line No drug (1.0 ,uM) after drug treatment
N1185 143 687 4.8N1186 45 531 11.8MT2 20 433 21.6HUT102 84 589 7.0
By utilizing the QIC score, we were able to relatively grade theinduction of apoptosis in cell lines after a 24-h exposure to 1 ,uMAdriamycin. A minimum of 500 cells were evaluated per treatmentgroup (see text for details).
Medical Sciences: Gartenhaus et aL

268 Medical Sciences: Gartenhaus et al.
DISCUSSIONEarlier work has strongly implicated p53 as an importantdeterminant of chemosensitivity (10, 11). A recent reportexamining the sensitivity of several human lymphoma cells toDNA damaging agents suggested that p53 gene mutations areoften associated with evasion of apoptotic death (11). Michieliet al. (21) have described the existence of two pathways for theinduction of WAFl/CIPl, a p53-dependent pathway activatedby DNA damage and a p53-independent pathway activated bymitogens at the entry into the cell cycle. By using HTLV-I-transformed lymphocytes that differ in their functional p53status we studied the ability ofAdriamycin, a major componentof several active lymphoma regimens (22, 23) to induceWAF1/CIP1 and apoptosis. We demonstrated that treatmentof active p53 containing cells and those with inactive proteinhave induction of WAF1/CIP1 at the RNA level with aconcomitant increase in WAF1/CIP1 protein, albeit with agreater increase observed in those cell lines with functionalp53. As has been described (8, 11, 21), basal levels of both RNAand protein are low in untreated cells. The chemosensitivity ofthese cell lines to Adriamycin was shown to be dose responsiveacross three orders of magnitude of drug concentration withchemosensitivity showing no correlation with p53 status.We investigated whether these cell lines underwent apoptosis
by using two assays to detectDNA fragmentation. Both the DNAladder agarose assay and the immunohistochemistry methodconsistently showed the induction of apoptosis in cells with andwithout functional p53 protein. Our data are consistent with p53not being the only determinant essential for the upregulation ofthe WAF1/CIP1 gene or induction of apoptosis in response togenotoxic agents. These findings would appear to differ withprevious studies describing the necessity for functional p53 pro-tein to effect an apoptotic death upon exposure to DNA dam-aging agents. However, there are two prior observations thatsupport our findings. In one study (11), a lymphoblastoid cell line,Ramos, containing only mutant p53 protein displayed chemo-sensitivity to cisplatinum and nitrogen mustard as well as DNAfragmentation comparable to cell lines with wild-type p53 pro-tein. Another group reported (21) that at higher doses Adriamy-cin induced WAFl/CIPl expression in embryonic fibroblastsderived from p53 knock-out mice. They suggested that Adriamy-cin might act through both a p53-dependent and -independentpathway albeit at different drug concentrations. Our work con-firms and extends these observations with the documentation ofWAFl/CIPl induction and apoptosis occurring in response toAdriamycin exposure of cell lines deficient in functional p53. Wedid observe greater increases in WAF1/CIP1 induction in thosecell lines with active p53, suggesting that both mechanisms maybe working concurrently. While WAF1/CIP1 functions to arrestcells in G, by associating with cyclin-Cdk complexes, the deter-minant(s) critical for undergoing apoptosis are not clear atpresent. Further studies in cell lines that have WAF1/CIP1
induction in a p53 independent manner may identify targets forrational drug development.
This work was supported by research grants from the HelenaRubinstein Foundation and the United Leukemia Fund, Inc.
1. Popovic, M., Sarin, P. S., Robert-Guroff, M., Kalyanaraman,V. S., Mann, D., Minowada, J. & Gallo, R. C. (1983) Science 219,856-859.
2. Markham, P. D., Salahuddin, S. Z., Kalyanaraman, V. S., Popo-vic, M., Sarin, P. & Gallo, R. C. (1983) Int. J. Cancer 31, 413-418.
3. Grassman, R., Dengler, C., Muller-Fleckenstein, I., Fleckenstein,B., McGuire, K., Dokhelar, M. C., Sodroski, J. G. & Haseltine,W. A. (1989) Proc. Natl. Acad. Sci. USA 86, 3351-3356.
4. Nagai, H., Kinoshita, T., Imamura, J., Murakami, Y., Hayashi, K.,Mukai, K., Ikeda, S., Tobinai, K., Saito, H., Shimoyama, M. &Shimontono, K. (1991) Jpn. J. Cancer Res. 82, 1421-1426.
5. Sakashita, A., Hattori, T., Miller, C., Suzushima, H., Asou, N.,Takatsuki, K. & Koeffler, H. P. (1992) Blood 79, 477-480.
6. Lubbert, M., Miller, C., Kahan, J. & Koeffler, H. P. (1989)Oncogene 4, 643-647.
7. Reid, R., Lindholm, P., Mireskandari, A., Dittmer, J. & Brady,J. N. (1993) Oncogene 8, 3029-3034.
8. El-Deiry, W., Tokino, T., Velculescu, V. E., Levy, D. B., Parsons,R., Trent, J. M., Lin, D., Mercer, W. E., Kinzler, K. W. &Vogelstein, B. (1993) Cell 75, 817-823.
9. Harper, J. W., Adami, G. R., Wei, N., Keyomarsi, K. & Elledge,S. J. (1993) Cell 75, 805-812.
10. Lowe, S. W., Ruley, H. E., Jacks, T. & Houseman, D. E. (1993)Cell 74, 957-962.
11. Fan, S., El-Deiry, W., Bae, I., Freeman, J., Jondle, D., Bhatia, K.,Fornace, A. J., Jr., Magrath, I., Kohn, K. W. & O'Connor, P. M.(1994) Cancer Res. 54, 5824-5828.
12. Gartenhaus, R. B., Wong-Staal, F. & Klotman, M. E. (1991)Blood 78, 2956-2961.
13. Berneman, Z., Gartenhaus, R. B., Reitz, M., Blattner, W.,Manns, A., Hanchard, B., Ikemara, O., Gallo, R. C. & Klotman,M. E. (1992) Proc. Natl. Acad. Sci. USA 89, 3005-3010.
14. Cole, S. P. (1986) Cancer Chemother. Pharmacol. 17, 259-263.15. Sambrook, J., Fritsch, E. F. & Maniatis, T. (1989) Molecular
Cloning: A Laboratory Manual (Cold Spring Harbor Lab. Press,Plainview, NY), 2nd Ed.
16. Gong, J., Traganos, F. & Darzynkiewicz, Z. (1994) Anal. Bio-chem. 218, 314-318.
17. Gavriel, Y., Sherman, Y. & Ben-Sasson, S. A. (1992) J. Cell Biol.119,493-497.
18. Kaufman, S. H. (1989) Cancer Res. 49, 5870-5874.19. Lennon, S. V., Martin, S. J. & Cotter, T. G. (1991) Cell Prolif 24,
203-207.20. Sen, S. & D'Incalci, M. (1992) FEBS Lett. 307, 102-106.21. Michieli, P., Chedid, M., Lin, D., Pierce, J. H., Mercer, W. E. &
Givol, D. (1994) Cancer Res. 54, 3391-3396.22. Coleman, M. (1985) Ann. Int. Med. 103, 140-145.23. Fisher, R. I., Gaynor, E. R., Dahlberg, S., Oken, M. M., Grogan,
T. M., Mize, E. M., Glick, J. H., Coltman, C. A., Jr., & Miller,T. P. (1993) N. Engl. J. Med. 328, 1002-1007.
24. Gartenhaus, R. B. & Wang, P. (1996) Leukemia, in press.
Proc. Natl. Acad. Sci. USA 93 (1996)