how optical networks can help reduce global warming
TRANSCRIPT

How Optical Networks can HelpReduce Global Warming
Bill St. ArnaudCANARIE Inc – www.canarie.ca
Unless otherwise noted all material in this slide deck may be reproduced,modified or distributed without prior permission of the author

The Climate ChangeImperative
> One of , if not, the greatest threat to our future society andeconomy is global warming.
> 15-30% cut in greenhouse gas emissions by 2020 will be needed tokeep the temperature increase under 2 °C, and a deeper reductionby 60-80% may be needed by 2050.*
> Past IPCC assessments have underestimated the pace of change– Latest data indicates we are at the high end of projectiosn
> It will be necessary to go beyond incremental improvements inenergy efficiency, current life-styles and business practices.Significantly more drastic measures will need to be undertaken
*International Panel on Climate Change

An inefficient truth- ICTimpact on CO2 emissions*
> It is estimated that the ICT industry alone produces CO2emissions that is equivalent to the carbon output of the entireaviation industry.
> ICT is now 5th largest industry in terms of consumption of power
> ICT emissions growth fastest of any sector in society, doublingevery 4 years
> One small computer server generates as much carbon dioxide asa SUV with a fuel efficiency of 15 miles per gallon
> Nearly 40% of servers at universities and businesses are underutilized by more than 50%.
*An Inefficient Tuth: http://www.globalactionplan.org.uk/event_detail.aspx?eid=2696e0e0-28fe-4121-bd36-3670c02eda49

Cyber-infrastructure: the scary facts
> By 2008, 50% of today’s Data Centers and major science facilities inthe US will have insufficient power and cooling;*
> By 2010, half of all Data Centers will have to relocate or outsourceapplications to another facility.*
> During the next 5 years, 90% of all companies will experience somekind of power disruption. In that same period one in four companieswill experience a significant business disruption*
> Cyber-infrastructure is often the 2nd largest consumer of electricityafter basic heat and power on university campuses
*Sourcce: http://www.nanog.org/mtg-0802/levy.html

The Problem
> Compute energy/rack : 2 kW (2000) to 30kW in 2010
> Cooling and power issues now a major factor in CI design
> But academic CI is often too small: departmental closets
> Energy use of departmental facilities is exponentiating creatingcrises of space, power, and cooling
> Unfortunately, almost nothing is known about how to makethese shared virtual clusters energy efficient, since there hasbeen no financial motivation to do so
*Sourrce: Tom Deafnti GreenLight

Solutions to reduce globalwarming
> Carbon taxes– Politically difficult to sell
> Cap and trade– Useful for big emitters like power companies– Addresses only supply side of CO2
> Carbon offsets– Immature market with no standards– But addresses demand side of CO2 by businesses and consumers
> Carbon Neutrality imposed by law– Growing in popularity especially as protests over gas tax escalates

Public Sector to be carbonneutral by 2010 in BC
> British Columbia was first government to introduce carbon tax inWestern Hemisphere
> Provincial Government in province of British Columbia hasmandated all public sector institutions to be carbon neutral by2010– Other provinces exploring to implement the same policy– New Zealand has also made the same requirements
> Many universities and businesses are adopting voluntary carbonneutrality objectives– Dell, Cisco, Google etc
> This will have big impact on university research and opticalnetworks

ENERGY MANAGEMENT 1965 - 2008SFU
Projected GHGs arebased on PlannedGrowth in Ten YearCapital Plan
Source: SFU Facilities Services
University GHG emissions

SFU
TASC2 Research Building
CI major cause of GHGemissions

Why advanced networks arecritical to reducing CO2
> Direct emissions of Internet and ICT are important at 2-3% ofworld emissions but, in order of impact, the most significantcontribution we can make is through leveraged, or indirect,emissions reductions.
> According to SMART 2020 these represent as much as a 15%reduction opportunity in global emissions.
> (And SMART 2020 is one of the most conservative reports onthe topic. Others identify even higher potential for savings).

SMART 2020
> Internet and ICT could reduce emissions by 15 per cent and saveglobal industry $US 800 billion in annual energy costs by 2020.
> Could cut CO2 greater than the current annual emissions of eitherthe US or China.
> One of the biggest contribution to reducing CO2 emissions byInternet and ICT is through “virtualization” or “de-materialization”of existing physical products and services.
> http://www.theclimategroup.org/news_and_events/news_and_comment/smart2020pressrelease

The Falsehood of EnergyEfficiency
> Most current approaches to reduce carbon footprint arefocused on increased energy efficiency of equipment andprocesses
> This approach is doomed to failure because of Khazzoom-Brookes postulate (aka Jevons paradox)– Greater energy efficiency reduces overall cost and therefore promotes
increased usage
> We need a “zero carbon” strategy because increased usagewill not change emission equation– Anything times zero is zero
> Internet networks and broadband architecture are the answer

Energy efficiency is bull---
> Lots of confusion between energy efficiency and consumptionversus CO2 emissions
> Energy efficiency is meaningless. In fact you can haveincreased energy consumption, but reduced CO2 emissions– E.g. zero carbon data centers– Life cycle CO2 emissions can exceed any savings from energy
emissions
> The only thing that counts is CO2 emissions

Optical networks and cyber-infrastructure are the solution
> Optical networks have much smaller carbon footprint and allowrelocating cyber-infrastructure equipment to zero carbon datacenters
> Significant reduced CO2 impacts are possible through use ofcyber-infrastructure tools like virtualization, clouds, SOA, grids,Web 2.0, etc.
> New “zero carbon” computer and network architectures needed toconnect remote computers, databases and instruments will beessential

> Purchasing green power locally is expensive with significant transmissionline losses–Demand for green power within cities expected to grow dramatically
> CI facilities DON’T NEED TO BE LOCATED IN CITIES–-Cooling also a major problem in cities
> Most renewable energy sites are very remote and impractical to connect toelectrical grid.–But can be easily reached by an optical network–May also meet some of government’s objectives of extending broadband torural/remote areas
> Many examples already–Green House Data, Cheyenne WO–AISO wind powered data farm–Iceland and Lithuania National strategies
“Zero Carbon” CI Facilities

“Zero Carbon” CI facilities connected byoptical networks

“The best place in North Americafor Data Center”- CIO Magazine
> Partnership between IBM and Rackforce> $100m investment – 85,000 sq ft> Cheap renewable power, well educated
community, geological stability> Hydro electric power as low as 2 cents
per kilowatt, versus 20 cents in otherjurisdiction
Kelowna BC
http://www.cio.com/article/183256/The_Best_Place_to_Build_a_Data_Center_in_North_America

ISO 14064/2/3
> ISO 14064 is the accounting process required to validatewhether a project actually reduces CO2
> ISO 14062/3 sets the measurement process for “life cycle” CO2emissions for a product or service
> You need to implement ISO 14064 process to demonstrateactual CO2 reductions– Vendors need to provide 14062/3 data for products and services

Deep dive: CO2 Accounting
Final Product
Example:Soft drinkmanufacturer$1M worth of softdrinks, around 885metric tonnes of CO2e

Calculating 14064 for yourresearch network
14062 life cycle operation 5 years coal> Optical Switch 4 tons 20 tons> Router 16 tons 500 tons> Optical Amplifiers 2 tons 40 tons> Computer server 12 tons 300 tons> Ethernet switch 8 tons 200 tons> PC 20 tons 5 tons> Travel to install and repair - 100 tons
> Total 14064 68 tons 1165 tons
> Virtualized network can save 50% of your carbon emissions

Do your 14064 NOW!!
> You can not earn credits after you implementnetwork equipment or architectures to reduce CO2
> Next year carbon is $100 per ton in Europe> Int

Economic Input-Output LifeCycle Assessment
Categorized the U.S. Economy into 491 sectors Measures the entire life-cycle of a product, from raw
materials to recycling/disposal Traces the transactions along this path Traditionally used to measure economic value added
at each step Adapted to measure environmental impact of each
step
WassilyLeontiefNobel Prize1973
Invented by Wassily Leontief Data obtained from U.S. Department of Commerce In 1949 – One of the first economic models developed
using a computer Continues to be used for economic planning
Definition and Usage
Historic Background
Provide the environmental footprint of the“average” product per category, e.g. the averageAmerican car

EIO LCA exampleGHG footprint of the average American car
Next Generation Internet toreduce Global Warming
> PROMPT: New $50m research consortium made up of BellCanada, Nortel, Ericsson, McGill, UoT– International participation including GENI, CAL-IT2, Scripps, etc
> Any future internet network, project, program or application musthave as its primary objective of a zero carbon footprint
> Zero carbon condition applies to– Remote instrumentation and laboratories– all optical, wireless and last mile networks– all routers, switches, and web servers– all applications, computers instrumentation– and all customer devices such as PCs, mobile phones, PDAs etc
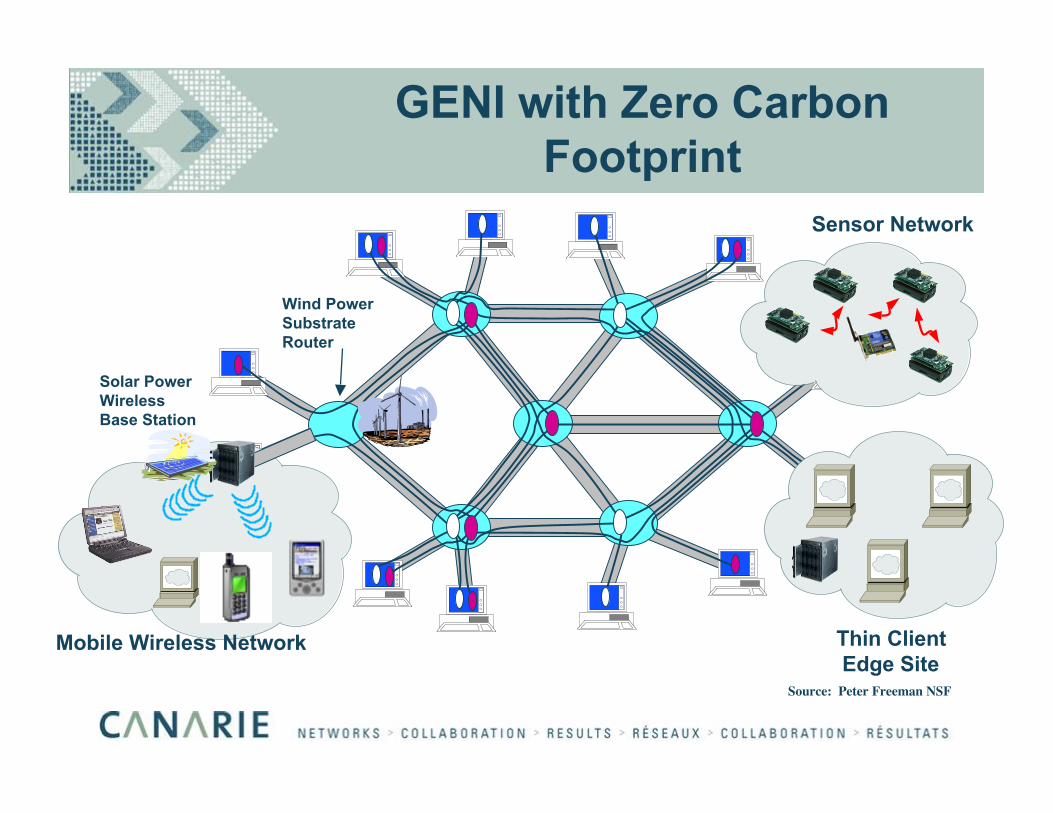
GENI with Zero CarbonFootprint
Sensor Network
Thin Client Edge Site
Source: Peter Freeman NSF
Mobile Wireless Network
Wind PowerSubstrateRouter
Solar PowerWirelessBase Station

GENI with remote nodes atrenewable energy sites
Sensor Network
Thin Client Edge Site
Source: Peter Freeman NSF
Mobile Wireless Network
Wind PowerSubstrateRouter
Solar PowerWirelessBase Station

Re-purposing currentresearch for G-NGI?
> Network virtualization (with addition of zero carbon substrate routers andswitches) – 4Ward, Federica and GENI
> Virtualization of networks and applications with SOA
> New routing and resiliency architectures for wired and wireless networksfor massively disruptive topology changes due to setting sun or waningwinds that power routers and servers
> New grid and data storage architectures with distributed replication andvirtual machines for “follow the sun” and “follow the wind” grids– Optiputer and CineGrid as precursor example
> New virtualization and de-materialization applications– CineGrid– Virtual Medicine HSVO – Stanford and Northern Medical school

Novel licensing approach
> Instead of complicated licensing agreements and royaltiespayment for IP will be made through carbon offsets
> PROMPT plans to set up a number of testbeds to develop CO2reduction protocols, verification and audit systems to measurenetworks and ICT ability to reduce CO2– Specific target will be remote instrumentation and laboratories
> PROMPT will work with various carbon offset brokerage firmsto aggregate and sell carbon offsets
> Many companies like Cisco, Google, IBM, etc will purchasecarbon offsets if you use their technology top reduce Co2

The GreenLight Project
> UCSD now deploying first component of green cyber-infrastructure toconsolidate vitrualized computer clusters and servers in energy-efficient mobile facilities.
> Every dollar spent on IT equipment will cost $2 more in power (andoverhead!)
> GreenLight uses 10 Gbps over dedicated optical fiber links so endusers move their clusters out of their faculty “closets” and into much“greener” configurations like data containers
> http://nsf.gov/awardsearch/showAward.do?AwardNumber=0821155

Carbon Rewards rather thanCarbon Taxes
> Rather than penalize consumers and businesses for carbon emissions,can we reward them for reducing their carbon emissions?
> Using Internet and ICT to provide “virtual” products and servicesdirectly as a replacement for real equivalents, but also as incentive to“reward” consumers to reduce their own carbon footprint in otheractivities– Virtual networks and computers for business– Cloud computing, Web 2.0 applications– Next generation solar powered PDAs and cell phones for access to the
Internet– eMusic, eFilm, eBooks for consumer
> Bits and bandwidth are virtually carbon free– especially if we use zero carbon data centers and optical networks

Problem: No business casefor FTTh
> Broadband networks, whether wireless or FTTx, overbuilders,municipal, requires huge capital outlay. In addition:– Low takeup – “Tyranny of the takeup”– Revenues declining as more and more applications are free– Over the top providers are capturing most of the value
> Many companies starting to offer free broadband, both wiredand wireless– Inuk, Sky, TalkTalk, Google, Microsoft, Cable and Wireless etc– Cable TV services are moving to the Internet
> Business case for closed networks like Verizon FiOS areuncertain

Carbon Reward Strategy forlast mile infrastructure
> Provide free high speed Internet and fiber to the home with resaleof electrical and gas power
> Customer pays a premium on their gas and electric bill
> Customers encouraged to save money through reduced energyconsumption and reduced carbon output
> Customer NOT penalized if they reduce energy consumption– May end up paying substantially less then they do now for gas + electricity +
broadband + telephone + cable
> Network operator gets guaranteed revenue based on energyconsumption rather than fickle triple play

Thank you
> More information> http://green-broadband.blogspot.com>