how much gastroenteritis in australia is due to food? · how much gastroenteritis in australia is...
TRANSCRIPT

FINAL DRAFT Gastroenteritis survey and foodborne estimation report OzFoodNet/NCEPH 2003
1
National Centre for Epidemiology & Population Health
How much Gastroenteritis in Australia
is due to food? Estimating the Incidence of Foodborne Gastroenteritis
in Australia
NCEPH Working Paper Number 51
September 2004
Address for correspondence: National Centre for Epidemiology & Population Health The Australian National University Canberra ACT 0200 Australia T: +61 2 6125 2378 F: +61 2 6125 0740 E: [email protected]
Dr Gillian Hall National Centre for Epidemiology and Population Health, The Australian National University, ACT
And the OzFoodNet Working Group Martyn Kirk, Food Safety & Surveillance Section, Department of Health and Ageing
Rosie Ashbolt, Public and Environmental Health, Department of Health and Human Services, TAS Joy Gregory and Karin Lalor, Communicable Disease Section, Department of Human Services, VIC
Geoff Millard, ACT Government Analytical Laboratory, Health Protection Service, ACT
Dr Jane Raupach, Communicable Disease Control Branch, Department of Human Services, SA
Mohinder Sarna, Communicable Disease Control Directorate, Department of Health, WA
Russell Stafford, Foodborne Disease Epidemiologist, Queensland Health, QLD
FINAL DRAFT Gastroenteritis survey and foodborne estimation report OzFoodNet/NCEPH 2003
2
How much Gastroenteritis in Australia is due to food? Estimating the Incidence of Foodborne Gastroenteritis in Australia. Gillian Hall And the OzFoodNet Working Group T: +61 2 6125 2378 F: +61 2 6125 0740 E: [email protected] ISBN 0-9579769-3-3 ISSN 1033-1557 © National Centre for Epidemiology & Population Health Published by the National Centre for Epidemiology & Population Health The Australian National University Canberra ACT 0200 Australia
FINAL DRAFT Gastroenteritis survey and foodborne estimation report OzFoodNet/NCEPH 2003
3
CONTENTS LIST OF TABLES.........................................................................................................4 LIST OF FIGURES........................................................................................................4 PREFACE: OZFOODNET............................................................................................5 EXECUTIVE SUMMARY................................................................................................6 ESTIMATING THE LEVEL OF FOODBORNE GASTROENTERITIS ..........................................8
1. Background .................................................................................................................8 2. Estimation Methods ..................................................................................................10
2.1 Assessing Uncertainty ..........................................................................................................................10 2.2 Literature review and Delphi process ...................................................................................................10 2.3 Data sources ........................................................................................................................................11 2.4 Estimating the total amount of infectious gastroenteritis in Australia....................................................13 2.5 Estimating the plausible number of cases of infectious gastroenteritis due to each ‘known’ pathogen 14 2.6 Estimating the proportion of cases of gastroenteritis due to foodborne transmission...........................20 2.7 Estimating the plausible number of cases due to foodborne transmission in Australia ........................21
3. Estimation results .....................................................................................................21 4. Discussion of the estimation study.........................................................................25
APPENDICES ...........................................................................................................30 Appendix 1. Under-reporting factors ..........................................................................31 Appendix 2. Delphi process .........................................................................................32
REFERENCES ..........................................................................................................33

FINAL DRAFT Gastroenteritis survey and foodborne estimation report OzFoodNet/NCEPH 2003
4
LIST OF TABLES Table 1 Source of data p14 Table 2 Factors used to adjust primary raw data p15 Table 3 Specific pathogens that cause gastroenteritis and are reported to the surveillance systems p16 Table 4 Under-reporting factors for Moderate, Bloody and Serious illness p17 Table 5 Outbreak data from Victoria 1998-2002 p18 Table 6 Data on pathogens from the WQTS longitudinal study in Melbourne, 1998 and laboratory data. p20 Table 7 Gastroenteritis in Australia in a ‘typical’year ~2000: Total number of cases and number of foodborne cases among known pathogens p23 Table 8 Number and incidence of all cases of gastroenteritis and of foodborne Gastroenteritis in Australia in a ‘typical’ year ~2000 p24 LIST OF FIGURES Figure 1 Notified cases represent only a proportion of the burden of foodborne infectious disease p12 Figure 2 Simulation of ‘Plausible distribution of number of cases of gastroenteritis in Australia around the year 2000’ Simulated N=1000 p13 Figure 3 Plausible distribution of number of cases of foodborne gastroenteritis in Australia in a ‘typical’ year ~2000. Simulated N=1000. p24

FINAL DRAFT Gastroenteritis survey and foodborne estimation report OzFoodNet/NCEPH 2003
5
PREFACE: OZFOODNET The overall brief of OzFoodNet is to enhance the surveillance and understanding of
foodborne illness in Australia. OzFoodNet is a collaboration of foodborne disease
epidemiologists largely based in Commonwealth and State/Territory health departments, and
many other players who make up the wider OzFoodNet working group. The collaboration
started in November 2000 and is funded by the Commonwealth Dept of Health and Ageing.
This paper is the second from two linked OzFoodNet/NCEPH projects, namely the
Community Gastroenteritis Survey and Estimating the Level of Foodborne Gastroenteritis in
Australia. The study team comprises the following people:
Dr Gillian Hall, National Centre for Epidemiology and Population Health, The Australian National University
Martyn Kirk, Food Safety & Surveillance Section, Department of Health and Ageing
Rosie Ashbolt, Public and Environmental Health, Department of Health and Human Services, TAS
Joy Gregory and Karin Lalor, Communicable Disease Section, Department of Human Services, VIC
Geoff Millard, ACT Government Analytical Laboratory, Health Protection Service, ACT
Dr Jane Raupach, Communicable Disease Control Branch, Department of Human Services, SA
Mohinder Sarna, Communicable Disease Control Directorate, Department of Health, WA
Russell Stafford, Foodborne Disease Epidemiologist, Queensland Health, QLD
Leanne Unicomb, Hunter Population Health, NSW
Special acknowledgement is also due to Professor Niels Becker, Ass/Professor Scott
Cameron, Dr Craig Dalton, Dr Edmond Hsu, Dr Karin Leder, Dr Paul Mead, and Dr Mark
Veitch for considerable input with various aspects of the project. Thanks are also given to
many other people who were involved at different times.

FINAL DRAFT Gastroenteritis survey and foodborne estimation report OzFoodNet/NCEPH 2003
6
EXECUTIVE SUMMARY Estimating the Incidence of Foodborne Gastroenteritis in Australia
• Of the 17 million episodes of gastroenteritis identified in a year in the gastroenteritis
survey, it is estimated that about 32%, or 5.4 (Credible interval: 4.0-6.9) million cases
are due to foodborne transmission. This equates to an incidence of 0.29 episodes per
person per year; on average, every Australian can expect to experience an episode of
foodborne illness every three to four years.
• Other similar studies to estimate the amount of foodborne gastroenteritis have been
done recently in US [1] and UK [2]. The Australian estimate is remarkably similar to
that reported for the United States of America, but higher than in the United
Kingdom. In America, 36% of all gastroenteritis was estimated to be due to foodborne
transmission and the incidence estimate is 0.28 cases per person per year.
• Almost four and a half million cases (Credible interval: 3.5-5.3) of gastroenteritis
were estimated to be due to ‘known’ pathogens. This leaves over 12 million of the
total 17 million cases estimated from the gastroenteritis survey unaccounted for. Of
the known causes, about 1.6 million (Credible interval: 1.59-1.68) are due to bacterial
infections, 2.3 million (Credible interval: 1.74-2.82) due to viral infections and 0.7
million (Credible interval: 0.44-0.97) due to parasites. About 58% of bacterial, 21%
of viral and 14% of parasitic gastroenteritis is estimated as foodborne, with an overall
total estimate of 32% (Credible interval: 24-40%) of all gastroenteritis due to
foodborne transmission. The pathogens responsible for the greatest number of
episodes of foodborne gastroenteritis are Caliciviruses, E. coli, Campylobacter and
Salmonella.

FINAL DRAFT Gastroenteritis survey and foodborne estimation report OzFoodNet/NCEPH 2003
7
Comment on Methods
• Using the methodology described in this report for estimating the number of
foodborne cases, the estimate of the incidence of all gastroenteritis is crucial for the
final estimate of foodborne disease.
• The case definition used in this study includes both severe and milder gastroenteritis
[10]
• The definition of gastroenteritis should be the same when comparing across countries
and times, as even an apparently small change in the definition can cause a large
impact on the incidence. Standardization of methods is crucial when studies are being
compared over time or place for comparison of results to be meaningful.
• The simulation method used to account for uncertainty in this Australian estimation
has an interpretation akin to Bayesian inference and is simple to use. It is important to
emphasise that there is a range of plausible values rather than one single point value,
and this technique is a means of interpreting the available data in a reasonable way.
Results are given with a ‘credible interval’ which can be interpreted in a way similar
to a 95% confidence interval.
• In this Australian calculation overseas acquired infections were accounted for and not
included.
Future estimations
• Monitoring of foodborne disease is necessary to evaluate improvements or otherwise
in the control of foodborne disease. It would be worthwhile repeating the current
study in 5-10 years time to identify any trends in Australia.
• Improved data are needed in order to improve estimations. In particular, these include:
- Data to allow better estimates of the under-reporting fraction. This includes
not only further analysis of available data, but collection of new data from
laboratories
- Further longitudinal studies with pathogen identification
Enhanced outbreak data collection

FINAL DRAFT Gastroenteritis survey and foodborne estimation report OzFoodNet/NCEPH 2003
8
• In order to compare estimations, a standardised methodology is needed. In particular,
the major issues are:
- standardised definition of gastroenteritis
- standardised data collection method for the gastroenteritis survey
- standardised method of estimating the foodborne component
ESTIMATING THE LEVEL OF FOODBORNE GASTROENTERITIS 1. Background The focus on ‘foodborne’ gastroenteritis comes from interest in the safety of the food chain.
Ongoing monitoring of the level of foodborne gastroenteritis assists in evaluating
intervention and control strategies aimed at food safety at a national level. The purpose of
estimating the burden of foodborne gastroenteritis in this study is to provide a baseline
against which trends can be measured over time.
The routes of transmission of infectious gastroenteritis vary across the known pathogens,
with many having more than one route. Transmission can be from person-to-person, from the
environment, by food, or by water. Some pathogens that cause infectious gastroenteritis are
thought to be totally foodborne, such as Bacillus cereus, while others have only a small
component of illness caused by the foodborne route, such as Rotavirus.
To estimate the burden of foodborne gastroenteritis two key estimates are required; firstly,
the total amount of gastroenteritis in the country and secondly, the proportion of
gastroenteritis that is foodborne. The product of these two estimates gives the total number of
cases of foodborne gastroenteritis. This is the basic methodology that was used in the US
recently [1] and which is applied to Australia in this report. As there is an inherent degree of
uncertainty in the data used in these calculations, a new method using simulation has been
employed to take account of this.
Total gastroenteritis The total amount of infectious gastroenteritis in Australia in one year is known from the
gastroenteritis survey described in the working paper titled “Results from the National
Gastroenteritis Survey 2001-2002”.

FINAL DRAFT Gastroenteritis survey and foodborne estimation report OzFoodNet/NCEPH 2003
9
Foodborne gastroenteritis To estimate the proportion of infectious gastroenteritis that is foodborne, gastroenteritis
identified as caused by ‘known’ pathogens is studied. The definition of ‘foodborne’ includes
any infectious gastroenteritis caused by ingestion of food, including food contaminated early
in the food chain, during processing, just before eating by food handlers, washing in
contaminated water or by contact with unhygienic surfaces.
There is a large array of ‘known’ pathogens that cause infectious gastroenteritis, and each one
has different characteristics with different laboratory tests needed to identify the various types
of micro-organism. There are also many cases of gastroenteritis with ‘unknown’ pathogens
where a pathogen is not identified at all but that are clinically assessed as ‘presumed
infectious’. Among the group of ‘unknown’ but presumed infectious cause, are cases where a
known pathogen is present but is not identified, either because the stool was not tested in a
laboratory, or it was not tested for the pathogen specifically, or the test resulted in a false
negative. Also in this group are cases where the pathogen is as yet totally unknown. There are
numerous pathogens that are now considered commonplace that were unknown only a few
decades ago, including Salmonella, Campylobacter, and viruses. It is likely that there are
many more that are major causes of morbidity, some of which will become apparent with
time and investigation.
With the assumption that the proportion of gastroenteritis due to foodborne transmission
among the ‘unknown’ causes is the same as for ‘known’ causes, the estimate of the
proportion foodborne among all ‘known’ pathogens is used as proxy for estimating the
proportion of all infectious gastroenteritis that is foodborne. For each known pathogen in
Australia, the total number of cases of gastroenteritis caused by that micro-organism, and the
number due to foodborne transmission, has been estimated as described in the following
sections.
The overall objective of this study was to estimate the number of cases of foodborne
gastroenteritis in a ‘typical year around 2000’, and to take account of uncertainty in the
estimate.

FINAL DRAFT Gastroenteritis survey and foodborne estimation report OzFoodNet/NCEPH 2003
10
2. Estimation Methods
2.1 Assessing Uncertainty While statistical uncertainty can be measured by concepts like the standard error and
confidence intervals, much of the uncertainty in the data needed for these calculations is not
statistical and is inherent in the data itself, largely due to paucity of information. Simulation
is used to take account of this, using the concept of a ‘plausible distribution of values for
Australia around the year 2000’, instead of a point estimate. Such interval estimates are
credibility intervals, with an interpretation akin to credibility intervals in Bayesian inferences.
Wherever uncertainty exists for a factor used in the calculations, a simulated distribution of
‘plausible values’ is used to model the uncertainty in that factor. In the absence of definitive
statistically sound data, the decisions about the plausible distribution of values are based on
‘a reasonable interpretation ‘ of real data. This means that the parameters of the ‘plausible
distribution’ are not necessarily based on a statistically derived value, but on interpretation of
the best available data. The properties of the different distributions are used to simulate a
1000 ‘plausible’ values within a range, with the ‘most likely’ values having the greatest
frequency. Where the properties of the distribution resulted in a few simulated values
becoming negative at the lowest extreme, these were ignored so that all simulated ranges
were from at least zero as the minimum value.
The width of the ‘credible interval’ of the final estimate is hence determined by the precision
with which each of the component probabilities are estimated.
2.2 Literature review and Delphi process For each known pathogen, a study of the literature was undertaken. The objective of the
review for each pathogen was primarily to identify suitable data sources for estimating the
number of cases in Australia, and to identify sources for estimating the proportion of
transmission that is by food. Data on transmission modes was particularly scant, and the
literature review was supplemented by opinion from a Delphi process. The ‘Delphi process’
was used to fill gaps in data and to ensure that there was agreement that the necessary
assumptions and decisions were generally acceptable to foodborne disease experts. This

FINAL DRAFT Gastroenteritis survey and foodborne estimation report OzFoodNet/NCEPH 2003
11
included a survey and consultation with ten Australian foodborne disease epidemiologists and
infectious diseases clinicians experienced in foodborne disease, about the proportion of
gastroenteritis for each pathogen that is foodborne. Some details are given in Appendix 2.
2.3 Data sources
Data was drawn from the OzFoodNet National Gastroenteritis Survey 2001/2, the National
Notifiable Surveillance System 1996-2000, the Victorian and South Australian Surveillance
Systems 1998-2001, the Victorian Outbreak Database 1998-2001, the Water Quality and
Treatment Survey in Melbourne 1998 and Laboratories in Queensland and South Australia.
OzFoodNet National Gastroenteritis Survey 2001/2 The total amount of gastroenteritis comes from the gastroenteritis survey described in the
working paper titled “Results from the National Gastroenteritis Survey 2001-2002”.
Notifiable Surveillance System 1996-2000
There is mandatory reporting of illnesses due to certain pathogens to the state and territory
surveillance systems by doctors and, in all bar one state, by laboratories. However, it is
inevitable that the surveillance will not capture all cases in the community, as many cases
will not even present to a doctor, and of those that do, many will not have a stool test taken.
There has been little work done in Australia on under-reporting to the surveillance systems,
and the under-reporting fractions for different pathogens are largely unknown in this country.
The state systems have some differences in reporting practices and the fraction of all
community cases that are actually reported probably varies by locality. Ultimately, data from
the state systems is reported to the National Notifiable Diseases Surveillance System
(NNDSS).

FINAL DRAFT Gastroenteritis survey and foodborne estimation report OzFoodNet/NCEPH 2003
12
Figure 1 shows the multiple steps in the process of notifying a case of foodborne disease.
Figure 1 Notified cases represent only a proportion of the burden of foodborne infectious disease
The under-reporting fraction is the product of the proportions at each step of the pyramid:
Under Reporting Fraction=PDoctor x PStool x PLabPos x PReported.
An ‘over-reporting fraction’ is theoretically possible if extra cases are erroneously entered on
the surveillance database. This is unlikely to be a consistent occurrence. The inverse of the
under-reporting fraction is the factor used to calculate the number of cases in the community
from the surveillance data.
Victorian Outbreak Database 1998-2001 For some pathogens the best available data is from the database of outbreak investigations in
the state of Victoria. During investigation the number of cases was recorded and this is used
as the raw starting data to estimate the number of cases of gastroenteritis in the community.
Adjustments are made to account for under-reporting.
Water Quality and Treatment Survey in Melbourne 1997-99 A randomised controlled trial of the effect of filtering drinking water was carried out in
Melbourne in 1997-1999 [3]. Six hundred families with children were followed for 15
months, and all cases of gastroenteritis were reported. The filtering had no effect on diarrhoea
incidence. About one third of gastroenteritis cases submitted a stool sample for testing. For
each pathogen, the proportion of positive stool tests form the basis for estimating the number
of cases nationally, by applying the proportion to the total number of cases of gastroenteritis
nationally in one year.
3.SOME HAVE POSITIVE LAB TEST
2. SOME HAVE STOOL
ORDERED & SUBMITTED
1. SOME CASES PRESENT TO GP
TOTAL CASES IN COMMUNITY
4.
SOME REPORTED
TO SURVEILLANCE
FINAL DRAFT Gastroenteritis survey and foodborne estimation report OzFoodNet/NCEPH 2003
13
Laboratories in Queensland and South Australia. The proportion of stools submitted for testing that are positive for a particular pathogen is
used to calculate the estimate of all gastroenteritis due to that pathogen.
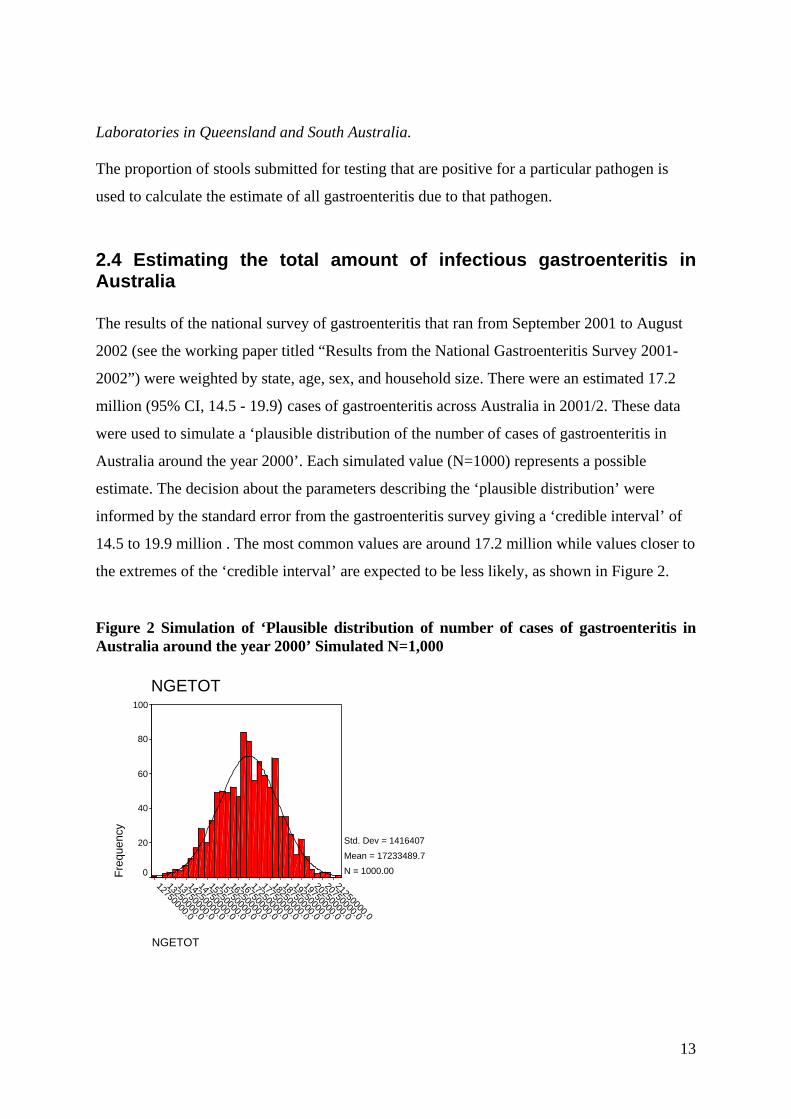
2.4 Estimating the total amount of infectious gastroenteritis in Australia The results of the national survey of gastroenteritis that ran from September 2001 to August
2002 (see the working paper titled “Results from the National Gastroenteritis Survey 2001-
2002”) were weighted by state, age, sex, and household size. There were an estimated 17.2
million (95% CI, 14.5 - 19.9) cases of gastroenteritis across Australia in 2001/2. These data
were used to simulate a ‘plausible distribution of the number of cases of gastroenteritis in
Australia around the year 2000’. Each simulated value (N=1000) represents a possible
estimate. The decision about the parameters describing the ‘plausible distribution’ were
informed by the standard error from the gastroenteritis survey giving a ‘credible interval’ of
14.5 to 19.9 million . The most common values are around 17.2 million while values closer to
the extremes of the ‘credible interval’ are expected to be less likely, as shown in Figure 2.
Figure 2 Simulation of ‘Plausible distribution of number of cases of gastroenteritis in Australia around the year 2000’ Simulated N=1,000
NGETOT
21250000.0
20750000.0
20250000.0
19750000.0
19250000.0
18750000.0
18250000.0
17750000.0
17250000.0
16750000.0
16250000.0
15750000.0
15250000.0
14750000.0
14250000.0
13750000.0
13250000.0
12750000.0
NGETOT
Freq
uenc
y
100
80
60
40
20
0
Std. Dev = 1416407 Mean = 17233489.7N = 1000.00

FINAL DRAFT Gastroenteritis survey and foodborne estimation report OzFoodNet/NCEPH 2003
14
2.5 Estimating the plausible number of cases of infectious gastroenteritis due to each ‘known’ pathogen
The objective was to estimate the number of cases due to each of all known pathogens in
Australia in a ‘typical year’ around 2000 and then to estimate the number of these that were
foodborne. A total of 26 ‘known ‘ pathogens were considered. In order to estimate the total
number of cases of infectious gastroenteritis caused by these pathogens each year in
Australia, data were drawn from sources as listed in the following Table 1. Some pathogens
were not considered to cause foodborne-gastroenteritis in Australia, leaving 17 pathogens for
further exploration.
Table 1 Sources of data Surveillance data National or State 1996-2001
Outbreak data Victoria 1998-2002
Longitudinal data Melbourne 1998
Laboratory data SA and Qld
Not foodborne-GE cases in Australia
Campylobacter Bacillus cereus E coli other Aeromonas
Not foodborne Clostridium difficile
Salmonella Clostriduim perfringens
Caliciviruses Vibrio paraheamolyticus
Not GE Brucella spp
Shigella Staph aureus Rotavirus
Listeria
Shiga Toxin Like E.coli
Vibrio vulnificus Astro/Adeno viruses
Toxoplasma gondii
Cryptosporidium parvum
Hepatitis A
Cyclospora cayetanensis Giardia lamblia
Only aquired OS Salmonella Typhi Vibrio cholera 0136
No cases in Aust
Trichinella spiralis Botulism
Adjustments were made for population coverage, proportion acquired overseas, and under-
reporting to surveillance. The various factors used to calculate the plausible number of cases
in Australia in a typical year varied according to the type of primary data source as shown in
Table 2.

FINAL DRAFT Gastroenteritis survey and foodborne estimation report OzFoodNet/NCEPH 2003
15
Table 2 Factors used to adjust primary raw data Primary data source Factors used to adjust primary raw data
1. Surveillance data
National or State
Proportion of
population covered
Proportion acquired
overseas
Proportion reported
to surveillance from
community
2. Outbreak data
Victoria
Proportion of
population covered
Under-reporting of
outbreaks compared
with surveillance
Proportion reported
to surveillance from
community
3. Longitudinal survey
data Melbourne
Proportion stools
with pathogen
Gastroenteritis total
in Australia
4. Laboratory data SA
and Qld
Proportion stools
with pathogen
Gastroenteritis total
in Australia
(i) Surveillance data The specific pathogens that cause gastroenteritis and are reported to the NNDSS are listed in
Table 3, together with the number of notifications from 1996-2000.The pathogens include
Campylobacter, Salmonella, Shigella, Shiga Toxin Like E.coli and Yersinia. The South
Australian Surveillance System has enhanced surveillance of bloody E. Coli so data for this
pathogen was from SA only. New South Wales does not notify Campylobacter.

FINAL DRAFT Gastroenteritis survey and foodborne estimation report OzFoodNet/NCEPH 2003
16
Table 3 Specific pathogens that cause gastroenteritis and are reported to the surveillance systems Pathogen/ syndrome
Campylo bacter
Salmonella Shigella Shiga Toxin Like E.coli
Yersinia
Comments 66% of population reports
Not found in Hellard study
South Australia screens all bloody stools (8% population)
Dropped after 2001 as declined. Not found in Hellard study
Overseas acquired
4%
8%
40%
21%
2%
Data used in estimation
All states except NSW
All states & territories
All states & territories
SA only
All states & territories
Illness severity
Moderate
Moderate Bloody stools
Bloody stools
Moderate
Nreports/yr 1996 12176 5791 679 - 212 1997 11829 6953 797 - 202 1998 13445 7712 612 18 171 1999 12803 7436 554 51 128 2000 13528 6111 487 41 74
Adjustments for population and overseas acquired cases Data on some pathogens were from a proportion of the Australian population only and so
adjustments were made accordingly. Estimates of the proportion of overseas-acquired
infections came from the Victorian and South Australian notification systems. Data were
adjusted by removing the proportion of cases that were acquired overseas.
Adjustment for under-reporting of illnesses from the community to the notification database Given the paucity of pathogen specific data about under-reporting in Australia, the illnesses
due to pathogens notified to the Australian Surveillance System were classified by severity,
and under-reporting factors for Moderate illness, Bloody diarrhoea and Serious illness were
estimated for Australia, similar to the strategy used in the US [1]. These factors were
estimated using information from Victorian outbreak data 1998-2002, results from the
Melbourne Water Quality Gastroenteritis Study [3] [4]and the OzFoodNet/NCEPH National

FINAL DRAFT Gastroenteritis survey and foodborne estimation report OzFoodNet/NCEPH 2003
17
Gastroenteritis Survey 2002 [10]. A plausible distribution for the notifiable fraction is used
rather than a single estimate, to allow for the uncertainty in the estimates.
The under-reporting factors for Moderate, Bloody and Serious illness are shown in Table 4.
Table 4 Under-reporting factors for Moderate, Bloody and Serious illness. Severity of illness Information used for estimation Estimate
and Credible interval Moderate illness Australian Surveillance data
Melbourne WQTS 1 Victorian outbreak data2 for Salmonella National Gastroenteritis Survey Hunter Salmonella case-control study3
1 in 15 (5 to 25)
Bloody diarrhoea
National Gastroenteritis Survey
1 in 9 (1 to 17)
Serious illness
Mead 19994
1 in 2 (1 to 3)
Sources: 1Hellard, 2002 [3]
2 Joy Gregory, DHS Victoria, 2002[5] 3Kefle Yohannes, MAppEpid Bound Volume, 2002[6] 4Mead 1999[1]
In the calculations for determining the under-reporting factor, the sensitivity of laboratory
tests was estimated to be about 90% (based on estimates for Salmonella and Shigella testing
in Australia, D. Lightfoot personal communication) and laboratory reporting to surveillance
was estimated at 100%. More details of the information used to estimate the under-reporting
factors are given in Appendix 1.
The simulation distributions based on the raw data for each pathogen in the Surveillance
Systems was multiplied by the simulated distributions of the relevant under-reporting factor
to produce estimates and credibility intervals of the total number of cases of gastroenteritis in
one year in Australia due to each of these pathogens.

FINAL DRAFT Gastroenteritis survey and foodborne estimation report OzFoodNet/NCEPH 2003
18
(ii) Outbreak data
A number of pathogens are identified in outbreaks but are not reported to surveillance as
individual cases. Outbreak data maintained by the Victorian department of health represented
the best source of data for three such pathogens, namely Bacillus cereus, Clostriduim
perfringens and Staphylococcus aureus. This data is shown in Table 5.
Table 5 Outbreak data from Victoria 1998-2002 Pathogen
Bacillus cereus Clostriduim perfringens
Staphylococcus aureus
Ncases/yr 1998 9 32 0 1999 0 72 33 2000 37 73 40 2001 0 61 0 2002(6mths only) 0 28 7 Source Data supplied by J.Gregory, DHS Victoria.
The raw data of the number of cases identified during outbreaks between 1998 and 2002 was
used to simulate a plausible distribution of the number identified in a ‘typical year’ by
adjusting for population, under-reporting of outbreaks to surveillance and under-reporting of
community cases to surveillance.
Adjustments for population
The data is from the population of Victoria which is 25% of the total Australian population so
the population factor was four.
Adjustment for under-reporting of outbreaks compared with surveillance The ‘outbreak factor’ describes the relationship between the number of cases identified in
outbreaks, and the number of cases that would have been identified by surveillance had the
micro-organism been a notifiable illness. Since the pathogens of interest are not actually
reported to surveillance, the outbreak factor was based on data for Salmonella which was
reported to both surveillance and the outbreak database in Victoria 1998-2002. The plausible
distribution of the outbreak factor was deduced from a comparison of the number of
notifications of Salmonella and the number of cases of Salmonella identified in outbreaks.
FINAL DRAFT Gastroenteritis survey and foodborne estimation report OzFoodNet/NCEPH 2003
19
On average, there were 14 times as many notifications in Victoria as cases identified in
outbreaks, with variability each year. The outbreak factor was simulated as a normal
distribution with mean 14, and a credible interval of 6-22.
Adjustment for under-reporting of illnesses from the community to the notification database
The illness severity for the three pathogens is classed as ‘moderate’, so the under-reporting
factor for moderate illness was used.
(iii) Survey and laboratory data The number of cases of illness due to E. coli (other than enteroheamorrhagic E. coli),
Caliciviruses, Rotavirus, Astro/Adeno viruses, Cryptosporidium parvum, Cyclospora
cayetanensis, Giardia Lamblia, and Toxoplasmosis gondii were derived from the longitudinal
study in Melbourne conducted in 1997-9 [3].
The number of cases of illness due to Aeromonas was derived from laboratory data in South
Australia in 1994-5 [7] and Queensland laboratory data 2001 was used for Vibrio
paraheamolyticus (data from Russell Stafford personal communication).
The proportion of stools positive for these pathogens is shown in Table 6.

FINAL DRAFT Gastroenteritis survey and foodborne estimation report OzFoodNet/NCEPH 2003
20
Table 6 Data on pathogens from the WQTS longitudinal study in Melbourne 1998, and laboratory data. Pathogen N stools tested
And N positives Proportion 95%CI
1998/9 Melbourne
(Hellard 2001)
E. coli other 53/791 0.067 0.051-0.081
Caliciviruses 75/703 0.107 0.085-0.132
Rotavirus 11/791 0.014 0.007-0.025
Astro/Adeno viruses 9/791 0.011 0.005-0.021
Cryptosporidium parvum 13/791 0.016 0.009-0.028
Cyclospora cayetanensis Nil - -
Giardia lamblia 20/791 0.025 0.016-0.039
Toxoplasmosis gondii Nil -
Laboratory data
Aeromonas 248/107600 0.002 0.0020-0.0026
Vibrio parahaemolyticus 2/30880 0.00006 0.00001-0.0002
The estimate of the number of cases of gastroenteritis in a year in Australia due to each of
these pathogens was based on a simulated binomial distribution for the proportion of stools
that were found in the survey, multiplied by the simulated distribution of the total amount of
gastroenteritis in Australia (see Figure 2 previously).
2.6 Estimating the proportion of cases of gastroenteritis due to foodborne transmission
For each ‘known’ pathogen, the proportion of cases of illness that are foodborne was
estimated from Victorian outbreak data, a literature review, and from the Delphi process.
Outbreak data that gave a proportion of cases that were assessed as of foodborne origin was
available for Bacillus cereus (100% foodborne), Campylobacter (88%), Clostridium
perfringens (100%), Salmonella (97%), Shigella (0%), Calicivirus (24%), Rotavirus (0%),
Cryptospordium parvum (0%) and Giardia lamblia (0%). This data was used in the Delphi
process to arrive at a consensus of a plausible range for the proportion foodborne for each
pathogen.

FINAL DRAFT Gastroenteritis survey and foodborne estimation report OzFoodNet/NCEPH 2003
21
The plausible range of the number of foodborne cases for each ‘known’ pathogen was
obtained by multiplying the number (simulated plausible range) of all cases of gastroenteritis
by the proportion (simulated plausible range) foodborne.
2.7 Estimating the plausible number of cases due to foodborne transmission in Australia For each of the ‘known’ pathogens, the total number of cases of gastroenteritis, and the total
number of foodborne cases, were obtained by adding the values across all pathogens. The
overall proportion of foodborne cases among ‘known’ pathogens was then calculated by
dividing the number (simulated plausible range) of foodborne cases by the number (simulated
plausible range) of total cases.
By assuming that the proportion of gastroenteritis that is foodborne is the same for both the
‘known’ and the ‘unknown’ cases of gastroenteritis, the total number of cases of foodborne
gastroenteritis was then obtained by multiplying the total number (simulated plausible range)
of cases of gastroenteritis in the country by the overall proportion (simulated plausible range)
foodborne. The credible interval for the final estimate is hence determined by the simulated
plausible ranges used in all the components of the arithmetic functions.
3. Estimation results
For each pathogen, Table 7 shows
- the total number of cases of gastroenteritis,
- the proportion of cases that were estimated to be foodborne,
- and the number of cases due to foodborne transmission
About four and a half million cases (Credible interval: 3.7-5.5) of gastroenteritis were
estimated to be due to the ‘known’ pathogens. This leaves over 12 million of the total 17
million cases estimated from the gastroenteritis survey unaccounted for. Of the known
causes, about 1.6 million (Credible interval: 1.17-2.10) are due to bacterial infections, 2.3
million (Credible interval: 1.74-2.82) are due to viral infections and 0.7 million (Credible
interval: 0.44-0.97) are due to parasites. About 58% of bacterial, 21% of viral and 14% of

FINAL DRAFT Gastroenteritis survey and foodborne estimation report OzFoodNet/NCEPH 2003
22
parasitic gastroenteritis is estimated as foodborne, with an overall total estimate of 32%
(Credible interval: 24-40%) of all gastroenteritis due to foodborne transmission. The
pathogens responsible for the greatest number of episodes of foodborne gastroenteritis are
Caliciviruses, E. coli, Campylobacter and Salmonella.
The total number of cases of foodborne gastroenteritis was then obtained by multiplying the
plausible distribution of the total number of cases of gastroenteritis (17.2 million; Credible
interval: 14.5 to 19.9), by the proportion that is estimated to be foodborne (0.32; Credible
interval: 0.24-0.40). The resultant number of cases of foodborne gastroenteritis has mean 5.4
million with a credibility interval of 4.0-6.9 million cases of foodborne gastroenteritis per
year in Australia. These results are summarised in Figure 3 and Table 8.
Among the cases of foodborne gastroenteritis, 1.5 million (Credible interval: 1.0-1.9) are due
to ‘known’ pathogens and the remainder are due to ‘unknown’ pathogens. The incidence of
foodborne gastroenteritis is estimated at 0.29 (Credible interval: 0.23-0.35) cases per person
per year.

FINAL DRAFT Gastroenteritis survey and foodborne estimation report OzFoodNet/NCEPH 2003
23
Table 7 Gastroenteritis in Australia in a ‘typical’ year~2000: Total number of cases and number of foodborne cases among known pathogens
PATHOGEN Total Number of cases of GE
in Australia Proportion of cases of GE
that are foodborne Number of cases of GE
that are foodborne Credible interval Credible interval Credible interval Median Low High Median Low High Median Low High BACTERIA Aeromonas 39444 31702 47186 0.25 0.12 0.38 9768 4141 15395 Bacillus cereus 6900 0 15842 1 1.00 1.00 6900 0 15842 Campylobacter 276507 89772 463242 0.75 0.67 0.83 208246 66834 349658 Clostridium perfringens 43085 437 85733 1 1.00 1.00 43085 437 85733 E. coli (SLTEC bloody) 3041 0 6451 0.65 0.48 0.82 1927 0 4206 E. coli (other diarrhea) 1151638 796527 1506749 0.5 0.32 0.68 562979 294812 831146 Salmonella 91974 26355 157593 0.87 0.81 0.93 80605 23085 138125 Shigella 3216 0 6928 0.1 0.04 0.16 298 0 737 Staphylococcus aureus food poisoning 14189 0 29773 1 1.00 1.00 14189 0 29773 Vibrio parahaemolyticus 1075 0 2614 0.71 0.54 0.88 736 0 1845 Yersinia 2166 0 4491 0.75 0.63 0.87 1621 0 3399 Total bacteria 1639181 1175020 2103342 0.58 0.44 0.72 946985 587690 1306280
VIRUSES Caliciviruses 1831586 1361086 2302086 0.25 0.12 0.38 446117 192546 699688 Rotavirus 241153 98202 384104 0.02 0.01 0.03 4676 707 8645 Astro /adenovirus 189710 63394 316026 0.1 0.02 0.18 17545 0 36775 Total viruses 2276130 1735060 2817200 0.21 0.11 0.31 470161 214487 725835
PARASITES Cryptosporidium parvum 270978 254763 287193 0.1 0.02 0.18 25083 0 54277 Giardia lamblia 429989 232396 627582 0.05 0.01 0.09 20282 0 41105 Total parasites 703996 442081 965911 0.14 0.04 0.24 65953 18168 113738 TOTAL 4639364 37486101 5513367 0.32 0.24 0.40 1476822 1030642 1923002
FINAL DRAFT Gastroenteritis survey and foodborne estimation report OzFoodNet/NCEPH 2003
24
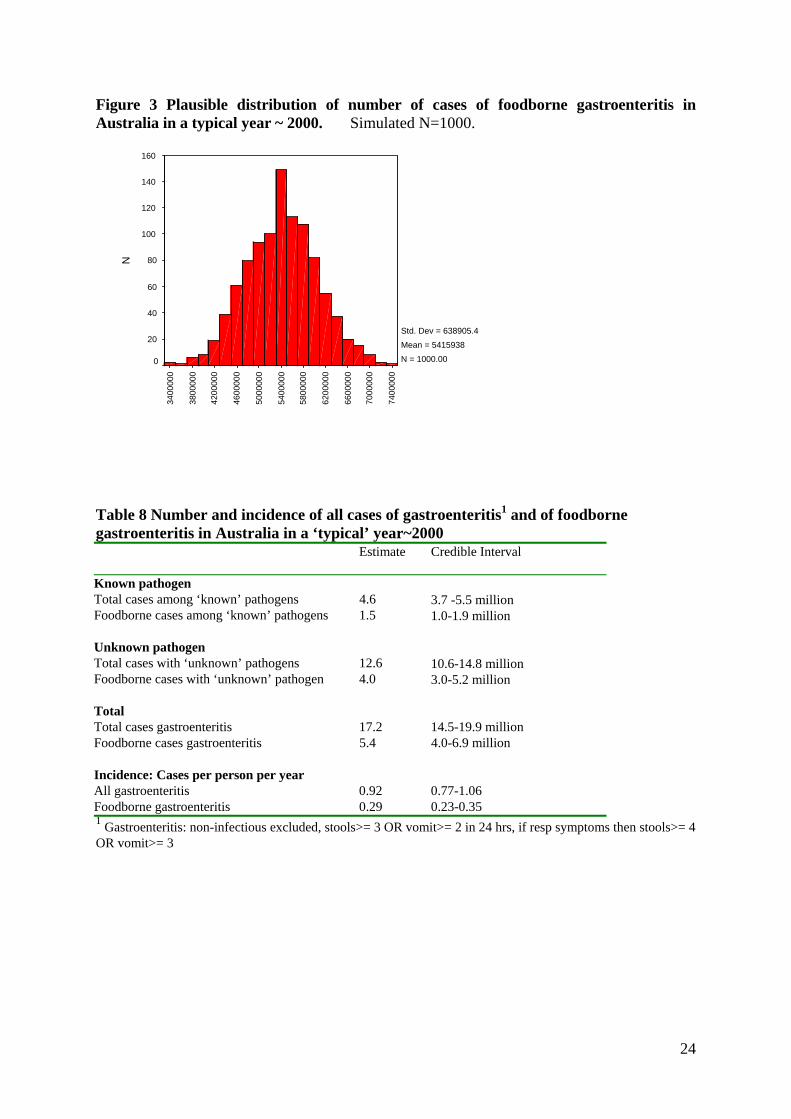
Figure 3 Plausible distribution of number of cases of foodborne gastroenteritis in Australia in a typical year ~ 2000. Simulated N=1000.
7400
000
7000
000
6600
000
6200
000
5800
000
5400
000
5000
000
4600
000
4200
000
3800
000
3400
000
N
160
140
120
100
80
60
40
20
0
Std. Dev = 638905.4 Mean = 5415938N = 1000.00
Table 8 Number and incidence of all cases of gastroenteritis1 and of foodborne gastroenteritis in Australia in a ‘typical’ year~2000 Estimate
Credible Interval
Known pathogen Total cases among ‘known’ pathogens 4.6 3.7 -5.5 million Foodborne cases among ‘known’ pathogens 1.5 1.0-1.9 million Unknown pathogen Total cases with ‘unknown’ pathogens 12.6 10.6-14.8 million Foodborne cases with ‘unknown’ pathogen 4.0 3.0-5.2 million Total Total cases gastroenteritis 17.2 14.5-19.9 million Foodborne cases gastroenteritis 5.4 4.0-6.9 million Incidence: Cases per person per year All gastroenteritis 0.92 0.77-1.06 Foodborne gastroenteritis 0.29 0.23-0.35 1 Gastroenteritis: non-infectious excluded, stools>= 3 OR vomit>= 2 in 24 hrs, if resp symptoms then stools>= 4 OR vomit>= 3

FINAL DRAFT Gastroenteritis survey and foodborne estimation report OzFoodNet/NCEPH 2003
25
4. Discussion of the estimation study Summary of main findings
Of the 17 million episodes of gastroenteritis identified in a year in the gastroenteritis survey,
it is estimated that about 32%, or 5.4 (4.0-6.9) million cases, are due to foodborne
transmission. This equates to an incidence of 0.29 episodes per person per year which means
that on average, every Australian can expect to experience an episode of foodborne illness
every three to four years.
Using the methodology described in this report for estimating the number of foodborne cases,
the estimate of the incidence of all gastroenteritis is crucial for final estimate of foodborne
disease. The definition of gastroenteritis in this study was 3 loose stools or 2 vomits in 24
hours, with adjustment for those with respiratory symptoms to account for diarrhoea and
vomiting secondary to a primary respiratory system. The decision to use this definition was a
collective outcome of the Delphi process, involving ten foodborne disease experts in
Australia. This definition includes “mild to moderate illness” as well as more “serious
illness”. It should be borne in mind that if the focus had been on more severe gastroenteritis,
such as illness that interferes with daily activities, or duration of 3 days or more, or some
other criteria, then we would have considerably less cases of gastroenteritis due to foodborne
disease.
Across countries, different case definitions of gastroenteritis and different methodologies of
collecting data make comparisons of the estimate of gastroenteritis very problematic.
Other similar studies of the amount of foodborne gastroenteritis have been done recently in
US [1] and UK [2]. The Australian estimate is remarkably similar to that reported for the
United States of America, but higher than in the United Kingdom. In America, 36% of all
gastroenteritis was estimated to be due to foodborne transmission and the incidence estimate
is 0.28 cases per person per year.
In the UK in 1995, the total amount of gastroenteritis in the community was much lower than
Australia or US at only 0.2 cases per person per year. [8]. Some possible methodological
reasons that may have influenced the estimate of a lower incidence of total gastroenteritis

FINAL DRAFT Gastroenteritis survey and foodborne estimation report OzFoodNet/NCEPH 2003
26
from the UK survey compared with the US and Australia were discussed at the end of the
working paper titled “Results from the National Gastroenteritis Survey 2001-2002”.
The proportion of gastroenteritis estimated to be due to foodborne transmission was also
lower in the UK. In 1995, there were an estimated 2.37 million infections due to foodborne
gastroenteritis which is only 26% of the total estimate of all gastroenteritis of nearly 10.5
million [2]. One of the key influential estimates among ‘known’ pathogens is for Calicivirus;
this was assessed as contributing a very high number of gastroenteritis cases in all three
countries. Only 10% of NLV (Caliciviruses) gastroenteritis was ascribed to foodborne
transmission in the UK study, compared with 40% in the US, and 20% in Australia[1, 2].
Both the UK and Australian estimates were based on outbreak data. In the UK, the low total
estimate of community gastroenteritis (0.2 cases per person per year) combined with a low
proportion thought to be foodborne (26%) leads to a very low estimate of foodborne
gastroenteritis of 0.04 cases per person per year in the UK in 1995.
The UK study also compared estimates between 1992 and 2000, using adjusted annual
General Practitioner surveillance data for the total estimate of gastroenteritis, and adjusted
laboratory data for the individual pathogens. The number of laboratory reports for all
infectious gastroenteritis was about 123,000 in 1992 and 117,000 in 2000, suggesting a stable
situation. However, the estimate for foodborne gastroenteritis decreased from 2.9 to 1.3
million cases.
The change in the estimates for foodborne gastroenteritis suggest that the number of people
reported as visiting GPs and/or the proportion of gastroenteritis that is foodborne must have
changed over the ten years, although these numbers are not given. A change in GP visits for
gastroenteritis seems unexpected given the stable number of reports from laboratories.
In the UK calculations it is not clear whether the same ‘proportion due to food ‘ was applied
at different times (that is, using the 1995 estimate of 26% for 1992 and 2000) or whether
different proportions were estimated at the different time points. If the estimates were based
on data at each time point, the influence of changed reporting must be borne in mind. The
number of infections reported to laboratories due to ‘unknown’, Yersinia and Clostridium
perfringens and Salmonella declined over the period 1992 to 2000, but the number due to
Norwalk Like Virus increased. The decline for the bacterial pathogens is presumably real, but

FINAL DRAFT Gastroenteritis survey and foodborne estimation report OzFoodNet/NCEPH 2003
27
the increase in NLV is likely to be related to increased and improved laboratory testing. As
the UK authors themselves point out, the potential influence of Norwalk Like Virus on the
calculations is considerable, and so the possible influence of changed laboratory practices on
the proportion foodborne needs to be carefully assessed.
The need for Improved and Standardised Methodology
The importance of a standardised methodology when comparing results of the amount of
foodborne gastroenteritis across countries or times cannot be overemphasised. Not only the
study design is likely to be influential, but also the definition of gastroenteritis. In this
Australian study, the definition took some account of those with concurrent respiratory
symptoms but most studies estimating the amount of gastroenteritis have not considered this.
The US study [1] adjusted for those with respiratory illness, by excluding a proportion of
cases that were thought likely to have symptoms secondary to respiratory infections rather
than a primary gastro-intestinal infection. The UK definition of gastroenteritis was different
from the Australian definition in several ways. While there are differing arguments that can
be raised about the ‘best definition’ of gastroenteritis, the main concern is to have a
consistent, reasonable definition for comparative purposes.
The studies in the US and UK did not account for uncertainty, which is inherent in the type of
calculations used for estimation of the foodborne component. The simulation method used in
this Australian estimation to account for uncertainty has an interpretation akin to Bayesian
inference and is simple to use. It is important to emphasise that there is a range of plausible
values rather than one single point value, and this technique is a means for interpreting the
available data in a reasonable way. In this Australian calculation overseas-acquired infections
were accounted for and not included.
Strengths and limitations of the data
In this study, as in others overseas, each of the data sources had strengths and weaknesses and
data gaps remain. Notification data and outbreak data are likely to be subject to reporting
variation across jurisdictions, over times and by illness, which can affect the estimate of the
amount of foodborne gastroenteritis. The National Gastroenteritis Survey provided useful
information for estimating the level of under-reporting to surveillance, and other data were
also used to gain insight into this, including data from outbreak investigations. Outbreak data
represents only those episodes of illness that are ultimately recognised as linked, and as such
FINAL DRAFT Gastroenteritis survey and foodborne estimation report OzFoodNet/NCEPH 2003
28
is possibly more likely to be ‘serious’ illness and biased towards a smaller under-reporting
factor. Both the under-reporting factor and outbreak factor used in the calculations were
largely based on reports of Salmonella, but the factors are likely to be illness specific. Further
work to improve the estimates of under-reporting would be very beneficial to improve the
calculations, and in addition, to provide more insight into the surveillance systems in
Australia.
The Melbourne longitudinal study represents the best data of its kind in Australia [3].
However, it should be remembered that it was based on families with children in one locality,
and bias of the pathogen estimates is possible due to the age distribution of the sample,
clustering by person and household, and especially the constrained locality. About one third
(795 of 2669) of gastroenteritis cases actually submitted a stool, so this may represent more
severe cases, or cases early in the study when enthusiasm was higher, which could lead to
differences due to seasonality of illness caused by different pathogens. While a wide range of
pathogens were sought, there were still some ‘known’ pathogens that were not tested for.
Only 17% of the stools examined had a pathogen identified.
Two important issues regarding the National Gastroenteritis Survey that would benefit from
further enquiry are recall bias and the influence of the case definition.
Future estimations
Monitoring of foodborne disease is necessary to evaluate improvements or otherwise in the
control of foodborne disease. The study in the UK [2] suggests that the level of foodborne
gastroenteritis has declined in the last decade and it would be worthwhile repeating the
current study in 5-10 years time to identify any trends in Australia.

FINAL DRAFT Gastroenteritis survey and foodborne estimation report OzFoodNet/NCEPH 2003
29
Improved data are needed in order to improve estimations. In particular, these include:
• Data to allow better estimates of the under-reporting fraction. This includes
not only further analysis of available data, but collection of new data from
laboratories
• Further longitudinal studies with pathogen identification
• Enhanced outbreak data collection
In order to compare estimations, a standardised methodology is needed. In particular, the
major issues are:
• standardised definition of gastroenteritis
• standardised data collection method for the gastroenteritis survey
• standardised method of estimating the foodborne component

FINAL DRAFT Gastroenteritis survey and foodborne estimation report OzFoodNet/NCEPH 2003
30
APPENDICES

FINAL DRAFT Gastroenteritis survey and foodborne estimation report OzFoodNet/NCEPH 2003
31
Appendix 1 Under-reporting factors Factors for moderate, bloody and serious illness
The factor for moderate illness was derived from several data sources. Data on outbreaks in
Victoria due to Salmonella, indicated that about one case of Salmonellosis in six was reported
to surveillance. The Melbourne longitudinal study [3] provided data that suggested under-
reporting factors for Salmonella of 23, and Campylobacter of 21, when extrapolated rates
were compared with the number of notifications in Australia. The gastroenteritis survey
results regarding duration of illness being an important predictor for visiting a doctor and
having a stool sample taken was combined with information about the duration of Salmonella
infections from a case-control study in the Hunter region of NSW. This indicated an under-
reporting factor of 11 for Salmonella [6].
Given this information, a distribution of the Moderate Illness Reporting Factor was simulated
to be a normal distribution, with one reported illness in every 15 illnesses in the community,
with a credible interval of 5 to 25.
The factor for bloody diarrhoea was derived from the national gastroenteritis survey. Twelve
cases had bloody diarrhoea and of these, three saw a doctor and two of these had a stool
taken. Although the number of cases is extremely small, similar results were found in the US
gastroenteritis surveys, which lends some validity to the results [9]. The fraction of bloody
stools that had a stool test was 0.17(95%CI: 0.07,0.32), or conversely, for 3-14 cases of
bloody stool in the community, one had a stool test. Given this information, and allowing for
further uncertainty about the sensitivity of the laboratory test and reporting to surveillance, a
plausible distribution of the Bloody Diarrhoea Reporting Factor was simulated to be a normal
distribution, with one reported illness in every 9 illnesses in the community, with a credible
interval of 1 to 17.
The under-reporting factor for serious disease was taken as one in every two illnesses in the
community, the same as the US estimate [1], with credible interval 1 to 3.
FINAL DRAFT Gastroenteritis survey and foodborne estimation report OzFoodNet/NCEPH 2003
32
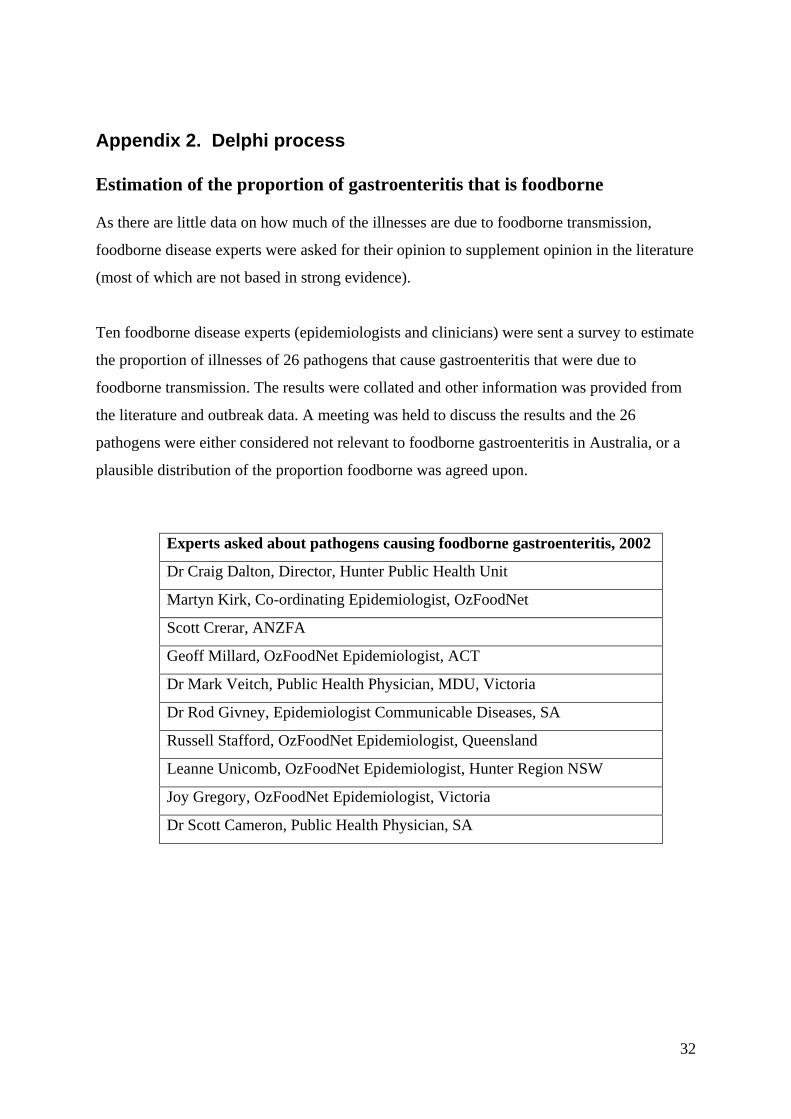
Appendix 2. Delphi process Estimation of the proportion of gastroenteritis that is foodborne As there are little data on how much of the illnesses are due to foodborne transmission,
foodborne disease experts were asked for their opinion to supplement opinion in the literature
(most of which are not based in strong evidence).
Ten foodborne disease experts (epidemiologists and clinicians) were sent a survey to estimate
the proportion of illnesses of 26 pathogens that cause gastroenteritis that were due to
foodborne transmission. The results were collated and other information was provided from
the literature and outbreak data. A meeting was held to discuss the results and the 26
pathogens were either considered not relevant to foodborne gastroenteritis in Australia, or a
plausible distribution of the proportion foodborne was agreed upon.
Experts asked about pathogens causing foodborne gastroenteritis, 2002
Dr Craig Dalton, Director, Hunter Public Health Unit
Martyn Kirk, Co-ordinating Epidemiologist, OzFoodNet
Scott Crerar, ANZFA
Geoff Millard, OzFoodNet Epidemiologist, ACT
Dr Mark Veitch, Public Health Physician, MDU, Victoria
Dr Rod Givney, Epidemiologist Communicable Diseases, SA
Russell Stafford, OzFoodNet Epidemiologist, Queensland
Leanne Unicomb, OzFoodNet Epidemiologist, Hunter Region NSW
Joy Gregory, OzFoodNet Epidemiologist, Victoria
Dr Scott Cameron, Public Health Physician, SA

FINAL DRAFT Gastroenteritis survey and foodborne estimation report OzFoodNet/NCEPH 2003
33
REFERENCES 1. Mead, P., et al., Food-related illness and death in the United States. Emerging
infectious diseases, 1999. 5(5). 2. Adak, G., S. Long, and S. O'Brien, Trends in indigenous foodborne disease and
deaths, England and Wales: 1992-2000. Gut, 2002. 51: p. 832-841. 3. Hellard, M., et al., A randomised, Blinded, Controlled Trial Investigating the
Gastrointestinal Health Effects of Drinking Water Quality. Env Health Pers, 2001. 109(8): p. 773-778.
4. Sinclair, M., et al., Pathogens causing community gastroenteritis in Australia. Australian Society for Infectious Disease Conference. Poster presentation., 2002.
5. Gregory, J., Personal communication. 2002: DHS Victoria. 6. Yohannes, K., Masters of Applied Epidemiology, Bound Volume, in NCEPH. 2002,
Australian National University: Canberra. 7. Kirk, M., Masters of Applied Epidemiology, Bound Volume, in NCEPH. ?1998,
Australian National University: Canberra. 8. Wheeler, J., et al., Study of infectious intestinal disease in England: rates in the
community , presenting to general practice, and reported to national surveillance. BMJ, 1999. 318(17 April): p. 1046-1050.
9. Voetsch, D., et al., Estimate of the Burden of Illness Caused by Nontyphoidal Salmonella infections in the United States. ?, 2003 in press.
10. Hall, G et al. Results from the National Gastroenteritis Survey 2001-2002, NCEPH Working Papers, 2004.

NCEPH PUBLICATIONS
NATIONAL CENTRE FOR EPIDEMIOLOGY AND POPULATION HEALTH: PUBLICATIONS
NCEPH Working Papers
Working Paper No. 1 Aboriginal Mortality in Central Australia, 1975-77 to 1985-86: a comparative analysis of levels and trends Khalidi NA April 1989 ISBN 0 7315 0801 7 Published in A Gray (Ed) A Matter of Life and Death: Contemporary Aboriginal Mortality, Aboriginal Studies Press 1990 ISBN 0 5575 291 X Working Paper No. 2 Discovering Determinants of Australian Aboriginal Population Health Gray A May 1989 ISBN 0 7315 0629 4 Working Paper No. 3 Predicting the course of AIDS in Australia and evaluating the effect of AZT: a first report Solomon PJ, Doust JA, Wilson SR June 1989 ISBN 0 7315 0660 X Working Paper No. 4 The Medicover Proposals Deeble J August 1989 ISBN 0 7315 0737 1 Working Paper No. 5 Intergovernmental relations and health care Butler JRG August 1989 Published as 'Health Care' in B Galligan, O Hughes, C Walsh (Eds), Intergovernmental Relations and Public Policy, Allen and Unwin, Sydney, 1991, pp 163-89 ISBN 0 7315 0740 1 Working Paper No. 6 Aboriginal Fertility: trends and prospects Gray A October 1989 Published in Journal of the Australian Population Association, vol 7, 1 May 1990, pp 57-77 ISBN 0 7315 0809 2 Working Paper No. 7 The public versus the policies: the ethical basis of Australian retirement income policy McCallum J November 1989 ISBN 0 7315 0798 3
Working Paper No. 8 Aboriginal Fertility in Central Australia Khalidi NA November 1989 ISBN 0 7315 0825 4 Working Paper No. 9 The Dynamics of Community Involvement in Old Age: the syndrome of underuse McCallum J November 1989 ISBN 0 7315 0826 Working Paper No. 10 Noncontributory Pensions for Developing Countries: rehabilitating an old idea McCallum J December 1989 ISBN 0 7315 0838 6 Working Paper No. 11 Predicting the Prevalence of a Disease in a Cohort at Risk Mackisack M, Dobson AJ, Heathcote CR December 1989 ISBN 0 7315 0839 4 Working Paper No. 12 The Changing Pattern of Coronary Heart Disease in Australia Heathcote CR, Keogh C, O'Neill TJ December 1989 ISBN 0 7315 0839 4 Working Paper No. 13 Analysis of Components of Demographic Change Gray A March 1990 Published in Mathematical Population Studies 1991, 3:1, pp 21-38 ISBN 0 7315 0877 7 Working Paper No. 14 Day Surgery: cost reducing technological change? Butler JRG April 1990 ISBN 0 7315 0889 0 Working Paper No. 15 Disease and the Destruction of Indigenous Populations Kunitz SJ April 1990 ISBN 0 7315 0889 0

NCEPH PUBLICATIONS
Working Paper No. 16 Projections of Acquired Immune Deficiency Syndrome in Australia using Data to the end of September 1989 Solomon PJ, Fazekas de St Groth C, Wilson SR April 1990 ISBN 0 7315 0889 0 Working Paper No. 17 Fluoridation of Public Water Supplies and Public Health: an old controversy revisited Hill AM, Douglas RM June 1990 ISBN 0 7315 0910 2 Working Paper No. 18 Do Treatment Costs Vary by Stage of Detection of Breast Cancer? Butler JRG, Furnival CM, Hart RFG July 1990 ISBN 0 7315 1000 3 Working Paper No. 19 Repetition Strain Injury in Australia: Medical Knowledge and Social Movement Bammer G, Martin B August 1990 ISBN 0 7315 1095 X Working Paper No. 20 Occupational Disease and Social Struggle: the case of work-related neck and upper limb disorders Bammer G August 1990 ISBN 0 7315 1096 8 Working Paper No. 21 Australian Mandatory Retirement Challenged McCallum J November 1990 ISBN 0 7315 1148 4 Working Paper No. 22 Nonlinear Component of Variance Models Solomon PJ, Cox DR January 1991 ISBN 0 7315 1144 1 Working Paper No. 23 A Model for Estimating the Incremental Cost of Breast Cancer Screening Programs Butler JRG, Hart RFG February 1991 ISBN 0 7315 1197 2 Working Paper No. 24 The Neurogenic Hypothesis of RSI Quintner J, Elvey R May 1991 ISBN 0 7315 1197 2
Working Paper No. 25 The Means Test on the Japanese Kosei Pension: Wages versus hours adjustment Keiko S, McCallum J August 1991 ISBN 0 7315 1269 3 Working Paper No. 26 Tax Expenditures on Health in Australia: 1960-61 to 1988-89 Butler JRG, Smith JP August 1991 ISBN 0 7315 1269 3 Working Paper No. 27 Blood Donation and Human Immunodeficiency Virus Infection: do new and regular donors present different risks? Jones ME, Solomon PJ December 1991 ISBN 0 7315 1328 2 Working Paper No. 28 Fiscal Stress and Health Policy in the ACT Butler JRG, Neill AL December 1991 ISBN 0 7315 1329 0 Working Paper No. 29 AIDS in Australia: reconstructing the epidemic from 1980 to 1990 and predicting future trends in HIV disease Solomon PJ, Attewell EB December 1991 ISBN 0 7315 1355 X Working Paper No. 30 The Health of Populations of North Queensland Aboriginal Communities: change and continuity Kunitz SJ, Santow MG, Streatfield R, de Craen T June 1992 ISBN 0 7315 1402 5 Working Paper No. 31 The Relevance of Concepts of Hyperalgesia to "RSI" Cohen M, Arroyo J, Champion D November 1992 ISBN 0 7315 1447 5 With 7 commentaries in G Bammer (Ed) Discussion Papers on the Pathology of Work-Related Neck and Upper Limb Disorders and the Implications for Diagnosis and Treatment ISBN 0 7315 1447 5 Working Paper No. 32 Overuse Syndrome and the Overuse Concept Fry HJH January 1993 ISBN 0 7315 1507 2

NCEPH PUBLICATIONS
Working Paper No. 33 Issues in Conducting a Cost-Benefit Analysis of Lead Abatement Strategies Butler JRG January 1994 ISBN 0 7315 1899 3 Working Paper No. 34 Supporting Aboriginal Health Services: a program for the Commonwealth Department of Human Services and Health. (Also titled: Beyond the Maze) Bartlett B, Legge D December 1994 ISBN 0 646 22396 8 Working Paper No. 35 Cost Benefit Analysis and Mammographic Screening: A Travel Cost Approach Clarke PM March 1996 ISBN 0 7315 2423 2 Working Paper No. 36 Paving the Way for the Cost-effective Reduction of High Cholesterol: Achieving Goals for Australia’s Health in 2000 and Beyond Antioch KM, Butler JRG, Walsh MK June 1996 ISBN 0 7315-2424 1 Working Paper No. 37 Economic Aspects of Lower Urinary Tract Symptoms in Men and Their Management Butler JRG November 1996 ISBN 0-7315- 2542 6 Working Paper No. 38 A Microsimulation Model of the Australian Health Sector: Design Issues Butler JRG December 1996 ISBN 0 7315 2542 7 Working Paper No. 39 Cardiovascular Disease Policy Model: A Microsimulation Approach Mui SL January 1997 ISBN 0 7315 2546 9 Working Paper No. 40 The Economic Value of Breastfeeding in Australia Smith JP, Ingham LH, Dunstone MD May 1998 ISBN 0 7315 2879 4
Working Paper No. 41 Valuing the Benefits of Mobile Mammographic Screening Units Using the Contingent Valuation Method Clarke PM August 1998 ISBN 0-7315-2896-4 Working Paper No. 42 Integrated Health Records Mount C, Bailie R April 1999 ISBN 0-7315-3316-X Working Paper No. 43 Estimating Elasticities of Demand for Private Insurance in Australia Butler JRG May 1999 ISBN 0-7315-3317-8 Working Paper No. 44 Policy Change and Private Health Insurance: Did the Cheapest Policy do the Trick Butler JRG October 2001 ISBN 0-9579769-0-9 Working Paper No. 45 Coinsurance Rate Elasticity of Demand for Medical Care in a Stochastic Optimization Model Sidorenko, A November 2001 ISBN 0-9579769-1-7 Working Paper No. 46 Estimating disease-specific costs of GP services in Australia Butler JRG, Britt H November 2001 ISBN 0-9579769-2-5 Working Paper No. 47 The Pasts and Futures of Private Health Insurance in Australia Quinn C December 2002 ISBN 0-9750180-1-9 Working Paper No. 48 Modelling Australia’s Private Health Insurance Industry Manners P July 2003 ISBN 0-9750180-3-5 Working Paper No. 49 The Impact of Health Care on Mortality: Time Trends in Avoidable Mortality 1968 - 2001 Korda RJ, Butler JRG September 2004 ISBN 0-9752400-1-3

NCEPH PUBLICATIONS
Working Paper No. 50 Results from the National Gastroenteritis Survey 2001 - 2002 Hall G and the OzFoodNet Working Group September 2004 ISBN 0-9579769-4-1
NCEPH Discussion Papers NCEPH Discussion Paper No. 1 W(h)ither Australian General Practice? Douglas RM, Saltman DC 1991 ISBN 0 7315 1319 3 NCEPH Discussion Paper No. 2 Health Information Issues in General Practice in Australia Douglas RM, Saltman DC (Eds) 1991 ISBN 0 713 1318 5 NCEPH Discussion Paper No. 3 Integrating General Practitioners and Community Health Services Saltman DC, Martin C, Putt J 1991 ISBN 0 7315 1323 1 NCEPH Discussion Paper No. 4 Speaking for Themselves: Consumer Issues in the Restructuring of General Practice Broom DH 1991 ISBN 0 7315 13177
NCEPH Discussion Paper No. 5 Too Many or Too Few?: Medical Workforce and General Practice in Australia Douglas RM, Dickinson J, Rosenman S, Milne H 1991 ISBN 0 7315 1350 9 NCEPH Discussion Paper No. 6 Money Matters in General Practice Financing Options and Restructuring Veale BM, Douglas RM 1992 ISBN 0 7315 1324 X NCEPH Discussion Paper No. 7 Everyone's Watching: Accreditation of General Practice Douglas RM, Saltman DC 1992 ISBN 0 7315 1409 2 NCEPH Discussion Paper No. 8 Teaching Teaches! Education about and for general practice through the divisional structure Douglas RM, Kamien M, Saltman DC (Eds) 1993 ISBN 0 7315 1568 4
NCEPH Discussion Paper No. 9 Rural Health and Specialist Medical Services Stocks N, Peterson C 1994 ISBN 0 7315 2051 3 NCEPH Discussion Paper No. 10 Advancing General Practice through Divisions McNally CA, Richards BH, Mira M, Sprogis A, Douglas RM, Martin CM 1995 ISBN 0 7315 2136 6 NCEPH Discussion Paper No. 11 Proceedings of the General Practice Thinktank Douglas RM (ed) 1995 ISBN 0 7315 2162 5 NCEPH Discussion Paper No. 12 Mixed Feelings: Satisfaction and Disillusionment Among Australian General Practitioners Bailie R, Sibthorpe B, Douglas RM, Broom Dorothy, Attewell R, McGuiness C 1997 ISBN 0 7315 28190 NCEPH Discussion Paper No. 13 Discontent and Change: GP Attitudes to Aspects of General Practice Remuneration and Financing Sibthorpe B, Bailie R, Douglas RM, Broom D 1997 ISBN 0 73152820 4 NCEPH Discussion Paper No. 14 Summary Proceedings of the Health on Line Discussion Forum Edited by Mount C 1998 ISBN 0 7315 2795 X NCEPH Discussion Paper No. 15 Proceedings of the Second Health on Line Discussion Forum Edited by Mount C 1998 ISBN 0 7315 2895 6
NCEPH Discussion Paper No. 16 Proceedings of the Third Health on Line Discussion Forum Editor Douglas RM 1998 ISBN 0-7315-4619-9 NCEPH Discussion Paper No. 17 Aboriginal Health Initiatives in Divisions of General Practice During the Move to (Outcomes Based) Block Grant Funding 1998-1999 Sibthorpe Beverly, Meihubers Sandra, Griew Robert, Lyttle Craig and Gardner Karen ISBN 0-7315-3327-5

NCEPH PUBLICATIONS
Working papers: Record Linkage Pilot Record Linkage Pilot Study Working Paper No. 1 The NCEPH Record Linkage Pilot Study: A preliminary examination of individual Health Insurance Commission records with linked data sets McCallum J, Lonergan J, Raymond C 1993 ISBN 0 7315 1880 2 Record Linkage Pilot Study Working Paper No. 2 The New "SF-36" Health Status Measure: Australian Validity Tests McCallum J 1994 ISBN 0 7315 2045 9 (No further papers to appear in this series)
Working papers in Women’s Health Working Papers in Women's Health No. 1 Advancing Australian women's health: time for a longitudinal study. A report for researchers and health planners Sibthorpe B, Bammer G, Broom D, Plant A 1993 ISBN 0 7315 1824 1 Working Papers in Women's Health No. 2 Advancing Australian women's health: time for a longitudinal study. A community report Sibthorpe B, Bammer G, Broom D, Plant A 1993 ISBN 0 7315 1828 4 Working Papers in Women's Health No. 3 From Hysteria to Hormones: Proceedings of National Women’s Health Research Workshop Broom, Dorothy & Mauldon, Emily (eds) 1995 ISBN 0 7315 2170 6 (No further papers to appear in this series)
Feasibility Research into the Controlled Availability of Opioids Stages 1 & 2. Volume 1 of Feasibility Research into the Controlled Availability of Opioids Report and Recommendations Foreword by Douglas RM Executive Summary by Bammer G, Douglas RM Report and Recommendations by Bammer G July 1991 ISBN 0 7315 1235 9 Volume 2 of Feasibility Research into the Controlled Availability of Opioids Background Papers Includes papers by : Stevens A, Dance P & Bammer G; Rainforth J; Hartland N; Martin B; Norberry J; Bammer G, Rainforth J & Sibthorpe BM; Ostini R & Bammer G; Crawford D & Bammer G; Bammer G, Douglas RM & Dance P July 1991 ISBN 0 7315 1236 7 Heroin Treatment New Alternatives: Proceedings of a Seminar held 1 November 1991 Ian Wark Theatre, Becker House, Canberra Edited by Bammer G, Gerrard G 1992 Working Paper No. 1 Estimating the Nos of Heroin Users in the ACT Larson A October 1992 ISBN 0 7315 1459 9 Working Paper No. 2 Australian Drug Markets Research: What are we Doing? Where are we Going? What are the Gaps? Editor: Bammer G May 1993 ISBN 0 7315 1571 4 Working Paper No. 3 Drug use and HIV risk among homeless and potentially homeless youth in the Australian Capital Territory Sibthorpe BM, Sengoz A, Bammer G in collaboration with the Youth Affairs Network of the ACT June 1993 ISBN 0 7315 1586 2 Working Paper No. 4 Becoming an ex-user: Would the controlled availability of heroin make a difference? Bammer G, Weekes S August 1994 ISBN 0 7135 1818 7

NCEPH PUBLICATIONS
Working Paper No. 5 Does childhood sexual abuse contribute to alcohol, heroin and/or other drug problems? Proceedings of a one-day workshop held at the National Centre for Epidemiology and Population Health, The Australian National University, Tuesday 22 June 1993 Editor: Bammer G September 1993 ISBN 0 7315 1843 8 Working Paper No. 6 "It will kill us faster than the white invasion" Humes G, Moloney M, Baas Becking F, Bammer G December 1993 ISBN 0 7315 1820 9 Working Paper No. 7 Economic issues in a trial of the controlled provision of heroin Butler, JRG, Neil A January 1994 ISBN 0 7315 1898 5 Working Paper No. 8 Issues for designing and evaluating a 'Heroin Trial" Three Discussion Papers Report on a workshop on trial evaluation Bammer G, McDonald DN An evaluation of possible designs for a heroin trial Jarrett RG, Solomon PJ Service Provision considerations for the evaluation of a heroin trial. A discussion paper. McDonald DN, Bammer G, Legge DG, Sibthorpe BM February 1994 ISBN 0 7315 1905 1 Working Paper No. 9 How could an influx of users be prevented if Canberra introduces a trial of controlled availability of heroin? Bammer G, Tunnicliff D, Chadwick-Masters J April 1994 ISBN 0 7315 2019X Working Paper No. 10 How would the controlled availability of heroin affect the illicit market in the Australian Capital Territory? An examination of the structure of the illicit heroin market and methods to measure changes in price, purity and availability, including heroin-related overdoses Bammer G, Sengoz A with assistance from Stowe A, Anderson I, Lee C, Tunnicliff D, Ostini R May 1994 ISBN 0 7315 2024 6
Working Paper No. 11 Civil liability issues associated with a 'heroin trial' Cica N June 1994 ISBN 0 7315 2047 5 Working Paper No. 12 Statistical issues in planning a randomised controlled 'heroin trial" Attewell RG, Wilson SR July 1994 ISBN 0 7315 2062 9 The Foreword - An evaluation strategy for a 'Heroin Trial' Bammer G Working Paper No. 13 Criminal Liability Issues Associated with a ‘Heroin Trial’ Bronitt, Simon May 1995 ISBN 07315 2159 5 Part 1: Drug Law in Australia Part II: Criminal Liability for Causing Harm to Trial Participants Part III: Criminal Liability for the Crimes Committee by Trial Participants Part IV: Miscellaneous Issues ISBN 0-7315 2159-5 Working Paper No. 14 International Perspectives on the Prescription of Heroin to Dependent Users: A collection of papers from the United Kingdom, Switzerland, the Netherlands and Australia Editor: Bammer G January 1997 ISBN 0 7315 2539 6 Report and Recommendations of Stage 2 Feasibility Research into the Controlled Availability of Opioids Bammer G June 1995 ISBN 07315 2159 5 Other publications published by NCEPH Veterans' Servicing Profiles: consultancy report to the Department of Veterans Affairs McCallum J, Hefferan C 1990 Elder Abuse: A Survey Matiasz S, McCallum J 1990 Health Financing Think Tank: proceedings and summary of a meeting in Bungendore, 27-28 November 1989 Douglas RM (Ed) 1990 ISBN 0 7315 1224 3

NCEPH PUBLICATIONS
Abuse of the Elderly at Home McCallum J, Matiasz S, Graycar A 1990 Published jointly with NCEPH by the South Australian Commissioner for the Ageing. Ethnic Women in the Middle: A focus group study of daughters caring for older migrants in Australia. Report to the Commonwealth Department of Community Services and Health, Health and Community Services Research and Development Grants Committee McCallum J, Gelfand DE August 1990 ISBN 0 7315 1097 6 A Matter of Life and Death: contemporary Aboriginal mortality. Proceedings of a workshop of NCEPH held at Kioloa, 10-12 July 1989 Gray A (Ed) December 1990 ISBN 0 85575 219 X Ageing and Families 7 Years After: Data from a seven year follow-up of older Australians McCallum J, Kendig H, Freeman E, Rosenberg B, Coles R, Brown V, Martin MJC 1991 ISBN 0 7315 1339 8 General Practice Financing Think Tank Douglas R (Ed) 1991 ISBN 0 7315 1224 3 Improving Australia's Health: The role of primary health care The Final Report of the 1991 Review of the Role of Primary Health Care in Health Promotion Legge DG, McDonald DN, Benger C 1992 ISBN 0 7315 1432 7 An evaluation of successful ageing, ACT: a community project for all ages Campbell S December 1993 Trends in Mortality: by causes of death in Australia, the States and Territories during 1971–72, and in statistical divisions and sub-divisions during 1991–92 Jain SK Joint publication: NCEPH & ABS 1994 Hospital Morbidity Patterns and Costs of Immigrants in Australia Kliewer EV, Butler, JRG 1995 ISBN 0 7315 2158 7 ABS Catalogue No. 3313.0
Export of Aged Care Services Training McCallum J (Ed) 1995 ISBN 0 7315 2197 8 What Divisions Do: An analysis of divisions’ infrastructure activities for 1993–94 Todd R, Sibthorpe B 1995 ISBN 0 7315 2312 1 What Divisions Did Next Todd R, Sibthorpe B 1997 ISBN 0 7315 2559 0 Profile of Divisions of General Practice: 1995/96 Todd R, Sibthorpe B, Todd C 1998 ISBN 0 7315 3301 1 Developing Health: Conference Proceedings Broom D, Gallagher V (Eds) 1998 ISBN 0 7315 3324 0 “Bumpa Shooters”: A study of the smoking habits among the Aboriginal and Torres Strait Islander community of the ACT region Moloney M, Mozley JW October 1998 ISBN 0 7315 3306 They’ll Just Read About Us In Storybooks: Estimations of the number of young Indigenous people using illegal drugs in the ACT and region Dance P, Brown R, BammerG 2000 Needs for residential aged care and other services by the older Indigenous population in the ACT and region Dance P, Brown R, Bammer G, Sibthorpe B 2000 ISBN 0 7315 3333 X I Want To Be Heard: an analysis of needs of Aboriginal and Torres Strait Islander drug users in the ACT and region for treatment and other services. Dance P, Tongs J, Guthrie J, McDonald D, D'Souza R, Cubillo C, Bammer G. 2004 ISBN 0-9752400-0-5