evaluation of the effect of crumb rubber properties on the
TRANSCRIPT

Evaluation of the Effect of Crumb Rubber Properties on the Performance of Asphalt Binder
by
Clayton Daniel Plemons
A thesis submitted to the Graduate Faculty of
Auburn University
in partial fulfillment of the
requirements for the Degree of
Master of Science in Civil Engineering
Auburn, Alabama
May 5, 2013
Keywords: rubber, surface area, cryogenic, ambient, asphalt, performance
Copyright 2013 by Clayton Plemons
Approved by
Richard Willis, Chair, Assistant Professor of Civil Engineering
Randy West, Co-chair, Director of the National Center for Asphalt Technology
David Timm, Co-chair, Professor of Civil Engineering

ii
Abstract
The purpose of the research was to determine the most influential factors of
crumb rubber that affect the performance characteristics of crumb rubber modified
binder. The first phase of the study required the characterization of crumb rubber
products used for asphalt binder modification. The second phase of the study consisted
of asphalt binder modification and quantification of the influence of crumb rubber
properties through performance testing of the binder. The third phase of the study
investigated strategies to reduce the separation tendency of crumb rubber modified
binder. The study shows that asphalt binder is influenced by rubber content and the
mean particle size of crumb rubber modifier. The study concluded that mean particle
size is the most influential crumb rubber property characterizing modified asphalt
binder separation tendency.

iii
Acknowledgments
This research would not be possible without the materials provided by Liberty
Tire Recycling, Lehigh Technologies, Blacklidge Emulsions, and Vestenamer. The
resources and staff at the National Center for Asphalt Technology also made this
research possible. The characterizations of the crumb rubber products required for this
study were not conducted at Auburn University. Lehigh Technolgies is credited with
characterizing the gradation and chemical composition of the crumb rubber.
Quantachrome is credited with the determination of the surface area properties of the
rubber products.

iv
Table of Contents
Abstract ....................................................................................................................................................... ii
Acknowledgments ..................................................................................................................................... iii
List of Tables ............................................................................................................................................... v
List of Figures ............................................................................................................................................ vii
Chapter 1: Introduction ............................................................................................................................. 1
Chapter 2: Literature Review ...................................................................................................................... 5
Chapter 3: Rubber Characterization ......................................................................................................... 26
Chapter 4: Characterization of Crumb Rubber Modified Binders ............................................................ 40
Chapter 5: Statistical Analysis of Crumb Rubber Properties on Modified Binders ................................. 59
Chapter 6: Effect of Additive ..................................................................................................................... 67
Chapter 7: Conclusions and Recommendations ....................................................................................... 74
References ............................................................................................................................................... 78
Appendix A ............................................................................................................................................ A-1
Appendix B ............................................................................................................................................ B-1

v
List of Tables
Table 1: RO-TAP Results for Crumb Rubber Particle Analysis .................................................... 31
Table 2: Additional Crumb Rubber Properties ........................................................................... 32
Table 3: Crumb Rubber Designated Mesh Sizes and Material Source ...................................... 33
Table 4: Crumb Rubber Particle Size ........................................................................................... 34
Table 5: Thermogravimetric Results .......................................................................................... 36
Table 6: Surface Area Results ..................................................................................................... 39
Table 7: Viscosity of Rubber Modified Blends ........................................................................... 46
Table 8: Crumb Rubber Modified Binder Performance Grade .................................................. 47
Table 9: AASHTO MP19-10 MSCR Performance Criteria ............................................................ 49
Table 10: MSCR Results ............................................................................................................... 51
Table 11: Separation DSR Results ............................................................................................... 54
Table 12: Softening Point Results .............................................................................................. 59
Table 13: Pearson Correlation Table for Binder Performance ................................................... 61
Table 14: True High Performance Grade ANOVA ...................................................................... 63
Table 15: True Low Performance Grade ANOVA ........................................................................ 64
Table 16: Separation Performance Grade Percent Difference ANOVA ...................................... 65
Table 17: Separation Softening Point Percent Difference ANOVA ............................................. 66

vi
Table 18: Summary of Statistical Analyses ................................................................................. 67
Table 19: Performance Grade of Additive Modified Materials .................................................. 70
Table 20: Softening Point for Additive Modified Materials ........................................................ 72
Table 21: MSCR Results for Additive Modified Materials ........................................................... 73
vii
List of Figures
Figure 1: Example Crumb Rubber Sample Preparation ............................................................. 41
Figure 2: Example Vortex Resulting in Properly Mixed Crumb Rubber Binder ......................... 43
Figure 3: 25mm Disc of Binder and DSR Testing Plates ............................................................. 44
Figure 4: Example 1mm Testing Gap ......................................................................................... 45
Figure 5: Example Set of Separated Materials ............................................................................ 53
Figure 6: Ring and Ball Softening Point Apparatus .................................................................... 57

1
Chapter 1: Introduction
Background
Approximately 270 million scrap tires are produced annually in the United States.
In addition to this annual waste, there are an estimated 800 million scrap tires
stockpiled. Stockpiled tires are an environmental danger by providing fuel sources for
unplanned fires as well as creating breeding habitats for vermin and mosquitoes (Rafat
Siddique, 2004). Recycling or repurposing scrap tires alleviates many of the
environmental issues associated with stockpiling and growing waste of the materials. An
estimated 80 percent of the scrap tires produced annually since 2003 have been
recycled or repurposed (Amirkhanian, 2006). The majority of the scrap tires have been
utilized in tire derived fuel applications where tires are used as energy for heating. Civil
engineering applications are the second largest sector utilizing scrap tires. These
applications range from embankment fill to modifiers for asphalt pavements. Use of
recycled rubber as an asphalt pavement modifier has been common for decades in
several states. Field performance of thousands of projects has shown when used
properly, scrap rubber can be successfully integrated and recycled in asphaltic mixtures.

2
While experience has shown using recycled rubber in asphalt mixtures is
feasible, there are varying methods for incorporating the rubber into pavement which
affect the overall performance of the mixture. The two main methods of rubber
modification are the dry method and the wet method. The dry method was developed
in 1986 by Takallou and utilizes coarse rubber particles as a portion of the aggregate
gradation. Dry mixes can incorporate a relatively high amount of rubber with typical
mixes consisting of approximately 3 percent rubber. The wet method stems from a
binder modification process developed by Charles McDonald in 1964. This method
utilizes finely ground rubber particles to modify asphalt binder used in asphalt paving
mixtures. The wet method uses rubber contents up to 20 percent by the weight of the
asphalt binder (Brown, 1993). While the dry method can incorporate more recycled
rubber, inconsistent dispersion of the rubber particles throughout the mixture have led
to poor performance on numerous projects. Conversely, the particle size of the rubber
used in the wet processes and the addition of the rubber directly to the binder better
disperses the rubber material allowing modified mixtures to have more effective rubber
modification. This process has led to pavements that exhibit better performances
compared to dry method modified pavements (Marvin Myhre, 2002).
Different grinding temperatures exist for producing crumb rubber products
which ultimately can affect the texture of the rubber itself. The two main categories of
crumb rubber production temperatures are ambient grinding and cryogenic grinding.
Ambient grinding occurs at normal or slightly elevated temperatures and yields
materials with high surface areas and irregular shapes and textures. Cryogenic grinding

3
utilizes liquid nitrogen to make the rubber brittle for grinding. Cryogenic grinding results
in materials with relatively low surface areas and regular blocky shapes (West, Randy,
1998). Common processes for grinding the materials are Crackermilling, Granulating,
Micromilling, and Cryogenic. Past binder testing has shown that grinding method has a
measurable influence on the binder properties and storage characteristics (West, Randy,
1998).
As crumb rubber can alleviate waste, reduce environmental hazards, and
enhance the performance characteristics of asphalt pavements, it is important to
characterize how crumb rubber properties influence the engineering properties of
rubber modified asphalt binders. Research of the effect of crumb rubber properties on
the pavement performance could lead to determining desirable grinding methods,
particle sizes, and modification strategies. This could lead to a reduced dependence on
synthetic polymers currently used for modifying binders to reduce the temperature
susceptibility of asphalts. Assessing how the properties of the crumb rubber materials
influence the performance of asphalt binder and asphaltic mixtures can assist states in
ensuring high performing rubber pavements while continuing the use of recycled rubber
as an asphalt modifier.
Objectives
The objective of this study was to evaluate how rubber properties affect the
properties of an asphalt binder. The study utilized unique crumb rubber products to
4
modify a single asphalt binder. The modified binders were then characterized with
performance grading (PG), multiple stress creep recovery testing (MSCR), separation
testing (Cigar Test), and softening point testing (Ring-and-Ball). The objective was met
by analyzing the performance characteristics of the modified binders to determine the
effect of the rubber properties on the binder performance.
Scope
The study characterized twelve unique crumb rubber products and explored how
those characteristics affect blends of the products with asphalt binder. The twelve
unique crumb rubber products consisted of six ambient ground and six cryogenically
ground materials. A single binder was used with each crumb rubber product to create
modified asphalt binders. Each crumb rubber product was introduced at a rate of ten
percent by weight of binder. In addition to the twelve modified blends at ten percent
rubber content, two additional modified binders were created with a rubber content of
fifteen percent. The two additional materials were modified with an ambient ground
material and cryogenic ground material respectively. The fourteen modified materials
were then tested to characterize the performance characteristics with performance
grading (PG) and elastic response (MSCR). The stabilities or uniformities of the stored
materials were also evaluated through the use of separation testing (Cigar Tube Testing)
and softening point testing (Ring-and-Ball Testing). The results from the modified
performance testing were used to determine the extent of the rubber property

5
influence on the binder properties. Statistical analyses were used to determine how the
variability in binder performance can be described by measureable crumb rubber
properties. In addition to the fourteen crumb rubber modified binders analyzed, a
hybrid binder and Vestenamer modified binder were analyzed to determine the effect
of stabilizers on crumb rubber modified materials.
Organization
The thesis consists of seven chapters. The second chapter contains the literature
review and critical findings from previous research utilizing scrap tire rubber in asphalt
mixtures. The third chapter of this study discusses the methodology and findings from
the characterization of the crumb rubber products analyzed in this study. The fourth
chapter discusses the methodologies used to create the modified binders. This chapter
also includes the methodologies for conducting the binder performance testing as well
as the results from the binder testing. The fifth chapter focuses on the statistical
analyses used to determine the effect of the crumb rubber properties on the properties
of the crumb rubber modified binders. The addition of stabilizers and the influence it
has on the performance of crumb rubber modified binders is discussed in chapter six.
Chapter seven focuses on the conclusions of the research as well as the
recommendations that can be made from the study.

6
Chapter 2: Literature Review
Background
Approximately 270 million waste tires are generated annually in the United
States. In addition to the continued waste, the United States has an estimated 800
million stockpiled waste tires (Amirkhanian, 2001). In the year 2000, 45 percent of the
annual 270 million waste tires were found to be disposed in landfills or illegally
stockpiled (Rafat Siddique, 2004). This number of stockpiled tires creates danger to the
environment by providing a breeding ground for vermin and mosquitos while also
creating a fuel source for unexpected fires (Rafat Siddique, 2004). To magnify the
problem of the stockpiled tires, limited tire disposal options are available.
Due to these concerns, landfilling waste tires is not the practical long term solution for
the disposing scrap tires. These issues have led many researchers and industries to
evaluate the use of the waste tires as recyclable material and even fuel sources. As of
2001, the largest market for scrap tires was the cement industry that used the tires as
fuel to heat kilns (Nongnard Sunthonpafasit, April 2003). Approximately 125 million tires

7
are used annually for tire derived fuel (Rafat Siddique, 2004). Other practical solutions
for repurposing the waste material include civil engineering applications, producing
carbon black, creating recycled rubber products and as modifiers for plastic goods.
A 1989 Transportation Research Board synthesis on potential civil engineering
applications for scrap tires showed modifiers for asphalt binder, light weight
embankments, retaining walls, safety hardware, and pavement subbase potential
recycling uses (FHWA, 1992). Using scrap tires as a modifier for asphalt materials was
found to be the most practical solution for repurposing the waste material which could
successfully incorporate two to six tires per metric ton of modified asphalt binder.
(FHWA, 1992). The use of scrap tires as a modifier for asphalt binder requires that the
waste material be ground to a fine crumb-like size which is commonly referred to as
crumb rubber modifier (CRM).
The process of modifying asphalt binder with crumb rubber is called the wet
method. The name reflects that the additive or tire modifier is being introduced directly
to the liquid or wet portion of the hot asphalt mixture, the asphalt binder. A second
method for introducing rubber into asphalt is referred to as the dry method where
rubber is directly added to the aggregate during the production process. The dry process
uses aggregate-sized rubber particles. Additionally, the process will dictate the amount
of rubber which can be used in the mix. The wet method typically uses a rubber content
of 10 to 25 percent of crumb rubber modifier by weight of the binder. This results in the
rubber comprising 0.5 to 1.3 percent of the final modified mixture. Conversely, the dry
method integrates aggregate sized rubber at a rate of 3 percent by the weight of the
8
aggregate (Jay L.McQuillen, 1987). The dry method can only be applied to asphalt
mixture applications whereas the wet method can be utilized in crack sealing, surface
treatments, and other hot mix applications (FHWA, 1992).
One disadvantage of the dry method is mixture uniformity. Differences in rubber
and aggregate densities cause the rubber and aggregate to separate during the mixing
and hauling processes (Marvin Myhre, 2002). The separation can cause large pockets of
rubber to exist in the pavement which lead to construction and long-term performance
problems. Additionally, when rubber is exposed to the asphalt binder, the rubber
absorbs some the light ends and oils of the binder. When this occurs, the rubber
modified mixture is weakened (Marvin Myhre, 2002). Dry mix methodology does not
provide any significant structural benefit when compared to traditional hot mixes and
the size of the rubber limits the effectiveness of the rubber as a modifier in the mix.
While the quantity of rubber used in the wet process is not as great as that in the
dry process, the wet method of directly modifying the asphalt binder has numerous
benefits. By directly modifying the binder with crumb rubber, there is less rubber
separation in the final mixture generating a more homogenous material when
compared to the dry method mixtures. The smaller particles allow for better dispersion
of the rubber and increase the influence of the rubber modification on the total mix
lending itself to be highly durable, quieter and smoother (Marvin Myhre, 2002).
Despite the benefits of using CRM, obstacles related to the practicality and
functionality of the product need to be overcome for widespread implementation.
Practical obstacles include the potential for higher costs, lack of specification, rubber-

9
modified mixture recyclability, and other environmental concerns (Amirkhanian, 2001).
Functional obstacles include, but are not limited to product variability. Rubber
properties vary with source and age. When integrated into asphalt, inconsistency in
rubber source properties could create undesirable paving materials.
While many of the practical issues with the use of crumb rubber can be
overcome through experience, the functionality of the material need continual
evaluation. Sunthonpagasit (2003) suggests that particle size and quality should be
evaluated to assess performance. In addition to particle size and quality, characteristics
such as surface area might affect overall performance. Studies distinguishing critical
crumb rubber factors could eliminate many functional obstacles. The results would also
assist in a market impact studies as suggested by Sunthonpagasist.
History
Crumb rubber was first used as a binder modifier in the United States in the
1950’s; however, the first application of crumb rubber as a modifier for asphalt
pavements construction occurred in 1964. This material was created by Charles
McDonald who applied CRM asphalt as a test patch at the Sky Harbor Airport of
Phoenix, Arizona, to seal existing surface cracks from water exposure and to prevent
reflective cracking. Upon evaluation, the experimental crumb rubber patch was deemed
successful and the product was called McDonald Technology (Brown, 1993). This
innovative technology led to the development of other liquid asphalt rubber

10
applications. Stress absorbing membranes (SAM) and stress absorbing membrane
interlayers (SAMI) were developed in the early 1970’s. Challenges with SAM and SAMI
layers were the amount of loose aggregate on the roadway when used as a chip seal and
high quality construction on rough existing pavements. The high viscosity of the CRM
binder inhibited good construction practices. To reduce the viscosity, kerosene was used
to cut the CRM binder. This led to the development of customized extender oils which
modify the workability. Despite early success, the lack of understanding and equipment
for producing the technology was a concern (Brown, 1993).
Despite concerns, the United States Congress passed legislation requiring state
agencies to utilize and study the use of crumb rubber as a recycled paving material to
counter the surplus of stockpiled waste tires. The Intermodal Surface Transportation
Efficiency Act (ISTEA) of 1991 and the Resource Conservation Recovery Act were used to
limit funding for state agencies that did not comply with the recycling requirements of
the federal government. The requirement forced many states to be proactive in the
evaluation of rubber asphalt. Many states reacted by passing legislation to ensure that
the use of scrap tires was evaluated and implemented. By the time the federal law was
passed, 44 states had already addressed the approaching legislation by formulating
state specific laws and strategies for implementing crumb rubber (FHWA, 1992). The
original federal mandate required that each state have a 5 percent minimum
percentage of rubber modified asphalt of the total tonnage of asphalt produced in 1994.
By 1996 the requirement CRM asphalt mixtures was eliminated from the 1991 ISTEA
mandate. This withdrawal from the original mandate and removal of penalties for

11
compliance failure were integrated through the approval of the 1995 National Highway
System Designation Act, Section 205b. While these items were retracted, the
requirement of studying and developing technologies associated with researching the
rubber material remained. This was reinforced by section 327 of the National Highway
Designation Act by requiring continued research of crumb rubber modified material in
the Strategic Highway Research Program (SHRP) specifications. This amendment also
required that future procedures developed for the use of the crumb rubber materials
include consultation of industry and interest parties associated with the process of
recycling of the crumb rubber materials.
In 1988, Florida became one of the first states to pass legislation to evaluate the
use of CRM in paving mixtures. FDOT partnered with The National Center for Asphalt
Technology (NCAT) and conducted a CRM feasibility study using a continuous mixing
process. The study titled Investigation and Evaluation of Ground Tire Rubber in Hot Mix
Asphalt was focused on using the most technologically advanced practices in
implementing the use of ground rubber tire into asphalt mixes to determine if the
resulting material could conform to the necessary FDOT standard for performance
(NCAT, 1989). The study addressed five specific areas. Two of the tasks of the study
addressed the functional issues with the use of scrap tires such as Specification and
Design Factors and Pavement Performance. The Specification and Design Factors section
investigated the necessary changes needed in the current practices and designs that
would be required to implement scrap tires into future FDOT projects. The Pavement
Performance Issues section investigated the effect of rubber on the pavement

12
performance and longevity. The research conducted by NCAT found that rubber
pavements could exhibit acceptable performance in the field. The study also found that
modifications in the current practices and specifications would make the integration of
rubber into designs feasible. The recommendations from NCAT proposed acceptable
material types, material sizes, rubber concentrations, methods for handling rubber RAP,
future research projects, and data collection strategies. The report led to FDOT
constructing sections of rubberized pavement for data collection and observation
(NCAT, 1989).
The Federal Highway Administration report titled State of the Practice-Design
and Construction of Asphalt Paving Materials with Crumb Rubber Modifier reinforced
the need for continued research by stating that two principal issues exist for the use of
crumb rubber modifier, recycling asphalt pavement and continual CRM asphalt
research. It was requested that performance evaluations be conducted on state-by-
state basis due to differences in design and construction practices between states.
The recommendations made by this report led many states such as Arizona,
Kansas and Texas to evaluate their respective practices including pavement durability
and pavement-tire noise. A recent study titled the Quiet Pavement Pilot Program is an
example of a research program designed to address the performance issues of rubber
asphalt critical to the state by partnering the Arizona Department of Transportation with
the Federal Highway Administration to evaluate the effectiveness of rubber pavements
in reducing pavement noise. The study assessed if an asphalt rubber friction course
(ARFC) could reduce noise at the tire-pavement interface.

13
Another study titled Utilization of Crumb Rubber in Asphaltic Concrete Mixtures-
South Carolina’s Experience was developed to assess and monitor the performance of
CRM test sections using three methods of CRM. These methods consisted of the wet
method, the dry method, and a method described as trickle method where rubber was
added manually to a pugmill. The research distinguished durability issues between the
test sections. Ultimately, the results from the collaboration between the South Carolina
Department of Transportation and the FHWA were used to dictate the future research
and integration of crumb rubber for the state of South Carolina (Amirkhanian S. N.,
2001).
Grinding Method
The method used to grind scrap tire into a usable crumb size has been suggested
to be a factor in dictating the performance of rubber modified products. The primary
rubber property controlled by grinding method is particle size. Grinding method has also
been found to affect shape, texture, and surface area of the rubber. These rubber
properties can influence the rubber binder interaction and can affect the viscosity and
storage stability of rubber modified materials (West, Randy, 1998). Two basic strategies
exist for producing crumb rubber. The first strategy utilizes grinding tools like steel
drums, granulators or steel plates to grind the scrap tire into a usable size. These
grinding tools typically operate at ambient temperatures and the material produced
from ambient grinding is categorized as ambient ground rubber. The second strategy for

14
creating a ground or usable rubber material utilizes liquid nitrogen. Scrap rubber is
exposed to liquid nitrogen making the material brittle. Impact loading is then used to
fracture the material into usable sizes. Crumb rubber produced through the use of liquid
nitrogen and impact crushing is categorized as cryogenic ground rubber. Materials
produced with the two methods have been found to have noticeable differences in
shape and texture (FHWA, 1992). Because of the impact of the rubber particle
characteristics on the modified binders, many studies have been conducted to quantify
the influence of grinding method on the performance of rubber modified materials.
The 1989 report titled Investigation and Evaluation of Ground Tire Rubber in Hot
Mix Asphalt conducted literature reviews on the methodologies used to create ground
tire rubber. The investigation found that ambient ground materials are shredded and
ground at temperatures near or above ordinary room temperatures. The resulting
material was found to have a sponge-like surface that increased surface areas for any
particular particle sizes. The study also determined that cryogenic ground materials are
produced at temperatures below the embrittlement temperature of the rubber. The
resulting materials were found to have flat surfaces that reduced the surface area of the
materials when compared to similar particle sizes of ambient ground materials. The
study reviewed research conducted by the Australian Road Research Board and found
that increased surface areas increased the reaction rate of the crumb rubber with
binder. The review also found that low surface area crumb rubber material was
undesirable due to the morphology of the material which limited the rubber reaction in
the binder. The findings from the research conducted by the Australian Road Research

15
Board were one reason ambient ground material was recommended by NCAT for use in
future FDOT experimental sections. NCAT concluded that cryogenically ground materials
were not satisfactory and should be prohibited from use in the proposed experimental
designs.
A 1998 study titled Effect of Tire Rubber Grinding Method on Asphalt-Rubber
Binder Characteristics investigated the influence of grinding method on asphalt rubber
properties. This study was conducted for the Florida State Department of
Transportation and the purpose of the report was to determine if any measurable
differences could be identified between the materials produced with ambient and
cryogenic grinding. The study listed four known methods that produced crumb rubber
and identified how each method created uniquely different particles. These methods
were listed as a Crackermill Process, Granular Process, Micromill Process, and Cryogenic
Process. The report identified the Crackermill Process as the most common method for
producing crumb rubber. Crackermilling was conducted by using rotating steel drums
that were designed to tear scrap rubber into usable sizes. This method used ambient
temperatures to produce irregularly shaped materials with high surface areas. The
second method described in this report was the granulator process which used ambient
temperatures along with revolving steel plates to cut the scrap tire into a useable size.
The material from this process was described to have uniform shapes of a cubic nature.
The Granulating process was found to produce materials with low surface areas.
Micromilling was described as a finishing process that could be used to shred the
material to a very fine size. This process requires adding water to the rubber to create

16
slurries that can be passed through an abrasive disc for grinding. The cryogenic process
was identified as the method that produced materials with glassy smooth textures. The
materials produced with this method were described as angular with uniform shape.
The description of the general material properties caused by each grinding method was
an indicator of the variability caused by the grinding methods. The discrepancies in the
material characteristics validated the need for a study to determine how each material
type affects the binder performances.
The study investigated the effect of grinding methods on the binder
characteristics of modified materials. To conduct the analysis, four crumb rubber
manufacturing facilities were contacted to obtain unique specimens. Two ambient
ground materials were obtained in addition to one cryogenic and one hybrid cryogenic-
ambient material. The four specimens were subjected to rubber particle
characterizations. The rubber materials were characterized with sieve analyses, surface
area measurements and bulk density determinations. The properties of the binder
modified with the four products were characterized through viscosity measurements,
rubber particle settlement testing, and drain down testing. The study found that the
differences in shape, texture and physical properties caused by the two grinding
strategies were significant. Binder testing results showed that grinding processes caused
measurable differences in the performance of the modified binder while high-
magnification images of the four rubber products indicated visible differences in the
texture and surface area. Imaging showed that ambient ground materials have the
potential for high surface areas when compared to cryogenically ground materials. The

17
research also found that the wet grinding methods result in materials with higher
surface areas when compared to the dry ambient ground and the cryogenic ground
materials. Binder testing showed materials with the highest surface areas were found to
create modified materials with higher viscosities. The high surface area materials were
found to exhibit the least amount of rubber particle settlement during the separation
testing. The investigation showed specific surface area to be the most significant factor
for the rubber material. Because ambient materials were found to have the most
texture and surface area of this study, modified binders produced from these methods
were found to be more desirable.
A Clemson University study that was published in 2007 titled The Effect of Crumb
Rubber Modifier (CRM) on the Performance Properties of Rubberized Binders in HMA
Pavements investigated the effect of both grinding methods and rubber content of
rubber on Superpave binder tests. The investigation utilized ambient and cryogenic
ground rubber materials with similar particle sizes. Both materials were designated as a
size 40 mesh material and used at rubber contents of 5, 10, 15, and 20 percent by
weight of binder. The study also used three different sources of 64-22 performance
grade binders. For each source binder and rubber content, the viscosities of the
modified binders in the analysis indicated that the tire grinding method caused
statistical differences. The results from the elastic response of the material showed that
the grinding method affected the majority of the testing scenarios. The study
corroborated the findings from previous research by showing that ambient ground
rubber produced modified binders with higher viscosities and less temperature

18
susceptibility when compared to materials modified with cryogenically ground rubber.
While this analysis showed that the high performance grade properties could be
influenced by the grinding method used to generate the crumb rubber material, the
study showed that the low temperature performance grade may not be affected
showing statistically similar m-values.
Effect on Binder
The main purpose of binder modification is to limit the temperature sensitivity of
the material. Many different methods of grinding or shearing rubber have been
developed to create rubber modifier which decrease the temperature sensitivity of the
asphalt binders. The primary crumb rubber properties that are influenced by production
methods are particle size and surface area which can be critical for rubber-binder
interaction. The addition of rubber has been shown to modify the viscosity, phase angle,
complex shear modulus, and elastic response of crumb rubber modified binders which
are indications of changes to the material’s temperature susceptibility and loading
(Marvin Myhre, 2002).
Due to numerous rubber sources and varying methods used to create crumb
rubber, studies characterizing the impact of crumb rubber properties in modified
binders are important to classify the performance of the modified materials as well as
provide guidance for future uses of the materials. In addition to studying the effects of

19
rubber properties on the modified binder performance, the stability of stored modified
binders warrants investigation.
A study titled Crumb Rubber Modification of Binders: Interaction and Particle
Effects describes the fundamental interaction between crumb rubber particles and
asphalt binder which occurs in two steps. First, the rubber particles are added to the
binder and the particles begin to swell from absorbing the lighter oily fractions within
the binder. The second step is an increase in the viscosity of the binder due to the
absorption of the oily light ends. In addition to studying how crumb rubber and its
measurable properties affects the binder, the report states that other non-rubber
factors can attribute to the interaction between the rubber and the binder. The amount
of light ends or oil fraction can limit the effect of the rubber. This indicates that the
binder source is important and could limit the effectiveness of the rubber modifier. The
temperature at which the two materials are blended can also influence the interaction.
Heitzman (FHWA, 1992) reinforces the importance of reaction temperature by stating
that temperature, length of exposure, and blending energy can significantly affect the
reaction of any crumb rubber in a binder. The viscosity issues discussed by Putman and
Amirkhanian indicate that compatibility between the rubber and the binder could be an
issue in allowing the rubber to be properly activated during blending (Amirkhanian B. J.,
2006).
The interaction and particle effects study utilized a single ambient ground crumb
rubber source to identify the influence of the rubber on the binder. To create different
particle sizes, one rubber source was sieved into multiple mesh sizes to represent the

20
range of crumb rubber sized materials available in the United States. After executing a
modification strategy utilizing three binder sources, two rubber contents and three
rubber mesh sizes the modified binders were subjected to viscosity testing and DSR
testing. The results from the investigation were able to identify that rubber content was
a critical component influencing the viscosity and complex shear modulus. The
viscosities of the materials were found to increase with decreasing particle size while
the complex shear modulus increased with increasing particle size. The use of the three
binder sources showed that binder source can influence the particle effect of the crumb
rubber on the binder. While the complex shear modulus was found to decrease with
decreased particle size, this was only a general trend. The statistical analysis from this
study showed that there was little to no change in complex shear modulus values
between specimens from the same binder type modified with different mesh sizes.
Rubber content and particle size had the greatest statistical influence on the binder
performance.
Sohee Kim, Ssu-Wei Loh, Huachun Zhai, and Hussaim U. Bahia investigated the
effect of crumb rubber on modified binder viscosity. The study utilized three gradations
of crumb rubber, two rubber contents and two grades of binder to determine the effect
of particle size and rubber content on binder performance using viscosity testing,
frequency sweeps, bending beam rheometer testing, and binder separation testing. The
study found that both rubber content and particle size have a statistically significant
effect on the viscosity. The critical findings from the viscosity analysis found that higher
rubber contents and smaller particles resulted in higher viscosities. Rubber content was
21
determined to be more significant than the influence of particle size. Frequency sweep
testing illustrated that the rubber content had a statistically high impact on the effect of
crumb rubber on the binder. Sensitivity analyses found that particle size had little to no
effect on the results from the frequency sweeps. The study showed that base binder
was the highest contributor to binder performance for all rubber contents and particle
sizes. Particle size had the greatest effect on the BBR performance. Stability of CRM
asphalt is a critical parameter for assessment. The laboratory separation testing found
that all crumb rubber modified materials were susceptible to separation. While this
study confirmed that crumb rubber modified materials were susceptible to separation,
the results did not indicate which crumb rubber properties were critical in describing the
behavior.
One study that determined the crumb rubber properties that affected the
storage stability of modified binders utilized one binder source and one ground rubber
tire source (F.J. Navarro, 2004). Fractions of the original rubber gradation were created
by screening the material. This resulted in five different mean particle size blends. The
modified materials then underwent rheological testing and storage stability testing. The
viscosity of the modified materials in this study was shown to increase with increased
rubber particle sizes. The study addressed the difference by stating that particle aspect
ratio and morphology of any particle can lead to higher viscosities. After identifying this
irregularity, the study evaluated the storage stability of the blends. The study illustrated
that the particle size had an effect on separation showing that particle sizes 0.29mm or

22
smaller were more stable; however, this may not be true for all rubber types or rubber
contents.
Effect on Mixture
The most important aspect of using crumb rubber is the performance evaluation
of rubber modified asphalt pavements. The findings from the modified binder testing
show that crumb rubber changes the rheological properties of the binder. This would
suggest that the performance properties of the mixture could be enhanced by the
rubber modification of the binder. Studies have shown rubber modification of asphalt
pavement could enhance the performance of low temperature flexibility, higher
strength when wet and more resistance to oxidative hardening (Myhre 2002). Other
reports show addition of rubber can modify thermal cracking, rutting, reflective
cracking, and aging (Amirkhanian 2006). While the logic between increased binder
performance leads to increased pavement performance seems reasonable, many
institutions like NCAT and FHWA indicate that laboratory material performance has not
always correlated well with measured field performances. Because of the differences
with laboratory and field performances, the need for field experiments is paramount.
It is well understood that CRM mixtures are different than conventional asphalt
mixtures. CRM mixtures require more binder to be added to mixtures. The increase in
binder along with the increase in viscosity of the binder due to the addition of rubber
causes a thicker film of binder to be placed on the aggregate (FHWA, 1992). Laboratory

23
testing has shown the additional binder due to rubber content can cause the modified
materials to absorb elastic stress better than conventional mixtures. While increased
elastic properties are desirable, a common problem with the increased binder content is
flushing and reduced air voids. With the increase of binder, existing mix designs may not
provide enough void space to account for an increased volume of rubber modified
binder. The necessary modifications to the aggregate structure could allow for the
proper voids while limiting flushing. Slight modifications in mix designs can allow for
rubber to be used in dense, gap-graded, and open-graded mixes. For open-graded
mixtures, increased mixing temperature would be necessary due to increased binder
viscosity.
The 1989 NCAT study that evaluated ground rubber tire in hot mix asphalt for
FDOT found that three performance parameters were significantly affected by the
addition of rubber to the mixture. The study utilized literature review, laboratory data
and field experiments to determine that fatigue life, permanent deformation, and
resilient moduli from asphalt rubber mixes behave differently than conventional mixes.
The fatigue portion of the study found that dense graded mixtures modified with rubber
decrease strain levels after repeated loading when compared to conventional mixtures.
The permanent deformation portion of the study demonstrated that rubber modified
mixtures exhibited higher moduli values than conventional mixtures at elevated
temperatures. The study was also able to identify that the resilient moduli of mixtures
can be increased through the addition of rubber modifier. While these conclusions show
24
promise in the use of crumb rubber materials, the findings were very climate specific
and were determined specifically for FDOT to guide future research experiments.
Similar conclusions on field fatigue behavior of asphalt rubber pavements to the
1989 NCAT investigation on ground rubber tire in hot mix were found by Roberts,
Kandhal, Brown and Dunning. A field aging study compared the fatigue life of a dense
graded conventional mix to the fatigue life of a gap graded asphalt rubber mix. The two
mixes were obtained from a 10 year old field section of a parking lot in California. The
study determined the rubber asphalt section possessed lower stiffness for both aged
and unaged specimens. This indicated that the rubber influenced the rate of aging;
however, the effect of fatigue performance was negligible.
Raghu Ram Madapati evaluated the permanent deformation of materials with
and without crumb rubber. The materials analyzed for this study were a control mix,
two wet crumb rubber mixes, and one dry process crumb rubber mix. The evaluations
were conducted through the use of VESYS 3A-M software that utilized elasto-plastic
theory and seasonal inputs to predict pavement performances over 20 years. The
analysis found the dry method of rubber modification to have the worst deformation
followed by the control mixture. The wet method process for creating asphalt rubber
was found to be the best performing or materials with the least amount of rutting in the
prediction analyses. The study concluded that experimental crumb rubber sections
should be constructed and evaluated.
Laboratory findings have also concluded that the addition of crumb rubber has
significantly reduced the permanent deformation of asphaltic materials when compared

25
to conventional mixes. A study titled Rutting Resistance of Rubberized Asphalt Concrete
Pavements Containing Reclaimed Asphalt Pavement Mixtures evaluated two methods of
rutting, viscous flow and plastic deformation using indirect tensile strength (ITS) and the
Asphalt Pavement Analyzer (APA). Both performance testing strategies were applied to
a wide range of materials that varied in RAP content, percentage of rubber, rubber type,
and rubber size. The indirect tension test was previously shown to have good
correlation to rutting resistance by a joint study with The Pennsylvania Transportation
Institute, The Pennsylvania State University, and Advanced Asphalt Technologies. The
results from the indirect tension testing illustrated that increasing rubber contents
would decrease the ITS values. A critical finding of the ITS analysis was the effect of the
rubber content on the ITS values. The study showed that acceptable ITS values could be
achieved up to 15 percent rubber by weight of the binder. While the ITS value trend was
shown, the investigation showed that through correlations rubber modification could
increase the resistance to rutting. This finding was reinforced by the Asphalt Pavement
Analyzer testing. The APA results showed that increasing rates of rubber modification
increased the ability of the material to resist deformation.

26
Chapter 3: Rubber Characterization
Introduction
Studies have shown that rubber properties such as particle size, grinding
method, and surface area can influence the final characteristics of rubber modified
binders (West, Randy, 1998). However, due to differing rubber sources and production
methods it is important to characterize the properties of ground rubber. This study
evaluated twelve unique crumb rubber products to characterize the gradation, chemical
composition, and surface area of rubber materials. The results from the characterization
assisted in the evaluation of the influence of a respective rubber material on a modified
binder.
RO-TAP Gradation Analysis Methodology
To identify the particle size of the twelve crumb rubbers used in this study, a
gradation analysis was conducted through the use of a RO-TAP apparatus by Lehigh
Technologies Incorporated using methodology LTDCN-QC160, ASTM 5644-01, ASTM

27
E11-04, and ASTM D5603-01 to conduct the gradation analyses. From this gradation
analysis, Lehigh Technologies reported the particle size distribution of the individual
crumb rubber materials and the individual fiber contents found during the gradation
process. The results from this analysis were then used to determine the mesh
designation and mean particle size and particle size distribution.
The twelve individual particle analyses required that a zero screen and
designation screen be selected. The zero screen was designated the smallest screen that
allows for 99.9% of the sample to pass. The designation screen (mesh size) was
identified as the smallest screen that allowed a minimum for 90% of the material to
pass. The RO-TAP procedure indicated that the estimated particle size prior to the
gradation analysis would provide guidance for selecting sieve sizes to be used for this
analysis.
One hundred grams of a respective rubber material was weighed and prepared
for gradation. Flow-aid, a P200 material used to ease the flow of the test material
through the sieves was then added to the specimen. For rubber specimens coarser than
50 mesh, 5 grams of Flow-aid was added. For materials 50 mesh or finer, 15 grams of
the Flow-aid was added to the test specimen due to the increase in surface area of the
rubber particles. The combined material was then placed in a 500 milliliter covered jar
and manually agitated for a minimum of one minute to distribute the Flow-aid.
Sieves were stacked in increasing mesh number with the last component of the
sieve stack being a pan. The purpose of the pan was to catch all the fine material so that
the total amount of fines (P200) could be determined. Each sieve contained two rubber

28
balls to help facilitate the flow of the material during the sieving process. The pre-
agitated rubber specimen with prescribed Flow-aid was then placed in the top sieve
along with the lid from the agitation jar. Lehigh Technologies had two prescribed
agitation times for properly sieving the material. Rubber coarser than 50 mesh was
agitated for 10 minutes while finer material was agitated for 20 minutes.
Upon completion of the agitation, each sieve was checked for fiber content by
recording the weight of the fiber retained on each sieve. If no fiber was found in the top
portion of the sieve, the sieve was prepared for rubber weight determination. The
bottom or underneath portion of the sieve was brushed to release any rubber particles
into the next sieve. This material clinging to the bottom of the sieve represented a
portion of the rubber that had passed the respective sieve. The material retained in the
top of the sieve and on the rubber balls were then brushed into a pan holder. The
weight collected into the pan holder was recorded and the weight measurements were
documented to the nearest one-hundredth of a gram for each sieve. Lastly, the sum of
the weights on each sieve that was collected into the pan holder was tabulated.
An equation (Equation 1) was then used to determine the amount P200 rubber
that was in the pan excluding the Flow-aid that was added to the rubber specimen prior
the testing.

29
𝑥 = 𝑦 − (𝑧 − 100) Equation 1
Where: x= the weight of rubber in the pan
y= weight in the bottom of the pan including Flow-aid
z= combined weight of rubber and Flow-aid prior to testing
The validity of the RO-TAP analysis required that the (z) weight deviate no more
than 2 grams from the original weight of rubber and Flow-aid that was tested. This
analysis provided an indication of the amount of fine rubber material in the tested
specimens.
The last portion of the RO-TAP analysis was to determine the designated mesh
size of the tested material. This process required that the first sieve retaining no more
than 1% of the tested specimen be determined. The next screen was then analyzed to
ensure that less than 10% of the specimen was cumulatively retained. If 90% or more of
the material was found to pass this sieve, the entire gradation was determined to be
designated as this sieve size. This was done in accordance with ASTM Method D5603-1.
The classification of the material according to the ASTM Method indicates that 90% of
the material tested is either the designated mesh size or smaller.
RO-TAP Gradation Analysis Results
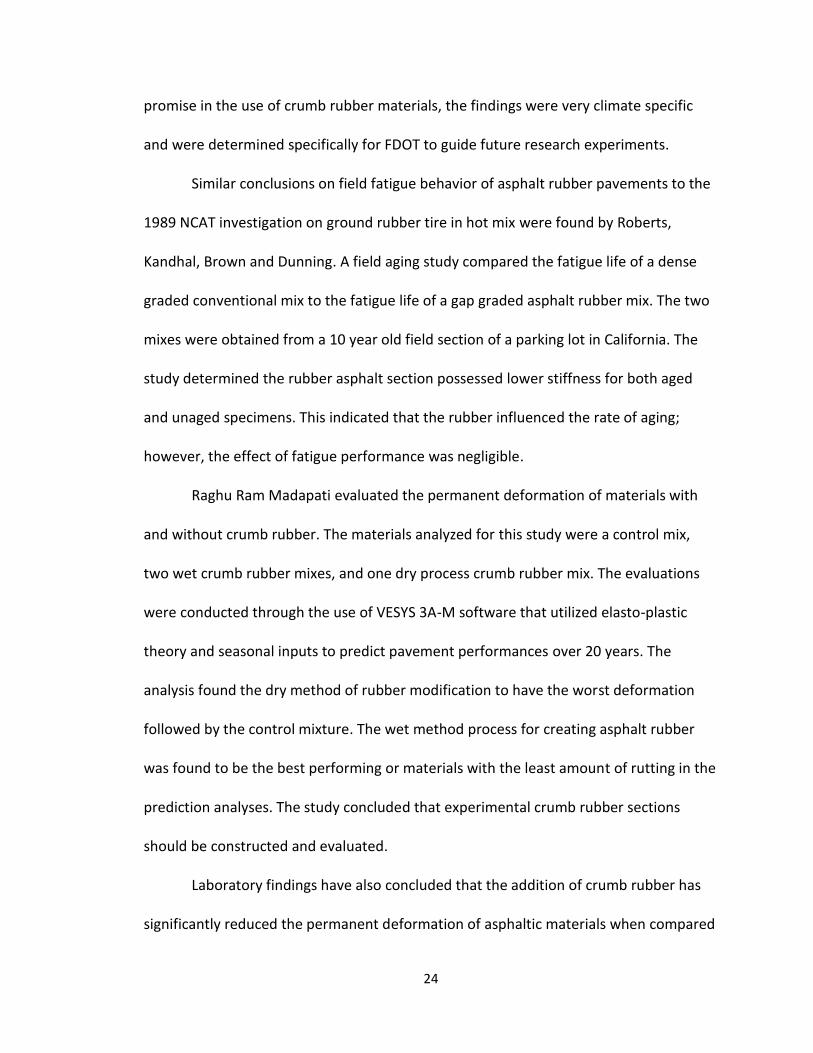
The results from the RO-TAP analysis were tabulated and the percent retained
values were determined for the sieves used for each respective material (Table 1). For

30
this analysis, the percent retained shown is a function of the entire specimen analyzed
including the rubber and the Flow-aid. The table indicates that the majority of the
materials analyzed were a size 30 mesh or smaller. Two materials analyzed were found
to have a coarser designation mesh number than a 30 mesh. These two materials are
Liberty Powderizers -16 (16 mesh) and Liberty -20 (20 mesh). The materials were
provided by Liberty Tire Recycling and were produced at ambient temperatures. The
entire weight of the sample including the weight of Flow-aid used was tabulated and is
located in Table 2 which also contains the fiber content of the material, the P200 rubber
weight, and the temperature process for crumb rubber manufacturing. The RO-TAP
results from Lehigh Technologies can be found in Appendix A.
31
Table 1. RO-TAP Results for Crumb Rubber Particle Analysis
Percent Retained
Material Pan #200 #170 #140 #120 #100 #80 #60 #50 #40 #30 #20 #16 #14 #10
MD-402-TR 31.13 - - - - - 0.00 53.03 15.78 0.06 0.00 - - - -
MD-180-TR 43.79 - - 15.96 29.00 10.17 1.07 0.02 0.00 - - - - - -
MD-105-TR 77.27 17.27 5.04 0.36 0.07 - - - - - - - - - -
(-80/+140) 11.62 - - 11.60 57.80 16.52 2.46 0.00 - - - - - - -
MD-400-AM 0 0 0 0 0 0 5.0 33.0 56.0 6.0 0.00 0.00 - - -
Liberty Powderizers -
16 43.14 - - - - - - 0.00 0.00 6.61 21.17 29.03 0.04 0.02 0.00
Liberty -20 11.23 - - - - - 10.76 32.63 - 37.51 7.82 0.05 0.00 0.00 0.00
MD-400-TR 16.07 - - - - - 49.66 37.72 - 1.54 0.01 - - - -
Cryohammer 15.61 - - - - - 16.84 50.48 - 16.78 0.27 0.01 - - -
Liberty -30 9.95 - - - - - 14.98 49.58 - 25.45 0.05 0.00 - - -
Liberty -30 Fine
24.98 - - - - - 22.17 40.53 - 12.28 0.04 0.00 - - -
Crackermill 23.07 - - - - - 18.88 45.42 - 12.64 0.00 0.00 - - -

32
Three materials were found to have measurable fiber contents. These materials
are the Lehigh MD-402-TR, Liberty Powderizers -16, and the Liberty -20 materials which
correspond to the coarsest gradations. Table 2 shows how the entire sample weight
varied due to the weight of the Flow-aid added as a function of the anticipated particle
size. The table also shows the true amount of rubber fines that were determined from
each analysis. The Lehigh (-80/+140) was found to have no fine material since it was
designed as a “cut” of rubber ranging between the #80 and #140 screens. After using
equation 1, this material reported a negative value for rubber in the pan. The negative
value indicated that the Flow-aid material was distributed on the surface of the
materials retained above the 200 mesh sieve with little material passing to the pan.
Table 3 shows the designated material size as well as the manufacturer of the material
and material sources.
Table 2. Additional Crumb Rubber Properties
Material Entire Sample
Weight Fiber Content Rubber in Pan Material Type
MD-402-TR 104.42 0.025 28.09 Cryogenic
MD-180-TR 114.43 0 35.68 Cryogenic
MD-105-TR 114.2 0 74.04 Cryogenic
(-80/+140) 114.45 0 0 Cryogenic
Liberty Powderizers -16 104.41 0.01 40.63 Ambient
Liberty -20 104.05 0.034 7.63 Ambient
MD-400-TR 103.91 0 12.79 Cryogenic
Cryohammer 104.33 0 11.96 Cryogenic
Liberty -30 104.16 0 6.2 Ambient
Liberty -30 Fine 104.59 0 21.54 Ambient
Crackermill 104.14 0 19.88 Ambient

33
The finest rubber designation was placed on MD-105-TR which used a cryogenic
grinding process.
Table 3. Crumb Rubber Designated Size and Material Source
Material Manufacture Size Source
MD-402-TR Lehigh -40 Truck Tire (TT)
MD-180-TR Lehigh -80 TT
MD-105-TR Lehigh -140 TT
(-80/+140) Lehigh -80 TT
MD-400-AM Lehigh -40 TT
MD-400-TR Lehigh -40 TT
Liberty -20 Liberty -20 Passenger Car (PC)
Cryohammer Liberty -30 PC + TT
Liberty -30 Liberty -30 PC + TT
Liberty -30 Fine Liberty -30 PC + TT
Crackermill Liberty -30 PC
Liberty Powderizers -16 Liberty -16 PC + TT
In addition to describing the crumb rubber materials with a designated mesh
size, the materials can be quantified using the mean particle size. Mean particle size can
be a better representation of the particle sizes within a gradation due to mesh
designation characterizing the coarsest 10% of the material. Table 4 shows how two
different mesh designations can have the same or very similar mean particle sizes. This
ultimately can be used in conjunction with the mesh designation to assess the particle
size distribution of the rubber.

34
Table 4. Crumb Rubber Particle Size
Material Mean Particle Size (microns) Mesh Size
MD-402-TR 180 -40
MD-180-TR 105 -80
MD-105-TR 50 -140
(-80/+140) 125 -80
MD-400-AM 180 -40
MD-400-TR 180 -40
Liberty -20 250 -20
Cryohammer 250 -30
Liberty -30 250 -30
Liberty -30 Fine 250 -30
Crackermill 250 -30
Liberty Powderizers -16 600 -16
Thermogravimetric Analysis Methodology
The twelve crumb rubber products used in this study were also analyzed for their
individual chemical compositions (extractables, polymer, carbon black, and ash) using
Thermogravimetric Analysis (TGA). The TGAs were performed by Lehigh Technologies in
accordance to ASTM E1131-03. To conduct the analyses, a 10 to 25 gram sample of a
crumb rubber was placed in the controlled atmosphere of a thermal gravimetric
analyzer. The specified pressure for this analysis was 25 psi. The initial testing
temperature of the device was 30℃. The material was then heated to 530℃ at a
constant rate of 10℃ per minute. The weight of material lost by 325℃ was determined
to be the percentage of extractable material from the sample. After reaching the
desired temperature of 530℃ the temperature was held constant for 10 minutes. The
amount of material lost between the 325℃ calculation and the 10 minutes of 530℃ was

35
determined to be the percentage of polymer in the specimen. The sample was then
heated from 530℃ to 850℃ at a constant rate of 10℃ per minute. The material was
then held constant at this desired temperature for 10 minutes. The material lost during
the range of 530℃ to 850℃ was determined to be carbon black. The remaining weight
of material from this analysis was classified as ash and unburned fibers. The results from
this study were tabulated and the percentages of each of the four chemical components
were calculated.
Thermogravimetric Analysis Results
The percentages of the extractable material, polymer, carbon black, and ash
from the TGAs are presented in Table 5. The results show that polymer comprises more
than half of the chemical composition of all the crumb rubber products analyzed. The
data from the TGAs also shows little variability in the chemical components of the
different rubber products. The coefficient of variation for the polymer and carbon black
are both relatively low, less than 5 percent. The highest degree of variability from this
study can be found in the ash property. Ash had a coefficient of variation of 21.05
percent. The shaded portion of Table 5 shows the highest values determined for each
measurable TGA component from the twelve crumb rubbers evaluated. While the
coefficient of variation is relatively low for the polymer content for the twelve materials,
a slight change in polymer content could have a significant effect on the overall
performance rubber when combined with asphalt. Comparing the highest polymer

36
content to the lowest polymer content of the materials in this study shows that a 6.2%
difference in polymer modification can be achieved at 10 percent rubber content. The
laboratory results from the chemical composition analyses can be found in Appendix A.
Table 5. Thermogravimetric Results
Percentage
Material Extractables Polymer Carbon Black Ash
MD-400-AM 10.17 56.10 28.36 5.18
MD-402-TR 6.78 58.11 30.13 4.80
MD-180-TR 8.79 54.48 30.88 5.67
MD-105-TR 10.97 52.43 30.17 6.26
(-80/+140) 8.67 53.73 32.31 5.31
MD-400-TR 7.35 57.95 29.86 4.70
Liberty -20 9.86 54.36 30.65 5.03
Cryohammer 10.37 51.89 31.40 6.20
Liberty -30 9.69 52.29 31.54 6.36
Liberty -30 Fine 7.73 58.46 27.56 5.96
Crackermill 8.11 52.78 29.35 9.63
Liberty Powderizers -16 9.49 55.53 28.43 6.44
Average 9.00 54.84 30.05 5.96
Standard Deviation 1.25 2.28 1.37 1.25
Coefficient of Variation 13.92 4.16 4.55 21.05
Surface Area Methodology
The surface area of each crumb rubber blend was also investigated to further
characterize the rubber materials. Quantachrome, a company that specializes in
characterizing materials and powders was contracted to conduct the surface area
analysis of the twelve materials. Quantachrome utilized a proprietary surface area

37
analyzer and methodologies to conduct multipoint Brunauer-Emmett-Teller (BET)
testing on each specimen. Samples from each material ranged in size between 1 and 3
grams.
The rubber sample was placed into the testing unit where all gas was removed
from the testing chamber. The process prepared the material for testing by limiting the
amount of impurities in the sample through the flow of the air during the degasification
process. The degasification was conducted at ambient temperatures over a 16 hour test
period. Once completed, the sample was weighed. The specimen then underwent BET
testing. This testing involved the exposure of the rubber sample to ultra-high purity
Krypton gas and variable relative pressures at a constant temperature of 77.35K. These
relative pressures were 0.05, 0.075, 0.10, 0.15, 0.20, 0.25, and 0.30 of the atmospheric
pressure. The exposure of the Krypton at the pressures allowed for the surface area of
the rubber to be calculated by finding the difference in the absorbed and desorbed gas
around the sample in the testing chamber (Equation 2).
𝑆 = 𝑊𝑚𝑁𝐴/𝑀 Equation 2
Where: S= Surface area of the rubber (m2/gram)
Wm= Monolayer capacity of the Krypton
N= Avagadro’s Number
A= Cross Sectional Area of the Krypton
M= Molecular Weight of the Krypton

38
Surface Area Results
The results from Quantachrome testing are given in Table 6. The material with
the lowest surface area was found to be the Cryohammer Liberty crumb rubber. With
the general trend of increases in surface area with decreased particle sizes, the surface
area data agrees with the mean particle size findings in Table 4. The material with the
highest surface area per gram of sample was found to be the Lehigh MD-105-TR
material. This cryogenic temperature produced material was found have the lowest
mean particle size of the rubbers in the study. The coefficient of variability for the
surface area of the twelve materials was 98. This value indicates that a great deal of
variability exists for the surface area of the materials. While many of the gradations
appear to be similar as shown in Table 1, the degree of variability in the surface area is
very high illustrating that grinding or fabrication method of the crumb rubber greatly
influences the surface area properties of the materials. The laboratory data from the
Quantachrome testing can be found in Appendix A.

39
Table 6. Surface Area Results
Material Surface Area (m^2/g)
(-80/+140) 0.104
MD 180 TR 0.275
MD 400 TR 0.079
MD 402 TR 0.407
MD 105 TR 0.751
-30 Liberty 0.056
-20 Liberty 0.092
16 Powderizers 0.079
Liberty Cracker Mill 0.104
Cryo-Hammer 0.044
-30 Fines Liberty 0.114
MD 400 AM 0.4
Average 0.209

40
Chapter 4: Characterizing Crumb Rubber Modified Binder
Introduction
The first step of the study required that the twelve crumb rubbers be analyzed
for particle size, surface area and chemical composition. Once this phase was
completed, the influence of the individual crumb rubber materials on the rheological
properties of binder when used as a modifier was investigated. To conduct the second
phase of the study a single asphalt binder (67-22) was modified by the twelve crumb
rubbers. Performance testing consisting of performance grading, multiple stress creep-
recovery testing, separation testing, and softening point testing was then used to assess
how each rubber modified the binder.
Methodology for Blending
Blending was conducted by dividing five gallon buckets in gallon size batches. To
prepare the smaller batch size quantities of binder, five gallon buckets were heated to
275℉ or until the material was fluid and pourable. Once the material was homogeneous

41
and pourable the material was distributed into pre-weighed cans. Each five gallon
bucket was distributed over six to seven gallon size cans to ensure enough space
remained in the cans for the crumb rubber. The individual cans of binder were then
weighed to determine the weight of binder in each respective can.
Once the binder was distributed appropriately, the crumb rubber material was
prepared for blending. A representative sample was created by sampling a large portion
of material from the stockpile provided. The material was then placed onto a sheet and
manually blended to ensure the material was visually homogeneous (Figure 1). The
weight needed for each individual blend was then a function of the weight of the binder
in the can and the rubber content desired. For this study each rubber material was
loaded at 10 percent of the weight of the binder. Two of the rubber products in this
study were then loaded at 15 percent of the binder weight to create additional
comparison for modified binder properties. This resulted in fourteen crumb rubber
modified binder samples.
Figure 1. Example Crumb Rubber Sample Preparation

42
Prior to blending, each gallon was heated in a 300℉ oven. Once homogeneous,
the material was placed in a heating mantle. The heating mantle was set at 280 to 320℉
for blending purposes. The temperature was monitored through the use of a
temperature gauge. The corresponding dial setting of the heating mantle was used for
the duration of the blending. The binder temperature was also measured using a
thermometer. Care was taken to ensure that the binder did not receive excessive aging
while in the oven and that the heating mantle did not reach undesirable temperatures.
Blending of the material was conducted with a vertical blender that possessed
enough torque to ensure 1000 rpms. To initiate blending, the stirring rod was placed in
the binder. The depth of the paddle was set so that a 1 inch vortex could be achieved in
the binder during blending to ensure proper stirring. The speed of the paddle was set to
700 rpms. The predetermined weight of rubber was then added at a constant rate over
2 minutes of blending. After the rubber was added to the binder, the rpms of the paddle
was increased to 1000 rpms. The crumb rubber modified binder was then blended at
this constant rate for an additional 30 minutes. The blending strategy of incorporating
the rubber material over 2 minutes with additional blending for 30 minutes was
modeled after the methodology for blending documented by a study titled Crumb
Rubber Modification of Binders: Interaction and Particle Effects (Amirkhanian B. J.,
2006). Separation tests were then conducted with the freshly blended material. The
remaining material was covered and allowed to rest at room temperature.
To prepare pre-blended room temperature material for additional testing the
specimens were gently reheated ensuring the binder temperature did not exceed 300℉.

43
The specimen was placed in the preheated heating mantle. The crumb rubber modified
binder was then reblended for 10 minutes at 1000 rpms. Figure 2 shows the desired
vortex needed for blending which corresponded to an appropriate height of the
blending paddle.
Figure 2. Example Vortex Resulting in Properly Mixed Crumb Rubber Binder
Method for Performance Grade
Performance grading of the fourteen crumb rubber modified binders was
conducted with pre-blended material. The material was prepared for performance

44
grading by following the previously discussed reblending methodology. Modified binder
specimens were poured into a 25mm diameter mold for unaged binder testing. The
specimens were then removed from the mold and were placed on the dynamic shear
rheometer (DSR) testing plate (Figure 3).
Figure 3. 25mm Disc of Binder and DSR Testing Plate (Dabbs, 2012)
The performance grading of the materials were performed according to AASHTO
M320-10 using a 1mm gap between the testing plates when appropriate (Figure 4). The
method requires testing of both unaged and aged binders to assess binder properties at
different stages of aging. Aging of the binder was performed according to the Standard
Test Method for Effect of Heat and Air on a Moving Film of Asphalt designated (ASTM
D2872-04) and the Standard Practice for Accelerated Aging of Asphalt Binder Using a
Pressurized Aging Vessel designated (ASTM D6521-08). The particle size of the Liberty
Powderizers material caused a high degree of variability during the DSR performance

45
grading, so a 2mm gap was used with the 25mm specimens to generate more reliable
high temperature grade results. The use of a 2mm testing gap strategy was previously
evaluated and proposed from research conducted by H.U. Bahia and R. Davies
(Amirkhanian, 2006). The particle size of this material did not appear to interfere with
the viscosity determination of the binder nor the flexural creep stiffness results of the
material.
Figure 4. Example 1mm Testing Gap (Digparty, 2013)
Performance grade testing also requires viscosity testing, mass change analysis,
and low temperature creep stiffness analysis. Viscosity testing was performed with
freshly blended binder and was performed according to AASHTO T315-09. The flexural

46
creep stiffness of the binder was analyzed according to the AASHTO T313-10
specification.
Results from Performance Grading
Results from rotational viscometer analysis, DSR analysis, and bending beam
rheometer analysis were used to grade each modified binder. The viscosity values were
determined according to AASHTO 316 (Table 7). Most materials were found to be
pumpable or workable as indicated by the viscosity determinations at 135℃. The -20
Liberty material loaded at 15 percent exceeded the maximum allowable viscosity of 3.00
PaS at 135℃. The most viscous material that did not exceed the maximum viscosity at
this temperature was the 15 percent rubber Liberty Cryohammer material (2.912 PaS).
Table 7. Viscosity of Rubber Modified Blends Passing AASHTO 316 Criteria
Rubber Product Rubber Content % Viscosity, PaS at 135℃
80/140 10 1.425
MD-180-TR 10 0.825
MD-400-TR 10 1.425
MD-402-TR 10 1.300
MD-105-TR 10 1.425
-30 Liberty 10 1.400
-20 Liberty 10 1.887
Crackermill 10 1.990
Cryo-Hammer 10 1.675
-30 Liberty Fines 10 1.725
-16 Powderizers 10 1.600
MD-400-AM 10 1.887
Cryo-Hammer 15 2.912

47
Each freshly blended binder was analyzed with the DSR to determine the high
temperature at which the binder had a minimum G*/sin𝛿 (Table 8). Every rubber
increased the high temperature grade of the base binder.
Table 8. Crumb Rubber Modified Binder Performance Grade
Tested Material Grinding Method
Mean Particle Size**
Rubber Content
True Grade Performance
Grade G* @82℃
kPa 𝛿 @82℃
Base Binder NA NA 0% 70.0 – 25.4 70 – 22 NA NA
-80/140 Cryo 125 10% 83.6 – 24.9 82 – 22 1.14 81.8
MD-180-TR Cryo 105 10% 81.2 – 25.4 76 – 22 0.92 85.3
MD-400-TR Cryo 180 10% 80.4 – 24.2 76 – 22 0.85 85.5
MD-400-AM Amb 180 10% 82.1-16.3 82-16 1.00 84.1
MD-402-TR Cryo 180 10% 79.0 – 23.0 76 – 22 0.73 85.8
MD-105-TR Cryo 50 10% 77.9 – 25.6 76 – 22 0.66 83.7
-30 Liberty Amb 250 10% 80.7 – 23.6 76 – 22 0.87 84.8
-20 Liberty Amb 250 10% 83.1 – 24.6 82 – 22 1.09 81.5
Crackermill Amb 250 10% 82.8 – 23.1 82 – 22 1.07 82.1
Cryo-Hammer Cryo 250 10% 82.2 – 23.2 82 – 22 1.01 82.8
-30 Liberty Fines Amb 250 10% 79.8 – 20.4 76 – 16 0.80 84.4
-16 Powderizers (1mm gap)
Amb 600 10% 76.3 – 21.8 76 – 16 NA NA
-16 Powderizers (2 mm gap)
Amb 600 10% 84.7 – 21.8 82 – 16 1.28 82.1
-20 Liberty Amb 250 15% 87.9 – 21.3 82 – 16 1.63 79.5
Cryo-Hammer Cryo 250 15% 86.7 – 19.3 82 – 16 1.52 81.2
**(microns)
The results suggest that using 15 percent rubber had the greatest impact in
increasing the high temperatures grade. This additional 5 percent rubber increased the
critical high temperature by approximately 5℃ when compared to the 10 percent
rubber binders. The 10 percent crumb rubber modified materials indicate that the true
high temperature grade of the base binder could be increased by 10℃.

48
The higher rubber dosage also appeared to affect the lower temperature grade.
The bending beam rheometer results show that the low temperature grade of -22℃
from the original binder was increased causing the modified material to be more
susceptible to cracking at low temperatures. While the 15 percent loaded materials
appeared negatively influenced by the low temperature grade, some of the 10 percent
rubber modified binders like the MD-180-TR and MD-105-TR modified materials were
found to have little or no effect on the low temperature grade when loaded at 10
percent.
Method for Multiple Stress Creep Recovery Analysis
The fourteen modified binders also underwent advanced performance testing
according to AASHTO TP70-09 for multiple stress creep recovery (MSCR). The MSCR
results were used to grade the modified binders according to AASHTO MP19-10. The
MSCR test was used to determine the amount of elastic response of rolling thin film
aged (RTFO) modified material. MSCR testing was typically run after conducting a
performance grading of the oven aged materials. The material was tested at 64℃, the
average 7-day high pavement design temperature for Auburn, Alabama.
For this analysis, each 25mm RTFO specimen was tested with the DSR to assess
the permanent deformation characteristics of each material. The sample was subjected
to two standardized procedures of stress that included cycles of constant loading with
periods of zero loading allowing strain recovery. The two stress levels were 0.100kPa

49
and 3.200kPa.The testing of the RTFO material included ten cycles of constant stress
applied to the binder for 1 second with 9 seconds of stress free conditions which
allowed for partial recovery of the induced strain. The amount of recovery occurring
during the rest cycle indicated the amount of elastic nature of the binder. The amount
of strain remaining in the specimen was used along with recovery criteria to evaluate
the material performance (Jnr). The acceptable Jnr at the 3.200kPa and the percent
difference with Jnr at 0.100kPa was used to characterize the expected traffic level that
could be used for each respective material. Table 9 shows the values from AASHTO
MP19-10 that were used to classify the materials.
Table 9. AASHTO MP19-10 MSCR Performance Criteria
Traffic Level Max Jnr3.2 (kPa-1) Max Jnrdiff (%)
Standard Traffic “S” Grade 4.0 75
Heavy Traffic “H” Grade 2.0 75
Very Heavy Traffic “V” Grade 1.0 75
Extremely Heavy Traffic “E” Grade 0.5 75
Results from MSCR Testing
As stated earlier, MSCR testing was conducted on RTFO binders using a 1mm
testing gap with the exception of the -16 Liberty Powderizers. Two materials (-20 Liberty
and 15% rubber Cryohammer) were found to not meet the Max Jnrdiff criteria when
tested with a 1mm gap. The unacceptable Max Jnrdiff values were a function of the non-
recoverable creep compliance values at the lower stress level. The calculation
comparing the two materials indicates unrealistically large percent difference values for

50
these materials. The percent recoveries for these materials at both strain levels indicate
that the materials have desirable permanent deformation characteristics. Even with the
known issues in the calculation, the prescribed traffic level indicated by the MSCR
results were determined and are shown in Table 10. The findings from the MSCR
analysis indicated that every material was graded for “extremely heavy” traffic.

51
Table 10. MSCR Results
Rubber Product
Grinding Method
Mean Particle Size***
Rubber Content,
%
Jnr % Recovery Traffic Level
0.1 kPa-1
3.2 kPa-1
% Diff
0.1 kPa-1
3.2 kPa-1
Base Binder NA NA 0% 1.150 1.353 17.68 12.99 5.616 “H”
-80/140 Cryo 105 10% 0.123 0.190 46.39 58.44 41.87 “E”
MD-180-TR Cryo 105 10% 0.175 0.201 14.90 44.66 38.02 “E”
MD-400-TR Cryo 180 10% 0.139 0.166 19.19 51.23 43.55 “E”
MD-402-TR Cryo 180 10% 0.178 0.202 13.52 42.90 36.69 “E”
MD-400-AM Amb 180 10% 0.123 0.160 57.18 46.88 30.53 “E”
MD-105-TR Cryo 50 10% 0.273 0.344 26.08 36.86 24.50 “E”
-30 Liberty Amb 250 10% 0.201 0.233 15.95 43.56 36.42 “E”
-20 Liberty Amb 250 10% 0.086 0.159 85.81 69.16 46.45 ”E”*
-20 Liberty Amb 250 15% 0.030 0.193 554.0 85.94 50.43 ”E”*
Crackermill Amb 250 10% 0.122 0.183 50.88 59.46 42.73 “E”
Cryo-Hammer
Cryo 250 10% 0.150 0.201 34.21 50.59 36.68 “E”
Cryo-Hammer
Cryo 250 15% 0.062 0.1949 216.2 68.87 44.72 ”E”*
-30 Liberty Fines
Amb 250 10% 0.092 0.127 37.68 61.62 49.58 “E”
-16 Powderizers (1mm gap)
Amb 600 10% 0.096 0.720 652.5 95.20 66.45 ”E”*
-16 Powderizers (2 mm gap)
Amb 600 10% 0.088 0.122 39.41 63.03 50.44 “E”
* Did not meet Jnr % difference requirement (≤75%)
***microns
52
Method for Separation Test
Freshly blended crumb rubber modified materials were subjected to separation
testing. Immediately after blending, material was sampled and tested according ASTM
D7173-11, The Standard Practice for Determining the Separation Tendency of Polymer
from Polymer Modified Asphalt to quantify the amount of separation or non-uniformity
of the modified material after heated storage.
At the time of crumb rubber binder blending, 1 inch diameter conditioning tubes
were not available for purchase so a ¾ inch aluminum tube was used as an alternative.
The tubing had one closed end and an opposing open end that allowed freshly blended
binder to be added to the tubing. The mass of binder added to each tube was 50 ± 0.5
grams. Once the material was poured into the aluminum container, the tubing was
crimped and sealed. The tube was then placed vertically in a metal storage rack in an
oven at 163 ± 5 ℃ oven for 48 ± 1 hour. Care was taken to ensure that the tubing
remained plumb during the conditioning phase. After conditioning, the rack was
removed from the oven and placed in a freezer for a minimum of 4 hours to solidify the
binder. The frozen material was then cut into three equal portions. The middle portion
was discarded while the top and bottom thirds were used for comparison.
To prepare the top and bottom portions of the binder, the tubing and frozen
material was placed in individually labeled 3 ounce cans and heated until the binder
could flow from the tubes. Pliers were used to help crimp and tubing and force any
residual material that was attached to the inner wall from the tubing before stirring the

53
binder to ensure homogeneity. The top and bottom portions of the conditioned material
were then tested in with the DSR to determine the critical high temperature grades of
the top and bottom halves of the tubing. Figure 5 shows an example of the top and
bottom portions of a separation tested material.
Figure 5. Example Set of Separated Materials
Results from Separation Test
The true high temperature grade of the conditioned sections was determined
through the use of DSR testing (Table 11). The results of the separation test indicated
varying degrees of separation occurred between the rubber products. The two materials
with the highest uniformity were determined to be MD-180-TR and the -30 Liberty
Fines. These materials had less than 12 percent difference of the high temperature

54
grade between the top and bottom sections. The material that was found to have the
highest difference between the top and bottom portions for high temperature grade
was determined to be the -16 Liberty Powderizers. The results from the entire analysis
are shown in Table 11. The table documents the true high temperature grade from each
test specimen as well as the percent difference providing a relative indicator of the true
difference in the top and bottom portions of the conditioned material.
Table 11. Separation DSR Results
Rubber Product
Grinding Method
Mean Particle Size**
Rubber Content,
%
Critical High Temperature, °C
Top Bottom Absolute
Difference %
Difference
-80/140 Cryo 125 10% 78.87 97.52 18.65 23.65
MD-180-TR Cryo 105 10% 74.98 81.56 6.58 8.78
MD-400-TR Cryo 180 10% 81.79 102.6 20.81 25.44
MD-402-TR Cryo 180 10% 82.75 102.7 19.95 24.11
MD-400-AM Amb 180 10% 86.10 99.90 13.8 13.81
MD-105-TR Cryo 50 10% 79.93 92.53 12.6 16.61
-30 Liberty Amb 250 10% 76.67 103.6 26.93 35.12
-20 Liberty Amb 250 10% 75.84 101.7 25.86 34.10
-20 Liberty Amb 250 15% 94.3 107.4 13.1 12.20
Crackermill Amb 250 10% 77.04 102.4 25.36 32.90
Cryo-Hammer Cryo 250 10% 77.71 102.1 24.39 23.89
Cryo-Hammer Cryo 250 15% 79.85 110.5 30.65 38.40
-30 Liberty Fines
Amb 250 10% 85.63 97.07 11.44 11.79
-16 Powderizers
(1mm) Amb 600 10% 79.78 197.5 117.72 147.56
**(microns)
55
Method for Softening Point
Softening point analysis (ASTM D36-09) is another test commonly used to
characterize the uniformity of the material using a Ring-and-Ball Apparatus. This test
was utilized to experimentally determine the temperature at which modified binder
specimens were able to soften or flow. The softening point test was particularly useful
for doing a side-by-side analysis of the separation test conditioned samples to document
the uniformity of the material after heated storage.
To conduct the tests, the preconditioned materials stored in the 3 ounce cans
were heated until fluid. This required a short exposure to a 150℃ oven. While the
material was being heated, the pouring plate was prepared by applying a thin coat of
release agent to assist the removal of the binder from the plate after pouring specimens
into the rings. The ring molds for the binder were also heated during this time period.
The binder was then removed from the oven and stirred to ensure homogeneity. The
homogeneous material was then poured into the heated rings taking care to slightly
overfill the brass molds. This pouring process occurred with the rings resting on the
prepared pouring plate. The material was allowed to rest at room temperature for 30
minutes prior to trimming the top of the specimens flush with the square edge of the
molds. The test specimens were prepared no earlier than 4 hours prior to testing.
Freshly boiled distilled water was used as the test bath medium. Water was
chosen because of the acceptable range of testing temperatures available near the
estimated softening point temperatures for the modified binders. After the water was
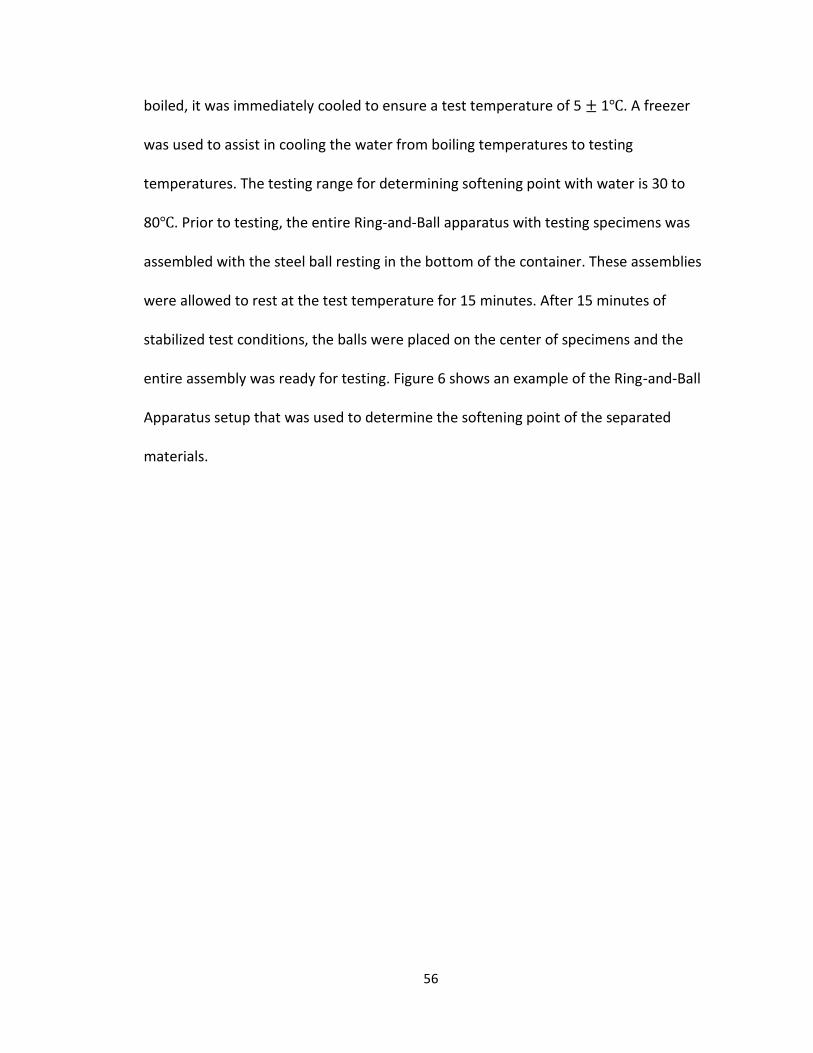
56
boiled, it was immediately cooled to ensure a test temperature of 5 ± 1℃. A freezer
was used to assist in cooling the water from boiling temperatures to testing
temperatures. The testing range for determining softening point with water is 30 to
80℃. Prior to testing, the entire Ring-and-Ball apparatus with testing specimens was
assembled with the steel ball resting in the bottom of the container. These assemblies
were allowed to rest at the test temperature for 15 minutes. After 15 minutes of
stabilized test conditions, the balls were placed on the center of specimens and the
entire assembly was ready for testing. Figure 6 shows an example of the Ring-and-Ball
Apparatus setup that was used to determine the softening point of the separated
materials.

57
Figure 6. Ring-and-Ball Softening Point Apparatus
To begin testing, the bath was slowly warmed at a rate of 5℃ per minute with
minimal variation from this rate of heating. The bath was heated through the use of an
open flame and the rate of heating was controlled by the operator. A stop watch was
used to help ensure a uniform rate of heat was applied to the testing vessel. Once the
material was soft enough to allow the weight of the ball to sink and touch the bottom of
the testing cylinder, the temperature of the “softening point” for the respective sample
was recorded to the nearest tenth of a degree.

58
Results from Softening Point
All materials were found to have a softening point within the 30 to 80℃ range
which justified the use of water as a testing bath medium. On average, this analysis
provided a smaller value for percent difference between the top and bottom portions
analyzed when compared to the DSR testing of the conditioned specimens. The
materials with the lowest percent difference for softening point from this analysis were
found to be MD-105-TR and MD-180-TR. The material that possessed the highest
percent difference for the softening point was determined to be the MD-402-TR
material. The increase in rubber content did not appear to have measureable effects on
the softening point of the material. The entire set of results from the softening point
analysis is available in Table 12.

59
Table 12. Softening Point Results
Rubber Product
Grinding Method
Mean Particle Size**
Rubber Content, %
Softening Point, °C
Top Bottom Absolute
Difference %
Difference
-80/140 Cryo 125 10% 61.4 78.0 16.6 23.8
MD-180-TR Cryo 105 10% 58.6 63.0 4.4 7.2
MD-400-TR Cryo 180 10% 61.7 73.3 11.6 17.2
MD-402-TR Cryo 180 10% 59.7 77.2 17.5 25.6
MD-400-AM Amb 180 10% 62.2 71.4 9.2 13.8
MD-105-TR Cryo 50 10% 60.6 61.1 0.5 0.8
-30 Liberty Amb 250 10% 58.9 72.5 13.6 20.7
-20 Liberty Amb 250 10% 58.9 69.4 10.5 16.4
-20 Liberty Amb 250 15% 66.4 73.3 6.9 9.9
Crackermill Amb 250 10% 58.9 66.7 7.8 12.4
Cryo-Hammer Cryo 250 10% 59.7 70.7 10.3 15.9
Cryo-Hammer Cryo 250 15% 61.9 75.0 13.1 19.1
-30 Liberty Fines
Amb 250 10% 62.8 72.8 10.0 14.7
-16 Powderizers
Amb 600 10% 59.2 69.7 10.5 16.3
**(microns)

60
Chapter 5: Statistical Analysis of Crumb Rubber Properties on Modified Binders
Introduction
Statistical analyses were conducted to determine the degree of influence of each
crumb rubber property on the modified binder performance. The six crumb rubber
properties characterized in Chapter 3 were used as parameters to assess the explainable
variability of the performance data of the fourteen modified binders (Chapter 4).
Correlation Analysis of the Binder Performances
Before assessing the effect of rubber properties of binder performance, a
correlation analysis was conducted to determine if any two binder performances
(Chapter 4) were correlated to each other. Pearson product moment correlation
coefficients were developed for the binder performance test results using Minitab 16.
These coefficients represent linear trends between any two sets of data. Pearson
correlation coefficients can range between values of -1 to 1. A correlation of 1
represented that the data has a linear trend or positive slope with both variables

61
analyzed trending similarly. A value of -1 indicated that the two sets of data are linear
with a negative slope and opposing trends. A Pearson correlation of 0 indicated that no
true linear relationship existed for the two variables. This could indicate scattered data
or non-linear relationships.
To quantify the statistical significance of the results, p-values were also
determined for each paired correlation coefficient. The null hypothesis for this analysis
was that the correlation value was 0. The alternative hypothesis was that the correlation
value was not equal to 0. P-values less than 0.05 indicated that the null hypothesis
should be rejected while p-values greater than 0.05 indicated that the alternative
hypothesis should be rejected. Table 13 shows the results from the correlation analysis
for the 4 binder performance responses. The coefficients for each analysis are
represented by the variable (r) while the p-values are represented by the variable (p).
As seen in the table, the statistics failed to reject all the null hypotheses
suggesting that the correlation between the any two parameters of the analysis are
statistically insignificant.
Table 13. Pearson Correlation Table for Binder Performance
Softening Point %
Difference % Difference in True High Grade After Conditioning
True Low Grade
% Difference in True High Grade After Conditioning
r=0.187 p=0.522
True Low Grade r=0.213 p=0.465
r=0.172 p=0.557
True High Grade r=0.116 p=0.692
r=0.290 p=0.314
r=0.491 p=0.075

62
Analysis of Crumb Rubber Properties on True High Performance Grade
The general regression analysis tool within Minitab 16 was used to conduct a
general linear regression analysis with the crumb rubber factors influencing the true
high performance grade. A linear model was formed through the general regression
analysis which utilized the crumb rubber properties for the true high performance grade
of the rubber modified blends. An analysis of the variance (ANOVA) was included with
the regression and the results are presented in Table 14. The linear model described
81.65 percent of the variability in the true high performance grade. The analysis found
that the two sources describing the majority of the variability of the true high
performance grade were rubber content and mean particle size. Rubber content was
found to describe 33.84 percent of the variability while mean particle size was found to
account for 20.63 percent of the true high performance grade variability.
In addition to assessing sources of the variability, p-values were calculated to
determine the statistical significance of each rubber characteristic. The null hypothesis
for this analysis was that the linear coefficient for any source material from the
regression was 0. The alternative hypothesis was that the coefficient was not equal to 0.
Rubber content was the most statistically significant property affecting the true
high performance grade of the rubber modified binders. Surface area was found to be
the second most influential property in determining the true high temperature grade of
the binder; however, this variable was not statistically significant.
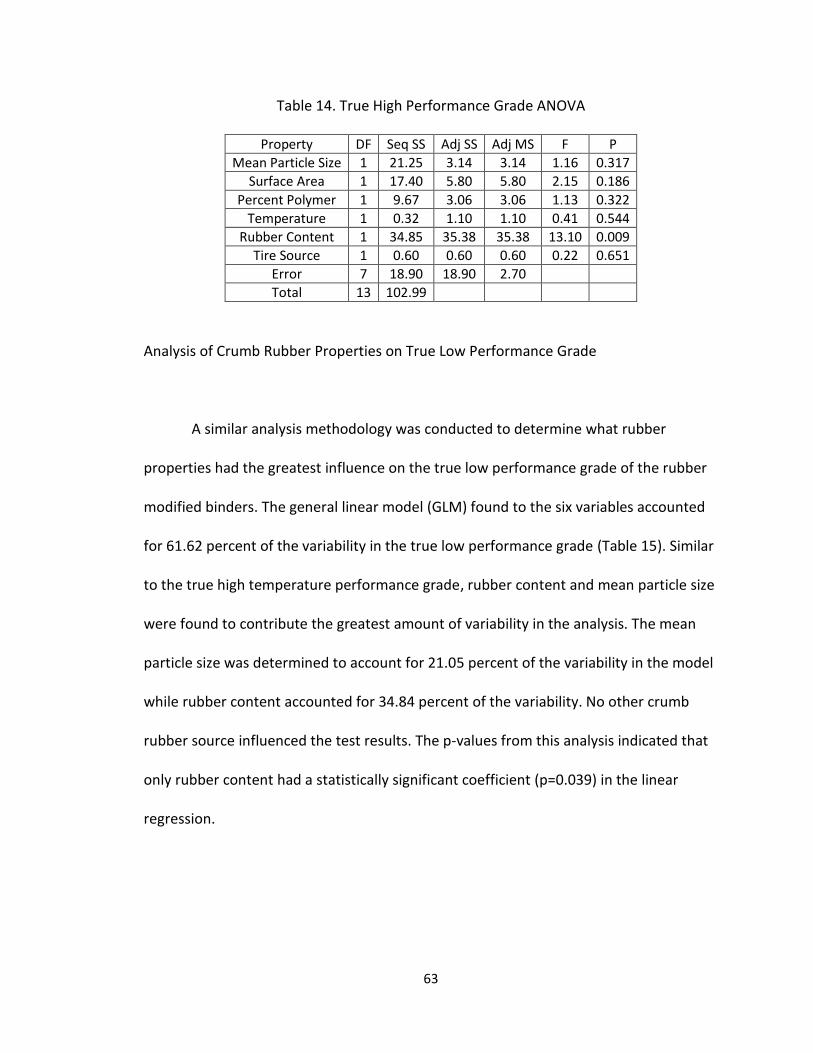
63
Table 14. True High Performance Grade ANOVA
Property DF Seq SS Adj SS Adj MS F P
Mean Particle Size 1 21.25 3.14 3.14 1.16 0.317
Surface Area 1 17.40 5.80 5.80 2.15 0.186
Percent Polymer 1 9.67 3.06 3.06 1.13 0.322
Temperature 1 0.32 1.10 1.10 0.41 0.544
Rubber Content 1 34.85 35.38 35.38 13.10 0.009
Tire Source 1 0.60 0.60 0.60 0.22 0.651
Error 7 18.90 18.90 2.70
Total 13 102.99
Analysis of Crumb Rubber Properties on True Low Performance Grade
A similar analysis methodology was conducted to determine what rubber
properties had the greatest influence on the true low performance grade of the rubber
modified binders. The general linear model (GLM) found to the six variables accounted
for 61.62 percent of the variability in the true low performance grade (Table 15). Similar
to the true high temperature performance grade, rubber content and mean particle size
were found to contribute the greatest amount of variability in the analysis. The mean
particle size was determined to account for 21.05 percent of the variability in the model
while rubber content accounted for 34.84 percent of the variability. No other crumb
rubber source influenced the test results. The p-values from this analysis indicated that
only rubber content had a statistically significant coefficient (p=0.039) in the linear
regression.

64
Table 15. True Low Performance Grade ANOVA
Property DF Seq SS Adj SS Adj MS F P
Mean Particle Size 1 10.55 2.57 2.57 0.94 0.366
Surface Area 1 0.44 0.01 0.01 0.00 0.967
Percent Polymer 1 1.10 2.07 2.07 0.75 0.414
Temperature 1 1.11 1.60 1.60 0.58 0.470
Rubber Content 1 17.46 17.62 17.62 6.41 0.039
Tire Source 1 0.23 0.23 0.23 0.08 0.782
Error 7 19.23 19.23 2.75
Total 13 50.11
Analysis of Crumb Rubber Properties on Performance Grade of Conditioned Materials
The DSR separation tube test results were analyzed to determine if any of the
properties describing the crumb rubber materials were influential using a linear
regression model. The six crumb rubber parameters were used to model the percent
difference in the true high performance grade between the top third and bottom third
of the conditioned materials (Table 16). The percent difference of the performance
grades within the sample was used to place a relative value on the settlement occurring
within the material.
The regression analysis conducted through the use of the Minitab 16 software
found that the six properties were able to describe 95.32 percent of the variability in the
in the model. The mean particle size was found to explain 78.69 percent of the
variability in the analysis. No other parameter described a practical amount of variability
compared to this result.
Both mean particle size and percent polymer were statistically significant
parameters of the model. The third lowest p-value was calculated for the tire rubber

65
source (0.059). This suggests that the tire source could have some effect on the test
results; however, it may have been overshadowed by the mean particle size.
Table 16. Separation Performance Grade Percent Difference ANOVA
Property DF Seq SS Adj SS Adj MS F P
Mean Particle Size 1 12242.6 12473.7 12473.7 119.80 0.000
Surface Area 1 851.7 162.4 162.4 1.56 0.252
Percent Polymer 1 177.4 610.1 610.1 5.86 0.046
Temperature 1 740.3 143.2 143.2 1.38 0.279
Rubber Content 1 291.0 161.5 161.5 1.55 0.253
Tire Source 1 526.3 526.3 526.3 5.06 0.059
Error 6 728.8 728.8 104.1
Total 13 15558.2
Analysis of Crumb Rubber Properties on Softening Point of Conditioned Materials
Softening point test results were also statistically analyzed for the influence of
rubber characteristics using a general linear regression. The analysis utilized the percent
difference in softening point temperatures between the results from the top third and
bottom third of every specimen.
The general linear regression analysis (Table 17) explained only 44.92 percent of
the test result variability. The analysis showed that the source describing the majority of
the variability in the model was surface area; however, it only accounted for 19.30
percent of the variability in the model. The p-values generated for the statistical
significance of each regression coefficient showed that the six properties had no
influence on the softening point. The lowest p-value was determined for surface area.
The value of 0.100 indicated that the surface area of the crumb rubber material had the

66
highest likelihood of any parameter in affecting the temperature difference between
the softening points.
Table 17. Separation Softening Point Percent Difference ANOVA
Property DF Seq SS Adj SS Adj MS F P
Mean Particle Size 1 32.89 2.66 2.66 0.06 0.810
Surface Area 1 105.00 153.37 153.37 3.58 0.100
Percent Polymer 1 42.09 7.25 7.25 0.17 0.693
Temperature 1 33.84 7.04 7.04 0.16 0.697
Rubber Content 1 8.70 4.29 4.29 0.10 0.760
Tire Source 1 21.91 21.91 21.91 0.51 0.498
Error 6 299.72 299.72 42.82
Total 13 544.15
Summary
The findings from the correlation analysis indicated that no two sets of binder
performance had statistically similar trends. The highest correlation was determined to
be the relationship between true high performance grade and the true low performance
grade. While the correlation was the highest, the analysis showed that the two
parameters do not share statistically similar trends. This indicates that the high and low
temperature binder performances are influenced independently. When the six crumb
rubber properties were used to model the true high and low performance grades, the
analyses indicated that rubber content contributed to the majority variability described
in both analyses. The coefficients for rubber content indicated that performance grade
increased with rubber content.

67
The regression analysis yielding the most statistically significant influence of a
crumb rubber parameter through linear modeling was the true grade separation
analysis. The regression indicated that mean particle size was statistically significant.
The coefficient for mean particle size from this regression showed that separation
increased with increased mean particle size. The results from all four linear regression
analyses indicated that the mean particle size, rubber content, and polymer content
affect the binder performance and binder stability. Table 18 shows the statistically
significant parameters found from the four analyses.
Table 18. Summary of Statistical Analyses
Crumb Rubber Parameter Analysis Statistical Significance (p-value)
Rubber Content High Temperature PG 0.009
Rubber Content Low Temperature PG 0.039
Mean Particle Size Separation PG 0.000
Percent Polymer Separation PG 0.046

68
Chapter 6: Effect of Additives
Introduction
Additives can be used to assist in the stabilization of blended crumb rubber in
the asphalt binder. Two current methods for achieving this stabilization are adding
styrene-butadiene-styrene (SBS) polymer or Vestenamer, a trans-polyoctenamer rubber,
directly to the crumb rubber modified binder. SBS is a common polymer used for binder
modification to assist in elastic response of the material and increase the performance
grade while Vestenamer is a proprietary performance modifier developed by the
Degussa Corporation. Vestenamer is a double bond chemical intended to create a more
uniform rubber-composite material. It was designed to link the sulfur components of
the asphalt binder to the sulfur components of the rubber particles. The use of the SBS
polymer with the crumb rubber binder yields a product termed hybrid binder. Because
both SBS-GTR hybrid binder and Vestenamer modified material are considered solutions
to creating stabilized rubber modified binders, the two additives were analyzed to
determine the effect of the additives on the performance grade, softening point, and
MSCR performance.

69
Methodology for Blending Additives
Vestenamer was added in a similar method to the crumb rubber after the
entirety of the rubber modifier was blended into the binder. For this study, the
Vestenamer was loaded at a rate of 0.5 percent of the weight of the binder and blended
for 30 minutes using the previously described methods. This portion of the study only
evaluated two rubber products with the Vestenamer modifier. The Vestenamer was
blended with the Liberty 30 Mesh material and the Lehigh MD-400-TR material. Both of
the materials were loaded at a rate of 10 percent of the weight of binder as conducted
in prior analyses. Once blended, the modified binders were then subjected to separation
testing, performance grading, and MSCR testing.
The hybrid binder product analyzed for this study was developed by Blacklidge
Emulsions Inc. The hybrid binder was created through the use of a proprietary
combination of 40 mesh ambient ground rubber and SBS polymer. The material was
prepared and provided by Blacklidge Emulsions Inc. and the exact proportions of
modifier or blending instructions were not provided. To prepare the material for
performance testing, the re-blending procedure previously described was used.
Results from Additive Modified Binder Performance Grading
The Vestenomer and hybrid modified crumb rubber binders were subjected to
performance grading, softening point testing, and MSCR testing. Performance grading

70
was conducted using the methodology outlined in Chapter 4 and the results of the
performance grade testing with and without the additives are given in Table 19.
Vestenamer increased the true high temperature grade of the binders. At times, this
stiffening would increase the actual performance grade of the binder. The true grading
of the material modified with Vestenamer also indicates that the additive may increase
the true low grade of the binder and potentially affect the performance grade of the
material as demonstrated by the MD-400-TR material.
Table 19 also includes performance grading results for the Blacklidge hybrid
product. The analysis shows that the Blacklidge product containing SBS polymer and
GTR possessed a performance grade of 82-22. This product illustrates relatively high
performance grade range when compared to performance grade ranges determined
from the materials without additives.
Table 19. Performance Grade of Additive Modified Materials
Rubber Product Rubber Content. % Additive True Grade Performance Grade
#30 Liberty 10% None 80.7 – 23.6 76 – 22
Vestenamer 82.3 – 22.4 82 – 22
MD 400 TR 10% None 80.4 – 24.2 76 – 22
Vestenamer 81.8 – 19.5 76 – 16
Blacklidge Hybrid NA Polymer 82.8 – 23.5 82 – 22
Results from Additive Modified Binder Softening Point Test
Softening point testing was conducted according to the methodology presented
in Chapter 4 and the results are presented in Table 20. The results represent the

71
temperature at which the separated materials were softened to the point of flow within
the test bath. The values in this table allow for comparison between the materials with
and without additives. The Vestenamer comparisons provided mixed results. The MD-
400-TR comparison indicated that the Vestenamer increased the amount of separation
that occurred in the material while the Liberty 30 Mesh comparisons demonstrated that
Vestenamer assisted in reducing the amount of separation of the material. In both
cases, the softening point temperature for the top portion of the test specimen was
increased with the Vestenamer added when compared to the other materials. This is
consistent with the performance grade testing results.
The separation results of the Blacklidge material is also shown in Table 20. The
material was found to have a relatively low percent difference of 13.8 percent between
the top and bottom portions of the conditioned material. With respect to the other
material and analyses presented in Chapter 4, the 13.8 percent difference for this
material was found to be on the lower end (23rd percentile) for the percent difference
between the softening points of the conditioned materials. When compared to the
Vestenamer modified materials, the Blacklidge binder was found to provide similar
softening point differences between the top and bottom conditioned specimens.

72
Table 20. Softening Point for Additive Modified Materials
Rubber Product
Rubber Content, %
Additive Softening Point, °C
Top Bottom Absolute
Difference %
Difference
MD-400-TR 10% None 61.7 73.3 11.6 17.2
Vestenamer 77.6 114.3 36.7 38.2
-30 Liberty 10% None 58.9 72.5 13.6 20.7
Vestenamer 92.0 104.5 12.5 12.7
Blacklidge Hybrid
NA Polymer 80.4 94.2 13.8 15.8
Results from Additive Modified Binder MSCR Testing
The three materials containing modifier underwent MSCR testing after
performance grading as explained in the methodologies in Chapter 4. Again, the additive
material was reported against its respective additive free crumb rubber binder. The
results from this analysis are shown in Table 21. The analysis of the materials found that
the designated traffic level was not altered due to the additive when compared to the
materials containing no additive. The analysis showed that the Jnr value was reduced for
the material with additive at both stress conditions tested. This material response
illustrated that the materials with Vestenamer possessed slightly higher elastic response
when compared to the same materials without Vestenamer. The Blacklidge material
performed similarly to the other materials of this study and was found to have a traffic
level grading for “Extremely Heavy” traffic as suggested by AASHTO MP19-10.

73
Table 21. MSCR Results for Additive Modified Materials
Rubber Product
Rubber Content, %
Additive
Jnr % Recovery
Traffic Level
0.1 kPa-1
3.2 kPa-1
% Diff
0.1 kPa-1
3.2 kPa-1
MD-400-TR 10% None 0.139 0.166 19.19 51.23 43.55 “E”
Vestenamer 0.091 0.157 71.65 62.44 41.37 “E”
-30 Liberty 10% None 0.201 0.233 15.95 43.56 36.42 “E”
Vestenamer 0.092 0.118 28.84 57.66 48.44 “E”
Blacklidge Hybrid
NA Polymer 0.196 0.240 22.31 57.91 50.03 “E”
Summary
Comparison of the crumb rubber modified binder with additive versus crumb
rubber modified binder without additives illustrated that an additive had a measurable
effect on performance characteristics of the materials. The performance grading of the
additive modified material showed that Vestenamer increased the true high
temperature grade of the modified binder. Softening point testing of the Vestenamer
modified materials showed mixed results with all materials having varying degrees of
separation. The results from the softening point test could be related to other variables
other than the additive such as particles size or particle alignment. MSCR testing of the
materials containing Vestenamer showed that the material had slightly higher elastic
properties when compared to materials without additives. The Blacklidge hybrid
material was found to possess similar performance grade, uniformity, and elastic
recovery when compared to the Vestenamer modified materials. Ultimately, analysis of
the materials with additive showed that a higher uniformity of stored material could be
achieved along with potentially higher performance grades when compared to materials

74
without additives. The individual complete binder gradings for the hybrid and
Vestenamer modified materials are located in Appendix B.

75
Chapter 7: Conclusions and Recommendations
Conclusions
Results from the crumb rubber modified binder testing indicate that all fourteen
modified binders have an increased high temperature performance grade due the
rubber modification. Each of the twelve rubber products loaded at 10 percent increased
the high temperature performance grade of the binder from PG70 to PG76. In addition
to every rubber product being able to increase the grade to PG76, six of the twelve
products loaded at 10 percent were able to increase the base binder grade by two
grades from PG70 to PG82. The materials loaded to 15 percent also resulted in high
temperature performance grades of PG82, two grades above the base binder grade of
PG70. The rubber modification was also able to show that crumb rubber influences the
low temperature grade of the binder. The low temperature grade was increased from
-22℃ to -16℃ for 3 of the twelve materials loaded with 10 percent rubber and for both
modified binders loaded at 15 percent rubber.
The MSCR testing of the fourteen modified materials indicated that each
material could be classified for “extremely heavy” trafficking for the regional climate as

76
indicated by the AASHTO MP19-10 specification. The testing also indicated that the four
modified binders that did not pass the percent difference in non-recoverable creep
compliance between the two stress levels still exhibited high resistance to permanent
deformation through the percent of recovered strain. The percent difference calculation
failures were caused by the low stress level non-recoverable creep compliance values
which skewed the percent difference calculations.
Separation testing and softening point testing indicated that the materials
separate during heated storage regardless of particle size or rubber content. Only one
material of the fourteen blends passed the softening point criteria. The use of an
additive like Vestenamer with crumb rubber indicated that additives were not effective
in preventing settlement or the separation of the rubber during heated storage.
Performance testing of the hybrid materials illustrated potential for hybrid binders
through the stiffening of the crumb rubber modified binders and reduction in the high
temperature susceptibility of the mixtures.
Statistical analyses of the modified binder performance testing illustrated that
rubber content was a statistically significant factor in describing the variability in the
performance grade of the materials. Mean particle size of the crumb rubber materials
was also found to be significant in describing the variability in the performance grades
of the materials. Statistical analysis of the high performance grades of the separated
materials indicated that mean particle size was the critical factor in describing the
separation of the materials. Mean particle size was found to account for 78.69 percent
of the variability in the DSR graded data. Larger particle sizes indicated larger differences

77
in the high performance grade between the top and bottom portion of the specimens.
The percentage of polymer in the crumb rubber was also found to be a statistically
significant contributor in describing the separation tendencies of the modified binders.
As the amount of rubber polymer increased, the differences in the high grade between
the top and bottom portions of the specimen reduced. Grinding method, tire source,
and surface area were not found to have any statistical significance describing the
variability in the performance characteristics of the modified materials.
Recommendations
The results from the binder testing and laboratory performance testing allow for
the following recommendations to be made:
1. Ground tire rubber should be considered as an asphalt binder modifier for
applications requiring increases in high temperature performance grades.
2. State specifications restricting the use of crumb rubber modification of binder to
ambient ground materials should be opened to allow the use properly
processed cryogenic ground rubber.
3. Crumb rubber content should be restricted to 10 percent in PG67-22 binders to
limit the effect of the crumb rubber on low temperature performance grade.
4. Continuous blending should be used when blending materials mesh size #100 or
larger.

78
References
Amirkhanian, B. J. (2006). Crumb Rubber Modification of Binders: Interaction and Particle Effects.
Clemson, South Carolina: Clemson University.
Amirkhanian, S. N. (2001). Utilization of Crumb Rubber in Asphaltic Concrete Mixtures-South
Carolina Experience. Clemson, SC: Clemson University.
Brown, R. (1993). Historical Development: History of Use of Crumb Rubber in Asphalt Paving
Materials. Auburn, AL: National Center for Asphalt Technology.
Dabbs, B. J. (2012, Spring). The Dynamic Shear Rheometer: Understanding the Temperature
Requirements. Retrieved from AASHTO Materials Reference Laboratory:
http://www.amrl.net/AmrlSitefinity/default/aboutus/newsletter/Newsletter_Spring201
2/7.aspx
Digparty. (2013). Fluid Dynamic Rheometer. Retrieved 2012, from digplanet:
http://www.digplanet.com/wiki/Rheometer
F.J. Navarro, P. P.-B. (2004). Thermo-Rheological Behavior and Storage Stability of Ground Tire
Rubber-Modified Bitumens. ELSEVOER.
Feipeng Xiao, S. A. (2007). Rutting Resistance of Rubberized Asphalt Concrete Pavements
Containing Reclaiming Asphalt Pavement Mixtures. Journal of Materials in Civil
Engineering.
FHWA. (1992). State of the Practice-Design and Construction of Asphalt Paving Materials with
Crumb Rubber Modifier TRR 1339. Washington, DC: Federal Highway Administration.
Jay L.McQuillen, R. G. (1987). Construction of Rubber Modified Asphalt Pavements. Journal of
Construction Engineering and Management.
Marvin Myhre, D. A. (2002). Rubber Recycling. Rubber Chemistry and Technology.
National Center for Asphalt Technology. (2012). Phase IV NCAT Pavement Test Track Findings.
Auburn, AL: Auburn University.
NCAT. (1989). Investigation and Evaluation of Ground Tire Rubber in Hot Mix Asphalt. Auburn,
AL: National Center for Asphalt Technology.
Nongnard Sunthonpafasit, M. R. (April 2003). Scrap Tires to Crumb Rubber: Feasibility Analysis
for Processing Markets. Resources Conservation and Recycling.
Rafat Siddique, T. R. (2004). Properties of Concrete Containing Scrap Tire Rubber-An Overview.
Waste Management.

79
Sohee Kim, S.-W. H. (2001). Advanced Characterization of Crumb Rubber-Modified Asphalts,
Using Protocols Developed for Complex Binders. Madison, WI: Transportation Research
Record.
West, Randy. (1998). Effect of Tire Rubber Grinding Method on Asphalt-Rubber Binder
Characteristics. Transportation Research Board of the National Academies.

A-1
Appendix A: Crumb Rubber Data
RO-TAP Gradations
Figure A1. RO-TAP Results Part 1

A-2
Figure A2. RO-TAP Results Part 2

A-3
Thermogravimetric Analyses
Figure A3. TGA Results MD-402-TR

A-4
Figure A4. TGA Results MD-400-TR

A-5
Figure A5. TGA Results MD-180-TR

A-6
Figure A6. TGA Results MD-105-TR Results

A-7
Figure A7. TGA Results Liberty Powderizers -16

A-8
Figure A8. TGA Results Liberty Cryohammer

A-9
Figure A9. TGA Results Liberty Crackermill

A-10
Figure A10. TGA Results Liberty -30 fines

A-11
Figure A11. TGA Results Liberty -20

A-12
Figure A12. TGA Results Liberty -30

A-13
Figure A13. TGA Results -80/+140

A-14
Figure A14. TGA Results MD-400-AM

A-15
Surface Area Analysis Results
Figure A15. Surface Area Analysis Summary Liberty -20

A-16
Figure A16. Surface Area Analysis Summary Liberty -30

A-17
Figure A17. Surface Area Analysis Summary Liberty -30 Fines

A-18
Figure A18. Surface Area Analysis Summary -80/+140

A-19
Figure A19. Surface Area Analysis Summary Liberty Powderizers -16

A-20
Figure A20. Surface Area Analysis Summary Crackermill

A-21
Figure A21. Surface Area Analysis Summary Cryohammer

A-22
Figure A22. Surface Area Analysis Summary MD-105-TR

A-23
Figure A23. Surface Area Analysis Summary MD-180-TR

A-24
Figure A24. Surface Area Analysis Summary MD-400-AM

A-25
Figure A25. Surface Area Analysis Summary MD-400-TR

A-26
Figure A26. Surface Area Analysis Summary MD-402-TR

B-1
Appendix B: Binder Data
AASHTO M320 Binder Grading Results
Table B1. Base Binder
Original Binder
Test, Method Test Results Specification
Rotational Viscosity @ 135oC, AASHTO T 316, PaS 0.6 ≤ 3 PaS
Dynamic Shear Rheometer AASHTO T 315
Test Temperature, oC G*, kPa
Phase Angle δ, o G* / sinδ, kPa
70 1.00 85.0 1.00 ≥ 1.00 kPa
76 0.51 85.9 0.51
Rolling Thin Film (RTFO) Aged Binder, AASHTO T 240
Mass Change, % -0.195 ≤ 1.00%
Dynamic Shear Rheometer AASHTO T 315
Test Temperature, oC G*, kPa
Phase Angle δ, o G* / sinδ, kPa
70 2.98 79.5 3.03 ≥ 2.20 kPa
76 1.472 81.98 1.49
Pressure Aging Vessel (PAV) Aged Binder, AASHTO R28
Dynamic Shear Rheometer AASHTO T 315
Test Temperature, oC G*, kPa
Phase Angle δ, o G* sinδ, kPa
22 6000 39.8 3842 ≤ 5,000 kPa
19 8749 37.6 5336
Bending Beam Rheometer (BBR) AASHTO T313
Test Temperature, oC
-12 Stiffness, Mpa 146 ≤ 300 Mpa
m-value 0.337 ≥ 0.300
-18 Stiffness, Mpa 282
m-value 0.272
True Grade 70.0 -25.4
PG Grade 70 - 22

B-2
Table B2. -80/+140
Original Binder
Test, Method Test Results Specification
Rotational Viscosity @ 135oC, AASHTO T 316, PaS 1.425 ≤ 3 PaS
Dynamic Shear Rheometer AASHTO T 315
Test Temperature, oC G*, kPa
Phase Angle δ, o G* / sinδ, kPa
82 1.14 81.8 1.16 ≥ 1.00 kPa
88 0.66 82.9 0.67
Rolling Thin Film (RTFO) Aged Binder, AASHTO T 240
Mass Change, % -0.164 ≤ 1.00%
Dynamic Shear Rheometer AASHTO T 315
Test Temperature, oC G*, kPa
Phase Angle δ, o G* / sinδ, kPa
82 3.34 70.5 3.549 ≥ 2.20 kPa
88 1.915 74.35 1.988
Pressure Aging Vessel (PAV) Aged Binder, AASHTO R28
Dynamic Shear Rheometer AASHTO T 315
Test Temperature, oC G*, kPa
Phase Angle δ, o G* sinδ, kPa
19 7091 36 4168 ≤ 5,000 kPa
16 9864 34.2 5543
Bending Beam Rheometer (BBR) AASHTO T313
Test Temperature, oC
-12 Stiffness, Mpa 89 ≤ 300 Mpa
m-value 0.322 ≥ 0.300
-18 Stiffness, Mpa 188
m-value 0.276
True Grade 83.6 -24.9
PG Grade 82 - 22

B-3
Table B3. MD-180-TR
Original Binder
Test, Method Test Results Specification
Rotational Viscosity @ 135oC, AASHTO T 316, PaS 0.825 ≤ 3 PaS
Dynamic Shear Rheometer AASHTO T 315
Test Temperature, oC G*, kPa
Phase Angle δ, o G* / sinδ, kPa
76 1.71 83.2 1.73 ≥ 1.00 kPa
82 0.92 85.3 0.92
Rolling Thin Film (RTFO) Aged Binder, AASHTO T 240
Mass Change, % -0.183 ≤ 1.00%
Dynamic Shear Rheometer AASHTO T 315
Test Temperature, oC G*, kPa
Phase Angle δ, o G* / sinδ, kPa
82 3.33 72.5 3.50 ≥ 2.20 kPa
88 1.86 76.8 1.91
Pressure Aging Vessel (PAV) Aged Binder, AASHTO R28
Dynamic Shear Rheometer AASHTO T 315
Test Temperature, oC G*, kPa
Phase Angle δ, o G* sinδ, kPa
22 6161 38.9 3965 ≤ 5,000 kPa
19 8604 37 5177
Bending Beam Rheometer (BBR) AASHTO T313
Test Temperature, oC
-12 Stiffness, Mpa 112 ≤ 300 Mpa
m-value 0.325 ≥ 0.300
-18 Stiffness, Mpa 234
m-value 0.276
True Grade 81.2 -25.1
PG Grade 76 - 22

B-4
Table B4. MD-400-TR
Original Binder
Test, Method Test Results Specification
Rotational Viscosity @ 135oC, AASHTO T 316, PaS 1.425 ≤ 3 PaS
Dynamic Shear Rheometer AASHTO T 315
Test Temperature, oC G*, kPa
Phase Angle δ, o G* / sinδ, kPa
76 1.55 83.9 1.55 ≥ 1.00 kPa
82 0.85 85.5 0.85
Rolling Thin Film (RTFO) Aged Binder, AASHTO T 240
Mass Change, % -0.215 ≤ 1.00%
Dynamic Shear Rheometer AASHTO T 315
Test Temperature, oC G*, kPa
Phase Angle δ, o G* / sinδ, kPa
82 3.71 70.6 3.938 ≥ 2.20 kPa
88 2.131 74.8 2.209
Pressure Aging Vessel (PAV) Aged Binder, AASHTO R28
Dynamic Shear Rheometer AASHTO T 315
Test Temperature, oC G*, kPa
Phase Angle δ, o G* sinδ, kPa
16 8715 33.7 4829 ≤ 5,000 kPa
13 12050 32 6383
Bending Beam Rheometer (BBR) AASHTO T313
Test Temperature, oC
-12 Stiffness, Mpa 89 ≤ 300 Mpa
m-value 0.316 ≥ 0.300
-18 Stiffness, Mpa 179
m-value 0.273
True Grade 80.4 -24.2
PG Grade 76 - 22

B-5
Table B5. MD-402-TR
Original Binder
Test, Method Test Results Specification
Rotational Viscosity @ 135oC, AASHTO T 316, PaS 1.3 ≤ 3 PaS
Dynamic Shear Rheometer AASHTO T 315
Test Temperature, oC G*, kPa
Phase Angle δ, o G* / sinδ, kPa
76 1.36 84.6 1.37 ≥ 1.00 kPa
82 0.73 85.8 0.73
Rolling Thin Film (RTFO) Aged Binder, AASHTO T 240
Mass Change, % -0.236 ≤ 1.00%
Dynamic Shear Rheometer AASHTO T 315
Test Temperature, oC G*, kPa
Phase Angle δ, o G* / sinδ, kPa
82 3.35 73.3 3.501 ≥ 2.20 kPa
88 1.88 77.2 1.928
Pressure Aging Vessel (PAV) Aged Binder, AASHTO R28
Dynamic Shear Rheometer AASHTO T 315
Test Temperature, oC G*, kPa
Phase Angle δ, o G* sinδ, kPa
22 5192 36.9 3118 ≤ 5,000 kPa
19 7233 35.2 4165
Bending Beam Rheometer (BBR) AASHTO T313
Test Temperature, oC
-12 Stiffness, Mpa 96 ≤ 300 Mpa
m-value 0.306 ≥ 0.300
-18 Stiffness, Mpa 186
m-value 0.27
True Grade 79.0 -23.0
PG Grade 76 - 22

B-6
Table B6. MD-105-TR
Original Binder
Test, Method Test Results Specification
Rotational Viscosity @ 135oC, AASHTO T 316, PaS 1.425 ≤ 3 PaS
Dynamic Shear Rheometer AASHTO T 315
Test Temperature, oC G*, kPa
Phase Angle δ, o G* / sinδ, kPa
76 1.20 82.9 1.21 ≥ 1.00 kPa
82 0.66 83.7 0.66
Rolling Thin Film (RTFO) Aged Binder, AASHTO T 240
Mass Change, % -0.174 ≤ 1.00%
Dynamic Shear Rheometer AASHTO T 315
Test Temperature, oC G*, kPa
Phase Angle δ, o G* / sinδ, kPa
82 2.14 76.92 2.192 ≥ 2.20 kPa
88 1.198 79.9 1.217
Pressure Aging Vessel (PAV) Aged Binder, AASHTO R28
Dynamic Shear Rheometer AASHTO T 315
Test Temperature, oC G*, kPa
Phase Angle δ, o G* sinδ, kPa
19 7319 36.4 4339 ≤ 5,000 kPa
16 10390 34.4 5864
Bending Beam Rheometer (BBR) AASHTO T313
Test Temperature, oC
-12 Stiffness, Mpa 93 ≤ 300 Mpa
m-value 0.317 ≥ 0.300
-18 Stiffness, Mpa 183
m-value 0.289
True Grade 77.9 -25.6
PG Grade 76 - 22

B-7
Table B7. -30 Liberty
Original Binder
Test, Method Test Results Specification
Rotational Viscosity @ 135oC, AASHTO T 316, PaS 1.4 ≤ 3 PaS
Dynamic Shear Rheometer AASHTO T 315
Test Temperature, oC G*, kPa
Phase Angle δ, o G* / sinδ, kPa
76 1.61 82.9 1.62 ≥ 1.00 kPa
82 0.87 84.8 0.87
Rolling Thin Film (RTFO) Aged Binder, AASHTO T 240
Mass Change, % -0.23 ≤ 1.00%
Dynamic Shear Rheometer AASHTO T 315
Test Temperature, oC G*, kPa
Phase Angle δ, o G* / sinδ, kPa
82 3.00 73.2 3.128 ≥ 2.20 kPa
88 1.689 77.1 1.733
Pressure Aging Vessel (PAV) Aged Binder, AASHTO R28
Dynamic Shear Rheometer AASHTO T 315
Test Temperature, oC G*, kPa
Phase Angle δ, o G* sinδ, kPa
19 7989 34 4471 ≤ 5,000 kPa
16 10810 32.5 5805
Bending Beam Rheometer (BBR) AASHTO T313
Test Temperature, oC
-12 Stiffness, Mpa 94 ≤ 300 Mpa
m-value 0.309 ≥ 0.300
-18 Stiffness, Mpa 193
m-value 0.276
True Grade 80.7 -23.6
PG Grade 76 - 22

B-8
Table B8. -20 Liberty
Original Binder
Test, Method Test Results Specification
Rotational Viscosity @ 135oC, AASHTO T 316, PaS 1.887 ≤ 3 PaS
Dynamic Shear Rheometer AASHTO T 315
Test Temperature, oC G*, kPa
Phase Angle δ, o G* / sinδ, kPa
82 1.09 81.5 1.10 ≥ 1.00 kPa
88 0.63 83.1 0.64
Rolling Thin Film (RTFO) Aged Binder, AASHTO T 240
Mass Change, % -0.237 ≤ 1.00%
Dynamic Shear Rheometer AASHTO T 315
Test Temperature, oC G*, kPa
Phase Angle δ, o G* / sinδ, kPa
82 3.23 69.2 3.46 ≥ 2.20 kPa
88 1.929 72.6 2.022
Pressure Aging Vessel (PAV) Aged Binder, AASHTO R28
Dynamic Shear Rheometer AASHTO T 315
Test Temperature, oC G*, kPa
Phase Angle δ, o G* sinδ, kPa
16 9057 33.1 4942 ≤ 5,000 kPa
13 12410 31.5 6476
Bending Beam Rheometer (BBR) AASHTO T313
Test Temperature, oC
-12 Stiffness, Mpa 92 ≤ 300 Mpa
m-value 0.315 ≥ 0.300
-18 Stiffness, Mpa 176
m-value 0.28
True Grade 83.1 -24.6
PG Grade 82 - 22

B-9
Table B9. Liberty Powderizers -16 (1mm gap)
Original Binder
Test, Method Test Results Specification
Rotational Viscosity @ 135oC, AASHTO T 316, PaS 1.6 ≤ 3 PaS
Dynamic Shear Rheometer AASHTO T 315
Test Temperature, oC G*, kPa
Phase Angle δ, o G* / sinδ, kPa
94 0.94 36.2 1.60 ≥ 1.00 kPa
100 0.89 28.34 1.87
Rolling Thin Film (RTFO) Aged Binder, AASHTO T 240
Mass Change, % -0.227 ≤ 1.00%
Dynamic Shear Rheometer AASHTO T 315
Test Temperature, oC G*, kPa
Phase Angle δ, o G* / sinδ, kPa
94 2.65 45.72 3.696 ≥ 2.20 kPa
100 2.131 39 3.384
Pressure Aging Vessel (PAV) Aged Binder, AASHTO R28
Dynamic Shear Rheometer AASHTO T 315
Test Temperature, oC G*, kPa
Phase Angle δ, o G* sinδ, kPa
19 6852 35.1 3935 ≤ 5,000 kPa
16 9509 33.3 5226
Bending Beam Rheometer (BBR) AASHTO T313
Test Temperature, oC
-6 Stiffness, Mpa 55 ≤ 300 Mpa
m-value 0.33 ≥ 0.300
-12 Stiffness, Mpa 102
m-value 0.299
True Grade 76.3 -21.8
PG Grade 76 - 16

B-10
Table B10. Liberty Powderizers -16 (2mm gap)
Original Binder
Test, Method Test Results Specification
Rotational Viscosity @ 135oC, AASHTO T 316, PaS 1.6 ≤ 3 PaS
Dynamic Shear Rheometer AASHTO T 315
Test Temperature, oC G*, kPa
Phase Angle δ, o G* / sinδ, kPa
82 1.28 82.1 1.29 ≥ 1.00 kPa
88 0.73 83.6 0.74
Rolling Thin Film (RTFO) Aged Binder, AASHTO T 240
Mass Change, % -0.227 ≤ 1.00%
Dynamic Shear Rheometer AASHTO T 315
Test Temperature, oC G*, kPa
Phase Angle δ, o G* / sinδ, kPa
88 2.18 72.8 2.282 ≥ 2.20 kPa
94 1.288 76.1 1.327
Pressure Aging Vessel (PAV) Aged Binder, AASHTO R28
Dynamic Shear Rheometer AASHTO T 315
Test Temperature, oC G*, kPa
Phase Angle δ, o G* sinδ, kPa
19 6852 35.1 3935 ≤ 5,000 kPa
16 9509 33.3 5226
Bending Beam Rheometer (BBR) AASHTO T313
Test Temperature, oC
-6 Stiffness, Mpa 55 ≤ 300 Mpa
m-value 0.33 ≥ 0.300
-12 Stiffness, Mpa 102
m-value 0.299
True Grade 84.7 -21.8
PG Grade 82 - 16

B-11
Table B11. Liberty Crackermill
Original Binder
Test, Method Test Results Specification
Rotational Viscosity @ 135oC, AASHTO T 316, PaS 1.99 ≤ 3 PaS
Dynamic Shear Rheometer AASHTO T 315
Test Temperature, oC G*, kPa
Phase Angle δ, o G* / sinδ, kPa
82 1.07 82.1 1.08 ≥ 1.00 kPa
88 0.61 83.9 0.61
Rolling Thin Film (RTFO) Aged Binder, AASHTO T 240
Mass Change, % -0.193 ≤ 1.00%
Dynamic Shear Rheometer AASHTO T 315
Test Temperature, oC G*, kPa
Phase Angle δ, o G* / sinδ, kPa
82 3.21 69.7 3.42 ≥ 2.20 kPa
88 1.899 73.4 1.98
Pressure Aging Vessel (PAV) Aged Binder, AASHTO R28
Dynamic Shear Rheometer AASHTO T 315
Test Temperature, oC G*, kPa
Phase Angle δ, o G* sinδ, kPa
16 10020 33.9 5594 ≤ 5,000 kPa
19 7186 35.6 4186
Bending Beam Rheometer (BBR) AASHTO T313
Test Temperature, oC
-12 Stiffness, Mpa 99 ≤ 300 Mpa
m-value 0.306 ≥ 0.300
-18 Stiffness, Mpa 199
m-value 0.273
True Grade 82.8 -23.1
PG Grade 82 - 22

B-12
Table B12. Liberty Cryohammer
Original Binder
Test, Method Test Results Specification
Rotational Viscosity @ 135oC, AASHTO T 316, PaS 1.675 ≤ 3 PaS
Dynamic Shear Rheometer AASHTO T 315
Test Temperature, oC G*, kPa
Phase Angle δ, o G* / sinδ, kPa
82 1.01 82.8 1.02 ≥ 1.00 kPa
88 0.58 84.2 0.58
Rolling Thin Film (RTFO) Aged Binder, AASHTO T 240
Mass Change, % -0.193 ≤ 1.00%
Dynamic Shear Rheometer AASHTO T 315
Test Temperature, oC G*, kPa
Phase Angle δ, o G* / sinδ, kPa
82 3.14 72.5 3.294 ≥ 2.20 kPa
88 1.793 76.4 1.84
Pressure Aging Vessel (PAV) Aged Binder, AASHTO R28
Dynamic Shear Rheometer AASHTO T 315
Test Temperature, oC G*, kPa
Phase Angle δ, o G* sinδ, kPa
16 9482 33.2 5186 ≤ 5,000 kPa
19 6777 34.95 3883
Bending Beam Rheometer (BBR) AASHTO T313
Test Temperature, oC
-12 Stiffness, Mpa 100 ≤ 300 Mpa
m-value 0.307 ≥ 0.300
-18 Stiffness, Mpa 184
m-value 0.273
True Grade 82.2 -23.2
PG Grade 82 - 22

B-13
Table B13. Liberty Cryohammer at 15% Rubber Content
Original Binder
Test, Method Test Results Specification
Rotational Viscosity @ 135oC, AASHTO T 316, PaS 2.912 ≤ 3 PaS
Dynamic Shear Rheometer AASHTO T 315
Test Temperature, oC G*, kPa
Phase Angle δ, o G* / sinδ, kPa
82 1.52 81.2 1.54 ≥ 1.00 kPa
88 0.88 82.8 0.89
Rolling Thin Film (RTFO) Aged Binder, AASHTO T 240
Mass Change, % -0.259 ≤ 1.00%
Dynamic Shear Rheometer AASHTO T 315
Test Temperature, oC G*, kPa
Phase Angle δ, o G* / sinδ, kPa
88 2.76 73.6 2.88 ≥ 2.20 kPa
94 1.641 77.4 1.682
Pressure Aging Vessel (PAV) Aged Binder, AASHTO R28
Dynamic Shear Rheometer AASHTO T 315
Test Temperature, oC G*, kPa
Phase Angle δ, o G* sinδ, kPa
16 10310 32.1 5471 ≤ 5,000 kPa
19 7744 33.4 4262
Bending Beam Rheometer (BBR) AASHTO T313
Test Temperature, oC
-6 Stiffness, Mpa 46 ≤ 300 Mpa
m-value 0.338 ≥ 0.300
-12 Stiffness, Mpa 302
m-value 0.269
True Grade 86.7 -19.3
PG Grade 82 - 16

B-14
Table B14. Liberty 20 Mesh at 15% Rubber Content
Original Binder
Test, Method Test Results Specification
Rotational Viscosity @ 135oC, AASHTO T 316, PaS 4.050 ≤ 3 PaS
Dynamic Shear Rheometer AASHTO T 315
Test Temperature, oC G*, kPa
Phase Angle δ, o G* / sinδ, kPa
82 1.63 79.5 1.66 ≥ 1.00 kPa
88 0.98 80.4 1.00
Rolling Thin Film (RTFO) Aged Binder, AASHTO T 240
Mass Change, % -0.259 ≤ 1.00%
Dynamic Shear Rheometer AASHTO T 315
Test Temperature, oC G*, kPa
Phase Angle δ, o G* / sinδ, kPa
88 3.20 68.8 3.43 ≥ 2.20 kPa
94 1.955 72 2.06
Pressure Aging Vessel (PAV) Aged Binder, AASHTO R28
Dynamic Shear Rheometer AASHTO T 315
Test Temperature, oC G*, kPa
Phase Angle δ, o G* sinδ, kPa
16 10500 31.4 5471 ≤ 5,000 kPa
19 7645 33.1 4172
Bending Beam Rheometer (BBR) AASHTO T313
Test Temperature, oC
-6 Stiffness, Mpa 43 ≤ 300 Mpa
m-value 0.324 ≥ 0.300
-12 Stiffness, Mpa 85
m-value 0.297
True Grade 87.9 -21.3
PG Grade 82 - 16

B-15
Table B15. -30 Liberty Fines
Original Binder
Test, Method Test Results Specification
Rotational Viscosity @ 135oC, AASHTO T 316, PaS 1.725 ≤ 3 PaS
Dynamic Shear Rheometer AASHTO T 315
Test Temperature, oC G*, kPa
Phase Angle δ, o G* / sinδ, kPa
76 1.44 82.8 1.45 ≥ 1.00 kPa
82 0.80 84.4 0.80
Rolling Thin Film (RTFO) Aged Binder, AASHTO T 240
Mass Change, % -0.256 ≤ 1.00%
Dynamic Shear Rheometer AASHTO T 315
Test Temperature, oC G*, kPa
Phase Angle δ, o G* / sinδ, kPa
82 3.65 69.2 3.90 ≥ 2.20 kPa
88 2.13 73.2 2.23
Pressure Aging Vessel (PAV) Aged Binder, AASHTO R28
Dynamic Shear Rheometer AASHTO T 315
Test Temperature, oC G*, kPa
Phase Angle δ, o G* sinδ, kPa
13 10900 32.4 5835 ≤ 5,000 kPa
16 7959 33.9 4434
Bending Beam Rheometer (BBR) AASHTO T313
Test Temperature, oC
-6 Stiffness, Mpa 54 ≤ 300 Mpa
m-value 0.324 ≥ 0.300
-12 Stiffness, Mpa 109
m-value 0.291
True Grade 79.8 -20.4
PG Grade 76 - 16

B-16
Table B16. MD-400-AM
Original Binder
Test, Method Test Results Specification
Rotational Viscosity @ 135oC, AASHTO T 316, PaS 1.887 ≤ 3 PaS
Dynamic Shear Rheometer AASHTO T 315
Test Temperature, oC G*, kPa Phase Angle
δ, o G* / sinδ, kPa
82 1.00 84.1 1.01 ≥ 1.00 kPa
88 0.58 85.3 0.58
Rolling Thin Film (RTFO) Aged Binder, AASHTO T 240
Mass Change, % -0.281 ≤ 1.00%
Dynamic Shear Rheometer AASHTO T 315
Test Temperature, oC G*, kPa Phase Angle
δ, o G* / sinδ, kPa
88 2.15 73.5 2.24 ≥ 2.20 kPa
94 1.281 76.7 1.32
Pressure Aging Vessel (PAV) Aged Binder, AASHTO R28
Dynamic Shear Rheometer AASHTO T 315
Test Temperature, oC
Test Temperature, oC G*, kPa Phase Angle
δ, o G* sinδ, kPa
19 7520 32.2 4008 ≤ 5,000 kPa
16 9903 31.3 5144
Bending Beam Rheometer (BBR) AASHTO T313
Test Temperature, oC
-6 Stiffness, Mpa 53 ≤ 300 Mpa
m-value 0.323 ≥ 0.300
-12 Stiffness, Mpa 102
m-value 0.294
True Grade 82.1 -20.8
PG Grade 82 - 16

B-17
Table B17. MD-400-TR with Vestenamer
Original Binder
Test, Method Test Results Specification
Rotational Viscosity @ 135oC, AASHTO T 316, PaS 1.712 ≤ 3 PaS
Dynamic Shear Rheometer AASHTO T 315
Test Temperature, oC G*, kPa
Phase Angle δ,
o G* / sinδ, kPa
76 1.79 83.4 1.80 ≥ 1.00 kPa
82 0.98 85.1 0.98
Rolling Thin Film (RTFO) Aged Binder, AASHTO T 240
Mass Change, % -0.268 ≤ 1.00%
Dynamic Shear Rheometer AASHTO T 315
Test Temperature, oC G*, kPa
Phase Angle δ,
o G* / sinδ, kPa
88 2.70 73.8 2.807 ≥ 2.20 kPa
94 1.55 77.5 1.585
Pressure Aging Vessel (PAV) Aged Binder, AASHTO R28
Dynamic Shear Rheometer AASHTO T 315
Test Temperature, oC
Test Temperature, oC G*, kPa
Phase Angle δ,
o G* sinδ, kPa
16 9715 34.1 5067 ≤ 5,000 kPa
19 7248 32.9 3938
Bending Beam Rheometer (BBR) AASHTO T313
Test Temperature, oC
-6 Stiffness, Mpa 51 ≤ 300 Mpa
m-value 0.322 ≥ 0.300
-12 Stiffness, Mpa 105
m-value 0.284
True Grade 81.8 -19.5
PG Grade 76 - 16

B-18
Table B18. Liberty -30 with Vestenamer
Original Binder
Test, Method Test Results Specification
Rotational Viscosity @ 135oC, AASHTO T 316, PaS 1.650 ≤ 3 PaS
Dynamic Shear Rheometer AASHTO T 315
Test Temperature, oC G*, kPa
Phase Angle δ,
o G* / sinδ, kPa
82 1.02 84.1 1.03 ≥ 1.00 kPa
88 0.58 85.5 0.59
Rolling Thin Film (RTFO) Aged Binder, AASHTO T 240
Mass Change, % -0.281 ≤ 1.00%
Dynamic Shear Rheometer AASHTO T 315
Test Temperature, oC G*, kPa
Phase Angle δ,
o G* / sinδ, kPa
88 2.33 69.9 2.48 ≥ 2.20 kPa
94 1.40 69.1 1.50
Pressure Aging Vessel (PAV) Aged Binder, AASHTO R28
Dynamic Shear Rheometer AASHTO T 315
Test Temperature, oC
Test Temperature, oC G*, kPa
Phase Angle δ,
o G* sinδ, kPa
16 9964 32.3 5319 ≤ 5,000 kPa
19 7254 33.8 4037
Bending Beam Rheometer (BBR) AASHTO T313
Test Temperature, oC
-12 Stiffness, Mpa 98 ≤ 300 Mpa
m-value 0.303 ≥ 0.300
-18 Stiffness, Mpa 201
m-value 0.256
True Grade 82.3 -22.4
PG Grade 82 - 22

B-19
Table B19. Blacklidge Hybrid 88-22
Original Binder
Test, Method Test Results Specification
Rotational Viscosity @ 135oC, AASHTO T 316, PaS 1.937 ≤ 3 PaS
Dynamic Shear Rheometer AASHTO T 315
Test Temperature, oC G*, kPa
Phase Angle δ,
o G* / sinδ, kPa
82 1.04 75.1 1.08 ≥ 1.00 kPa
88 0.62 77.5 0.64
Rolling Thin Film (RTFO) Aged Binder, AASHTO T 240
Mass Change, % -0.209 ≤ 1.00%
Dynamic Shear Rheometer AASHTO T 315
Test Temperature, oC G*, kPa
Phase Angle δ,
o G* / sinδ, kPa
82 2.23 69.3 2.39 ≥ 2.20 kPa
88 1.34 71.8 1.41
Pressure Aging Vessel (PAV) Aged Binder, AASHTO R28
Dynamic Shear Rheometer AASHTO T 315
Test Temperature, oC
Test Temperature, oC G*, kPa
Phase Angle δ,
o G* sinδ, kPa
19 8459 36.7 5056 ≤ 5,000 kPa
22 5974 38.6 3708
Bending Beam Rheometer (BBR) AASHTO T313
Test Temperature, oC
-12 Stiffness, Mpa 117 ≤ 300 Mpa
m-value 0.310 ≥ 0.300
-18 Stiffness, Mpa 323
m-value 0.269
True Grade 82.8 -23.5
PG Grade 82 - 22