dry process crumb rubber modification in warm …
TRANSCRIPT
DRY PROCESS CRUMB RUBBER MODIFICATION IN WARM MIX
ASPHALT
A THESIS SUBMITTED TO
THE GRADUATE SCHOOL OF NATURAL AND APPLIED SCIENCES
OF
MIDDLE EAST TECHNICAL UNIVERSITY
BY
FARSHAD KAMRAN
IN PARTIAL FULFILLMENT OF THE REQUIREMENTS
FOR
THE DEGREE OF MASTER OF SCIENCE
IN
CIVIL ENGINEERING
JULY 2018

Approval of the Thesis:
DRY PROCESS CRUMB RUBBER MODIFICATION IN WARM MIX
ASPHALT
submitted by FARSHAD KAMRAN in partial fulfillment of the requirements for
the degree of Master of Science in Civil Engineering Department, Middle East
Technical University by,
Prof. Dr. Halil Kalıpçılar
Dean, Graduate School of Natural and Applied Sciences
Prof. Dr. İsmail Özgür Yaman
Head of Department, Civil Engineering
Asst. Prof. Dr. Hande Işık Öztürk
Supervisor, Civil Engineering Dept., METU
Examining Committee Members
Prof. Dr. Murat Güler
Civil Engineering Dept., METU
Assist. Prof. Dr. Hande Işık Öztürk
Civil Engineering Dept., METU
Prof. Dr. İsmail Özgür Yaman
Civil Engineering Dept., METU
Assoc. Prof. Dr. Hediye Tüydeş Yaman
Civil Engineering Dept., METU
Assist. Prof. Dr. Hikmet Bayırtepe
Civil Engineering Dept., Gazi University
Date: July 31, 2018
iv
I hereby declare that all information in this document has been obtained and
presented in accordance with academic rules and ethical conduct. I also
declare that, as required by these rules and conduct, I have fully cited and
referenced all material and results that are not original to this work.
Name, Last name: Farshad Kamran
Signature :
v
ABSTRACT
DRY PROCESS CRUMB RUBBER MODIFICATION IN WARM MIX
ASPHALT
Kamran, Farshad
M.Sc., Department of Civil Engineering
Supervisor: Asst. Prof. Dr. Hande Isik Ozturk
July 2018, 88 pages
Since the last decade, environmentally friendly asphalt production techniques
have significantly advanced for savings in natural resources, energy and economy.
From these techniques, Warm Mix Asphalt (WMA) provides a reduction in
mixing and compaction temperatures and also overcomes various challenges of
Hot Mix Asphalt (HMA). Additionally, Crumb rubber (CR) modification of
asphalt mixtures helps the disposal of waste tires and also improves the asphalt
mixtures properties. Among CR modification methods, dry process (Dry) method
has various advantages. Thus, the focus of the study is to overcome the major
disadvantages of Dry CR (i.e. high production temperatures) with WMA additive.
In this study, the association of WMA and dry process are studied for the first
time through a broad laboratory study. Therefore, seven different asphalt mixtures
including HMA, dry process CR modified HMA (DryHMA) and five sets of dry
process CR modified WMA (DryWMA) are prepared to analyze the
compactibility, volumetrics, and low-temperature performance properties of these
mixtures. DryWMA mixes are prepared by changing various design parameters
(i.e. WMA additive dosage, conditioning time, compaction and mixing
temperatures). The results of this study stated that the decrease in the mixing
temperatures could not be compensated by extending the conditioning time.
However, the compaction temperature could be considerably lowered without

vi
compromising the low-temperature performance and strength of the mixes. In
addition, use of the WMA additive with the dry CR modified mixtures provides
better compactibility and workability. Moreover, the decreases in the cooling rate
of DryWMA provides longer compaction frame.
Keywords: Warm Mix Asphalt, Dry Process Crumb Rubber, Compactibility,
Volumetric Properties, Low temperature performance
vii
ÖZ
KURU KARISIM LASTIK MODIFIKASYONUNUN ILIK KARISIM
ASFALTLARDA KULLANİMİ
Kamran, Farshad
Yüksek Lisans, İnşaat Mühendisliği Bölümü
Tez Yöneticisi: Dr. Öğr. Üyesi Hande Işık Öztürk
Temmuz 2018, 88 Sayfa
Son on yıldan beri, çevre dostu asfalt üretim teknikleri, doğal kaynaklar, enerji ve
ekonomideki tasarruflar için önemli ölçüde ilerlemiştir. Bu teknikler arasından,
Ilık Karışım Asfalt (IKA) karıştırma ve sıkıştırma sıcaklıklarını azaltır ve Bitümlü
Sıcak Karışım Asfaltın (BSK) getirdiği çeşitli zorluklarını ortadan kaldırır. Bir
diğeri, lastik modifiyeli asfalt karışımlar hurda lastiklerin bertaraf edilmesine
yardım eder ve asfalt karışımların özelliklerini geliştirir. CR modifikasyon
yöntemleri arasında kuru karışım yönteminin çeşitli avantajları vardır. Bu nedenle,
çalışmanın odak noktası, IKA katkısı ile kuru karışım en büyük dezavantajlarının
(ör. yüksek üretim sıcaklıklarının) üstesinden gelmektir. Bu çalışmada, IKA ve
Kuru karışım arasındaki ilişki, ilk defa geniş bir laboratuvar çalışması ile
incelenmiştir. Bu nedenle, BSK, kuru karışım BSK (KuruBSK) ve beş kuru proses
kuru karışım IKA (KuruIKA) içeren yedi farklı asfalt karışımı, bu karışımların
sıkıştırılabilirlik, hacimsel, düşük sıcaklık performansı özelliklerini analiz etmek
için hazırlanmıştır. KuruIKA karışımları, çeşitli tasarım parametrelerini (ör. IKA
katkı dozajı, koşullandırma süresi, sıkıştırma ve karıştırma sıcaklıkları)
değiştirerek hazırlanmıştır. Bu çalışmanın sonuçları, koşullandırma süresinin
uzamasıyla karıştırma sıcaklıklarındaki azalmanın telafi edilemeyeceğini
belirtmiştir. Bununla birlikte, düşük sıcaklık performansı ve karışımların
mukavemetinden ödün vermeden sıkıştırma sıcaklığı önemli ölçüde düşebilir. Ek

viii
olarak, kuru karışımlar ile IKA katkı maddesinin kullanımı daha iyi bir
sıkıştırılabilirlik ve işlenebilirlik sağlar. Ayrıca, KuruIKA soğuma hızındaki
düşüş, daha uzun çalışma süresi sağlar.
Anahtar Kelimeler: Ilık Karışım Asfalt, Kuru Karışım Öğütülmüş Lastik,
Sıkıştırılabilirlik, Hacimsel Özellikler, Düşük Sıcaklık Performansı

ix
To My Parents, Lovely Sisters and Spirits of My Grandfathers
x
ACKNOWLEDGEMENTS
There are a number of people without whom this thesis might not have been
written, and to whom I owe deepest gratitude.
Foremost, I would like to express my deep gratitude to my advisor Asst. Prof. Dr.
Hande Işık Öztürk, who made me to feel myself in home all these years, for her
guidance, advice, patience and wisdom throughout the research.
Also, I appreciate all the helps and supports of Prof. Dr. Murat Güler as the head
of the transportation division.
I take this opportunity to record my sincere thanks to Ahmet Sağlam for the all
helps and encouragements.
To my dear friends Reza Shabani, Ayhan Öner Yücel, Başak Varlı Bingöl and
Yalçın Karakaya for their continuous supports.
My special thanks and appreciate to my colleague Ömer Can Pamuk and Laleh
Sorkhi who were more than friends to me.
And finally, I would like to thank my family: my parents and my sisters for
supporting me throughout my life and all positive energies they sent to me.
xi
TABLE OF CONTENTS
ABSTRACT ............................................................................................................ V
ÖZ……... .............................................................................................................. VII
ACKNOWLEDGEMENTS .................................................................................... X
TABLE OF CONTENTS ....................................................................................... XI
LIST OF TABLES .............................................................................................. XIV
LIST OF FIGUERS .............................................................................................. XV
LIST OF ABBREVIATIONS ............................................................................ XVII
CHAPTERS
1 INTRODUCTION ........................................................................................... 1
1.1 RESEARCH OBJECTIVES ................................................................................ 1
1.2 SCOPE .......................................................................................................... 2
1.3 OUTLINE OF RESEARCH ................................................................................ 3
2 LITERATURE REVIEW ................................................................................ 5
2.1 INTRODUCTION............................................................................................. 5
2.2 WARM MIX ASPHALT .................................................................................. 5
2.2.1 History and Benefits of Warm Mix Asphalt ....................................... 5
2.2.2 Warm Mix Asphalt Additives ............................................................. 6
2.3 CRUMB RUBBER MODIFICATION ................................................................ 10
2.3.1 History and Benefits of Crumb Rubber Modification ...................... 10
2.3.2 Crumb Rubber modification methods ............................................... 11
2.4 MARSHALL MIX DESIGN ............................................................................ 13
2.5 PERFORMANCE TESTS ................................................................................ 16
2.5.1 Indirect Tensile Strength Test (IDT) ................................................. 16
2.6 DETERMINATION OF COOLING CURVES USING MULTICOOL ...................... 18
xii
2.6.1 Starting Time of Operation ................................................................ 20
2.6.2 Environmental Conditions ................................................................. 20
2.6.3 Existing Surface Course .................................................................... 21
2.6.4 Mix Specifications ............................................................................. 21
2.7 PREVIOUS STUDIES ..................................................................................... 22
2.7.1 Warm Mix Asphalt ............................................................................ 22
2.7.2 Crumb Rubber Modification ............................................................. 24
2.7.3 Conditioning time .............................................................................. 26
2.7.4 Indirect Tensile Strength Test (IDT) ................................................. 27
2.7.5 Cooling Curves .................................................................................. 29
3 METHODOLOGY ......................................................................................... 31
3.1 INTRODUCTION ........................................................................................... 31
3.2 MATERIALS ................................................................................................ 31
3.2.1 Aggregates ......................................................................................... 31
3.2.2 Asphalt binder ................................................................................... 33
3.2.3 WMA additives ................................................................................. 34
3.2.4 Crumb Rubber ................................................................................... 35
3.3 DESIGN PROPERTIES ................................................................................... 35
3.3.1 HMA .................................................................................................. 36
3.3.2 DryHMA and DryWMA ................................................................... 36
3.4 EXPERIMENTAL DESIGN .............................................................................. 39
3.4.1 HMA samples .................................................................................... 40
3.4.2 DryHMA samples .............................................................................. 40
3.4.3 DryWMA samples ............................................................................. 40
3.5 SAMPLE PREPARATION ................................................................................ 42
3.5.1 HMA preparation ............................................................................... 42
3.5.2 DryHMA preparation ........................................................................ 43
3.5.3 DryWMA preparation ....................................................................... 43
3.6 EXPERIMENTAL TESTING EQUIPMENT ......................................................... 44
3.6.1 Marshall flow and stability ................................................................ 44
3.6.2 IDT testing machine .......................................................................... 45
xiii
4 RESULTS AND DISSCUSION .................................................................... 47
4.1 INTRODUCTION........................................................................................... 47
4.2 VOLUMETRICS ............................................................................................ 47
4.3 MARSHALL STABILITY AND FLOW ............................................................. 52
4.4 INDIRECT TENSILE TEST ............................................................................. 55
4.5 COOLING CURVE PREDICTIONS .................................................................. 62
5 CONCLUSIONS AND RECOMMENDATIONS ........................................ 67
5.1 INTRODUCTION........................................................................................... 67
5.2 CONCLUSIONS ............................................................................................ 67
5.3 RECOMMENDATIONS .................................................................................. 69
REFERENCES ....................................................................................................... 71
APPENDICES
A: IDT TEST LITERATURE REVIEW ..................................................................... 85
B: HEIGHTS AND AIR VOIDS FOR IDT TEST SAMPLES .......................................... 87
xiv
LIST OF TABLES
TABLES
Table 3-1 Aggregate and CR gradations ............................................................... 32
Table 3-2 Properties tests for aggregates ............................................................... 33
Table 3-3 Asphalt binder properties ...................................................................... 34
Table 3-4 Marshall design properties for HMA without CR ................................ 36
Table 3-5 Marshall Mixture Design Properties of DryHMA ................................ 37
Table 3-6 Optimum Design Properties .................................................................. 39
Table 3-7 Sample properties matrix ...................................................................... 42
Table 4-1 Load and strength value for IDT samples (improvements are given with
respect to 20˚C) ..................................................................................................... 62
Table 4-2 Summary of Multicool Program Inputs and Outputs ............................ 63
Table A-1 Summary of IDT test literature review ................................................ 85
Table B-1 Sample Heights and air voids ............................................................... 87

xv
LIST OF FIGUERS
FIGURES
Figure 2.1 WMA Chemical additive (EVOTHERM) (Evotherm, 2016)................ 7
Figure 2.2 WMA foaming additive (ADVERA)..................................................... 8
Figure 2.3 WMA foaming additive (Aspha-min) ................................................... 8
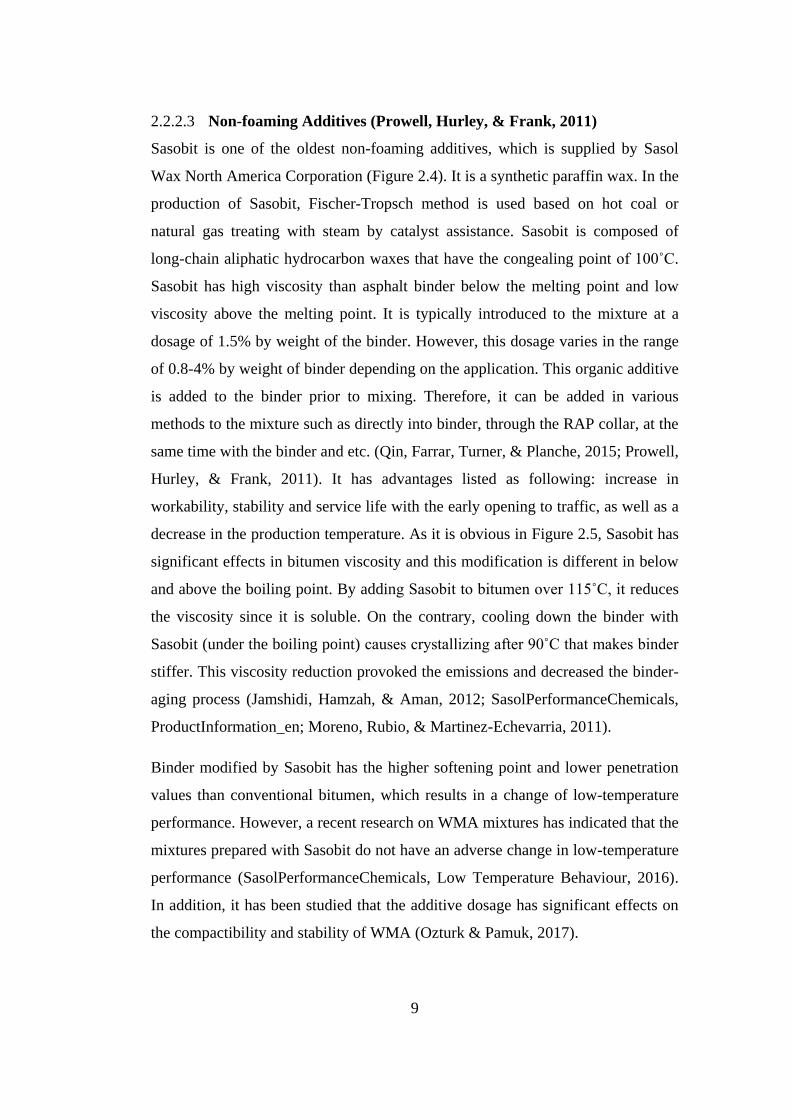
Figure 2.4 WMA Non-foaming additive (Sasobit) ............................................... 10
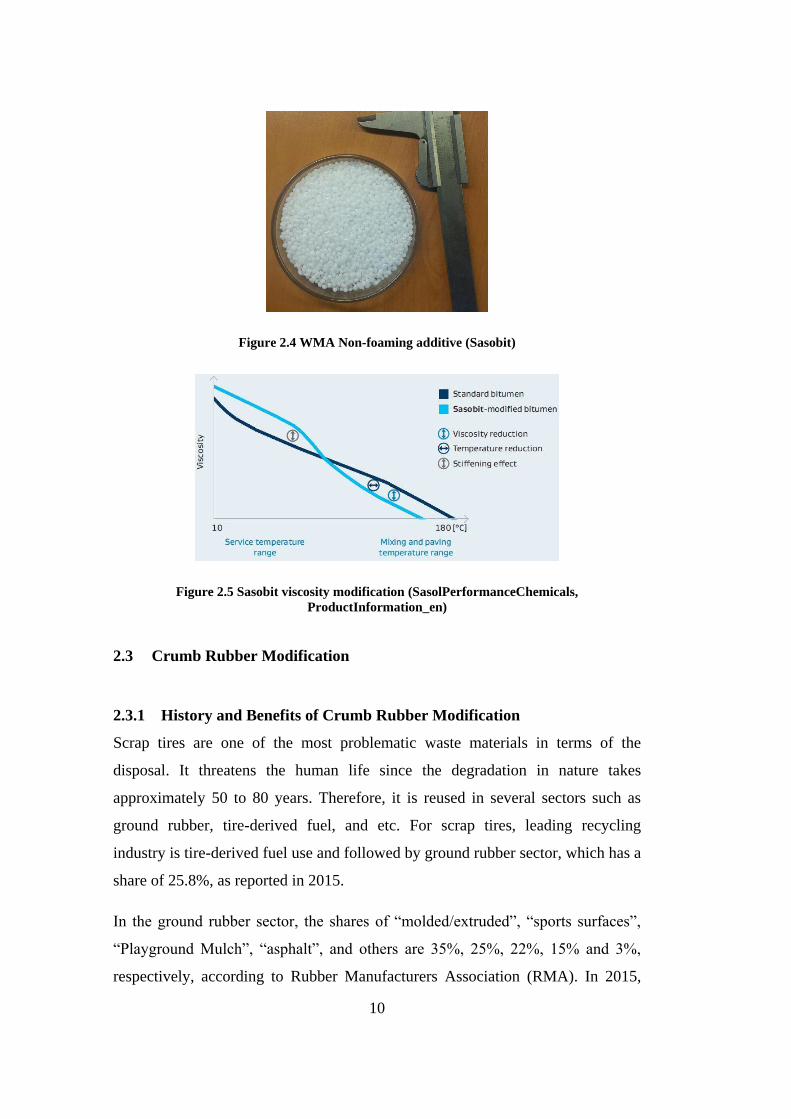
Figure 2.5 Sasobit viscosity modification (SasolPerformanceChemicals,
ProductInformation_en) ........................................................................................ 10
Figure 2.6 Automatic Marshall Compactor .......................................................... 14
Figure 2.7 Marshall Stability Testing Apparatus .................................................. 15
Figure 2.8 IDT strength loading fixture (ASTM D6931, 2012) ........................... 17
Figure 2.9 Indirect Tensile Test Apparatus ........................................................... 18
Figure 2.10 MultiCool Pavement Cooling Program ............................................. 20
Figure 3.1 Aggregate and CR gradations .............................................................. 32
Figure 3.2 Viscosity - Temperature Curve for Ashpalt Bitumen .......................... 33
Figure 3.3 Different CR physical properties ......................................................... 35
Figure 3.4 Air Voids - Asphalt Content ................................................................ 37
Figure 3.5 VMA - Asphalt Content ...................................................................... 37
Figure 3.6 VFA - Asphalt Content ........................................................................ 38
Figure 3.7 Density - Asphalt Content ................................................................... 38
Figure 3.8 Flow - Asphalt Content ........................................................................ 38
Figure 3.9 Stability - Asphalt Content .................................................................. 39
Figure 3.10 Gmb - Asphalt Content ...................................................................... 39
Figure 3.11 Experimental Matrix .......................................................................... 41
Figure 3.12 Pouring sample to molds before compaction .................................... 44
Figure 3.13 Height measurement by caliper ......................................................... 45
Figure 4.1 Air voids of mixtures with respect to conditioning time ..................... 49
Figure 4.2 VMA of mixtures with respect to conditioning time ........................... 50
Figure 4.3 VFA of mixtures with respect to conditioning time ............................ 51
Figure 4.4 Stability of mixtures with respect to conditioning time....................... 54
xvi
Figure 4.5 Flow of mixtures with respect to conditioning time ............................ 55
Figure 4.7 IDT load - deformation ratio at 20˚C ................................................... 57
Figure 4.6 IDT tested samples ............................................................................... 58
Figure 4.8 IDT load - deformation ratio at 5˚C ..................................................... 58
Figure 4.9 IDT load - deformation ratio at -10˚C .................................................. 59
Figure 4.10 IDT strength for different mixtures 20˚C ........................................... 60
Figure 4.11 IDT strength for different mixtures 5˚C ............................................. 61
Figure 4.12 IDT strength for different mixtures -10˚C ......................................... 61
Figure 4.13 Illustration of cooling rates ................................................................ 65
Figure 4.14 Cooling rate of asphalt mixture from mixing to compaction ............. 66
xvii
LIST OF ABBREVIATIONS
AASHTO: American Association of State Highway and Transportation Officials
AC: Asphalt Concrete
ANOVA: Analysis of Variance
AR: Asphalt Rubber
ASTM: American Society for Testing Materials
CR: Crumb Rubber
CSP: Copper Slag Powder
DryHMA: Dry Process Crumb Rubber Modified Hot Mix Asphalt
DryWMA: Dry Process Crumb Rubber Modified Warm Mix Asphalt
DSR: Dynamic Shear Rheometer
FHWA: Federal Highway Administration
Gmb: Bulk Specific Gravity
Gmm: Theoretical Maximum Specific Gravity
Gsb: Bulk Specific Gravity of Aggregates
HMA: Hot Mix Asphalt
IDT: Indirect Tensile Test
LAS: Liquid Antistripping
LDVT: Linear Variable Differential Transformer
LSP: Limestone Powder
METU: Middle East Technical University
NAPA: National Asphalt Pavement Association
NCAT: National Center of Asphalt Technology
PA: Porous Asphalt
xviii
PCC: Portland Cement Concrete
PG: Performance Grade
RAP: Reclaimed Asphalt Pavement
RAS: Recycled Asphalt Shingles
RMA: Rubber Manufacturers Association
RTFO: Rolling Thin-Film Oven
SCB: Semi-circular Bending Test
SMA: Stone Matrix Asphalt
Va: Air Voids
VFA: Voids Filled with Asphalt
VMA: Voids in Mineral Aggregates
VTM: Voids in the Total Mix
WMA: Warm Mix Asphalt
1
CHAPTER 1
1 INTRODUCTION
1.1 Research objectives
In the asphalt pavement industry, environmental and economic concerns trigger
the development of new technologies and methods. In addition, the recent
researches are focusing on the association of the existing and new methods.
Crumb rubber (CR) used in asphalt pavement production has been recognized as
one of the oldest environmentally friendly methods. On the other hand, Warm
Mix Asphalt (WMA) technologies are relatively new, though their use is globally
increased due to their various benefits. Both CR and WMA have different
application methods. In the recent years, many researchers have studied their
association. However, these studies were limited with wet process CR
modification. This study for the first time investigated the use of dry process CR
application with WMA. In the dry process CR application, the CR particles are
used as the fine aggregate replacement. Thus, it is possible to dispose more CR
within the mixture. However, its biggest challenge is the high production
temperatures when compared to traditional mixes. In this study, the advantages of
WMA technologies are incorporated with dry process to turn the negative sides to
positive (i.e. to lower the mixing temperatures). Therefore, various design
parameters (i.e. conditioning time, mixing and compaction temperatures) were
studied. Conditioning time is a significant parameter that affects the bonding
between CR and binder. Therefore, conditioning the mixture prior to compaction
in the oven for four different periods (0, 45, 90 and 120 minutes) and its effects on
the CR-binder interactions were evaluated. In addition, the mixing temperature,
which also influences the bond strength between CR and binder, was studied.
2
Also, as the last selected parameter, compaction temperature, which is related to
the compactibility and workability of mixtures, was analyzed.
In this study, the Marshall Mix design procedure was used due to its superiority in
temperature sensitivity. Accordingly, physical and performance properties of Dry
process CR modified HMA (DryHMA) and Dry process CR modified WMA
(DryWMA) were evaluated through traditional Marshall Procedure. Moreover,
according to the literature, the performance properties of CR modified asphalt
mixtures indicated that these mixtures are more susceptible to low-temperature
cracking. Various researches studied the effects of CR modification and reported
the essential research requirements on low-temperature properties. In this study,
indirect tensile strength test was used to study the low-temperature performance of
DryHMA and DryWMA mixtures.
Finally, to simulate the field conditions, the cooling rates of DryWMA with
DryHMA mixtures were estimated using a free access tool, Multicool, since it is
essential for an actual field project to be able to estimate the cooling period for
better management. If not, it could cause various problems during the lay down of
mixture in the field.
1.2 Scope
The major steps of this study were given as follows:
1- Preparation of Marshall Mix Designs for Hot Mix Asphalt (HMA), Dry
process CR modified HMA (DryHMA) and Dry process CR modified
WMA (DryWMA).
2- Development of the experimental matrix. In other words, selection of the
mix parameters (i.e. conditioning time, compaction and mixing
temperatures), physical and performance tests.
3- Analyzing the effect of mix parameters on the physical properties (i.e. on
volumetrics) and on the performance according to stability and flow.
4- Reducing the sample size according to the outcomes of Step 3.
3
5- Performing indirect tensile strength (IDT) test to study the low-
temperature performance properties of mixtures.
6- Determination of the cooling curves of DryHMA and DryWMA to
compare the construction time frames using the Multicool program.
1.3 Outline of research
Chapter 2 includes a broad literature review of both CR and WMA, separately. As
well, it presents the latest literature on the association of wet process CR and
WMA. In addition, the test methods used in this study are summarized in this
chapter.
Following the literature review part, chapter 3 is prepared to identify the materials
that are used in this research. Mixture properties, experimental plan, sample
preparation methods and testing procedures are provided in details.
Chapter 4 contains the results and discussion of the tests. Initially, the volumetric
properties of the samples are given and discussed. Then, the initial performance
evaluation of these mixes is done based on the stability and flow results. In the
following, low temperature cracking resistance is analyzed through Indirect
Tensile Strength tests. Accordingly, the relation between the mixture parameters
and performance attributes are discussed in detail. Finally, the cooling rate of the
mixtures is studied and compared in this chapter.
In chapter 5, conclusions are driven according to the results provided in chapter 4.
In addition, recommendations for future works are provided in the light of the
study.

4
5
CHAPTER 2
2 LITERATURE REVIEW
2.1 Introduction
In the pavement industry, new technologies and production methods have been
progressively introduced not only because of the importance of cost and time
saving but also because of the environmental concerns. In this chapter, two of
these methods, Warm Mix Asphalt (WMA) and crumb rubber modified mixtures,
and also their associations are discussed in detail by summarizing the latest
available literature.
2.2 Warm Mix Asphalt
2.2.1 History and Benefits of Warm Mix Asphalt
WMA is the name of a relatively new technology, which allows producers to
prepare, transport, mix and place the asphalt mixture in lower temperatures than
conventional temperatures (Moreno, Rubio, & Martinez-Echevarria, 2011). This
reduction in temperature can be about 20-40˚C lower than that of Hot Mix Asphalt
(HMA). This temperature reduction means less energy consumption by burning
less fuel, which could reduce approximately the energy use by 30-35%.
WMA technologies reduce the viscosity at lower temperatures, which increase the
compactibility. It results in more uniform density and decreases the roller passes
to targeted density (Hossain, et al., 2009; D'Angelo, et al., 2008). Besides, it cools
slower than the convenient HMA and offers workers more time to work in lower
temperatures and increase the hauling distances. Therefore, the paving can be
done in cold regions and as well in cooler months. Furthermore, this method can
6
be used in combination with reclaimed asphalt pavement (RAP), recycled asphalt
shingles (RAS) and other reused materials that makes it subject of interest (West,
et al., 2014). Using additives and foaming technologies are the major methods of
WMA. Various field and laboratory studies have already proven that if WMA
mixtures are designed properly, these mixtures are able to perform equivalent or
better than HMA mixtures (West, et al., 2014).
First WMA studies were initiated in Europe during 1995-96, which yielded to the
first field trial in 1997-99. Since then, WMA took attention in USA and National
Asphalt Pavement Association (NAPA) organized a study tour to Europe in 2002.
Denmark, Germany and Norway were their destination in which various
technologies of WMA such as (i) Aspha-min (ii) WAM Foam and (iii) Sasobit
were investigated (Qin, Farrar, Turner, & Planche, 2015; Prowell, Hurley, &
Frank, 2011). In the light of this tour, first field trails in USA were followed with
Aspha-min in Florida and Indiana, and then Ontario and Quebec in Canada.
In 2005-06 numerous field trials were done and the State of Missouri started to
use WMA in paving based on successful trials. National Center of Asphalt
Technology (NCAT) published research results on Aspha-min, Sasobit and
Evotherm around the same time (Prowell B. , 2007). In 2007, AASHTO-Federal
Highway Administration (FHWA) started a tour to Belgium, France, Germany
and Norway. Over 20 WMA technologies were available in the U.S. market by
2010. According to a survey prepared by FHWA, WMA usage in 2009 and 2010
was estimated to be 17 million tons and 47 million tons, respectively. At the end
of 2011, all 50 states of the USA had WMA trail sections. Engineering,
environmental and economic benefits of WMA technologies were the reasons that
their usage has been significantly increased (Larsen, Moen, Robertus, &
Koenders, 2004; Cervarich, 2003; De Groot, et al., 2001; Prowell B. , 2007).
2.2.2 Warm Mix Asphalt Additives
WMA technologies majorly categorized as (i) Chemical Additives or Surfactants,
(ii) Foaming Processes and (iii) Non-foaming Additives. Under each technology,
there are various materials and methods developed in recent years. Therefore, for
7
each technology, one or two of the common methods were selected and discussed
in this section.
Chemical Additives or Surfactants 2.2.2.1
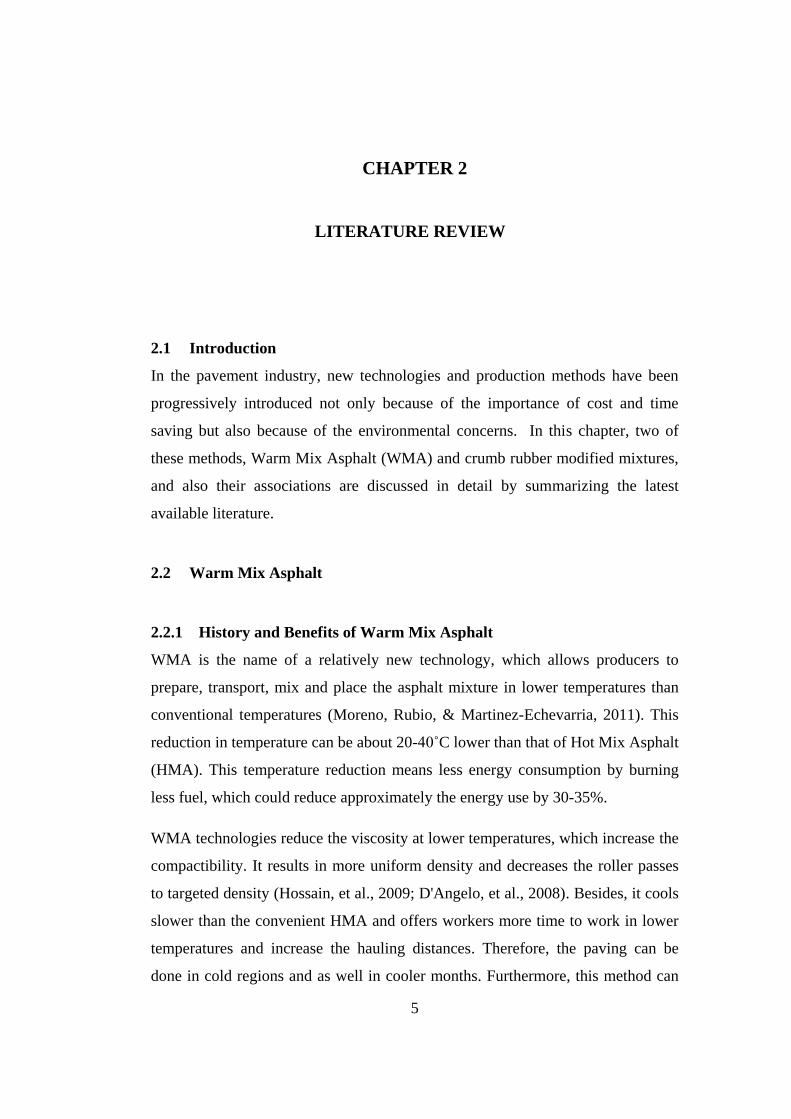
Evotherm (Figure 2.1), one of the oldest chemical additives in the industry, is
manufactured by MeadWestvaco Asphalt Innovations. It is developed in the U.S.
under the names of Evotherm Emulsion Technology (ET) (2004), Evotherm
Dispersed Asphalt Technology (DAT) (2007), and Evotherm 3G. These additives
are mixed with hot aggregates to reduce the mix temperatures approximately till
85˚ to 115˚C. Typically, the additive is added approximately 5% by weight of
binder.
Figure 2.1 WMA Chemical additive (EVOTHERM) (Evotherm, 2016).
Evotherm have benefits such as liquid antistripping (LAS) replacement, more
RAP and RAS usage, fiber removal, reduction in binder usage during design step;
longer hauling, lower emissions, less thermal segregations in the production of
pavement; also longer life and compaction improvement as the performance phase
(Ingevity; Prowell, Hurley, & Frank, 2011).
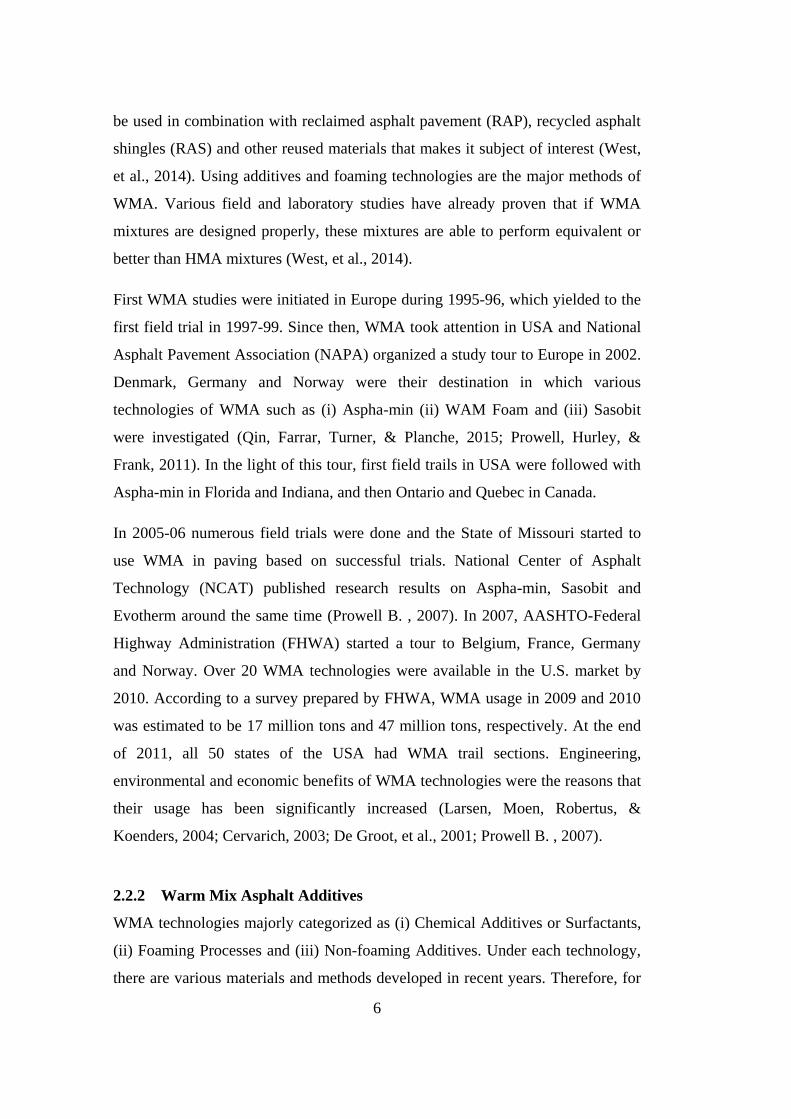
Foaming Process 2.2.2.2
Advera WMA (Figure 2.2) is one of the most common foaming based additives
which is supplied by PQ Corporation. It is a synthetic zeolite in powder form with
very fine gradation (passing No. 200 sieve.) The major ingredients are zeolite (78-
82%) and water (18-22%), which the water releases when the temperature of the
mix is over the boiling point of it and this results in foaming. Thus, it provides
workability improvement by increasing the binder volume. Advera is insoluble in
the water with a melting point over 1000˚C and classified as an odorless material.
Typically, 0.20 to 0.25% by weight of total mixture is recommended to be used in
8
the asphalt mixtures. However, if binder content is over 7% by weight of the mix,
it is recommended to add at higher dosage levels. The mixtures prepared with
Advera have approximately 28˚C lower mixing and compaction temperatures than
the traditional HMA. Since 2006, over 1 million tons of WMA mixtures with
Advera have been used in US and Canada. Besides, this additive is also
widespread through Europe and Asia (Hasan, Goh, & You, 2013; PQCorporation,
2015; Prowell, Hurley, & Frank, 2011).
Figure 2.2 WMA foaming additive (ADVERA)
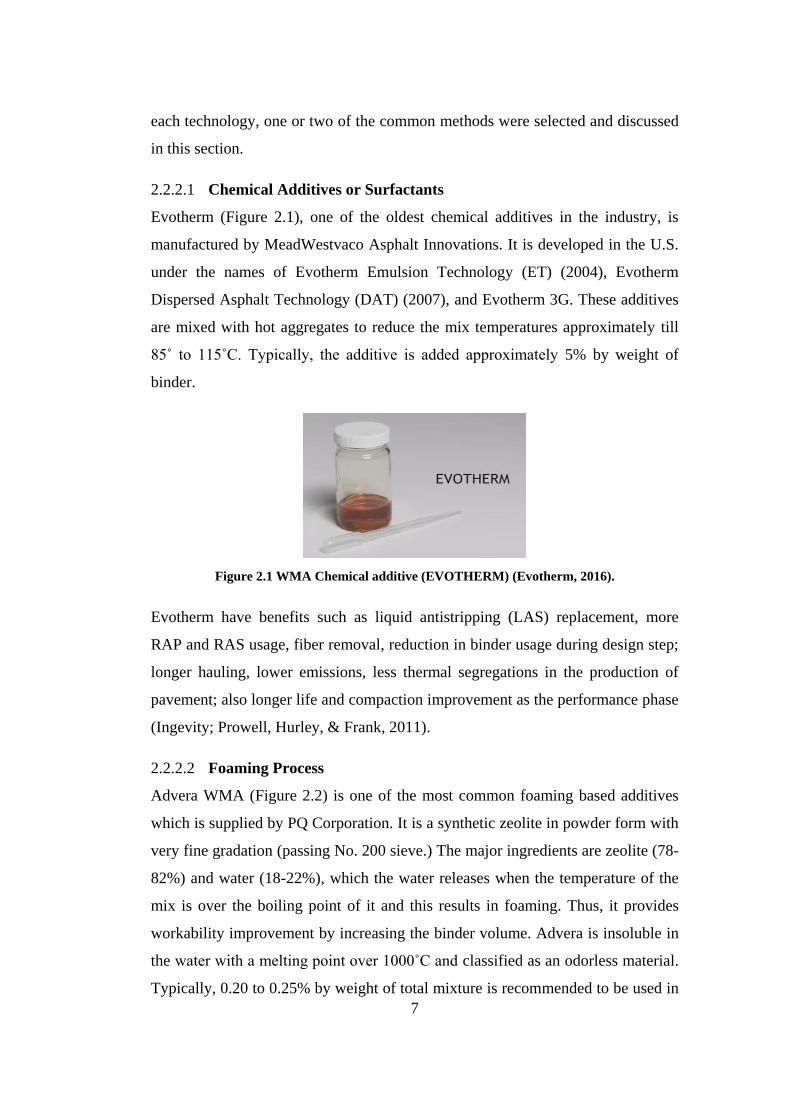
Aspha-min (Prowell, Hurley, & Frank, 2011) is another foaming based additive
developed by Aspha-min GmbH in Hanau, Germany in 2006. It is also a zeolite
manufactured synthetically containing 20% water by weight. Thus, the foaming
starts after the boiling point of water. Aspha-min provides a longer working
period compared to Advera (up to 6 to 7 hours) and it can be used before mixture
cooled down to 100˚C. It is recommended to be used typically 0.3% by weight of
the total mix. Its gradation is coarser than Advera, with particle size around
0.3mm. It should be noted that it can be also used as a compaction aid in HMA
(TheHubbardGroup).
Figure 2.3 WMA foaming additive (Aspha-min)
9
Non-foaming Additives (Prowell, Hurley, & Frank, 2011) 2.2.2.3
Sasobit is one of the oldest non-foaming additives, which is supplied by Sasol
Wax North America Corporation (Figure 2.4). It is a synthetic paraffin wax. In the
production of Sasobit, Fischer-Tropsch method is used based on hot coal or
natural gas treating with steam by catalyst assistance. Sasobit is composed of
long-chain aliphatic hydrocarbon waxes that have the congealing point of 100˚C.
Sasobit has high viscosity than asphalt binder below the melting point and low
viscosity above the melting point. It is typically introduced to the mixture at a
dosage of 1.5% by weight of the binder. However, this dosage varies in the range
of 0.8-4% by weight of binder depending on the application. This organic additive
is added to the binder prior to mixing. Therefore, it can be added in various
methods to the mixture such as directly into binder, through the RAP collar, at the
same time with the binder and etc. (Qin, Farrar, Turner, & Planche, 2015; Prowell,
Hurley, & Frank, 2011). It has advantages listed as following: increase in
workability, stability and service life with the early opening to traffic, as well as a
decrease in the production temperature. As it is obvious in Figure 2.5, Sasobit has
significant effects in bitumen viscosity and this modification is different in below
and above the boiling point. By adding Sasobit to bitumen over 115˚C, it reduces
the viscosity since it is soluble. On the contrary, cooling down the binder with
Sasobit (under the boiling point) causes crystallizing after 90˚C that makes binder
stiffer. This viscosity reduction provoked the emissions and decreased the binder-
aging process (Jamshidi, Hamzah, & Aman, 2012; SasolPerformanceChemicals,
ProductInformation_en; Moreno, Rubio, & Martinez-Echevarria, 2011).
Binder modified by Sasobit has the higher softening point and lower penetration
values than conventional bitumen, which results in a change of low-temperature
performance. However, a recent research on WMA mixtures has indicated that the
mixtures prepared with Sasobit do not have an adverse change in low-temperature
performance (SasolPerformanceChemicals, Low Temperature Behaviour, 2016).
In addition, it has been studied that the additive dosage has significant effects on
the compactibility and stability of WMA (Ozturk & Pamuk, 2017).
10
Figure 2.4 WMA Non-foaming additive (Sasobit)
Figure 2.5 Sasobit viscosity modification (SasolPerformanceChemicals,
ProductInformation_en)
2.3 Crumb Rubber Modification
2.3.1 History and Benefits of Crumb Rubber Modification
Scrap tires are one of the most problematic waste materials in terms of the
disposal. It threatens the human life since the degradation in nature takes
approximately 50 to 80 years. Therefore, it is reused in several sectors such as
ground rubber, tire-derived fuel, and etc. For scrap tires, leading recycling
industry is tire-derived fuel use and followed by ground rubber sector, which has a
share of 25.8%, as reported in 2015.
In the ground rubber sector, the shares of “molded/extruded”, “sports surfaces”,
“Playground Mulch”, “asphalt”, and others are 35%, 25%, 22%, 15% and 3%,
respectively, according to Rubber Manufacturers Association (RMA). In 2015,
11
around 1.2 million tons of ground rubbers were used in the asphalt mixtures
(RMA, 2016). California State in the US has already prepared official instructions
for increasing in crumb rubber usage in asphalt pavements (Caltrans, 2003)
First rubber modification of binder was made in the 1840s, and then after 1950s,
various suppliers started to provide rubber for asphalt pavements. Considering
several researches have been completed in years, three major crumb rubber
modification methods are introduced as discussed in the following section
(Santucci, 2009).
2.3.2 Crumb Rubber modification methods
Three major methods used in asphalt modification are wet process, dry process
and terminal blend. There are several advantages and disadvantages of these
methods as discussed in the following.
Wet Process 2.3.2.1
According to ASTM D8, MacDonald Method named as Asphalt Rubber (AR) or
wet process crumb rubber modification is defined as a blend of asphalt binder
with additives and crumb rubber, in which CRs’ amount should not exceed 15%
by weight of the binder that is about 1-1.5% of total weight of mixture. It is the
oldest method of CR modification, which started in the 1960s. In this method, the
CR particles in the hot asphalt binder should be properly mixed and swelled by
holding around 190-225˚C for at least 45 minutes to permit an interaction within
the particles and binder. However, this blending procedure results in the increase
of the binder viscosity. It should be noted that time and temperature for blending,
type and amount of mechanical mixing, CR properties (i.e. size, type and specific
area), and also binder type are the effective parameters in the CR-binder
interaction. Typically, the CR gradation is selected in the range of 0.075 to
1.2mm. In this method, the aggregate gradation is commonly preferred to be open
graded. Beside, seal coats, interlayers and crack seals are alternative uses of AR
(Rahman, 2004; Santucci, 2009; Wright Asphalt Products Co., 2008).
12
Mixtures prepared with wet process method have better or equal performance
properties when compared to polymer-modified mixtures. On the other hand,
segregation of CR particles may be observed if the CR-binder blending is not
properly done (Ozturk, Tascioglu, Kutay, & Littrup, 2012).
Dry Process 2.3.2.2
Dry process is based on the replacement of 1-3% of the fine aggregates with CR.
In this method, aggregates, binder and CR are mixed at the same time. Therefore,
CR in the mixture appears as rubber aggregates. In the 1960’s, first dry process
modified mixture was applied in Sweden and patented under the name of
“Rubite”. Later in 1978, this technology was transferred to the United States by
the name of “PlusRide” (Heitzman, 1992; Rahman, 2004). Although there can be
a limited amount of interactions between CR and asphalt binder throughout the
time of mixing in the plant, storage, hauling and compaction of the mixture,
asphalt binder is not considered to be modified in the dry application (Wright
Asphalt Products Co., 2008). As the advantages of the dry process CR
modification, improve in skid resistance and de-icing properties, inexpensive
application and more CR disposal could be listed. On the other hand, anti-oxidants
are not completely mixed with binder due to short binder-CR interaction period.
Therefore, if dry process CR modified mixtures are not designed properly, it may
lead to the several performance problems in the pavement.
To compact the dry process crumb rubber mixes, high mixing and compaction
temperatures are required in order to prevent the segregation and poor
performance. It is recommended to increase the conventional mixing and
compaction temperatures by 10˚C to have the binder-CR interaction (Moreno,
Rubio, & Martinez-Echevarria, 2011). Typically, these temperatures are about
149-177˚C. Aggregates should be heated and mixed with CR before adding
bitumen to provide homogeneous distribution CR within the aggregate batch.
Furthermore, the laying and stopping temperatures should be at least 121˚C and
60˚C, respectively. Stopping temperature is specified to prevent the possibility of
rubbers swelling (Amirkhanian, 2001; Rahman, 2004).
13
Terminal blend 2.3.2.3
Terminal blend method is similar to the wet process, but, polymers are also used
to prevent CR particles to suspend in the modified binder. In this method, CR
particles are mixed with binder and polymers at the refinery or terminal. CR is
typically added to the binder at 190-204˚C at a rate of 0.6% by total weight of
mixture in this method (Wright Asphalt Products Co., 2008).
In this method, dense graded aggregate gradations can be used in addition to open
and gap graded ones. As the advantages of this method, it could be mentioned that
it could provide superior performance as compare to many polymer modified
asphalt pavements (Santucci, 2009). There is no segregation of CR particles and
hauling distances for the mixture are longer. On the other hand, its production is
costly, and also CR amount used in this method is less, as compare to other CR
modification methods.
2.4 Marshall Mix Design
Marshall Mix design was developed by Mississippi Highway Department in 1939.
In the following years, U.S. Army advanced this method during World War II to
overcome the load and tire pressures created by huge military aircraft. The
procedure aims to determine the optimum binder content at the targeted density
while meeting the minimum stability and flow value (White, 1985).
Six main steps for Marshall Mix design are defined as follow:
a) Selection of aggregates and determination of aggregate gradation: Physical
properties of aggregates such as toughness and abrasion, durability and soundness,
cleanliness and deleterious materials, particle shape and surface texture are
determined according to the desired standards to certify its usage in asphalt
pavement production. Then, aggregate gradation is identified within the limits of
the desired specification, which is followed by aggregate blending calculations.
Finally, the specific gravity and absorption of the aggregate blend are determined
for further calculations.
14
b) Evaluation of asphalt binder: Binder properties such as penetration, softening
point, flash and fire point, ductility and etc. are determined to identify the
appropriateness for the design location according to climate. As well as these
properties, viscosity test is performed to determine the mixing and compaction
temperatures.
c) Procedure for Sample preparation: According to the estimated binder content
for the aggregate blend specified in the initial step, sample sets with three
replicates are typically prepared as three sets over and three sets below the
optimum binder with the increments of ±0.5%. The physical (i.e. air voids, (Va),
density, voids in mineral aggregates (VMA) and voids filled with asphalt (VFA))
and the performance (i.e. stability and flow) properties of these samples are
analyzed to determine the optimum binder content.
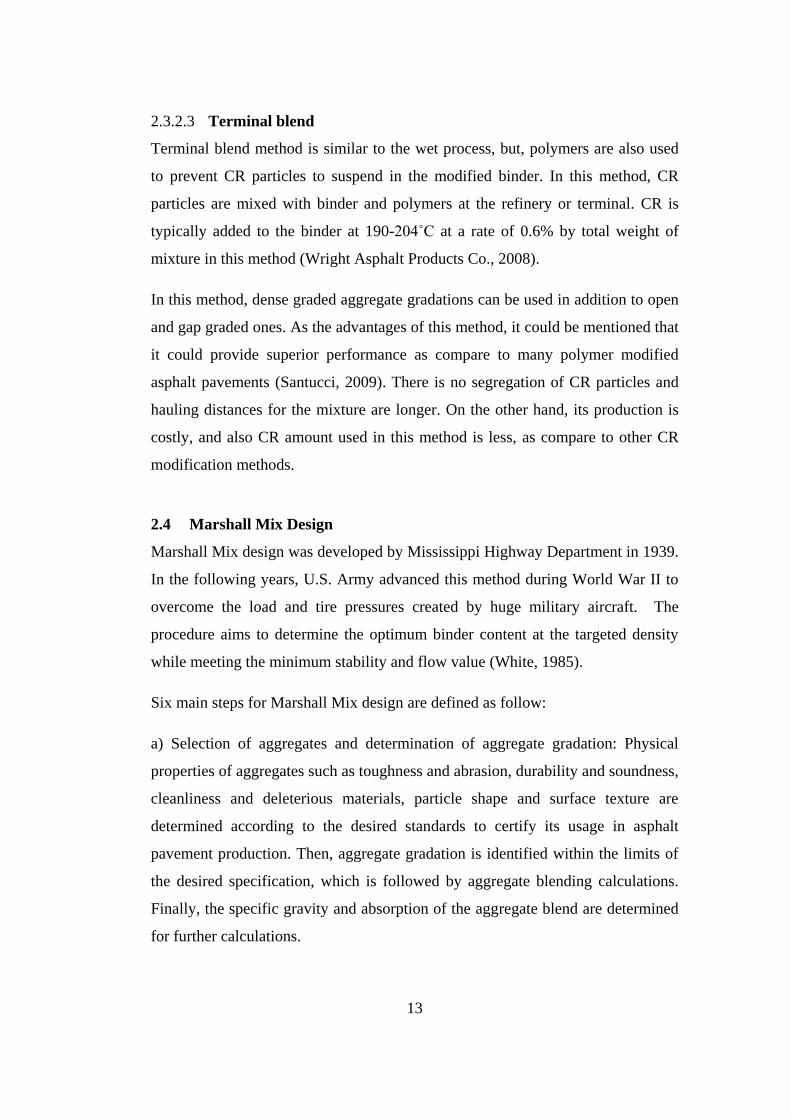
Marshall compactors (Figure 2.6) can be manual or automatic with features
specified in the standard. Samples sizes are approximately 102mm in diameter
and 64mm in height. Tamper foot is flat and circular with a diameter of 98.4mm,
76cm2 area. A hammer weighing 4536gr applies the compaction pressure by
falling freely from a height of 457.2mm. According to the design traffic load,
compaction effort varies as 35, 50, 75 blows per side.
Figure 2.6 Automatic Marshall Compactor
15
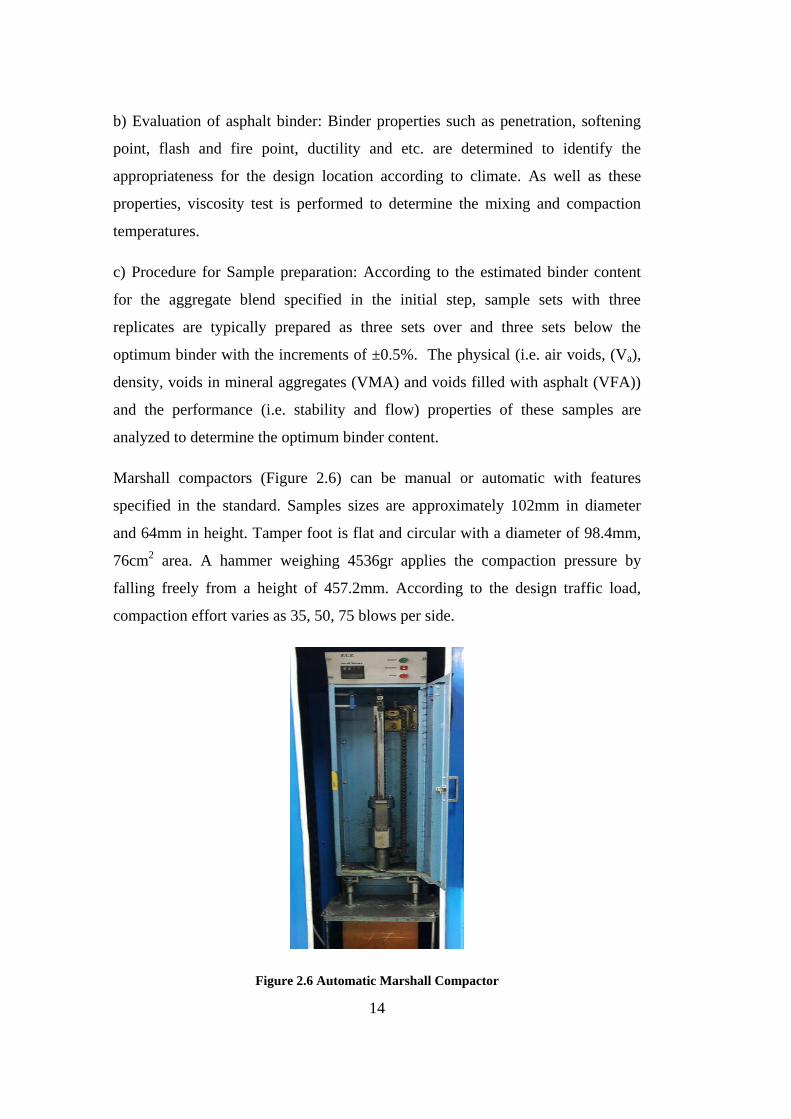
d) Determination of Marshall Stability and flow: Marshall Stability is a simple
measurement for performance attributes of the specimens. It measures the
maximum load, which can be carried by the test sample at the loading rate of
50.8mm/minute. Meanwhile, a gauge records the plastic flow of the sample.
e) Determination of Volumetric properties: Bulk specific gravity (Gmb) of the
compacted mixtures and theoretical maximum specific gravity (Gmm) of loose
mixtures are determined in order to calculate Va, VMA and VFA.
f) Selection of optimum asphalt binder: Last step in Marshall mix design
procedure is the determination of the optimum binder. This content is estimated
by analyzing the results of stability, flow, density, air voids, VMA and VFA with
respect to binder content. The optimum asphalt binder content corresponding to
the specified air void content is determined and the six parameters listed above are
compared with respect to standard limits. As a final step, a final mix with the
estimated optimum binder content should be prepared for the verification of the
design. If these results do not meet the standard limits, it needs to be redesign
(Roberts F. L., Kandhal, Brown, Lee, & Kennedy, 1996).
Figure 2.7 Marshall Stability Testing Apparatus
16
2.5 Performance Tests
Mix designs need to be further evaluated to estimate their field performance.
Therefore, several performance tests are developed to simulate the field distresses
through the life of the pavement. Marshall stability and flow test is one of the
basic performance tests, to measure the strength of the mixtures. However, further
analyses are needed to investigate the low and high temperature performance of
mixtures. Therefore, various tests are advanced to estimate fatigue cracking,
rutting, moisture susceptibility; as well to measure tensile strength and stiffness
(Brown, Kandhal, & Zhang, 2001).
High temperatures performance of CR modified mixtures were studied by many
researchers and results of these studies indicated that CR modification of asphalt
mixtures commonly yielded to have better performances in terms of rutting
(Rodríguez-Alloza, Gallego, Pérez, Bonati, & Giuliani, 2014; Sebaaly, Gopal, &
Epps, 2003; Subhy, Presti, & Airey, 2017; Wang, Dang, You, & Cao, 2012). On
the other hand, some researchers pointed out that low-temperature performance of
the dry process crumb rubber is critical. Therefore, upon these various
performance parameters, only indirect tensile strength is discussed in this chapter.
Indirect tensile strength test is used to investigate the low-temperature cracking
potential of the asphalt mixtures; since low-temperature cracks typically result in
top-down cracks regardless of the presence of traffic loads (Brown, Kandhal, &
Zhang, 2001).
2.5.1 Indirect Tensile Strength Test (IDT)
Indirect tensile strength test is typically used to estimate the cracking potential of
asphalt mixtures due to its ease in testing, in which higher tensile strength tends to
better crack resistance (Bindu, 2012).
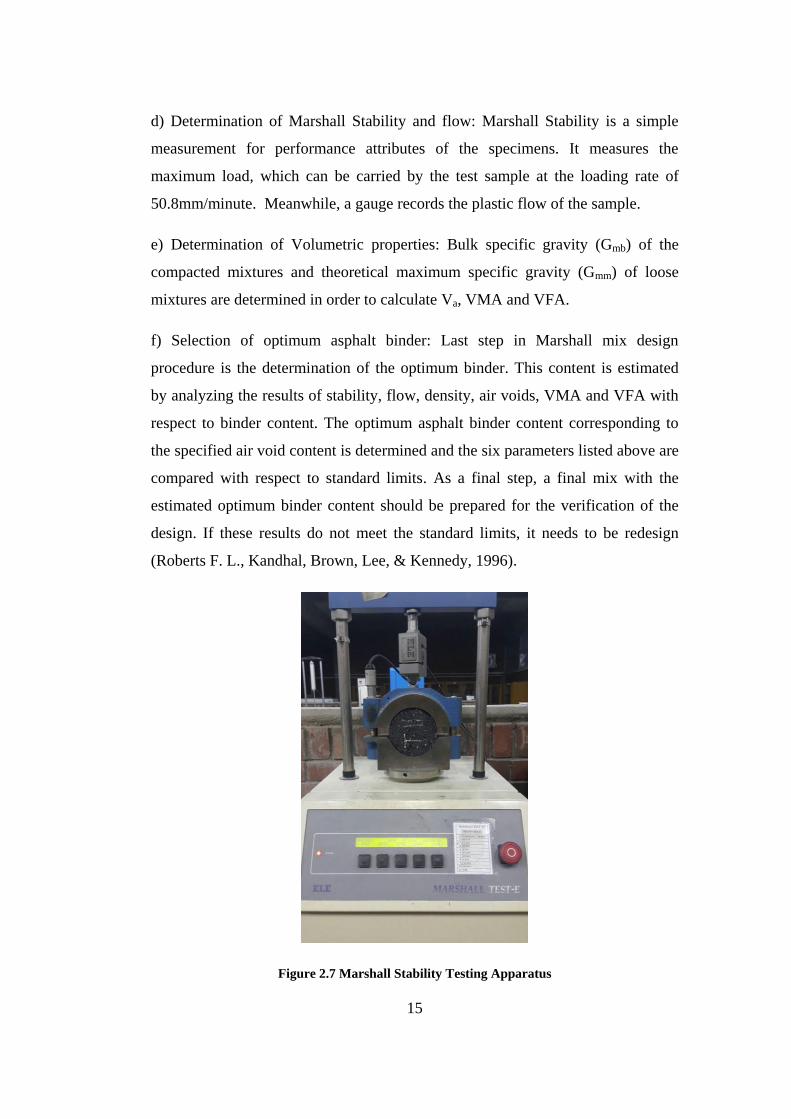
ASTM D6931: Standard Test Method for Indirect Tensile (IDT) Strength of
Asphalt Mixtures is followed to test the 100mm diameter Marshall samples. The
samples are placed between the loading strips having a thickness of 12.70±0.3mm
and loaded towards its diametric plane with a constant rate of 50mm/minute, as
shown in Figure 2.8 and Figure 2.9. In addition, for the samples with 150mm
17
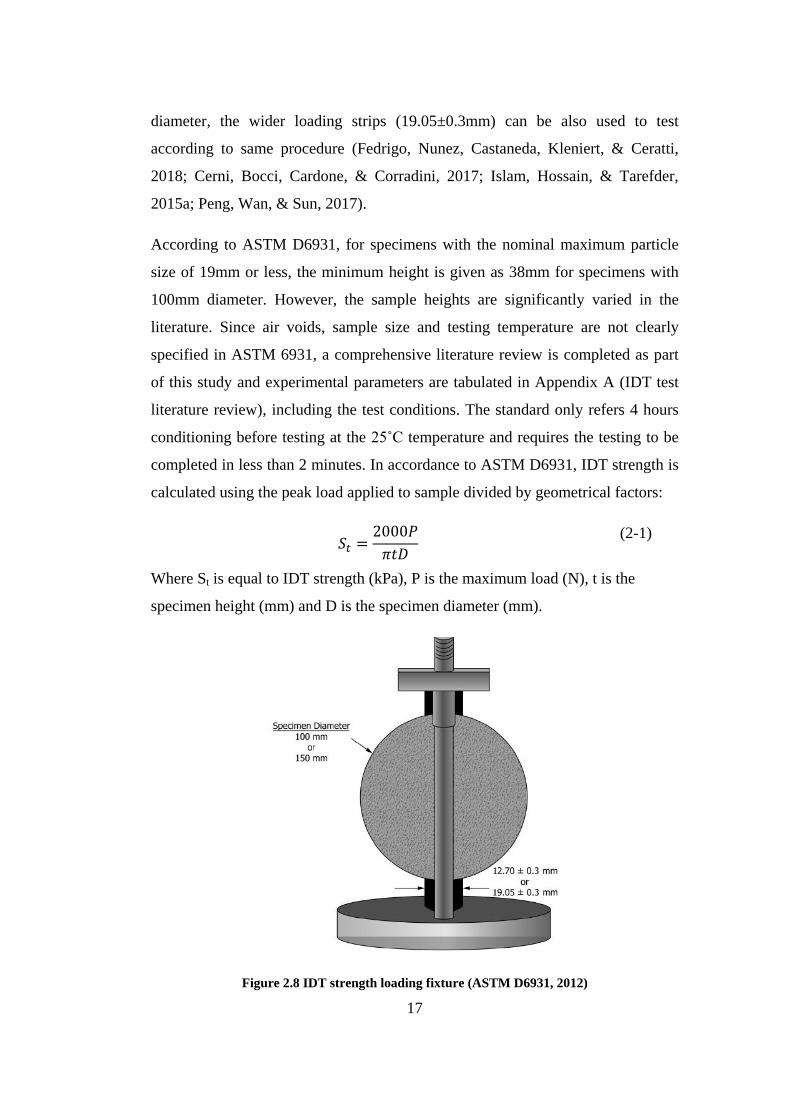
diameter, the wider loading strips (19.05±0.3mm) can be also used to test
according to same procedure (Fedrigo, Nunez, Castaneda, Kleniert, & Ceratti,
2018; Cerni, Bocci, Cardone, & Corradini, 2017; Islam, Hossain, & Tarefder,
2015a; Peng, Wan, & Sun, 2017).
According to ASTM D6931, for specimens with the nominal maximum particle
size of 19mm or less, the minimum height is given as 38mm for specimens with
100mm diameter. However, the sample heights are significantly varied in the
literature. Since air voids, sample size and testing temperature are not clearly
specified in ASTM 6931, a comprehensive literature review is completed as part
of this study and experimental parameters are tabulated in Appendix A (IDT test
literature review), including the test conditions. The standard only refers 4 hours
conditioning before testing at the 25˚C temperature and requires the testing to be
completed in less than 2 minutes. In accordance to ASTM D6931, IDT strength is
calculated using the peak load applied to sample divided by geometrical factors:
𝑆𝑡 =2000𝑃
𝜋𝑡𝐷
(2-1)
Where St is equal to IDT strength (kPa), P is the maximum load (N), t is the
specimen height (mm) and D is the specimen diameter (mm).
Figure 2.8 IDT strength loading fixture (ASTM D6931, 2012)
18
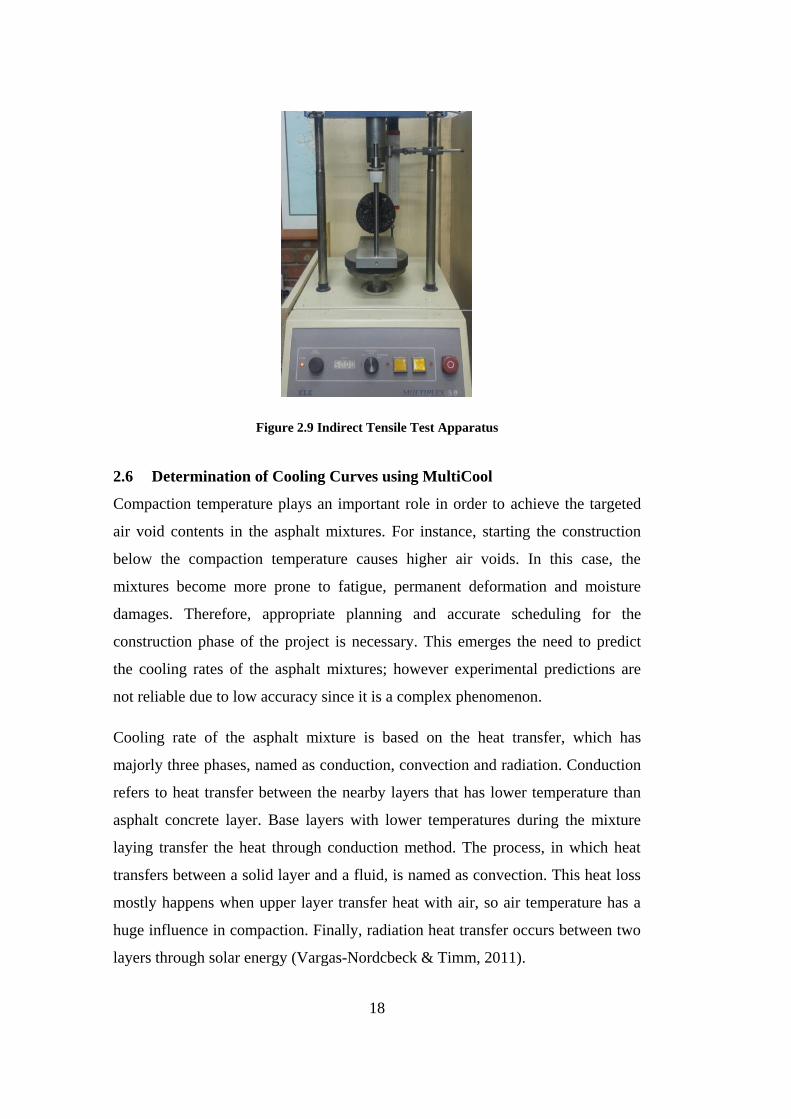
Figure 2.9 Indirect Tensile Test Apparatus
2.6 Determination of Cooling Curves using MultiCool
Compaction temperature plays an important role in order to achieve the targeted
air void contents in the asphalt mixtures. For instance, starting the construction
below the compaction temperature causes higher air voids. In this case, the
mixtures become more prone to fatigue, permanent deformation and moisture
damages. Therefore, appropriate planning and accurate scheduling for the
construction phase of the project is necessary. This emerges the need to predict
the cooling rates of the asphalt mixtures; however experimental predictions are
not reliable due to low accuracy since it is a complex phenomenon.
Cooling rate of the asphalt mixture is based on the heat transfer, which has
majorly three phases, named as conduction, convection and radiation. Conduction
refers to heat transfer between the nearby layers that has lower temperature than
asphalt concrete layer. Base layers with lower temperatures during the mixture
laying transfer the heat through conduction method. The process, in which heat
transfers between a solid layer and a fluid, is named as convection. This heat loss
mostly happens when upper layer transfer heat with air, so air temperature has a
huge influence in compaction. Finally, radiation heat transfer occurs between two
layers through solar energy (Vargas-Nordcbeck & Timm, 2011).
19
Convection heat transfer as indicated before refers to process of cooling between
mixture and air. Different variables can increase the transfer through this process
such as wind, air temperature and etc., For instance, higher wind speed causes
rapid energy transfer. However, convective heat transfer can be estimated by an
equation (2-2) as indicated below (Chadboum, et al., 1998; Diaz Sanchez, 2013):
𝑞 = 𝐻(𝑇𝑓 − 𝑇𝑠) (2-2)
where Tf and Ts are mean fluid and surface temperatures, respectively.
Heat transfer between two objects by electromagnetic waves or photon particles
named as radiation. To simplify this process, it can be explained that the energy
transfer happens assuming no reflection between two black objects where one of
them is completely enclosed to other one. In reality, there is not any object that
perfectly emits or absorbs the radiation, so there is a factor for each object to
indicate the ratio of radiation transfer. Stefan-Boltzmann law states that fourth
power of the absolute temperature of an object is directly comparable to the
transferred energy and it indicates that the maximum rate of radiation heat was
emitted or absorbed (Chadboum, et al., 1998; Diaz Sanchez, 2013).
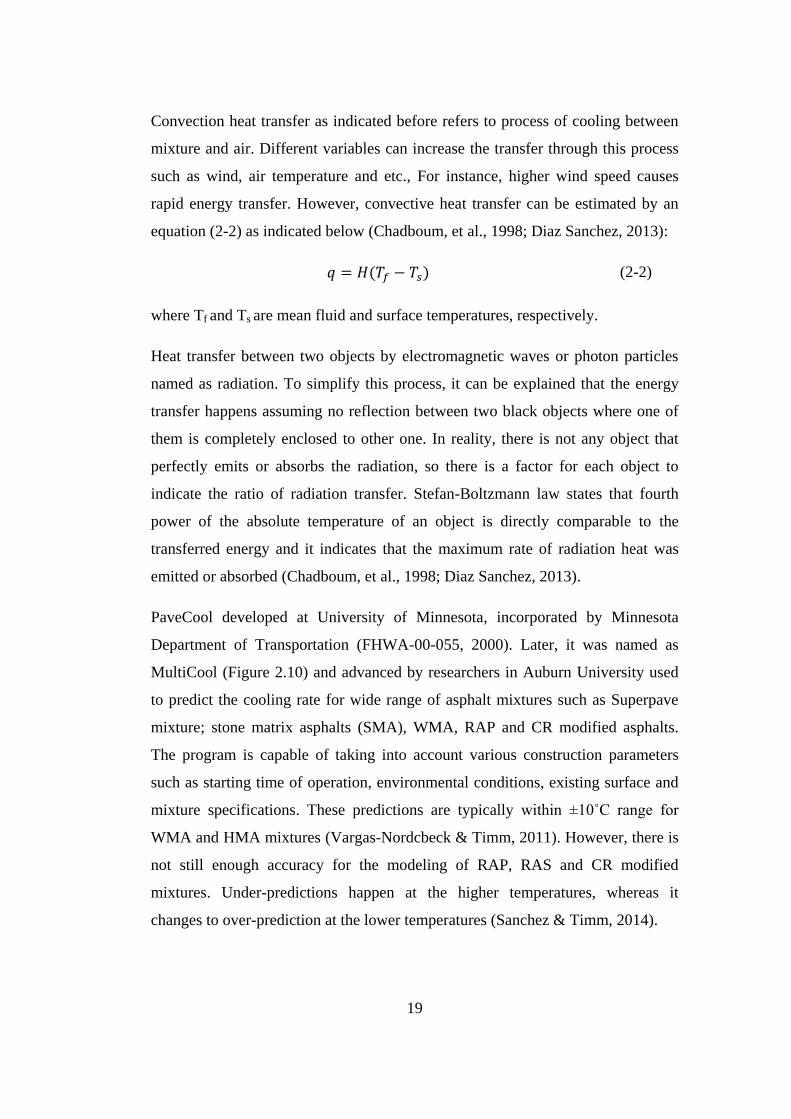
PaveCool developed at University of Minnesota, incorporated by Minnesota
Department of Transportation (FHWA-00-055, 2000). Later, it was named as
MultiCool (Figure 2.10) and advanced by researchers in Auburn University used
to predict the cooling rate for wide range of asphalt mixtures such as Superpave
mixture; stone matrix asphalts (SMA), WMA, RAP and CR modified asphalts.
The program is capable of taking into account various construction parameters
such as starting time of operation, environmental conditions, existing surface and
mixture specifications. These predictions are typically within ±10˚C range for
WMA and HMA mixtures (Vargas-Nordcbeck & Timm, 2011). However, there is
not still enough accuracy for the modeling of RAP, RAS and CR modified
mixtures. Under-predictions happen at the higher temperatures, whereas it
changes to over-prediction at the lower temperatures (Sanchez & Timm, 2014).
20
Figure 2.10 MultiCool Pavement Cooling Program
As a brief summary of Multicool, start time, environmental conditions, existing
surface and mix specifications are four major parameters in the program. The
effects of these parameters on the cooling rate are discussed as follows:
2.6.1 Starting Time of Operation
Time and date of the project could be set in this section to accurately simulate the
conditions at the time of the construction.
2.6.2 Environmental Conditions
The environmental parameters are ambient air temperature, average wind speed,
sky conditions and latitude. All parameters can be updated according to the GPS
coordinates of the projects, based on the online forecast data. However, it is also
possible to manually input these parameters.
Ambient air temperature specifies the average temperature of the construction site
during the compaction phase. For relatively high ambient air temperature, there is
more available time for compaction since it will take longer for the asphalt
mixture to cool down till stop temperature (Scherocman, 2000). Thus, the ambient
21
temperature is an essential parameter for the prediction of cooling of asphalt
mixtures.
Wind speed is another essential parameter in the program that inversely affects the
available compaction time. Higher wind speed decreases the compaction time as
the cooling rate increases.
Beside temperature and wind speed, sky condition has adverse effects on the
construction frame. The program is capable of predicting in different sky
conditions such as clear and dry, partly cloudy and overcast etc.
2.6.3 Existing Surface Course
Four commonly used base materials, asphalt concrete (AC), Portland cement
concrete (PCC), granular base and subgrade soil, are the options available in the
program. Heat transfer through conduction is directly affected from the selected
base type.
Moisture content and state of moisture can also be identified, when granular base
and subgrade soil are selected. Additionally, dry and wet choices are available for
moisture content and it can be also stated as frozen or unfrozen. However, this
option is neglected for selection of the AC and PCC base.
Surface temperature is also as important as the ambient air temperature.
Compaction time can be extended if the base temperature is higher (Scherocman,
2000).
2.6.4 Mix Specifications
Dense graded, SMA, Superpave-fine and Superpave-coarse asphalt mixtures are
four mixture options in the program. In addition, number of lifts can also be
indicated according to project plan and each lift separately requires its own data
such as mix type, PG grade, lift thickness, delivery temperature and stop
temperature.
22
Among these variables, lift thickness significantly affects the cooling rate, since it
takes more time to cool for thicker layers as compared to thinner layers. In
addition, wind speed and thickness parameters are directly linked to each other.
For instance, a higher wind speed can cool a thinner layer more quickly than a
thicker layer (Scherocman, 2000).
For the cooling rate calculation, delivery and stop temperatures are the other
significant parameters. Mixing temperature commonly is accepted as delivery
temperature. In addition, stop temperature is typically accepted as 80˚C, at which
paver should finish the compacting to get the expected density (Behl, Kumar,
Sharma, & Jain, 2013; ASTM D6932, 2013; Song & Ahmed, 2017;
Transportation Department the City of Calgary, 2012; Dickson & Corlew, 1970;
Texas. Department of Transportation, 2014).
2.7 Previous Studies
As it has been mentioned in Chapter 1, the focus of this study is the dry process
crumb rubber modification of Warm Mix Asphalts, since it is the first attempt to
associate these two methods. Different parameters such as temperature and
conditioning time are taken into account according to the current literature. In this
section, recent studies are summarized as follows.
2.7.1 Warm Mix Asphalt
Warm Mix Asphalt has been taking attention of many researchers, agencies and
contractors. As discussed in section 2.2.2, there are various WMA technologies.
Therefore, only a limited number of them are discussed in this section.
Arega and Bhasin (2012) studied the effects of chemical WMA additives on the
stiffness, permanent deformation, fracture and thermal cracking resistance of
asphalt mixtures, as well its effects on the binder such as viscosity. Sasobit,
Cecabase RT 923, Evotherm DAT, Evotherm 3G and Rediset WMX were the
additives selected in this study and were compared to control (unmodified)
samples. It was concluded that viscosity of the binder aged or unaged prepared
with WMA additives was similar or significantly less comparing to control
23
samples. Thus, asphalt mixtures prepared with WMA additives could be stored in
the silo for more time or hauled for longer distances. Sasobit added binders had a
better response to early age stiffness and rutting resistance. Despite that, there was
stiffness loss for other WMA additives due to additive and reduced aging.
Additionally, it was concluded that using WMA additives with recycled asphalt
increased the asphalt binder susceptibility to low-temperature cracking.
Ahmed et al. (2012) added chemical modifiers and asphaltenes to the asphalt
binder in order to improve the workability, resistance to chemical aging and
moisture damage. It was concluded that chemical and physical hardening of
binders were significantly affected; ductile strain tolerance changed noticeably
and cracking susceptibility increased by adding amide and polyethylene.
Xiao et al. (2012) studied the rheological properties for non-foaming WMA
additives (Cecabase, Evotherm, Rediset and Sasobit) at high performance
temperatures. According to results, it was stated that non-foaming additives
reduced the viscosity. Viscosity reduction caused to lower mixing and compaction
temperatures. In addition, rutting resistance improved at higher temperatures.
Ozturk (2013) utilized foam based WMA technique and concluded that foaming
significantly reduces the mixture viscosity to facilitate better coating of the
aggregates, increases the workability of the loose mixtures and provides better
compaction at lower temperatures.
Gandhi (2008) studied WMA using the additives (Sasobit and Aspha-min) since
there was a huge debate to decrease the emissions by lower mixing and
compacting temperatures to avoid the global warming. Both aged and unaged
binders with additives were used to analyze with respect to unmodified binders.
Also, it was stated that even aged binders extracted from WMA had significantly
lower viscosity. Thus, it resulted in lower mixing and compacting temperatures, in
addition to the better rutting resistance.
Sheth (2010), Zhang et al. (2015), Behl et al. (2013), Abdullah et al. (2013),
Canestrari et al. (2013), Yin (2009) and Behl et al. (2014) also indicated that using
WMA additives decreased the viscosity and the mixing and the compaction
24
temperatures. Thus, the green gas emissions were reduced. In addition, the asphalt
performance is improved as compared to traditional HMA. In addition, better
workability and compactibility were observed in WMA. Similarly, in many
studies, the performance of different additives at various contents was investigated
in binders and mixtures.
2.7.2 Crumb Rubber Modification
As summarized in Section 2.3.1, crumb rubber usage is commonly used in
pavement industry since 1950’s. Thus, the literature is significantly broad.
Therefore, this section initially summarizes some of the recent studies on dry
process modification. Then, it focuses on the available literature on wet process
modified warm mix asphalts.
Dry Process 2.7.2.1
Moreno et al. (2011) studied the optimization of digestion time of dry process
crumb rubber modified asphalt mixture. As an outcome, it was concluded that
conditioning the mixtures did not effect on optimum binder selection. However, it
improved the mechanical performance of asphalt pavement.
Dias et al. (2014) selected two gap-graded dry process CR mixtures to compare
with a traditional gap-graded reference mix, as well with a wet process mixture.
Observations indicated that bitumen had become harder, since CR particles
absorbed the light fractions in the binder. Additionally, fatigue and rutting tests
indicated that CR modification increased the mechanical performance of the
mixture. Besides, fatigue and rutting results did not have a huge difference
compared to wet process samples.
Cao (2007) investigated the properties of the dry process modification based on
the crumb rubber content. The mixtures were modified with 1, 2 and 3% CR by
weight of total mixture. Then, their resistance to permanent deformation
performing rutting test at 60˚C and to cracking performing indirect tensile strength
test at -10˚C were evaluated. It was recommended to use SBS modification for the
gap-graded dry process CR modified samples. In addition, permanent deformation
25
and indirect tensile tests indicated that CR modification could improve these
properties and the samples with 3% rubber content had the best performance
compared to other samples, which was concluded by Analysis of Variance test
(ANOVA) on rutting and indirect tensile tests.
According to the literature, the key parameters are selected as conditioning time,
mixing and compaction temperatures
Wet Process Modification 2.7.2.2
As WMA has been taking attention of many researchers, its incorporation with
other modifications also got interest by many researchers. In recent years, studies
focused on wet process CR modification of WMA mixtures.
Gallego et al. (2016) studied effects of wet process CR modification in WMA
used Sasobit and Licomont BS 100 additives. The CR contents were selected as
15% and 20% by weight of the binder. Dynamic Shear Rheometer (DSR) tests
were performed at specific temperatures and frequency ranges. Additionally,
creep test was used to evaluate the performance properties of asphalt mixture. It
was concluded that the addition of WMA additives and CR in the binder increased
the elasticity and improved the rheological behaviors. Also creep test indicated
that permanent deformation resistance improved in WMA mixtures.
Low temperature crack resistance of CR modified asphalt mixture was studied by
varying the CR dosage, CR size and testing temperature by Wang et al. (2016). A
dense and gap gradation was prepared by using five different rubber dosages (15,
18, 20, 22 and 25% weight of base binder). Accordingly, semi-circular bending
tests (SCB) were conducted at 0, -10 and -20˚C. It was stated that low-temperature
crack resistance properties of mixture containing small size CR particle were
improved.
Oliveira et al. (2013) also investigated the rubber in the binder with and without
WMA additives. Four different samples were prepared: HMA, WMA, Asphalt
rubber HMA and Asphalt rubber WMA. Researchers studied the effects of using
WMA additives in decreasing of mixing and compaction temperatures.
Additionally, different contents of additives were used and increased during the
26
addition of rubber. Thus, influence of these changes, on the performance of
asphalt mixtures was studied. It was concluded that adding WMA additives
decreased the both temperatures by 30˚C without compromising the performance.
Kim et al. (2014), Padhan et al. (2017), Wang et al. (2012), Kim & Lee (2015),
Yu et al. (2016)and Ziari et al. (2016) were the other researches working on CR
modification and evaluating the effects of AR incorporated by WMA additives.
Ziari et al. (2016) studied moisture susceptibility, rutting resistance and structural
response of AR mixtures by using tensile strength ratio, dynamic creep test, wheel
tracking and indirect resilient modulus. It resulted that using CR in the mixtures
incorporated by additives improved the asphalt performance. In addition, Kim &
Lee (2015) indicated that using additives with CR increased the hauling time.
However, viscosity of binder with additives changed over time for the samples
with higher content of rubber. Overall, the viscosity decreased for the whole
mixtures.
2.7.3 Conditioning time
Due to the segregation problems in the dry process CR modified asphalts,
conditioning of the mixtures for a period of time is essential for digestion of
particles in order to increase the cohesion between the particles. Conditioning
time (digestion time) became the focus of many studies in order to study the
effects on the binder-CR interactions. Since temperature and the duration of
conditioning are the variables that influence the interaction, these parameters were
tried to be optimized in various studies.
Jeong et al. (2010) studied the effects of binder-CR interaction for different
contents of rubber. Thus, four different contents of rubber were selected to
evaluate these relations. Accordingly, 5, 30, 60, 90, 120, 240 and 480 minutes of
conditioning periods at 177, 200 and 223˚C were studied in this research. It was
concluded that interaction time and the temperature had significant effects on the
binder properties. Moreover, CR percentage affected the binder properties.
27
Ghavibazoo and Abdelrahman (2013) also investigated the CR-binder
interactions. Properties of bitumen before and after modification with CR were
analyzed. Besides, it was concluded that conditioning in lower and higher
temperatures had different effects on the bitumen. In addition, 10, 120 and 240
minutes of conditioning periods were selected and it was indicated that increasing
the time of conditioning improve the CR dissolution in bitumen.
2.7.4 Indirect Tensile Strength Test (IDT)
As indicated before, IDT is one of the most common performance tests. However,
ASTM D6931 standard do not clearly specify testing parameters such as air voids,
testing temperature, sample size and etc. Many researchers performed this test on
Marshall samples (Fedrigo, Nunez, Castaneda, Kleniert, & Ceratti, 2018; Fu , et
al., 2017; Šimun & Halle, 2014; Zhao, Yan, Yang, & Peng, 2018; Cerni, Bocci,
Cardone, & Corradini, 2017; Corradini, Cerni, D'Alessandro, & Ubertini, 2017;
Islam, Hossain, & Tarefder, 2015a; Modarres & Alinia Bengar, 2017; Peng, Wan,
& Sun, 2017). In the literature, although the majority of samples had 63.5mm
heights, there were samples with heights of 40, 50 and 65mm. Similarly, testing
temperature ranged in a large scale. Typical test temperature was observed to be
room temperature (25˚C) and other common temperatures were 20 and -10˚C. In
addition, although air voids had significant importance in performance tests, there
was no agreement in the percentage of air voids. On the other hand, loading rate
was typically selected as 50mm/minutes.
Stiffness of the asphalt mixes is an essential parameter in order to evaluate the
distresses as indicated in Šimun & Halle (2014). High stiffness modulus during
winter and low-temperature conditions with cyclic loading can result in cracking.
Indirect tensile test was used to evaluate the stiffness modulus of pavements in
this research. 100mm diameter and 60-65mm height of samples were used with
variable air void values and tested at different temperatures. Sample prepared with
the lowest bitumen content, with highest filler amount, and also had the lowest air
voids, was the stiffest specimen. In other words, increasing filler content and
28
decreasing bitumen content in the asphalt mixtures resulted in higher stiffness
modulus.
Modarres & Alinia Bengar (2017) used Marshall design as well, in order to
evaluate the indirect tensile strength. In this study, the test temperature was
selected as 20˚C and samples were conditioned for 5 hours at this temperature.
Besides, Copper Slag Powder (CSP) and Limestone Powder (LSP) were used as
filler for HMA samples with different contents. As the result, it was concluded
that mechanical properties of samples were improved by adding CSP and filler
properties had a significant effect on the indirect tensile strength of asphalt
mixtures.
Zhao et al. (2018) used Sasobit and Deurex as WMA additives in asphalt mixtures
in order to study the indirect tensile strength, Marshall stability, volumetrics and
other properties of the specimens. Accordingly, as the part of this study, the
samples with 101.6mm diameter and 63.5mm height were tested under a loading
rate of 1mm/minute at -10˚C. Samples with various air voids were tested in the
range of 3.5 and 4.8%. It was concluded that these additives resulted in better low-
temperature cracking resistance.
Lusher (2017), Richardson & Lusher (2008), Islam et al. (2015b), Yin et al.
(2017), Dan et al. (2018), Yin et al. (2018) and Liu et al. (2015) also studied
indirect tensile strength of different mixtures and used samples with 150mm
diameter. Although most common height selected for these samples was 50mm,
samples with height of 32, 38, 40 and 130 were also used in these studies.
Important difference of Superpave samples is about the loading rate compare to
Marshall ones and loading rate was varied as 12.5mm/minute in some of these
studies, whereas the loading rate was kept as 50mm/minute in others. Besides, air
voids were varied in a wide range and the test temperatures were also changed
from -10 to 25 °C.
29
2.7.5 Cooling Curves
The determination of cooling rates of the mixtures is essential for managing and
scheduling of the projects. Therefore, many laboratory and field studies were
conducted in the recent years.
Chang et al. (2009) studied the dense graded and porous asphalt (PA) mixtures to
evaluate the mechanical properties and to estimate the available time frame for
construction during night time until completing compaction. Therefore, laboratory
test conducted from lay down till compaction. To control the cooling temperature
rate in different layers, thermocouples were placed to each layer. Initially, it was
observed that there was a difference of temperature in 0, 2.5 and 5cm depths.
However, it became stable during the compaction. By increasing the thickness of
the layer, it was observed that available compaction time significantly increased
till 10cm. Overall, it was concluded that a method could be developed to find the
pavement-cooling rate.
Song & Ahmed (2017) studied the cooling rate of WMA as compared to HMA. It
was indicated that WMA would have slower cooling rate than HMA. Thus, it was
resulted an extension in the available hauling time and better compaction to
achieve the specified density. Night construction, late season paving and long
hauling were three major advantages of WMA mixtures, which were concluded
by running Multicool program (Timm, Voller, Lee, & Harvey, 2001).
Study conducted by Goh & You (2009) indicated that WMA could be used in cold
regions due to slower cooling rates, in addition to the temperature reduction,
lower emission, binder aging, energy saving and early opening to traffic. This low
rate could be a result of comparably less difference between production and
ambient air temperatures. In a field project, Ahmed (2015) investigated two
paving projects (WMA with Sasobit and HMA) and also indicated better
performance for WMA. Additionally it was concluded that longer period of
compaction time allowed to use the WMA for long hauling, night time work and
late season paving.

30
31
CHAPTER 3
3 METHODOLOGY
3.1 Introduction
This chapter includes properties of materials, experimental design and preparation
procedures followed in this study. All the tests and experiments completed in
METU transportation laboratory, following the ASTM and AASHTO standards
and Turkish General Directorate of Highways specifications.
3.2 Materials
The properties of major components (i.e. aggregates, asphalt binder, WMA
additive and crumb rubber) of asphalt mixtures are presented in this section as
follows:
3.2.1 Aggregates
Aggregate gradation selection 3.2.1.1
Seven different trial aggregate gradations were examined in the range of various
implemented dry process CR modified asphalt mixtures in the literature, since
there is no standard referring the gradation limits (Moreno, Rubio, & Martinez-
Echevarria, 2011; Dias, Picado-Santos, & Capitao, 2014; Cao, 2007; Rahman,
2004; Rahman, Airey, & Collop, 2005; Rahman, Airey, & Collop, 2010; Yu, Wu,
Zhou, & Easa, 2014; Al Qadi, AlHasanat, & Haddad, 2016). Based on the trial
aggregate skeletons, samples were prepared to determine the optimum binder
content at the desired air void content. The details of the mix design were given in
Section 3.3. The final aggregate batch and CR gradations were presented in
Table 3-1. The aggregate batch consisted of 66.4% of coarse aggregates, 27.8%
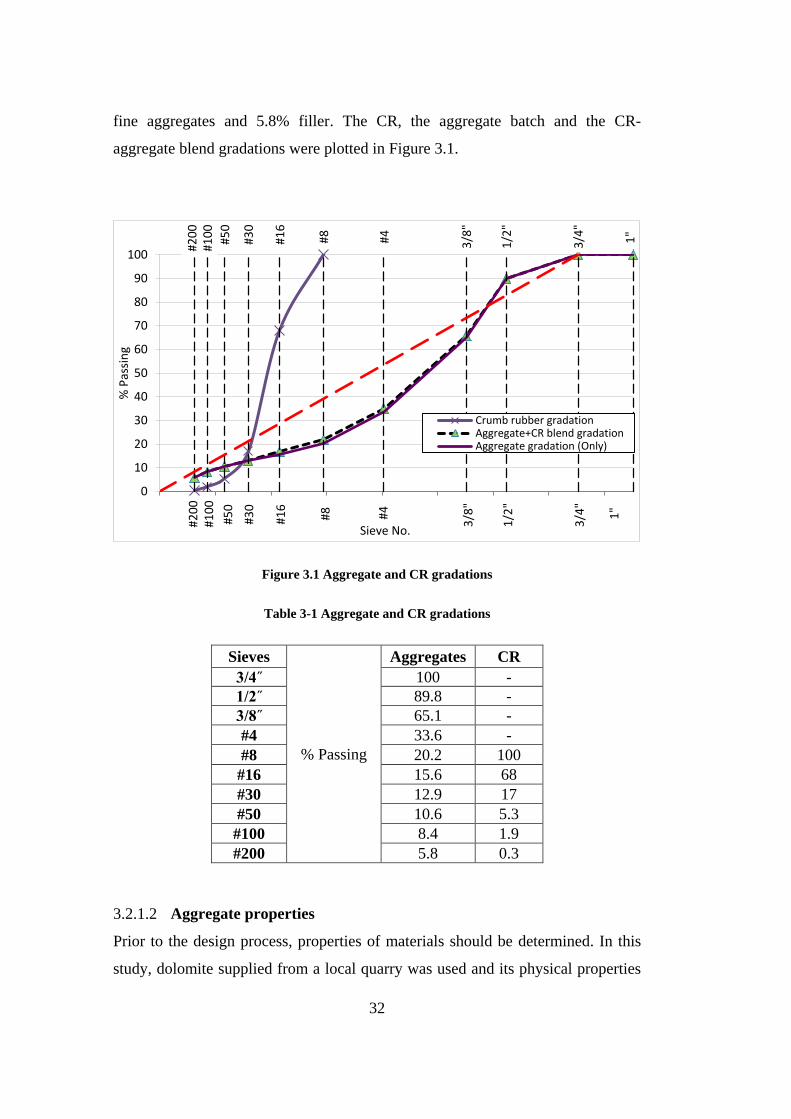
32
fine aggregates and 5.8% filler. The CR, the aggregate batch and the CR-
aggregate blend gradations were plotted in Figure 3.1.
Figure 3.1 Aggregate and CR gradations
Table 3-1 Aggregate and CR gradations
Sieves
% Passing
Aggregates CR
3/4˝ 100 -
1/2˝ 89.8 -
3/8˝ 65.1 -
#4 33.6 -
#8 20.2 100
#16 15.6 68
#30 12.9 17
#50 10.6 5.3
#100 8.4 1.9
#200 5.8 0.3
Aggregate properties 3.2.1.2
Prior to the design process, properties of materials should be determined. In this
study, dolomite supplied from a local quarry was used and its physical properties
1"
1"
3/4
" 3
/4"
1/2
" 1
/2"
3/8
" 3
/8"
#4
#4
#8
#8
#16
#1
6
#30
#3
0
#50
#5
0
#10
0
#10
0
#20
0
#20
0
0
10
20
30
40
50
60
70
80
90
100
% P
assi
ng
Sieve No.
Crumb rubber gradationAggregate+CR blend gradationAggregate gradation (Only)
33
were determined such as the specific gravity and water absorption. These
properties were tabulated in Table 3-2 for fine and coarse aggregates, based on the
referred standard. Accordingly, bulk specific gravity of the aggregate batch and
CR-aggregate blend (Gsb) were calculated to be 2.782 and 2.704, respectively.
Table 3-2 Properties tests for aggregates
Property (Unit) Standard Result
Water Absorption (%) Coarse ASTM C128 0.604
Water Absorption (%) Fine ASTM C128 0.563
Specific gravity for Coarse aggregate
Bulk ASTM C127 2.785
SSD ASTM C127 2.802
Apparent ASTM C127 2.833
Specific gravity for Fine aggregate
Bulk ASTM C127 2.775
SSD ASTM C127 2.791
Apparent ASTM C127 2.819
Percent Loss Using Los Angeles Test - ASTM C131 18%
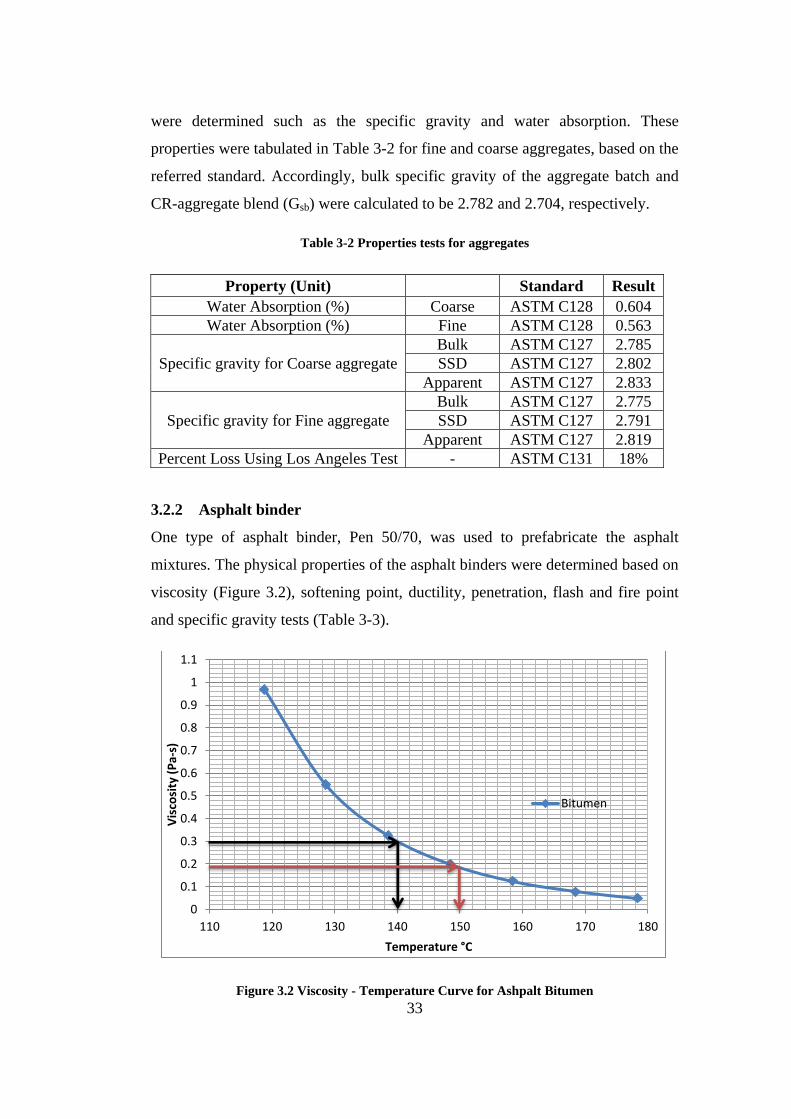
3.2.2 Asphalt binder
One type of asphalt binder, Pen 50/70, was used to prefabricate the asphalt
mixtures. The physical properties of the asphalt binders were determined based on
viscosity (Figure 3.2), softening point, ductility, penetration, flash and fire point
and specific gravity tests (Table 3-3).
Figure 3.2 Viscosity - Temperature Curve for Ashpalt Bitumen
0
0.1
0.2
0.3
0.4
0.5
0.6
0.7
0.8
0.9
1
1.1
110 120 130 140 150 160 170 180
Vis
cosi
ty (
Pa-
s)
Temperature °C
Bitumen
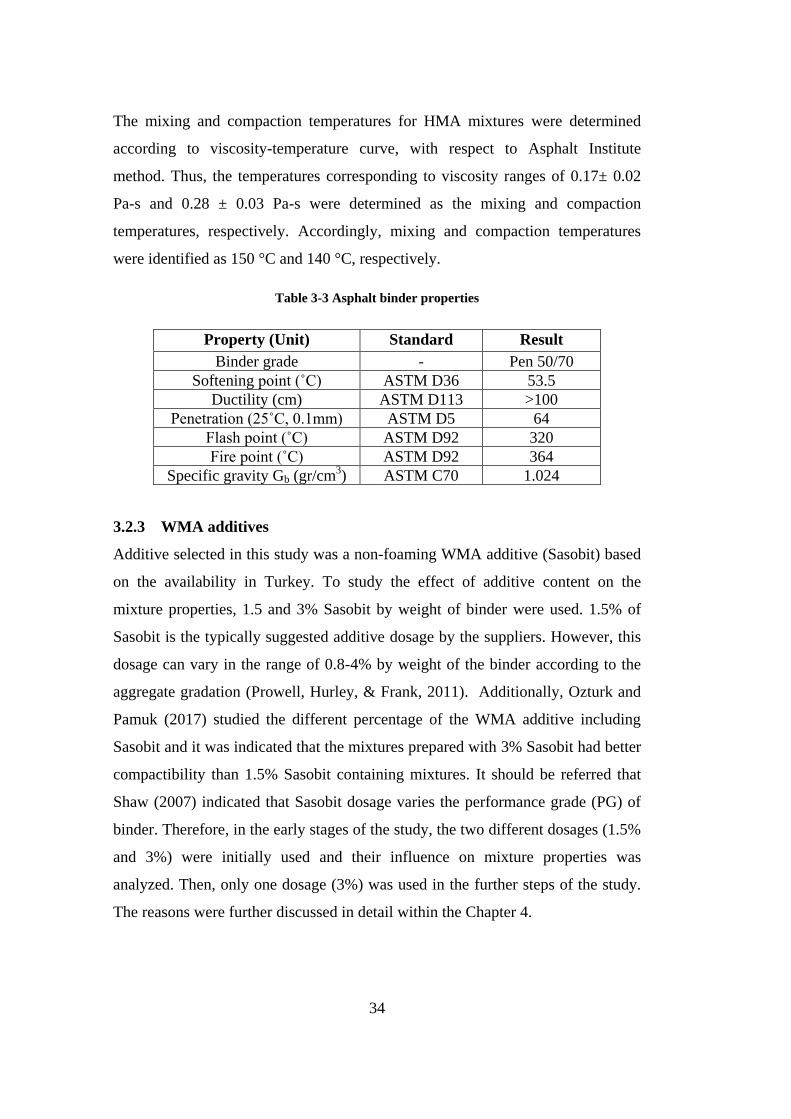
34
The mixing and compaction temperatures for HMA mixtures were determined
according to viscosity-temperature curve, with respect to Asphalt Institute
method. Thus, the temperatures corresponding to viscosity ranges of 0.17± 0.02
Pa-s and 0.28 ± 0.03 Pa-s were determined as the mixing and compaction
temperatures, respectively. Accordingly, mixing and compaction temperatures
were identified as 150 °C and 140 °C, respectively.
Table 3-3 Asphalt binder properties
Property (Unit) Standard Result
Binder grade - Pen 50/70
Softening point (˚C) ASTM D36 53.5
Ductility (cm) ASTM D113 >100
Penetration (25˚C, 0.1mm) ASTM D5 64
Flash point (˚C) ASTM D92 320
Fire point (˚C) ASTM D92 364
Specific gravity Gb (gr/cm3) ASTM C70 1.024
3.2.3 WMA additives
Additive selected in this study was a non-foaming WMA additive (Sasobit) based
on the availability in Turkey. To study the effect of additive content on the
mixture properties, 1.5 and 3% Sasobit by weight of binder were used. 1.5% of
Sasobit is the typically suggested additive dosage by the suppliers. However, this
dosage can vary in the range of 0.8-4% by weight of the binder according to the
aggregate gradation (Prowell, Hurley, & Frank, 2011). Additionally, Ozturk and
Pamuk (2017) studied the different percentage of the WMA additive including
Sasobit and it was indicated that the mixtures prepared with 3% Sasobit had better
compactibility than 1.5% Sasobit containing mixtures. It should be referred that
Shaw (2007) indicated that Sasobit dosage varies the performance grade (PG) of
binder. Therefore, in the early stages of the study, the two different dosages (1.5%
and 3%) were initially used and their influence on mixture properties was
analyzed. Then, only one dosage (3%) was used in the further steps of the study.
The reasons were further discussed in detail within the Chapter 4.
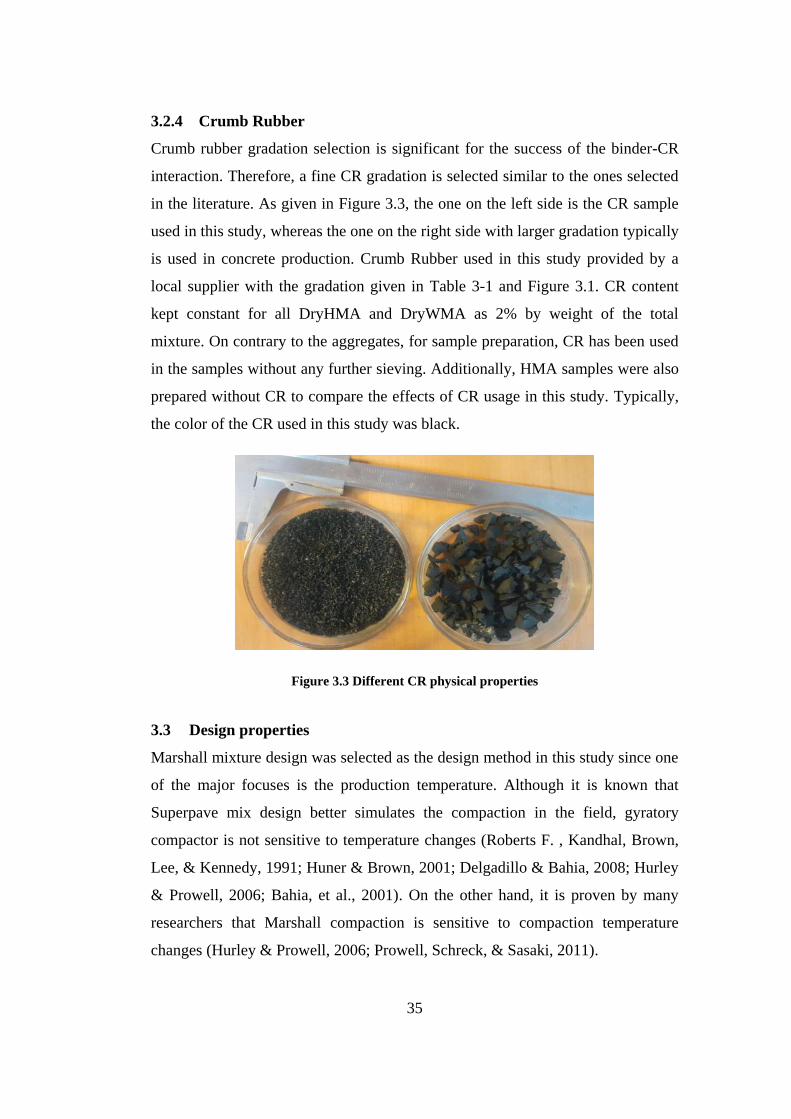
35
3.2.4 Crumb Rubber
Crumb rubber gradation selection is significant for the success of the binder-CR
interaction. Therefore, a fine CR gradation is selected similar to the ones selected
in the literature. As given in Figure 3.3, the one on the left side is the CR sample
used in this study, whereas the one on the right side with larger gradation typically
is used in concrete production. Crumb Rubber used in this study provided by a
local supplier with the gradation given in Table 3-1 and Figure 3.1. CR content
kept constant for all DryHMA and DryWMA as 2% by weight of the total
mixture. On contrary to the aggregates, for sample preparation, CR has been used
in the samples without any further sieving. Additionally, HMA samples were also
prepared without CR to compare the effects of CR usage in this study. Typically,
the color of the CR used in this study was black.
Figure 3.3 Different CR physical properties
3.3 Design properties
Marshall mixture design was selected as the design method in this study since one
of the major focuses is the production temperature. Although it is known that
Superpave mix design better simulates the compaction in the field, gyratory
compactor is not sensitive to temperature changes (Roberts F. , Kandhal, Brown,
Lee, & Kennedy, 1991; Huner & Brown, 2001; Delgadillo & Bahia, 2008; Hurley
& Prowell, 2006; Bahia, et al., 2001). On the other hand, it is proven by many
researchers that Marshall compaction is sensitive to compaction temperature
changes (Hurley & Prowell, 2006; Prowell, Schreck, & Sasaki, 2011).
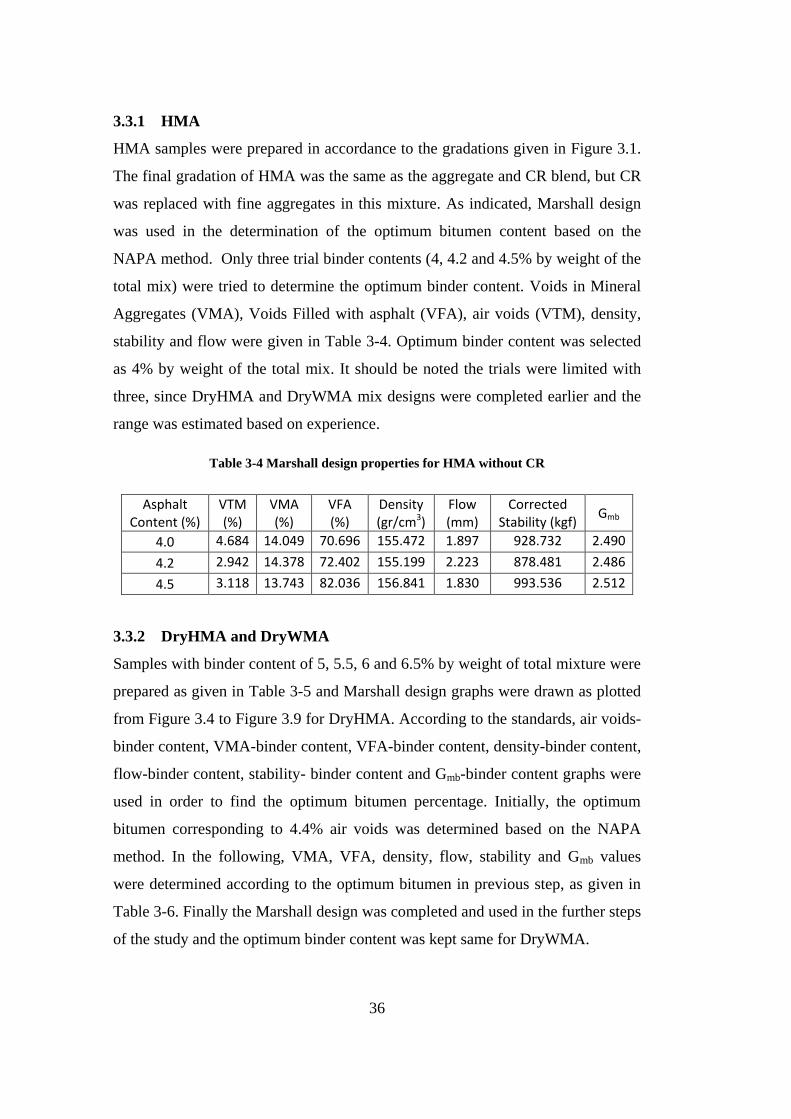
36
3.3.1 HMA
HMA samples were prepared in accordance to the gradations given in Figure 3.1.
The final gradation of HMA was the same as the aggregate and CR blend, but CR
was replaced with fine aggregates in this mixture. As indicated, Marshall design
was used in the determination of the optimum bitumen content based on the
NAPA method. Only three trial binder contents (4, 4.2 and 4.5% by weight of the
total mix) were tried to determine the optimum binder content. Voids in Mineral
Aggregates (VMA), Voids Filled with asphalt (VFA), air voids (VTM), density,
stability and flow were given in Table 3-4. Optimum binder content was selected
as 4% by weight of the total mix. It should be noted the trials were limited with
three, since DryHMA and DryWMA mix designs were completed earlier and the
range was estimated based on experience.
Table 3-4 Marshall design properties for HMA without CR
Asphalt Content (%)
VTM (%)
VMA (%)
VFA (%)
Density (gr/cm3)
Flow (mm)
Corrected Stability (kgf)
Gmb
4.0 4.684 14.049 70.696 155.472 1.897 928.732 2.490
4.2 2.942 14.378 72.402 155.199 2.223 878.481 2.486
4.5 3.118 13.743 82.036 156.841 1.830 993.536 2.512
3.3.2 DryHMA and DryWMA
Samples with binder content of 5, 5.5, 6 and 6.5% by weight of total mixture were
prepared as given in Table 3-5 and Marshall design graphs were drawn as plotted
from Figure 3.4 to Figure 3.9 for DryHMA. According to the standards, air voids-
binder content, VMA-binder content, VFA-binder content, density-binder content,
flow-binder content, stability- binder content and Gmb-binder content graphs were
used in order to find the optimum bitumen percentage. Initially, the optimum
bitumen corresponding to 4.4% air voids was determined based on the NAPA
method. In the following, VMA, VFA, density, flow, stability and Gmb values
were determined according to the optimum bitumen in previous step, as given in
Table 3-6. Finally the Marshall design was completed and used in the further steps
of the study and the optimum binder content was kept same for DryWMA.
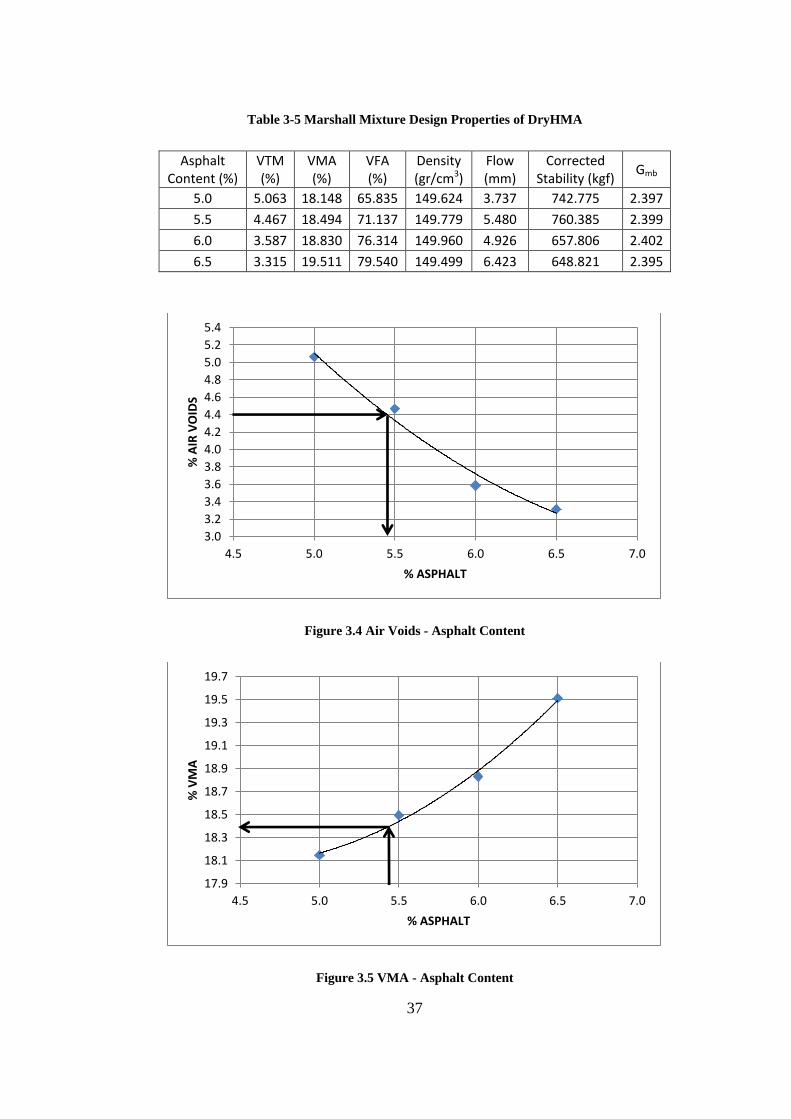
37
Table 3-5 Marshall Mixture Design Properties of DryHMA
Asphalt Content (%)
VTM (%)
VMA (%)
VFA (%)
Density (gr/cm3)
Flow (mm)
Corrected Stability (kgf)
Gmb
5.0 5.063 18.148 65.835 149.624 3.737 742.775 2.397
5.5 4.467 18.494 71.137 149.779 5.480 760.385 2.399
6.0 3.587 18.830 76.314 149.960 4.926 657.806 2.402
6.5 3.315 19.511 79.540 149.499 6.423 648.821 2.395
Figure 3.4 Air Voids - Asphalt Content
Figure 3.5 VMA - Asphalt Content
3.0
3.2
3.4
3.6
3.8
4.0
4.2
4.4
4.6
4.8
5.0
5.2
5.4
4.5 5.0 5.5 6.0 6.5 7.0
% A
IR V
OID
S
% ASPHALT
17.9
18.1
18.3
18.5
18.7
18.9
19.1
19.3
19.5
19.7
4.5 5.0 5.5 6.0 6.5 7.0
% V
MA
% ASPHALT
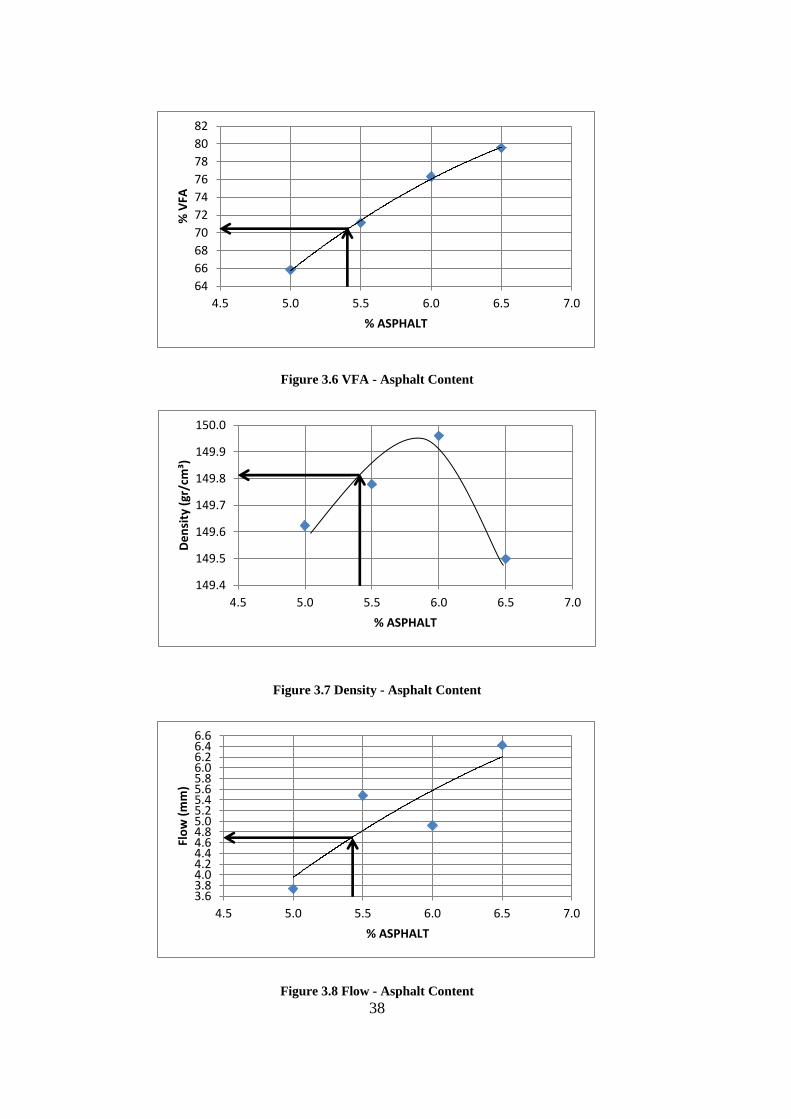
38
Figure 3.6 VFA - Asphalt Content
Figure 3.7 Density - Asphalt Content
Figure 3.8 Flow - Asphalt Content
64
66
68
70
72
74
76
78
80
82
4.5 5.0 5.5 6.0 6.5 7.0
% V
FA
% ASPHALT
149.4
149.5
149.6
149.7
149.8
149.9
150.0
4.5 5.0 5.5 6.0 6.5 7.0
De
nsi
ty (
gr/c
m³)
% ASPHALT
3.63.84.04.24.44.64.85.05.25.45.65.86.06.26.46.6
4.5 5.0 5.5 6.0 6.5 7.0
Flo
w (
mm
)
% ASPHALT
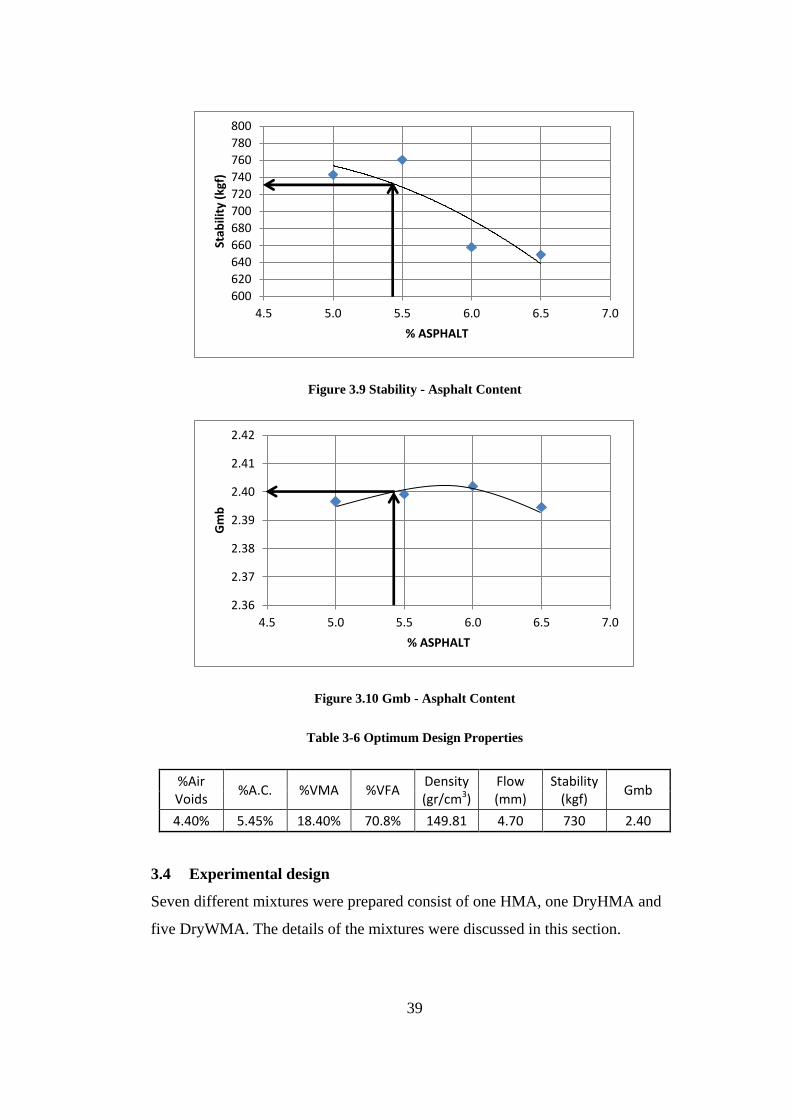
39
Figure 3.9 Stability - Asphalt Content
Figure 3.10 Gmb - Asphalt Content
Table 3-6 Optimum Design Properties
%Air Voids
%A.C. %VMA %VFA Density (gr/cm3)
Flow (mm)
Stability (kgf)
Gmb
4.40% 5.45% 18.40% 70.8% 149.81 4.70 730 2.40
3.4 Experimental design
Seven different mixtures were prepared consist of one HMA, one DryHMA and
five DryWMA. The details of the mixtures were discussed in this section.
600
620
640
660
680
700
720
740
760
780
800
4.5 5.0 5.5 6.0 6.5 7.0
Stab
ility
(kg
f)
% ASPHALT
2.36
2.37
2.38
2.39
2.40
2.41
2.42
4.5 5.0 5.5 6.0 6.5 7.0
Gm
b
% ASPHALT
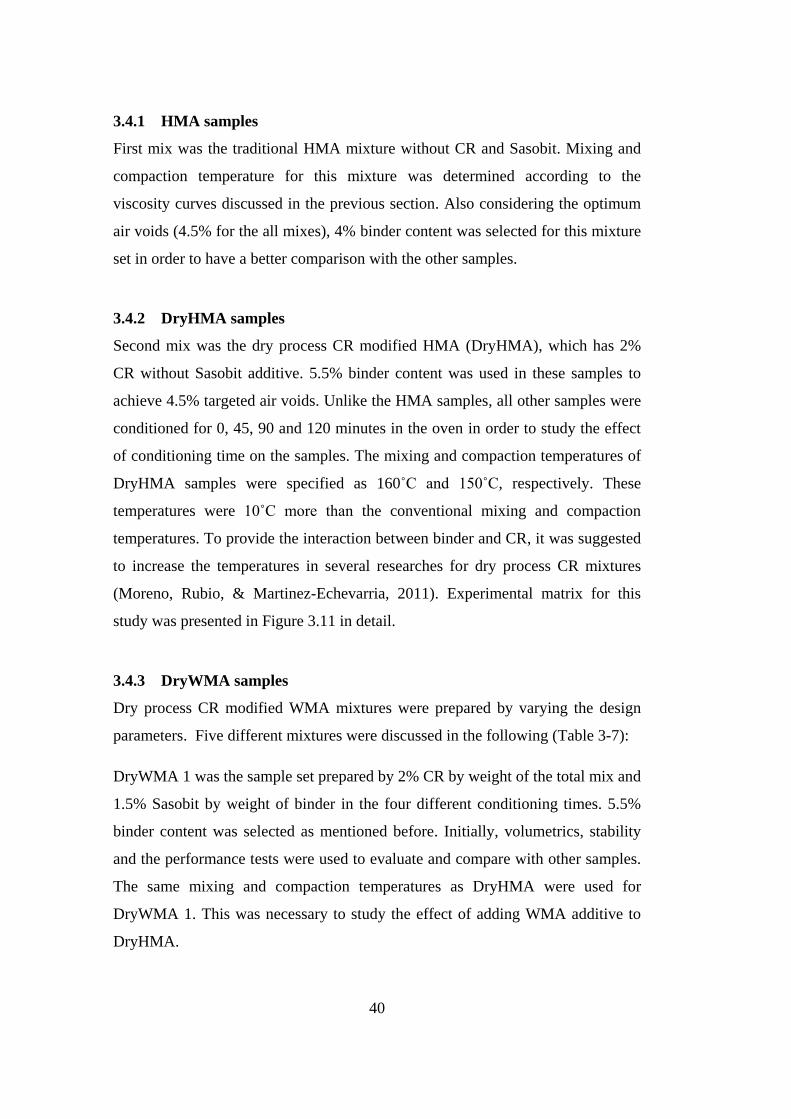
40
3.4.1 HMA samples
First mix was the traditional HMA mixture without CR and Sasobit. Mixing and
compaction temperature for this mixture was determined according to the
viscosity curves discussed in the previous section. Also considering the optimum
air voids (4.5% for the all mixes), 4% binder content was selected for this mixture
set in order to have a better comparison with the other samples.
3.4.2 DryHMA samples
Second mix was the dry process CR modified HMA (DryHMA), which has 2%
CR without Sasobit additive. 5.5% binder content was used in these samples to
achieve 4.5% targeted air voids. Unlike the HMA samples, all other samples were
conditioned for 0, 45, 90 and 120 minutes in the oven in order to study the effect
of conditioning time on the samples. The mixing and compaction temperatures of
DryHMA samples were specified as 160˚C and 150˚C, respectively. These
temperatures were 10˚C more than the conventional mixing and compaction
temperatures. To provide the interaction between binder and CR, it was suggested
to increase the temperatures in several researches for dry process CR mixtures
(Moreno, Rubio, & Martinez-Echevarria, 2011). Experimental matrix for this
study was presented in Figure 3.11 in detail.
3.4.3 DryWMA samples
Dry process CR modified WMA mixtures were prepared by varying the design
parameters. Five different mixtures were discussed in the following (Table 3-7):
DryWMA 1 was the sample set prepared by 2% CR by weight of the total mix and
1.5% Sasobit by weight of binder in the four different conditioning times. 5.5%
binder content was selected as mentioned before. Initially, volumetrics, stability
and the performance tests were used to evaluate and compare with other samples.
The same mixing and compaction temperatures as DryHMA were used for
DryWMA 1. This was necessary to study the effect of adding WMA additive to
DryHMA.
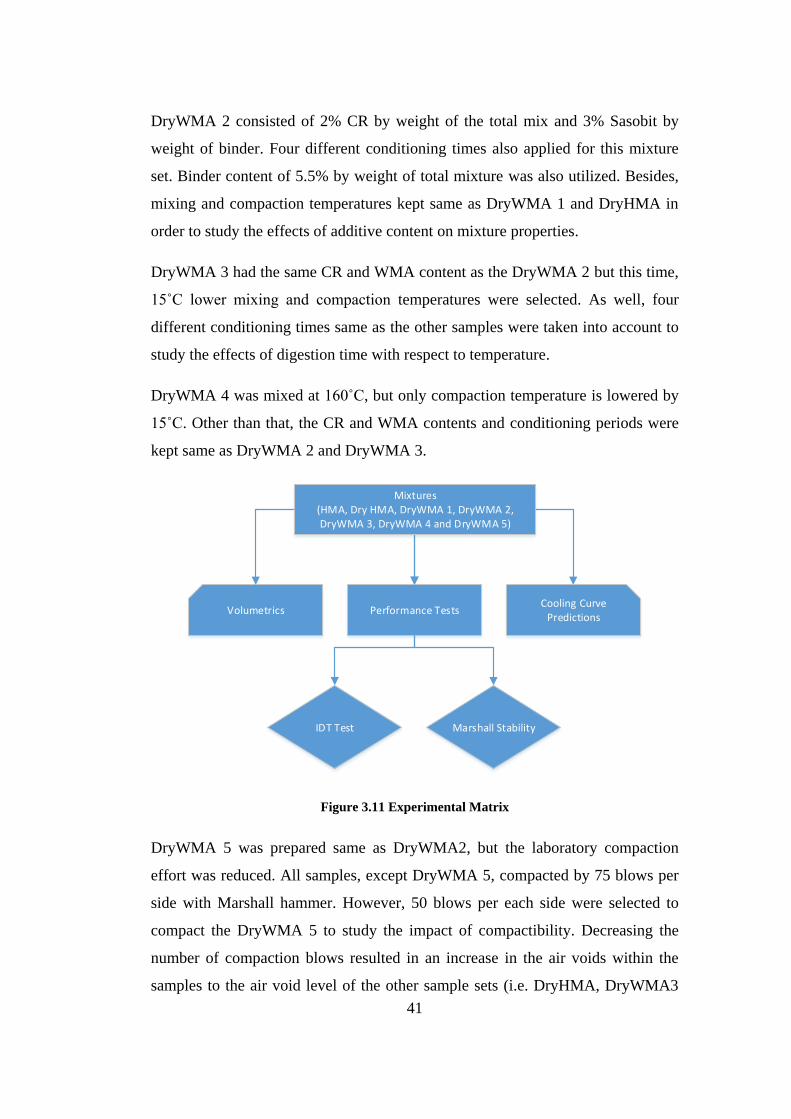
41
DryWMA 2 consisted of 2% CR by weight of the total mix and 3% Sasobit by
weight of binder. Four different conditioning times also applied for this mixture
set. Binder content of 5.5% by weight of total mixture was also utilized. Besides,
mixing and compaction temperatures kept same as DryWMA 1 and DryHMA in
order to study the effects of additive content on mixture properties.
DryWMA 3 had the same CR and WMA content as the DryWMA 2 but this time,
15˚C lower mixing and compaction temperatures were selected. As well, four
different conditioning times same as the other samples were taken into account to
study the effects of digestion time with respect to temperature.
DryWMA 4 was mixed at 160˚C, but only compaction temperature is lowered by
15˚C. Other than that, the CR and WMA contents and conditioning periods were
kept same as DryWMA 2 and DryWMA 3.
Cooling CurvePredictions
Volumetrics
Marshall Stability
Performance Tests
Mixtures(HMA, Dry HMA, DryWMA 1, DryWMA 2, DryWMA 3, DryWMA 4 and DryWMA 5)
IDT Test
Figure 3.11 Experimental Matrix
DryWMA 5 was prepared same as DryWMA2, but the laboratory compaction
effort was reduced. All samples, except DryWMA 5, compacted by 75 blows per
side with Marshall hammer. However, 50 blows per each side were selected to
compact the DryWMA 5 to study the impact of compactibility. Decreasing the
number of compaction blows resulted in an increase in the air voids within the
samples to the air void level of the other sample sets (i.e. DryHMA, DryWMA3
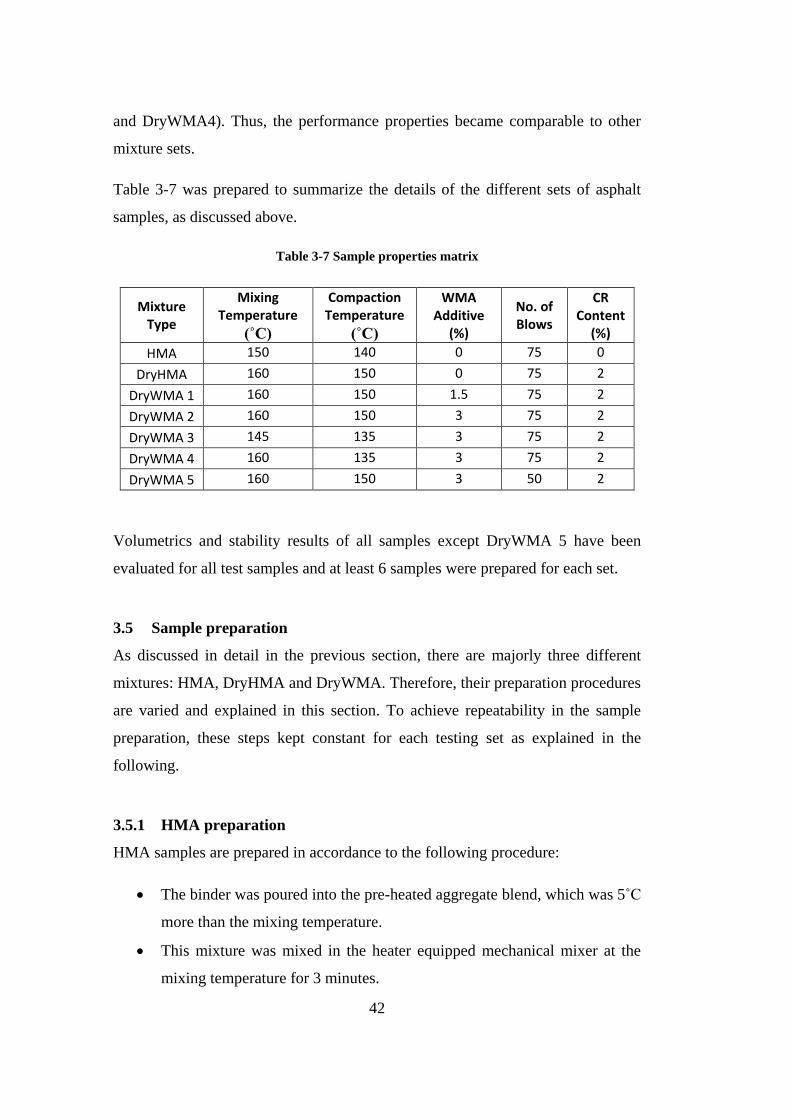
42
and DryWMA4). Thus, the performance properties became comparable to other
mixture sets.
Table 3-7 was prepared to summarize the details of the different sets of asphalt
samples, as discussed above.
Table 3-7 Sample properties matrix
Mixture Type
Mixing Temperature
(˚C)
Compaction Temperature
(˚C)
WMA Additive
(%)
No. of Blows
CR Content
(%)
HMA 150 140 0 75 0
DryHMA 160 150 0 75 2
DryWMA 1 160 150 1.5 75 2
DryWMA 2 160 150 3 75 2
DryWMA 3 145 135 3 75 2
DryWMA 4 160 135 3 75 2
DryWMA 5 160 150 3 50 2
Volumetrics and stability results of all samples except DryWMA 5 have been
evaluated for all test samples and at least 6 samples were prepared for each set.
3.5 Sample preparation
As discussed in detail in the previous section, there are majorly three different
mixtures: HMA, DryHMA and DryWMA. Therefore, their preparation procedures
are varied and explained in this section. To achieve repeatability in the sample
preparation, these steps kept constant for each testing set as explained in the
following.
3.5.1 HMA preparation
HMA samples are prepared in accordance to the following procedure:
The binder was poured into the pre-heated aggregate blend, which was 5˚C
more than the mixing temperature.
This mixture was mixed in the heater equipped mechanical mixer at the
mixing temperature for 3 minutes.
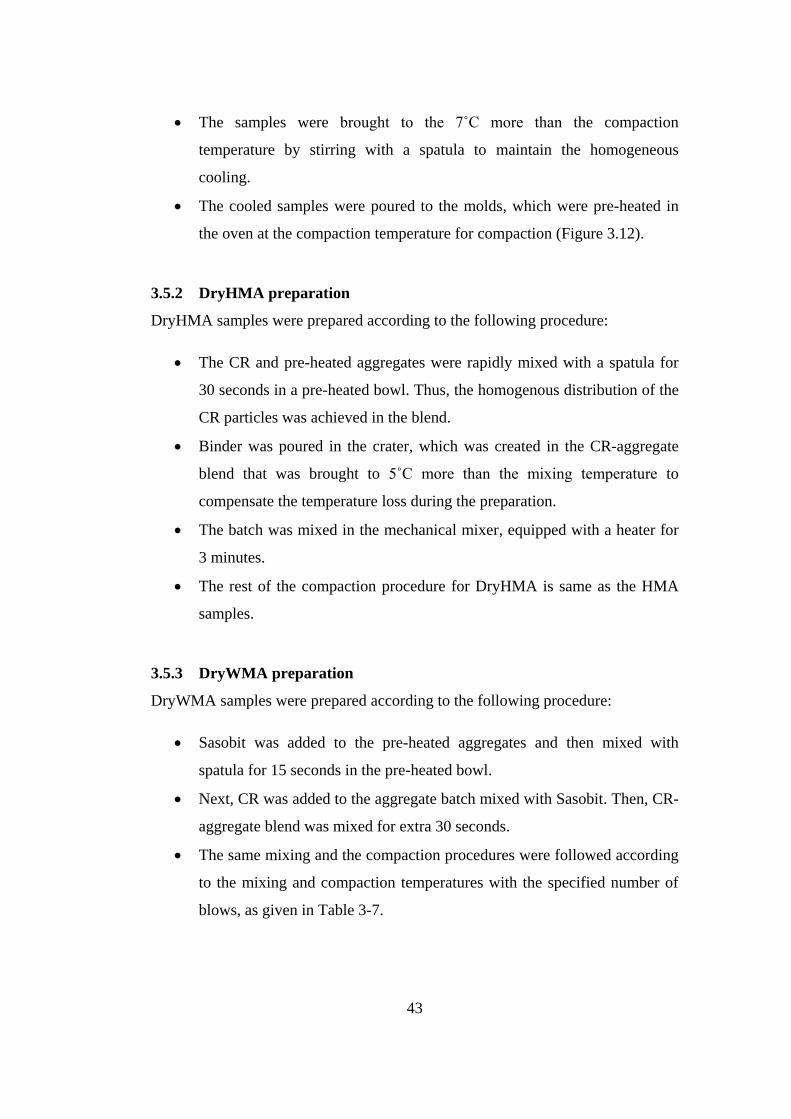
43
The samples were brought to the 7˚C more than the compaction
temperature by stirring with a spatula to maintain the homogeneous
cooling.
The cooled samples were poured to the molds, which were pre-heated in
the oven at the compaction temperature for compaction (Figure 3.12).
3.5.2 DryHMA preparation
DryHMA samples were prepared according to the following procedure:
The CR and pre-heated aggregates were rapidly mixed with a spatula for
30 seconds in a pre-heated bowl. Thus, the homogenous distribution of the
CR particles was achieved in the blend.
Binder was poured in the crater, which was created in the CR-aggregate
blend that was brought to 5˚C more than the mixing temperature to
compensate the temperature loss during the preparation.
The batch was mixed in the mechanical mixer, equipped with a heater for
3 minutes.
The rest of the compaction procedure for DryHMA is same as the HMA
samples.
3.5.3 DryWMA preparation
DryWMA samples were prepared according to the following procedure:
Sasobit was added to the pre-heated aggregates and then mixed with
spatula for 15 seconds in the pre-heated bowl.
Next, CR was added to the aggregate batch mixed with Sasobit. Then, CR-
aggregate blend was mixed for extra 30 seconds.
The same mixing and the compaction procedures were followed according
to the mixing and compaction temperatures with the specified number of
blows, as given in Table 3-7.
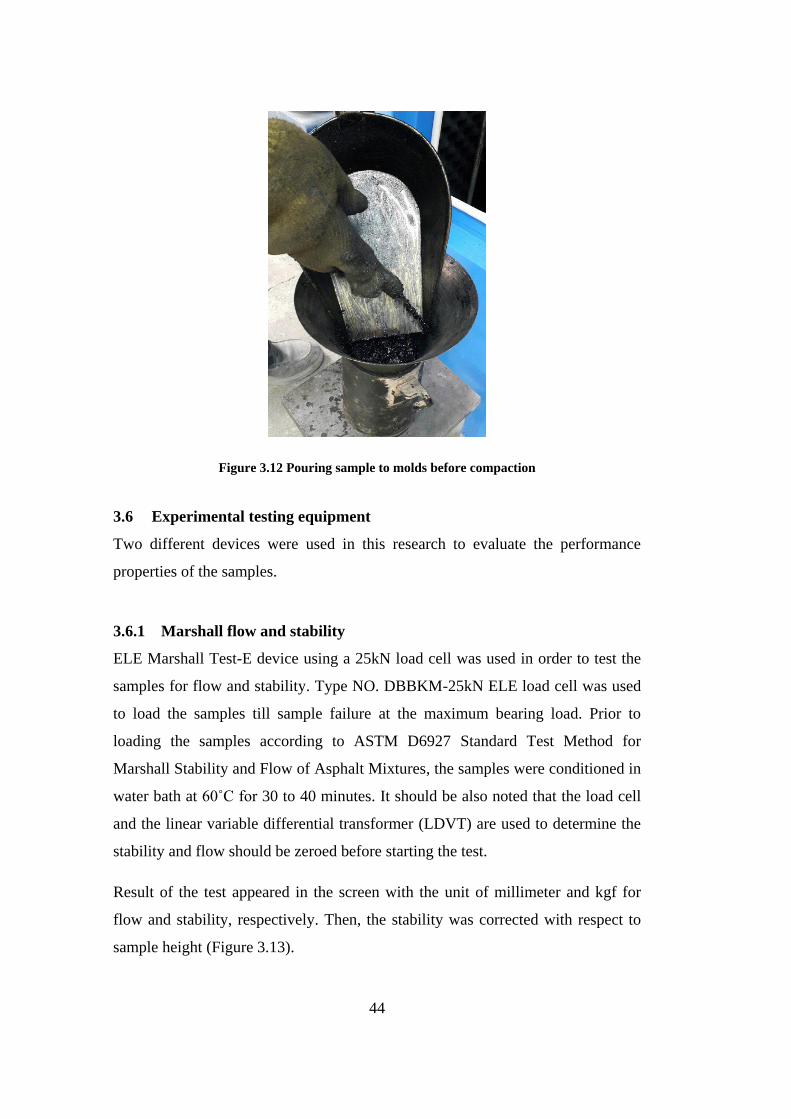
44
Figure 3.12 Pouring sample to molds before compaction
3.6 Experimental testing equipment
Two different devices were used in this research to evaluate the performance
properties of the samples.
3.6.1 Marshall flow and stability
ELE Marshall Test-E device using a 25kN load cell was used in order to test the
samples for flow and stability. Type NO. DBBKM-25kN ELE load cell was used
to load the samples till sample failure at the maximum bearing load. Prior to
loading the samples according to ASTM D6927 Standard Test Method for
Marshall Stability and Flow of Asphalt Mixtures, the samples were conditioned in
water bath at 60˚C for 30 to 40 minutes. It should be also noted that the load cell
and the linear variable differential transformer (LDVT) are used to determine the
stability and flow should be zeroed before starting the test.
Result of the test appeared in the screen with the unit of millimeter and kgf for
flow and stability, respectively. Then, the stability was corrected with respect to
sample height (Figure 3.13).
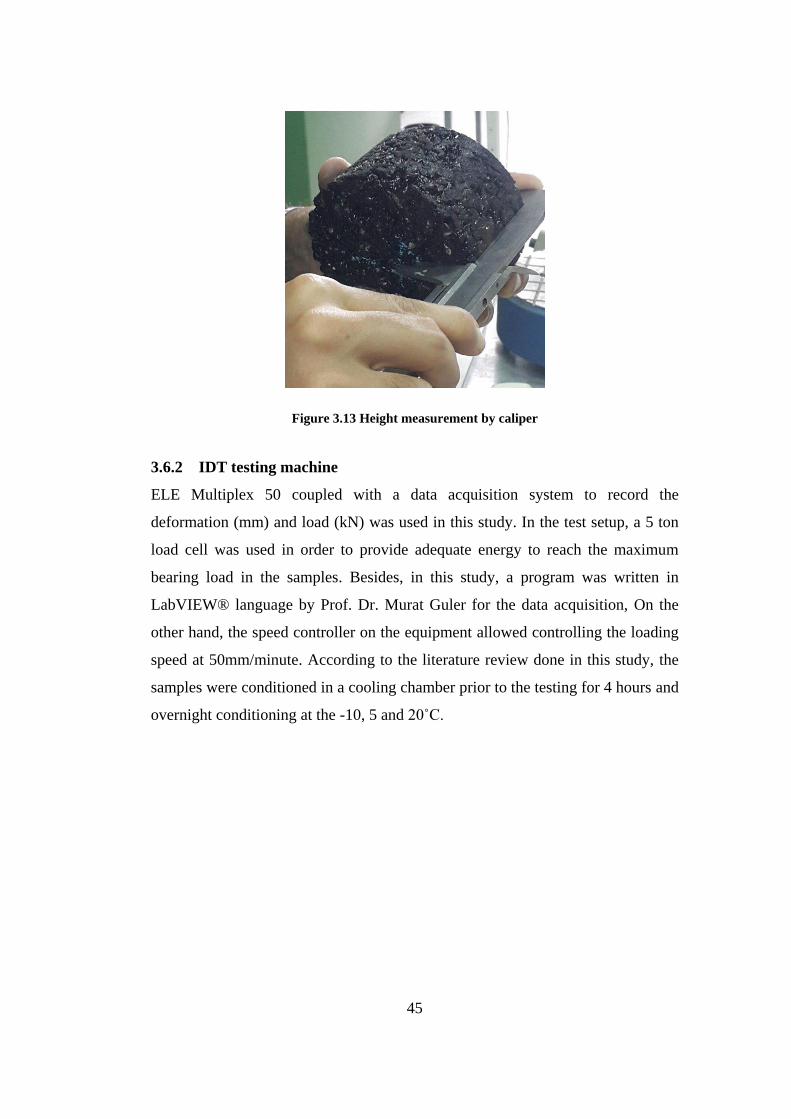
45
Figure 3.13 Height measurement by caliper
3.6.2 IDT testing machine
ELE Multiplex 50 coupled with a data acquisition system to record the
deformation (mm) and load (kN) was used in this study. In the test setup, a 5 ton
load cell was used in order to provide adequate energy to reach the maximum
bearing load in the samples. Besides, in this study, a program was written in
LabVIEW® language by Prof. Dr. Murat Guler for the data acquisition, On the
other hand, the speed controller on the equipment allowed controlling the loading
speed at 50mm/minute. According to the literature review done in this study, the
samples were conditioned in a cooling chamber prior to the testing for 4 hours and
overnight conditioning at the -10, 5 and 20˚C.

46
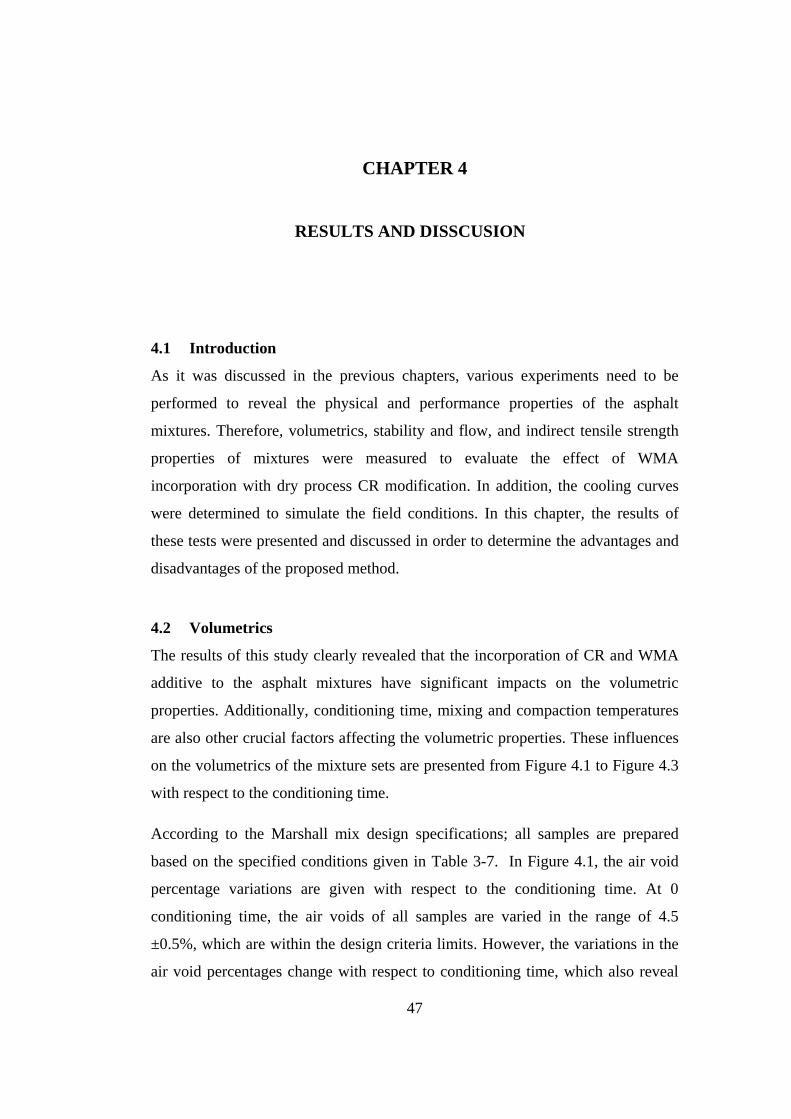
47
CHAPTER 4
4 RESULTS AND DISSCUSION
4.1 Introduction
As it was discussed in the previous chapters, various experiments need to be
performed to reveal the physical and performance properties of the asphalt
mixtures. Therefore, volumetrics, stability and flow, and indirect tensile strength
properties of mixtures were measured to evaluate the effect of WMA
incorporation with dry process CR modification. In addition, the cooling curves
were determined to simulate the field conditions. In this chapter, the results of
these tests were presented and discussed in order to determine the advantages and
disadvantages of the proposed method.
4.2 Volumetrics
The results of this study clearly revealed that the incorporation of CR and WMA
additive to the asphalt mixtures have significant impacts on the volumetric
properties. Additionally, conditioning time, mixing and compaction temperatures
are also other crucial factors affecting the volumetric properties. These influences
on the volumetrics of the mixture sets are presented from Figure 4.1 to Figure 4.3
with respect to the conditioning time.
According to the Marshall mix design specifications; all samples are prepared
based on the specified conditions given in Table 3-7. In Figure 4.1, the air void
percentage variations are given with respect to the conditioning time. At 0
conditioning time, the air voids of all samples are varied in the range of 4.5
±0.5%, which are within the design criteria limits. However, the variations in the
air void percentages change with respect to conditioning time, which also reveal
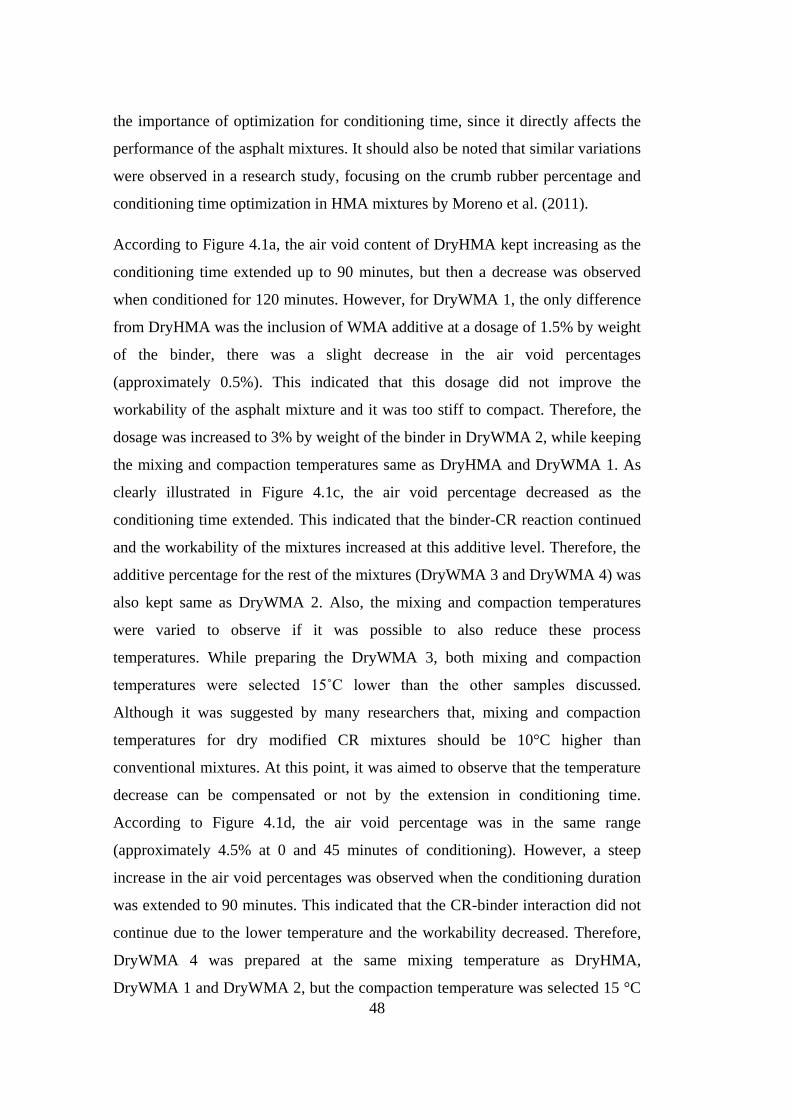
48
the importance of optimization for conditioning time, since it directly affects the
performance of the asphalt mixtures. It should also be noted that similar variations
were observed in a research study, focusing on the crumb rubber percentage and
conditioning time optimization in HMA mixtures by Moreno et al. (2011).
According to Figure 4.1a, the air void content of DryHMA kept increasing as the
conditioning time extended up to 90 minutes, but then a decrease was observed
when conditioned for 120 minutes. However, for DryWMA 1, the only difference
from DryHMA was the inclusion of WMA additive at a dosage of 1.5% by weight
of the binder, there was a slight decrease in the air void percentages
(approximately 0.5%). This indicated that this dosage did not improve the
workability of the asphalt mixture and it was too stiff to compact. Therefore, the
dosage was increased to 3% by weight of the binder in DryWMA 2, while keeping
the mixing and compaction temperatures same as DryHMA and DryWMA 1. As
clearly illustrated in Figure 4.1c, the air void percentage decreased as the
conditioning time extended. This indicated that the binder-CR reaction continued
and the workability of the mixtures increased at this additive level. Therefore, the
additive percentage for the rest of the mixtures (DryWMA 3 and DryWMA 4) was
also kept same as DryWMA 2. Also, the mixing and compaction temperatures
were varied to observe if it was possible to also reduce these process
temperatures. While preparing the DryWMA 3, both mixing and compaction
temperatures were selected 15˚C lower than the other samples discussed.
Although it was suggested by many researchers that, mixing and compaction
temperatures for dry modified CR mixtures should be 10°C higher than
conventional mixtures. At this point, it was aimed to observe that the temperature
decrease can be compensated or not by the extension in conditioning time.
According to Figure 4.1d, the air void percentage was in the same range
(approximately 4.5% at 0 and 45 minutes of conditioning). However, a steep
increase in the air void percentages was observed when the conditioning duration
was extended to 90 minutes. This indicated that the CR-binder interaction did not
continue due to the lower temperature and the workability decreased. Therefore,
DryWMA 4 was prepared at the same mixing temperature as DryHMA,
DryWMA 1 and DryWMA 2, but the compaction temperature was selected 15 °C
49
lower than these samples, same as DryWMA 3. It was observed that the air void
variation trend and even the air void values of DryWMA 4 was significantly
similar to DryHMA with respect to the conditioning time. Lastly, HMA mixtures
were conditioned only for 90 minutes in order to observe the influence of the
conditioning process while compacting with Marshall Hammer. However, no
effect was observed on HMA mixtures. The air void changes were observed from
Figure 4.1a to Figure 4.1e for CR modified mixture sets.
Figure 4.1 Air voids of mixtures with respect to conditioning time
3.0
3.5
4.0
4.5
5.0
5.5
6.0
0 45 90 120
Air
Vo
ids
(%)
Conditioning Time (min) DryHMA
3.0
3.5
4.0
4.5
5.0
5.5
6.0
0 45 90 120
Air
Vo
ids
(%)
Conditioning Time (min) DryWMA 1
3.0
3.5
4.0
4.5
5.0
5.5
6.0
0 45 90 120
Air
Vo
ids
(%)
Conditioning Time (min) DryWMA 2
3.0
3.5
4.0
4.5
5.0
5.5
6.0
0 45 90 120
Air
Vo
ids
(%)
Conditioning Time (min) DryWMA 3
3.0
3.5
4.0
4.5
5.0
5.5
6.0
0 45 90 120
Air
Vo
ids
(%)
Conditioning Time (min) DryWMA 4
3.0
3.5
4.0
4.5
5.0
5.5
6.0
0 90
Air
Vo
ids
(%)
Conditioning Time (min) HMA
a b
c
d
e
f
50
There are no specifications of VFA and VMA values for dry process CR modified
asphalts, so in this study all the VFA and VMA values were compared based on
the DryHMA volumetric properties. Due to the aggregate gradation in this study,
it is expected to have the high values for VFA and VMA, as given in Figure 4.2
and Figure 4.3.
Figure 4.2 VMA of mixtures with respect to conditioning time
13.0
14.0
15.0
16.0
17.0
18.0
19.0
20.0
0 45 90 120
VM
A (
%)
Conditioning Time (min) DryHMA
13.0
14.0
15.0
16.0
17.0
18.0
19.0
20.0
0 45 90 120
VM
A (
%)
Conditioning Time (min) DryWMA 1
13.0
14.0
15.0
16.0
17.0
18.0
19.0
20.0
0 45 90 120
VM
A (
%)
Conditioning Time (min) DryWMA 2
13.0
14.0
15.0
16.0
17.0
18.0
19.0
20.0
0 45 90 120
VM
A (
%)
Conditioning Time (min) DryWMA 3
13.0
14.0
15.0
16.0
17.0
18.0
19.0
20.0
0 45 90 120
VM
A (
%)
Conditioning Time (min) DryWMA 4
13.0
14.0
15.0
16.0
17.0
18.0
19.0
20.0
0 90
VM
A (
%)
Conditioning Time (min) HMAe
b a
d c
f
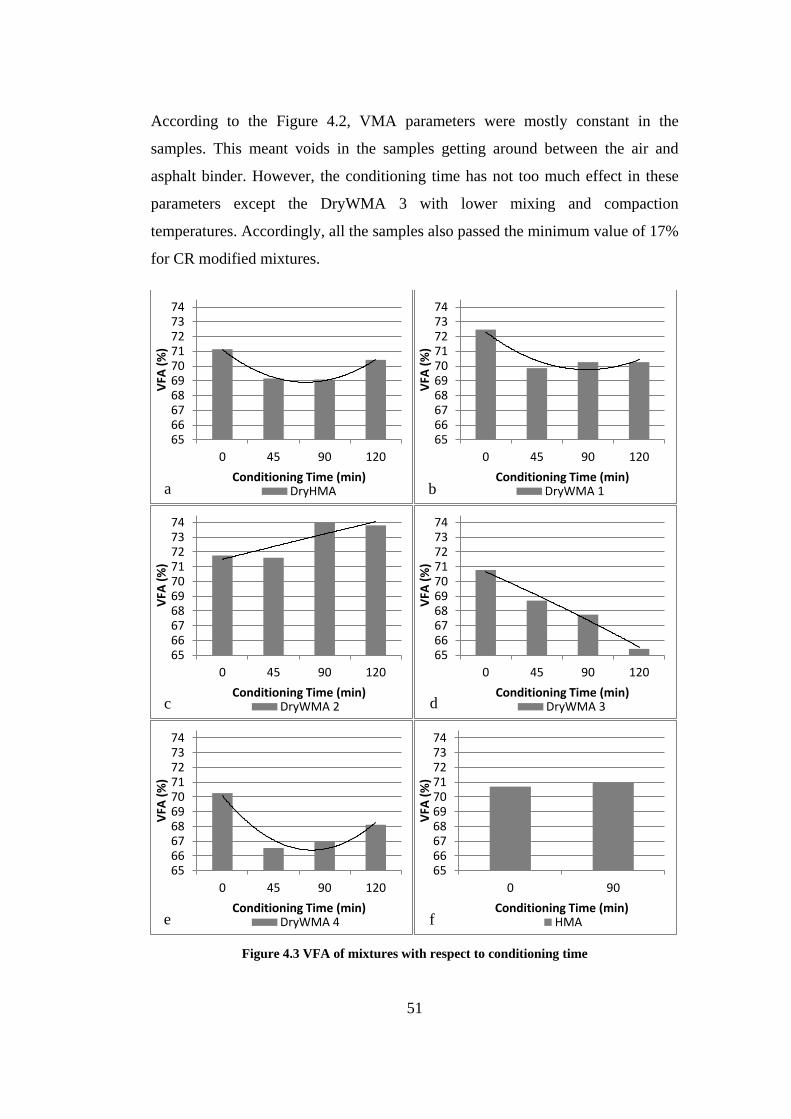
51
According to the Figure 4.2, VMA parameters were mostly constant in the
samples. This meant voids in the samples getting around between the air and
asphalt binder. However, the conditioning time has not too much effect in these
parameters except the DryWMA 3 with lower mixing and compaction
temperatures. Accordingly, all the samples also passed the minimum value of 17%
for CR modified mixtures.
Figure 4.3 VFA of mixtures with respect to conditioning time
65666768697071727374
0 45 90 120
VFA
(%
)
Conditioning Time (min) DryHMA
65666768697071727374
0 45 90 120
VFA
(%
)
Conditioning Time (min) DryWMA 1
65666768697071727374
0 45 90 120
VFA
(%
)
Conditioning Time (min) DryWMA 2
65666768697071727374
0 45 90 120
VFA
(%
)
Conditioning Time (min) DryWMA 3
65666768697071727374
0 45 90 120
VFA
(%
)
Conditioning Time (min) DryWMA 4
65666768697071727374
0 90
VFA
(%
)
Conditioning Time (min) HMA
a b
d c
e f
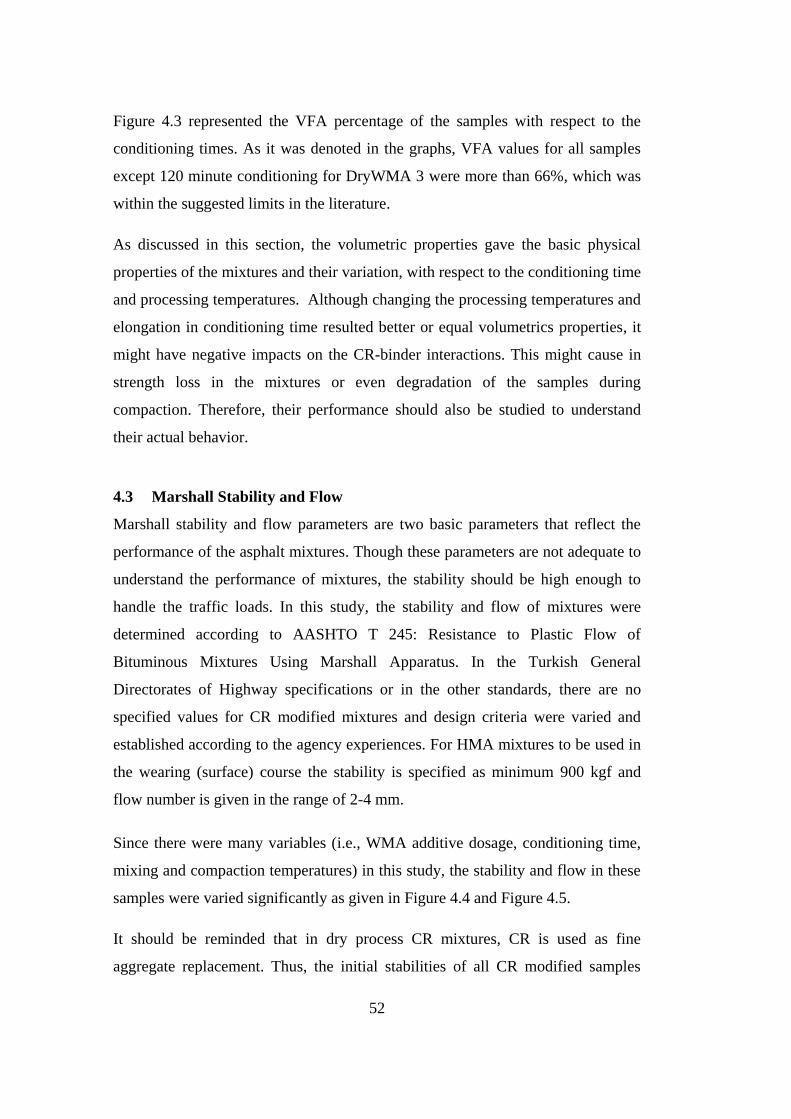
52
Figure 4.3 represented the VFA percentage of the samples with respect to the
conditioning times. As it was denoted in the graphs, VFA values for all samples
except 120 minute conditioning for DryWMA 3 were more than 66%, which was
within the suggested limits in the literature.
As discussed in this section, the volumetric properties gave the basic physical
properties of the mixtures and their variation, with respect to the conditioning time
and processing temperatures. Although changing the processing temperatures and
elongation in conditioning time resulted better or equal volumetrics properties, it
might have negative impacts on the CR-binder interactions. This might cause in
strength loss in the mixtures or even degradation of the samples during
compaction. Therefore, their performance should also be studied to understand
their actual behavior.
4.3 Marshall Stability and Flow
Marshall stability and flow parameters are two basic parameters that reflect the
performance of the asphalt mixtures. Though these parameters are not adequate to
understand the performance of mixtures, the stability should be high enough to
handle the traffic loads. In this study, the stability and flow of mixtures were
determined according to AASHTO T 245: Resistance to Plastic Flow of
Bituminous Mixtures Using Marshall Apparatus. In the Turkish General
Directorates of Highway specifications or in the other standards, there are no
specified values for CR modified mixtures and design criteria were varied and
established according to the agency experiences. For HMA mixtures to be used in
the wearing (surface) course the stability is specified as minimum 900 kgf and
flow number is given in the range of 2-4 mm.
Since there were many variables (i.e., WMA additive dosage, conditioning time,
mixing and compaction temperatures) in this study, the stability and flow in these
samples were varied significantly as given in Figure 4.4 and Figure 4.5.
It should be reminded that in dry process CR mixtures, CR is used as fine
aggregate replacement. Thus, the initial stabilities of all CR modified samples
53
were lower than HMA. As given in Figure 4.4e, HMA samples with 0 minute
conditioning had approximately a stability of 930 kgf. After 90 minutes of
conditioning, the stability increase was about 20%, though the air voids were
similar. Stability of all CR modified mixtures increased with respect to
conditioning time except for DryWMA 3 and DryWMA 4. Slight decrease in the
stability of these mixtures was observed during the conditioning from 90 to 120
minutes, although there was a decrease in air voids of the DryWMA 4. There
could be various reasons for this stability loss: i) It may be due to aging of the
mixtures, which may be investigated with chemical analysis, ii) it may be due to
sample-to-sample variation.
As given in Figure 4.4a, the stability of DryHMA increased at an increasing rate
with conditioning. Assuming the minimum 900 kgf stability limit as the design
criteria, this was met after conditioning more than 45 minutes. Similarly, the
DryWMA 1 and DryWMA 2 showed the same trend and desired stability was
achieved after conditioning for 45 minutes. One more time, this indicated the
importance of conditioning to achieve the binder-CR interactions. It should be
also noted that this was regardless of air void percentage increase in these
samples. However, the stability of DryWMA 3 never met the required limit. The
highest measured was about 820 kgf at 90 minutes conditioning. This revealed
that the decrease in the mixing temperatures could not be compensated by
extending the conditioning time. When the stability of DryWMA 4 was observed
as given in Figure 4.4e, the stability criteria was only met at 90 minutes
conditioning. This was promising since the compaction temperatures can be
lowered. In other words, compaction frame can be longer or it can be compacted
at lower ambient temperatures without sacrificing the performance. However,
further performance tests were needed to ensure the mixture performance.
According to Figure 4.4 and design criteria, these stability results indicated that 90
minutes conditioning could be selected as the optimum time for the digestion of
the CR, Since some of the mixtures (DryWMA 3 and DryWMA 4) had the
highest stability at 90 minutes and all the other mixture sets had higher stability
than the criteria at this conditioning frame.
54
Figure 4.4 Stability of mixtures with respect to conditioning time
Flow is also essential parameter to estimate the deformation in the mixtures. As
given in Figure 4.5, the flow numbers were significantly high for dry modified CR
mixtures at 0 minutes of conditioning, since these samples were not stiff enough
as they had poor binder-CR interaction. According to the fitted trend lines from
Figure 4.5a to Figure 4.5d, the lowest flow values were measured for the samples
conditioned for 90 minutes, which was also meeting the expectations according to
stability results. Additionally, these values are within the specification limits.
700
800
900
1000
1100
0 45 90 120
Stab
ility
(K
gf)
Conditioning Time (min) DryHMA
700
800
900
1000
1100
0 45 90 120
Stab
ility
(K
gf)
Conditioning Time (min) DryWMA 1
700
800
900
1000
1100
0 45 90 120
Stab
ility
(K
gf)
Conditioning Time (min) DryWMA 2
700
800
900
1000
1100
0 45 90 120
Stab
ility
(K
gf)
Conditioning Time (min) DryWMA 3
700
800
900
1000
1100
0 45 90 120
Stab
ility
(K
gf)
Conditioning Time (min) DryWMA 4
700
800
900
1000
1100
0 90
Stab
ility
(K
gf)
Conditioning Time (min) HMAf
a b
c d
e
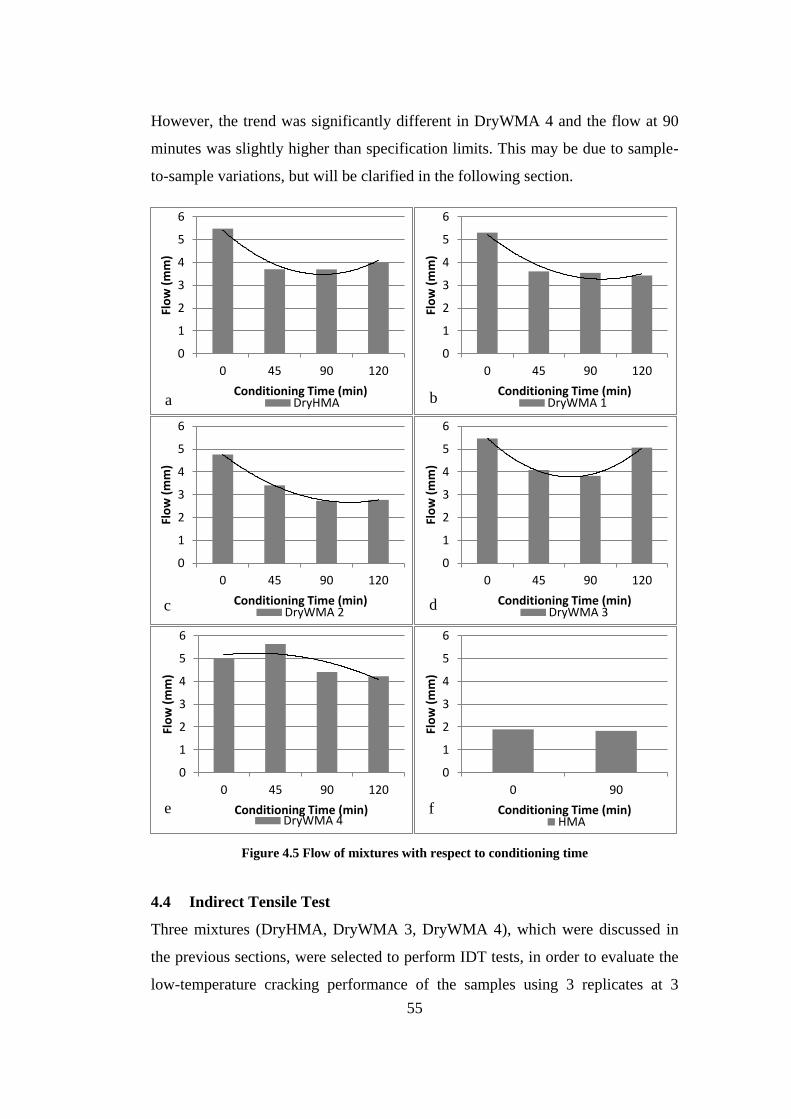
55
However, the trend was significantly different in DryWMA 4 and the flow at 90
minutes was slightly higher than specification limits. This may be due to sample-
to-sample variations, but will be clarified in the following section.
Figure 4.5 Flow of mixtures with respect to conditioning time
4.4 Indirect Tensile Test
Three mixtures (DryHMA, DryWMA 3, DryWMA 4), which were discussed in
the previous sections, were selected to perform IDT tests, in order to evaluate the
low-temperature cracking performance of the samples using 3 replicates at 3
0
1
2
3
4
5
6
0 45 90 120
Flo
w (
mm
)
Conditioning Time (min) DryHMA
0
1
2
3
4
5
6
0 45 90 120
Flo
w (
mm
)
Conditioning Time (min) DryWMA 1
0
1
2
3
4
5
6
0 45 90 120
Flo
w (
mm
)
Conditioning Time (min) DryWMA 2
0
1
2
3
4
5
6
0 45 90 120
Flo
w (
mm
)
Conditioning Time (min) DryWMA 3
0
1
2
3
4
5
6
0 45 90 120
Flo
w (
mm
)
Conditioning Time (min) DryWMA 4
0
1
2
3
4
5
6
0 90
Flo
w (
mm
)
Conditioning Time (min) HMA
a b
c d
e f
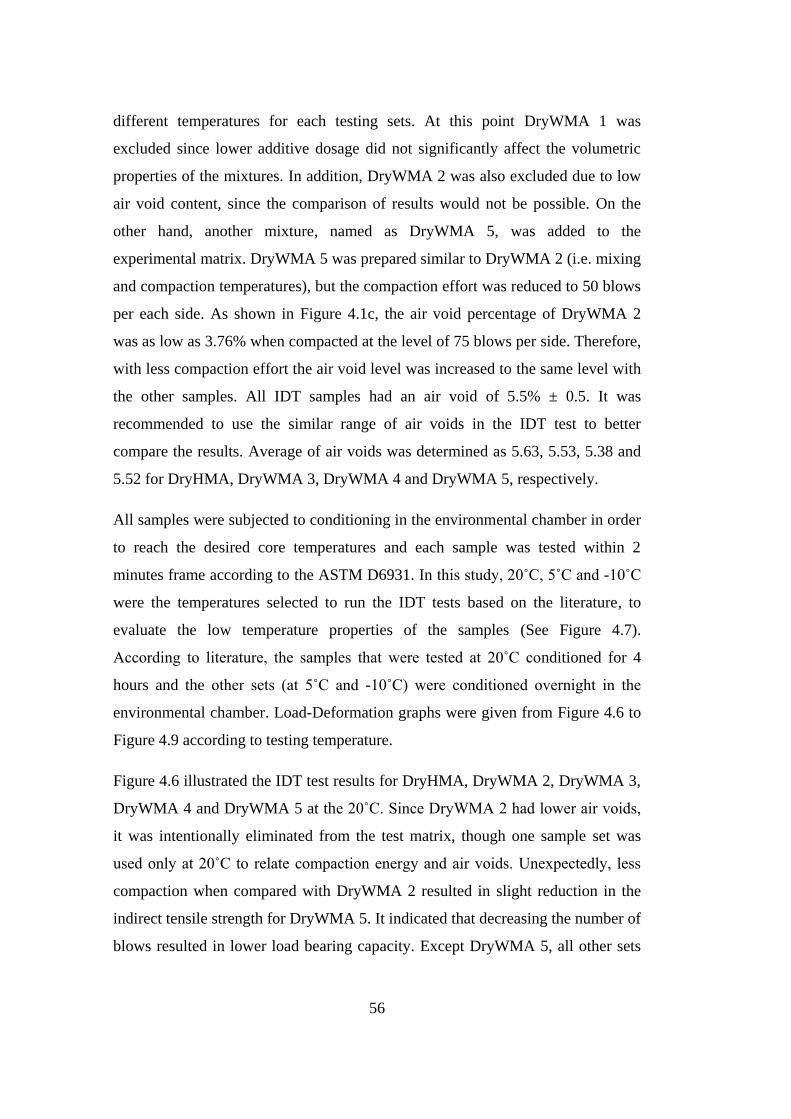
56
different temperatures for each testing sets. At this point DryWMA 1 was
excluded since lower additive dosage did not significantly affect the volumetric
properties of the mixtures. In addition, DryWMA 2 was also excluded due to low
air void content, since the comparison of results would not be possible. On the
other hand, another mixture, named as DryWMA 5, was added to the
experimental matrix. DryWMA 5 was prepared similar to DryWMA 2 (i.e. mixing
and compaction temperatures), but the compaction effort was reduced to 50 blows
per each side. As shown in Figure 4.1c, the air void percentage of DryWMA 2
was as low as 3.76% when compacted at the level of 75 blows per side. Therefore,
with less compaction effort the air void level was increased to the same level with
the other samples. All IDT samples had an air void of 5.5% ± 0.5. It was
recommended to use the similar range of air voids in the IDT test to better
compare the results. Average of air voids was determined as 5.63, 5.53, 5.38 and
5.52 for DryHMA, DryWMA 3, DryWMA 4 and DryWMA 5, respectively.
All samples were subjected to conditioning in the environmental chamber in order
to reach the desired core temperatures and each sample was tested within 2
minutes frame according to the ASTM D6931. In this study, 20˚C, 5˚C and -10˚C
were the temperatures selected to run the IDT tests based on the literature, to
evaluate the low temperature properties of the samples (See Figure 4.7).
According to literature, the samples that were tested at 20˚C conditioned for 4
hours and the other sets (at 5˚C and -10˚C) were conditioned overnight in the
environmental chamber. Load-Deformation graphs were given from Figure 4.6 to
Figure 4.9 according to testing temperature.
Figure 4.6 illustrated the IDT test results for DryHMA, DryWMA 2, DryWMA 3,
DryWMA 4 and DryWMA 5 at the 20˚C. Since DryWMA 2 had lower air voids,
it was intentionally eliminated from the test matrix, though one sample set was
used only at 20˚C to relate compaction energy and air voids. Unexpectedly, less
compaction when compared with DryWMA 2 resulted in slight reduction in the
indirect tensile strength for DryWMA 5. It indicated that decreasing the number of
blows resulted in lower load bearing capacity. Except DryWMA 5, all other sets
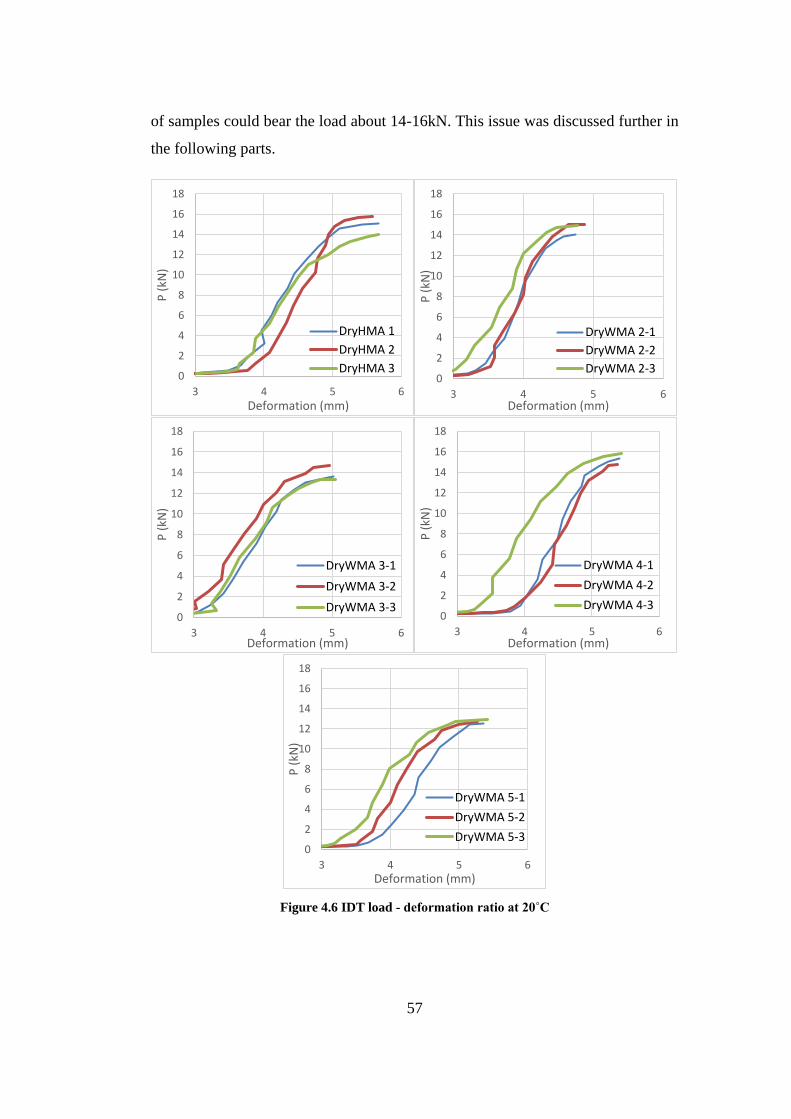
57
of samples could bear the load about 14-16kN. This issue was discussed further in
the following parts.
Figure 4.6 IDT load - deformation ratio at 20˚C
0
2
4
6
8
10
12
14
16
18
3 4 5 6
P (
kN)
Deformation (mm)
DryHMA 1
DryHMA 2
DryHMA 30
2
4
6
8
10
12
14
16
18
3 4 5 6
P (
kN)
Deformation (mm)
DryWMA 2-1
DryWMA 2-2
DryWMA 2-3
0
2
4
6
8
10
12
14
16
18
3 4 5 6
P (
kN)
Deformation (mm)
DryWMA 3-1
DryWMA 3-2
DryWMA 3-30
2
4
6
8
10
12
14
16
18
3 4 5 6
P (
kN)
Deformation (mm)
DryWMA 4-1
DryWMA 4-2
DryWMA 4-3
0
2
4
6
8
10
12
14
16
18
3 4 5 6
P (
kN)
Deformation (mm)
DryWMA 5-1
DryWMA 5-2
DryWMA 5-3
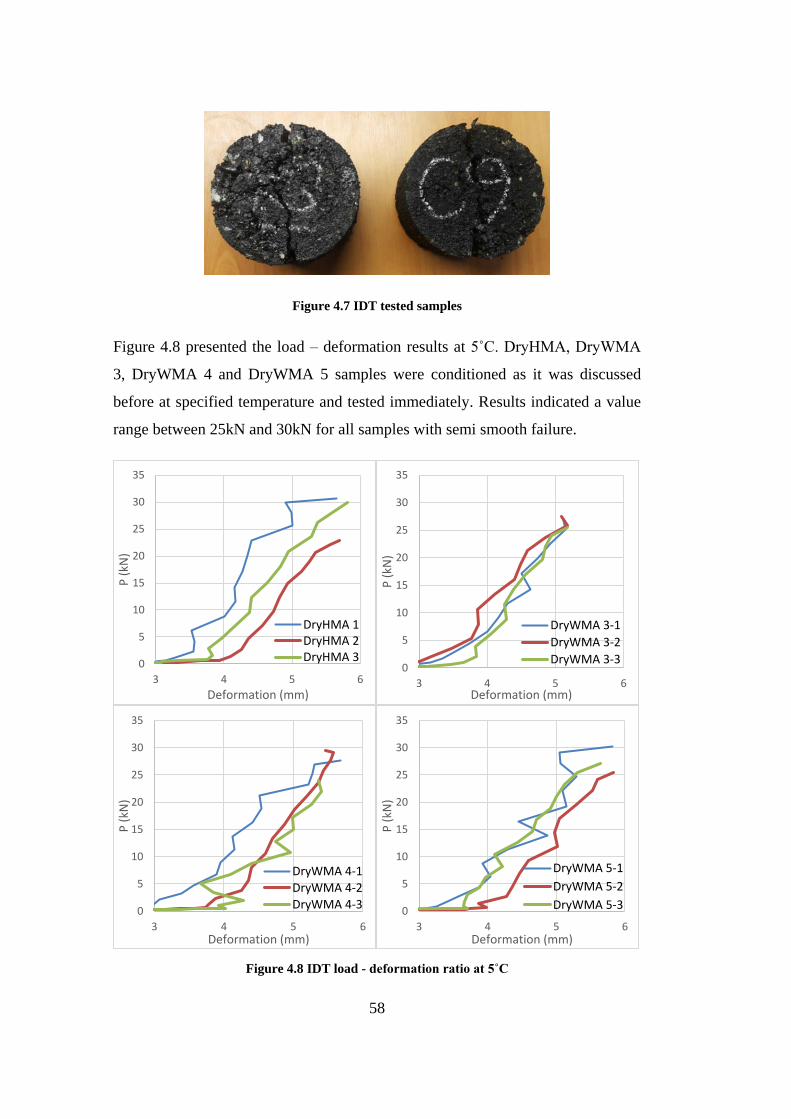
58
Figure 4.7 IDT tested samples
Figure 4.8 presented the load – deformation results at 5˚C. DryHMA, DryWMA
3, DryWMA 4 and DryWMA 5 samples were conditioned as it was discussed
before at specified temperature and tested immediately. Results indicated a value
range between 25kN and 30kN for all samples with semi smooth failure.
Figure 4.8 IDT load - deformation ratio at 5˚C
0
5
10
15
20
25
30
35
3 4 5 6
P (
kN)
Deformation (mm)
DryHMA 1DryHMA 2DryHMA 3
0
5
10
15
20
25
30
35
3 4 5 6
P (
kN)
Deformation (mm)
DryWMA 3-1
DryWMA 3-2
DryWMA 3-3
0
5
10
15
20
25
30
35
3 4 5 6
P (
kN)
Deformation (mm)
DryWMA 4-1DryWMA 4-2DryWMA 4-3
0
5
10
15
20
25
30
35
3 4 5 6
P (
kN)
Deformation (mm)
DryWMA 5-1
DryWMA 5-2
DryWMA 5-3
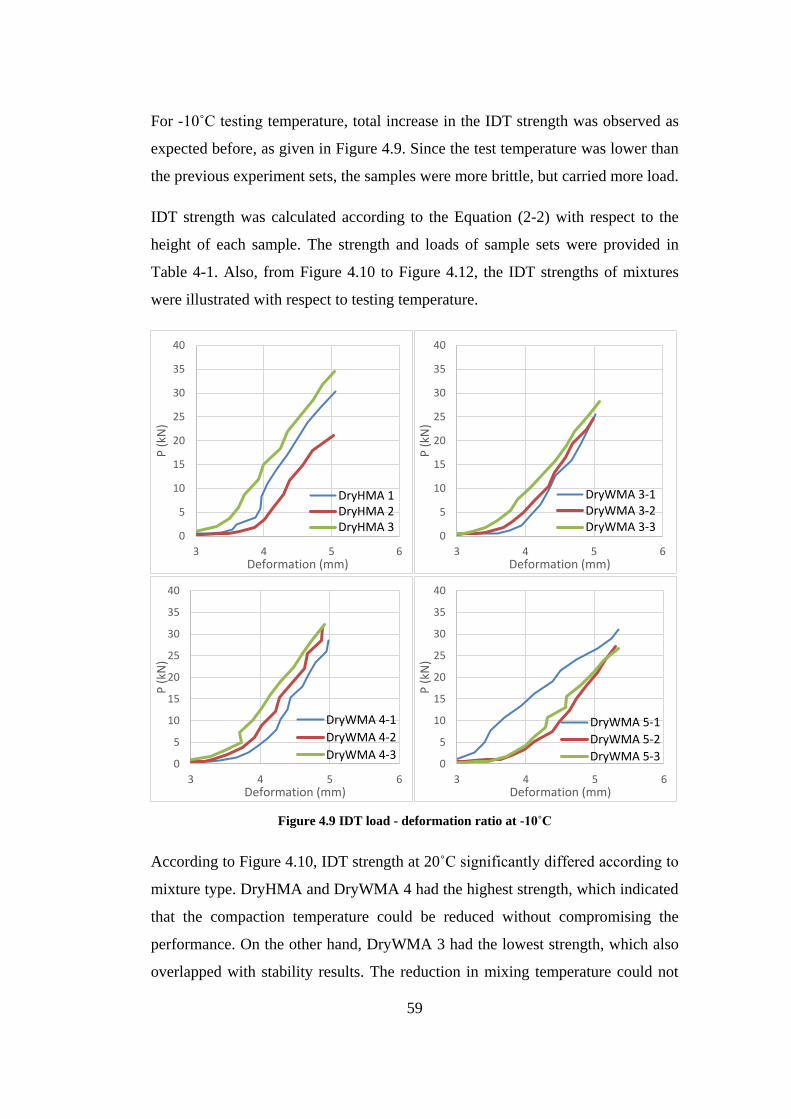
59
For -10˚C testing temperature, total increase in the IDT strength was observed as
expected before, as given in Figure 4.9. Since the test temperature was lower than
the previous experiment sets, the samples were more brittle, but carried more load.
IDT strength was calculated according to the Equation (2-2) with respect to the
height of each sample. The strength and loads of sample sets were provided in
Table 4-1. Also, from Figure 4.10 to Figure 4.12, the IDT strengths of mixtures
were illustrated with respect to testing temperature.
Figure 4.9 IDT load - deformation ratio at -10˚C
According to Figure 4.10, IDT strength at 20˚C significantly differed according to
mixture type. DryHMA and DryWMA 4 had the highest strength, which indicated
that the compaction temperature could be reduced without compromising the
performance. On the other hand, DryWMA 3 had the lowest strength, which also
overlapped with stability results. The reduction in mixing temperature could not
0
5
10
15
20
25
30
35
40
3 4 5 6
P (
kN)
Deformation (mm)
DryHMA 1DryHMA 2DryHMA 3
0
5
10
15
20
25
30
35
40
3 4 5 6
P (
kN)
Deformation (mm)
DryWMA 3-1DryWMA 3-2DryWMA 3-3
0
5
10
15
20
25
30
35
40
3 4 5 6
P (
kN)
Deformation (mm)
DryWMA 4-1
DryWMA 4-2
DryWMA 4-30
5
10
15
20
25
30
35
40
3 4 5 6
P (
kN)
Deformation (mm)
DryWMA 5-1
DryWMA 5-2
DryWMA 5-3
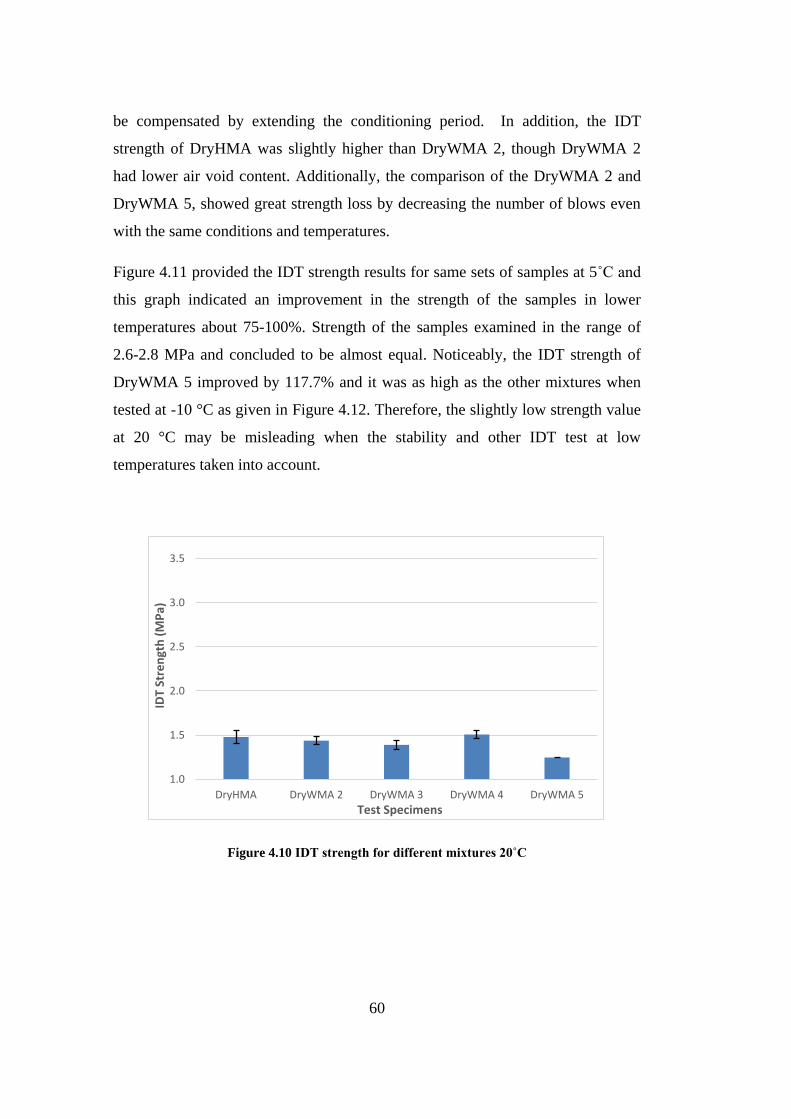
60
be compensated by extending the conditioning period. In addition, the IDT
strength of DryHMA was slightly higher than DryWMA 2, though DryWMA 2
had lower air void content. Additionally, the comparison of the DryWMA 2 and
DryWMA 5, showed great strength loss by decreasing the number of blows even
with the same conditions and temperatures.
Figure 4.11 provided the IDT strength results for same sets of samples at 5˚C and
this graph indicated an improvement in the strength of the samples in lower
temperatures about 75-100%. Strength of the samples examined in the range of
2.6-2.8 MPa and concluded to be almost equal. Noticeably, the IDT strength of
DryWMA 5 improved by 117.7% and it was as high as the other mixtures when
tested at -10 °C as given in Figure 4.12. Therefore, the slightly low strength value
at 20 °C may be misleading when the stability and other IDT test at low
temperatures taken into account.
Figure 4.10 IDT strength for different mixtures 20˚C
1.0
1.5
2.0
2.5
3.0
3.5
DryHMA DryWMA 2 DryWMA 3 DryWMA 4 DryWMA 5
IDT
Stre
ngt
h (
MP
a)
Test Specimens
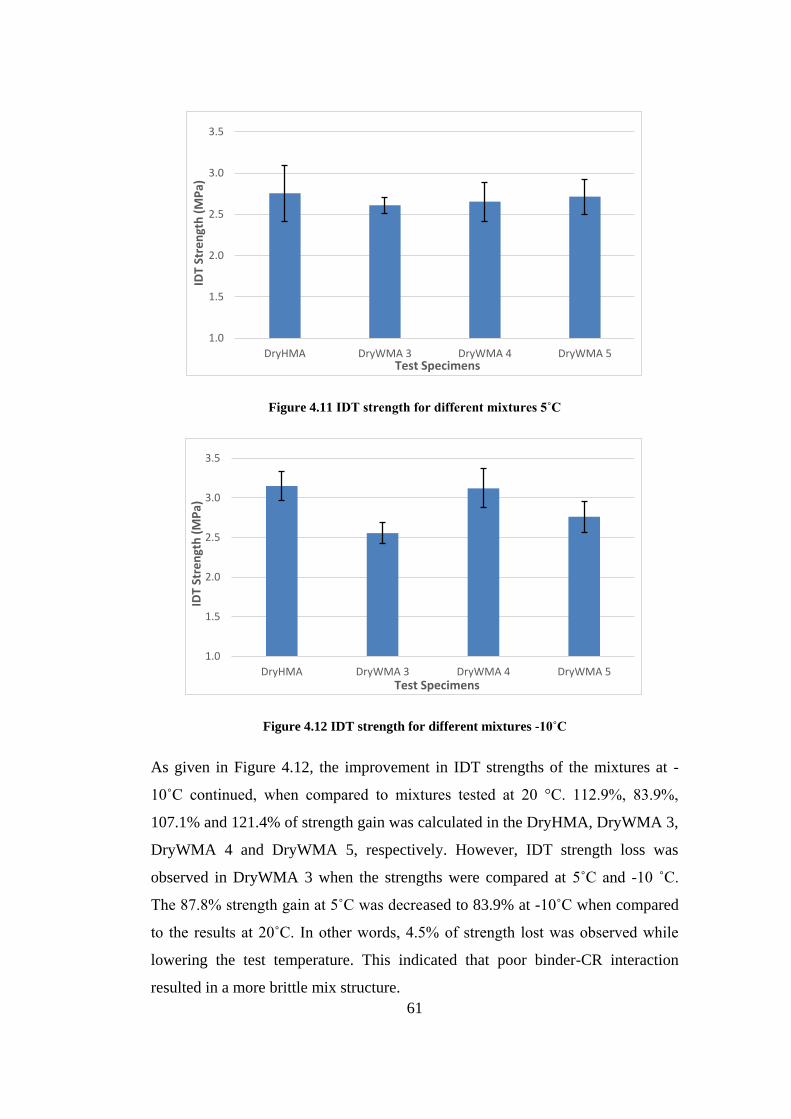
61
Figure 4.11 IDT strength for different mixtures 5˚C
Figure 4.12 IDT strength for different mixtures -10˚C
As given in Figure 4.12, the improvement in IDT strengths of the mixtures at -
10˚C continued, when compared to mixtures tested at 20 °C. 112.9%, 83.9%,
107.1% and 121.4% of strength gain was calculated in the DryHMA, DryWMA 3,
DryWMA 4 and DryWMA 5, respectively. However, IDT strength loss was
observed in DryWMA 3 when the strengths were compared at 5˚C and -10 ˚C.
The 87.8% strength gain at 5˚C was decreased to 83.9% at -10˚C when compared
to the results at 20˚C. In other words, 4.5% of strength lost was observed while
lowering the test temperature. This indicated that poor binder-CR interaction
resulted in a more brittle mix structure.
1.0
1.5
2.0
2.5
3.0
3.5
DryHMA DryWMA 3 DryWMA 4 DryWMA 5
IDT
Stre
ngt
h (
MP
a)
Test Specimens
1.0
1.5
2.0
2.5
3.0
3.5
DryHMA DryWMA 3 DryWMA 4 DryWMA 5
IDT
Stre
ngt
h (
MP
a)
Test Specimens
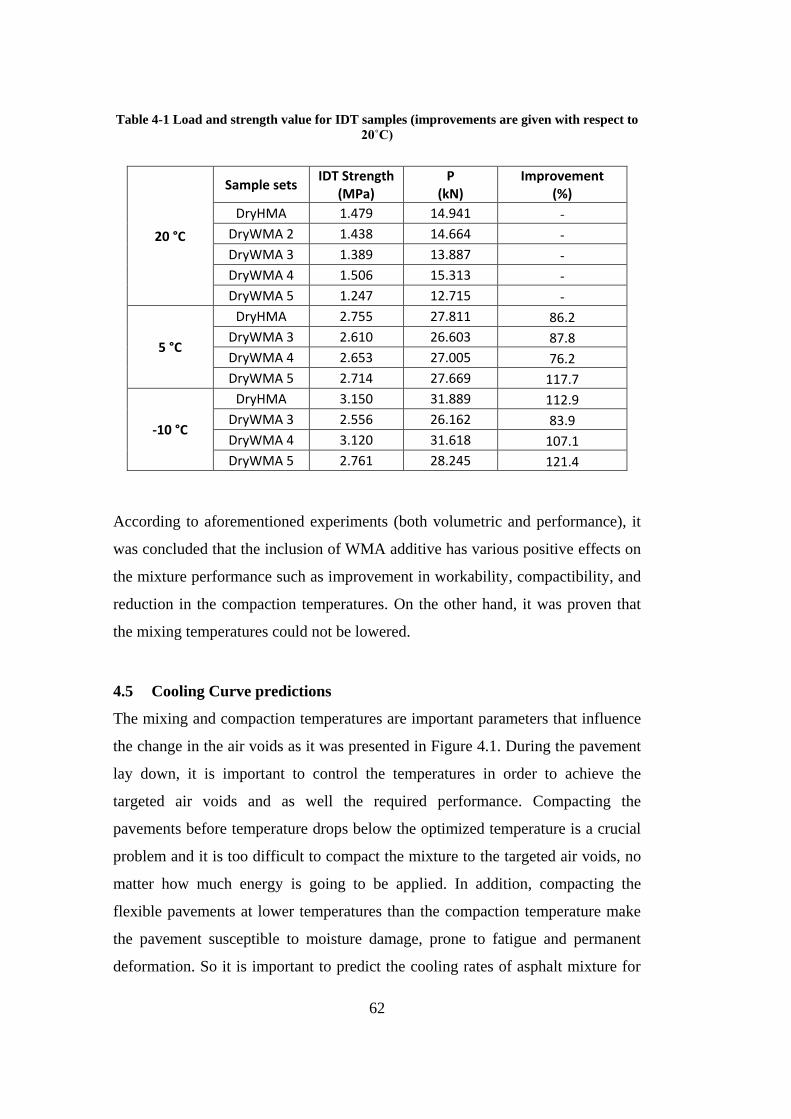
62
Table 4-1 Load and strength value for IDT samples (improvements are given with respect to
20˚C)
20 °C
Sample sets IDT Strength
(MPa) P
(kN) Improvement
(%)
DryHMA 1.479 14.941 -
DryWMA 2 1.438 14.664 -
DryWMA 3 1.389 13.887 -
DryWMA 4 1.506 15.313 -
DryWMA 5 1.247 12.715 -
5 °C
DryHMA 2.755 27.811 86.2
DryWMA 3 2.610 26.603 87.8
DryWMA 4 2.653 27.005 76.2
DryWMA 5 2.714 27.669 117.7
-10 °C
DryHMA 3.150 31.889 112.9
DryWMA 3 2.556 26.162 83.9
DryWMA 4 3.120 31.618 107.1
DryWMA 5 2.761 28.245 121.4
According to aforementioned experiments (both volumetric and performance), it
was concluded that the inclusion of WMA additive has various positive effects on
the mixture performance such as improvement in workability, compactibility, and
reduction in the compaction temperatures. On the other hand, it was proven that
the mixing temperatures could not be lowered.
4.5 Cooling Curve predictions
The mixing and compaction temperatures are important parameters that influence
the change in the air voids as it was presented in Figure 4.1. During the pavement
lay down, it is important to control the temperatures in order to achieve the
targeted air voids and as well the required performance. Compacting the
pavements before temperature drops below the optimized temperature is a crucial
problem and it is too difficult to compact the mixture to the targeted air voids, no
matter how much energy is going to be applied. In addition, compacting the
flexible pavements at lower temperatures than the compaction temperature make
the pavement susceptible to moisture damage, prone to fatigue and permanent
deformation. So it is important to predict the cooling rates of asphalt mixture for
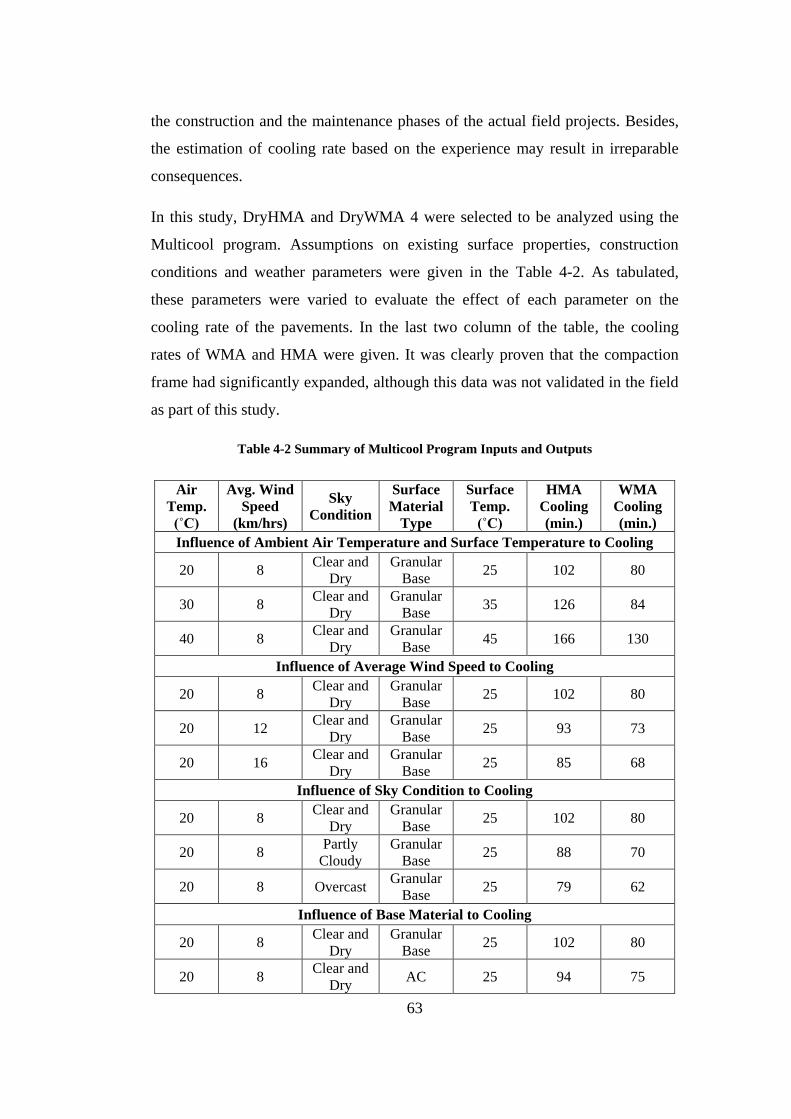
63
the construction and the maintenance phases of the actual field projects. Besides,
the estimation of cooling rate based on the experience may result in irreparable
consequences.
In this study, DryHMA and DryWMA 4 were selected to be analyzed using the
Multicool program. Assumptions on existing surface properties, construction
conditions and weather parameters were given in the Table 4-2. As tabulated,
these parameters were varied to evaluate the effect of each parameter on the
cooling rate of the pavements. In the last two column of the table, the cooling
rates of WMA and HMA were given. It was clearly proven that the compaction
frame had significantly expanded, although this data was not validated in the field
as part of this study.
Table 4-2 Summary of Multicool Program Inputs and Outputs
Air
Temp.
(˚C)
Avg. Wind
Speed
(km/hrs)
Sky
Condition
Surface
Material
Type
Surface
Temp.
(˚C)
HMA
Cooling
(min.)
WMA
Cooling
(min.)
Influence of Ambient Air Temperature and Surface Temperature to Cooling
20 8 Clear and
Dry
Granular
Base 25 102 80
30 8 Clear and
Dry
Granular
Base 35 126 84
40 8 Clear and
Dry
Granular
Base 45 166 130
Influence of Average Wind Speed to Cooling
20 8 Clear and
Dry
Granular
Base 25 102 80
20 12 Clear and
Dry
Granular
Base 25 93 73
20 16 Clear and
Dry
Granular
Base 25 85 68
Influence of Sky Condition to Cooling
20 8 Clear and
Dry
Granular
Base 25 102 80
20 8 Partly
Cloudy
Granular
Base 25 88 70
20 8 Overcast Granular
Base 25 79 62
Influence of Base Material to Cooling
20 8 Clear and
Dry
Granular
Base 25 102 80
20 8 Clear and
Dry AC 25 94 75
64
Different agencies allowed minimum temperature to stop the compaction at 80˚C.
Compacting the mixture below this temperature is not suggested since it would
cause adverse problems in pavements. Since compacting process is energy
consuming, getting to the targeted air voids below this temperature is not so easy.
This compaction effort even could reduce the density or start the fracture in
aggregates which is not appropriate in the pavements. The stop temperature
(85˚C) in this study is selected 5˚C more than the suggested minimum temperature
since dry process CR modified mixtures are harder to compact, comparing to
traditional HMA mixtures. Therefore, the delivery temperature was determined as
the compaction temperatures and 85˚C was selected as the stop temperature with
respect to various studies.
Low temperatures at night and high wind speed are the most considerable
parameters during the night construction. In order to evaluate these cases, air
temperatures in this study were selected as 20, 30 and 40˚C, also surface
temperature for the pavement were increased for 5˚C according to the air
temperatures, respectively. Wind speeds for this project were assumed to be 8, 12
and 16km/hrs, by keeping the other values constant to evaluate the wind speed
variation effects on the cooling time. Sky condition for the project was varied as
clear and dry, partly cloudy and overcast also with keeping other variables
constant. Additionally, two major surface materials were selected as the input
parameters. Table 4-2 was prepared to evaluate the results of the Multicool
program at the above-mentioned conditions. Data provided in this table indicated
that 20 minutes difference between HMA and WMA cooling durations were
observed under any condition.
In addition to the cooling rate during the compaction, the cooling rate of the
mixtures during the hauling time till the project location should be determined to
manage the construction. This period of the project has no simulation method to
calculate, so Multicool program was also used to estimate the cooling rate in this
study. At this phase, the starting temperature was selected as the mixing
temperature where the mixture was loaded to the carrier and stopping temperature
was estimated as compaction temperature, which is the starting time of
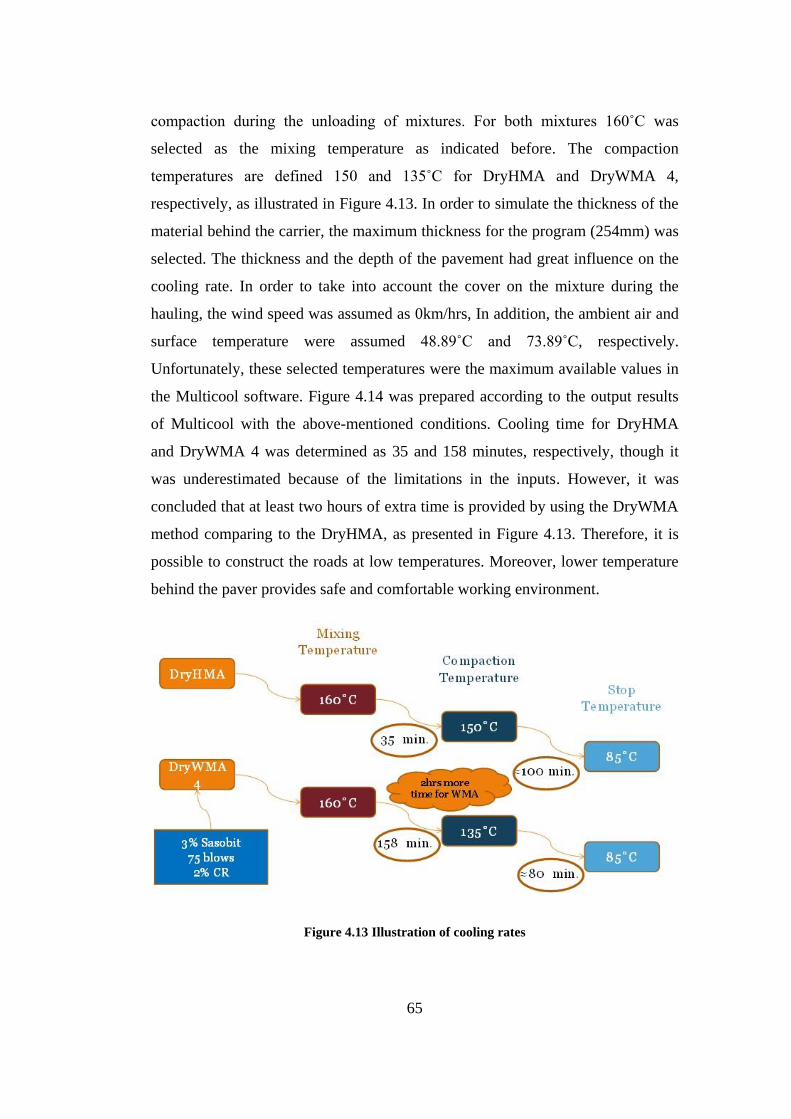
65
compaction during the unloading of mixtures. For both mixtures 160˚C was
selected as the mixing temperature as indicated before. The compaction
temperatures are defined 150 and 135˚C for DryHMA and DryWMA 4,
respectively, as illustrated in Figure 4.13. In order to simulate the thickness of the
material behind the carrier, the maximum thickness for the program (254mm) was
selected. The thickness and the depth of the pavement had great influence on the
cooling rate. In order to take into account the cover on the mixture during the
hauling, the wind speed was assumed as 0km/hrs, In addition, the ambient air and
surface temperature were assumed 48.89˚C and 73.89˚C, respectively.
Unfortunately, these selected temperatures were the maximum available values in
the Multicool software. Figure 4.14 was prepared according to the output results
of Multicool with the above-mentioned conditions. Cooling time for DryHMA
and DryWMA 4 was determined as 35 and 158 minutes, respectively, though it
was underestimated because of the limitations in the inputs. However, it was
concluded that at least two hours of extra time is provided by using the DryWMA
method comparing to the DryHMA, as presented in Figure 4.13. Therefore, it is
possible to construct the roads at low temperatures. Moreover, lower temperature
behind the paver provides safe and comfortable working environment.
Figure 4.13 Illustration of cooling rates
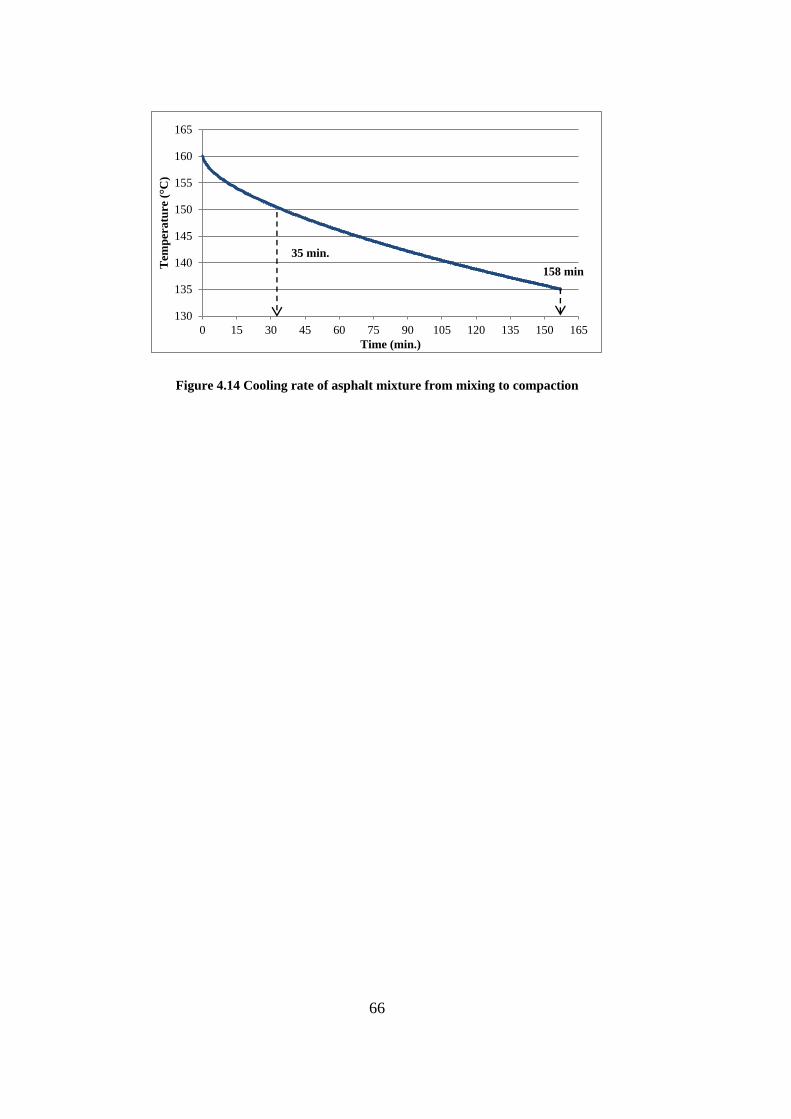
66
Figure 4.14 Cooling rate of asphalt mixture from mixing to compaction
130
135
140
145
150
155
160
165
0 15 30 45 60 75 90 105 120 135 150 165
Tem
per
atu
re (°C
)
Time (min.)
35 min.
158 min
67
CHAPTER 5
5 CONCLUSIONS AND RECOMMENDATIONS
5.1 Introduction
In this chapter, the outcomes of the study are summarized and some
recommendations for future studies are provided. To interpret the asphalt mixture
physical and performance properties, several parameters including the additive
dosage, compaction temperature, mixing temperature, and conditioning time were
varied throughout the study. On the other hand, there were some limitations
including the single aggregate source, single binder type and source, one crumb
rubber dosage, and one type of WMA additive. Therefore, several DryHMA and
DryWMA samples were prepared to evaluate the volumetrics, stability and
indirect tensile strength of these mixtures. Furthermore, in order to demonstrate
the advantages of WMA on crumb rubber modification, cooling curves were also
analyzed.
5.2 Conclusions
This study associates many design parameters to the physical and performance
properties of the mixtures. Based on the comparison of the traditional HMA and
DryHMA to several DryWMA mixtures, the following major conclusions are
drawn:
• The compactibility and workability of asphalt mixtures with the addition
of WMA additive improve, regardless of any changes in the mixture preparation
plan.
68
• WMA additive dosage has a considerable effect on the compactibility and
stability of the dry CR modified mixtures. Therefore, proper amount for WMA
additive should be determined for successful implementation.
• Mixing temperature has significant effect on the stability of the mixtures,
regardless of compaction temperature since it is a significant parameter for the
CR-binder interaction. For DryWMA3, the highest measured stability was about
820 kgf at 90 minutes conditioning time. This reveals that the decrease in the
mixing temperatures could not be compensated by extending the conditioning
time.
• Conditioning time allows better CR-binder interaction, which results in the
improvement of stability and mixture binding properties.
• Lower compaction temperature of DryWMA mixtures increases the health
and safety of workers and provides a comfortable working condition, due to
exposure to lower carbon emission.
• Reduction in the compaction temperature has not significantly altered the
performance of mixtures. Thus, it can be concluded that this method helps to
compact the mixtures at lower temperatures. Accordingly, the hauling distance
could be longer and it is possible to work at lower ambient temperatures.
• According to the stability and volumetric results, the conditioning time has
significant effect on performance properties of DryWMA. However, this
conditioning should be limited to 90 minutes.
• Addition of WMA additive to asphalt mixtures did not significantly affect
the IDT strength (Refer to Figures 4.9 to 4.11).
• WMA additives could be used as compaction aid for Dry process CR
modified mixtures.
• Despite the IDT results at 20°C, it is concluded that reducing the
compaction effort is possible for dry process CR modified WMA at the similar
temperatures with the DryHMA mixtures.
69
• According to cooling rate analysis, it is concluded that WMA additives
increase the hauling frame and compaction time for the dry processed CR
mixtures. It is anticipated that it provides approximately 2 hours of extension in
this time frame.
By considering the world pollution and necessity of more environmentally
friendly methods in pavement engineering, WMA method and CR modifications
are the mostly used techniques in pavement construction, separately. According to
this study, it is concluded that the association of these two methods might be
successfully used in the actual field projects.
5.3 Recommendations
Considerable findings of this study are discussed in section 5.2. Also, further
studies are needed to improve these results and extend the current research.
Permanent deformation and moisture susceptibility tests should be performed to
ensure the rutting resistance of CR modified mixtures. Additionally, the findings
of this research should be verified in the field. In addition, the CR dosage might
be varied in order to come up with the optimum dosage. Moreover, these findings
are limited with one type of WMA additive. Therefore, these analyses could be
repeated by using other WMA technologies in order to validate the research
outcomes.

70
71
REFERENCES
ASTM D6927-15. (2015). Standard test method for Marshall stability and flow of
asphalt mixtures. West Conshohocken, PA: ASTM.
Abdullah, M. E., Zamhari, K. A., Shamshudin, M. K., Hainin, M. R., & Mohd
Satar, M. I. (2013). Rheological Properties of Asphalt Binder Modified
with Chemical Warm Asphalt Additive. Advanced Materials Research,
671, 1692-1699.
Ahmed, E. I., Hesp, S. A., Samy, S. K., Rubab, S. D., & Warburton, G. (2012).
Effect of warm mix additives and dispersants on asphalt rheological,
aging, and failure properties. Construction and Building Materials, 37,
493-498.
Ahmed, S. O. (2015). Comparing Cooling of Warm Mix to Hot Mix Asphalts.
(Doctoral dissertation, North Dakota State University).
Al Qadi, A., AlHasanat, M., & Haddad, M. (2016). Effect of Crumb Rubber as
Coarse and Fine Aggregates on the Properties of Asphalt Concrete.
American Journal of Engineering and Applied Sciences, 9(3), 558-564.
Amirkhanian, S. (2001). Utilization of Crumb Rubber in Asphaltic Concrete
Mixtures-South Carolina's Experience. In Recycling and Reuse of Used
Tyres (pp. 163-174).
Arega, Z., & Bhasin, A. (2012). Interim Report: Binder Rheology and
Performance in Warm Mix Asphalt. Austin: Texas Department of
Transportation.
ASTM C127-12. (2012). Standard test method for density, relative density
(specific gravity), and absorption of coarse aggregate. West
Conshohocken, PA: ASTM.
72
ASTM C128. (2015). Standard Test Method for Relative Density (Specific
Gravity) and Absorption of Fine Aggregate. West Conshohocken, PA:
American Society for Testing and Materials.
ASTM D113. (2007). Standard test method for ductility of bituminous materials.
West Conshohocken, PA: Annual Book of Standards.
ASTM D36. (2006). Standard Test Method for Softening Point of Bitumen (Ring‐
and‐Ball Apparatus). West Conshohocken, PA: Annual Book of
Standards.
ASTM D4123-82. (1995). Standard Test Method for Indirect Tension Test for
Resilient Modulus of Bituminous Mixtures (Withdrawn 2003). West
Conshohocken, PA: ASTM.
ASTM D5. (2013). Standard test method for penetration of bituminous materials.
West Conshohocken, PA: ASTM International.
ASTM D6931. (2012). Standard test method for indirect tensile (IDT) strength of
bituminous mixtures. West Conshohocken, PA: ASTM.
ASTM D6932. (2013). Standard Guid for Materials and Construction of Open-
Graded Friction Course Plant Mixtures. West Conshohocken, PA: ASTM.
ASTM D70-18. (2018). Standard Test Method for Density of Semi-Solid Asphalt
Binder (Pycnometer Method). West Conshohocken, PA: ASTM.
ASTM D8-02. (2002). Standard Terminology Relating to Materials for Roads and
Pavements. West Conshohocken, PA: American Society for Testing and
Materials.
ASTM D92. (2002). Standard test method for flash and fire points by Cleveland
open cup tester. West Conshohocken, PA: Annual Book of Standards.
Bahia, H., Hanson, D., Zeng, M., Zhai, H., Khatri, M., & Anderson, R. (2001).
Characterization of Modified Asphalt Binders in Superpave Mix Design.
73
NCHRP. Retrieved from
http://onlinepubs.trb.org/onlinepubs/nchrp/nchrp_rpt_459-a.pdf
Behl, A., Chandra, S., & Aggarwal, V. (2013). Rheological Characterization of
Bituminous Binder containing Wax based Warm Mix Asphalt Additive.
IOSR Journal of Mechanical and Civil Engineering (IOSR-JMCE), 9(1),
16-22.
Behl, A., Chandra, S., Aggarwal, V. K., & Gangopadhyay, S. (2014).
Temperature Susceptibility of Warm Mix Bituminous Binders.
International Conference on Transportation Planning and Implementation
Methodologies for Developing Countries. Mumbai: IIT.
Behl, A., Kumar, G., Sharma, G., & Jain, P. (2013). Evaluation of field
performance of warm-mix asphalt pavements in India. Procedia-social
and behavioral sciences, 104, 158-167.
Bindu, C. (2012). Influence of additives on the charactaristics of stone matrix
asphalt. (Doctoral dissertation, Cochin University of Science and
Technology).
Brown, E. R., Kandhal, P. S., & Zhang, J. (2001). Performance Testing for Hot
Mix Asphalt. NCAT Report 1(05).
Caltrans. (2003). Asphalt Rubber Usage Guide. California: State of California
Department of Transportation.
Canestrari, F., Graziani, A., Pannunzio, V., & Bahia, H. U. (2013). Rheological
Properties of Bituminous Binders with Synthetic Wax. International
Journal of Pavement Research and Technology, 6(1), 15-21.
Cao, W. (2007). Study on Properties of Recycled Tire Rubber Modified Asphalt
Mixtures Using Dry Process. Construction and Building Materials, 21(5),
1011-1015.
Cerni, G., Bocci, E., Cardone, F., & Corradini, A. (2017). Correlation Between
Asphalt Mixture Stiffness Determined Through Static and Dynamic
74
Indirect Tensile Tests. Arabian Journal for Science and Engineering,
42(3), 1295-1303.
Cervarich, M. (2003). Cooling Down the Mix – New "Warm Mix Asphalt"
Technologies Developed in Europe. Lanham, MD: National Asphalt
Pavement Association,.
Chadboum, B. A., Newcomb, D. E., Voller, V. R., DeSombre, R. A., Luoma, J.
A., & Timm, D. H. (1998). An Asphalt Paving Tool for Adverse
Conditions. Minnesota: Minnesota Department of Transportation.
Chang, C.-M., Chang, Y.-J., & Chen, J.-S. (2009). Effect of Mixture
Characteristics on Cooling Rate of Asphalt Pavements. Journal of
Transportation Engineering, 135(5), 297-304.
Corradini, A., Cerni, G., D'Alessandro, A., & Ubertini, F. (2017). Improved
understanding of grouted mixture fatigue behavior under indirect tensile
test configuration. Construction and Building Materials, 155, 910-918.
Dan, H.-C., Zhang, Z., Chen, J.-Q., & Wang, H. (2018). Numerical Simulation of
an Indirect Tensile Test for Asphalt Mixtures Using Discrete Element
Method Software. Journal of Materials in Civil Engineering, 30(5).
D'Angelo, J., Harm, E., Bartoszek, J., Baumgardner, G., Corrigan, M., Cowsert,
J., Harman, T., Jamshidi M., Jones, W., Newcomb D., Prowell, B., Sines,
R., Yeaton, B. (2008). Warm-mix asphalt : European practice.
Washington: Federal Highway Administration.
De Groot, P. C., Bowen, C., Koenders, B. G., Stoker, D. A., Larsen, O., &
Johansen, J. (2001). A comparison of emissions from hot mixture and
warm asphalt mixture production. In International Road Federation World
Meeting. Paris.
Delgadillo, R., & Bahia, H. U. (2008). Effects of Temperature and Pressure on
Hot Mixed Asphalt Compaction: Field and Laboratory Study. Journal of
Materials in Civil Engineering, 20(6), 440-448.
75
Dias, j. F., Picado-Santos, L., & Capitao, S. (2014). Mechanical Performance of
Dry Process Fine Crumb Rubber Asphalt Mixtures Placced on the
Portuguese Road Network. Construction and Building Materials, 73, 247-
254.
Diaz Sanchez, M. (2013). A Study of the Thermal Interactions of Sustainable
Asphalt Concrete Pavements (Doctoral dissertation).
Dickson, P. F., & Corlew, J. S. (1970). Thermal Computations Related to the
Study of Pavement Compaction Cessation Requirements. Association of
Asphalt Paving Technologists Proc., (pp. 377-403).
Evotherm. (2016, July 15). Evotherm® Magic Drop. Retrieved from Youtube:
https://www.youtube.com/watch?v=HGZiNEiZMVA
Fedrigo, W., Nunez, W., Castaneda, L. M., Kleniert, T., & Ceratti, J. (2018). A
Study on the Resilient Modulus of Cement-Treated Mixtures of RAP and
Aggregates Using Indirect Tensile, Triaxial and Flexural Tests.
Construction and Building Materials, 171, 161-169.
Fu , J., Liu, J., Zhang, X., Lei, L., Ma, X., & Liu, Z. (2017). Mesoscale
experimental procedure and finite element analysis for an indirect tensile
test of asphalt concrete. Road Materials and Pavement Design, 1-22.
Gallego, J., Rodriguez-Alloza, A., & Giuliani, F. (2016). Black curves and creep
behaviour of crumb rubber modified binders containing warm mix asphalt
additives. Mechanics of Time-Dependent Materials, 20(3), 389-403.
Gandhi, T. (2008). Effects of Warm Asphalt Additives on Asphalt Binder and
Mixture Properties.
Ghavibazoo, A., & Abdelrahman, M. (2013). Composition analysis of crumb
rubber during interaction with asphalt and effect on properties of binder.
International Journal of Pavement Engineering, 14(5), 517-530.
76
Goh, S. W., & You, Z. (2009). Warm Mix Asphalt Using Sasobit in Cold Region.
In Cold Regions Engineering 2009: Cold Regions Impacts on Research,
Design, and Construction, 288-298.
Hasan, M., Goh, S. W., & You, Z. (2013). Comparative study on the properties of
WMA mixture using foamed. Construction and Building Materials, 48,
45-50.
Heitzman, M. (1992). Design and Construction of Asphalt Paving Design and
Construction of Asphalt. Transportation Research Record.
Hossain, Z., Bhudhala, A., Zaman, M., O'Rear, E., Cross, S., & Lewis, S. (2009).
Evaluation of the use of warm mix asphalt as a viable paving material in
the United States. Federal Highway Administration. DTFH61-06-H-
00044: Task 3.
Huner, M., & Brown, E. (2001). Effects of Re-Heating and Compaction
Temperature on Hot Mix Asphalt Volumetrics. (No. 01-04). NCAT report.
Hurley, G. C., & Prowell, B. D. (2006). Evaluation of Potential Processes for Use
in Warm Mix Asphalt. Journal of the Association of Asphalt Paving
Technologists, 75, 41-90.
Ingevity. (n.d.). Evotherm. Retrieved May 15, 2018, from Ingevity:
http://www.ingevity.com/markets/asphalt-and-paving/evotherm/
Islam, M. R., Faisal, H. M., & Tarefder, R. A. (2015b). Determining temperature
and time dependent Poisson’s ratio of asphalt concrete using indirect
tension test. Fuel, 146, 119-124.
Islam, M., Hossain, M., & Tarefder, R. (2015a). A study of Asphalt Aging Using
Indirect Tensile Strength Test. Construction and Building Materials, 95,
218-223.
Jamshidi, A., Hamzah, M. O., & Aman, M. Y. (2012). Effects of Sasobit®
Content on the Rheological Characteristics of Unaged. Materials
Research, 15(4), 628-638.
77
Jeong, K.-D., Lee, S.-J., Amirkhanian, S., & Kim, K. (2010). Interaction effects of
crumb rubber modified asphalt binders. Construction and Building
Materials, 24(5), 824-831.
Karakas, A. S., Kuloglu, N., Kok, B. V., & Yilmaz, M. (2015). The evaluation of
the field performance of the neat and SBS modified hot mixture asphalt.
Construction and Building Materials, 98, 678–684.
Kim, H. H., & Lee, S.-J. (2015). Effect of crumb rubber on viscosity of rubberized
asphalt binders containing wax additives. Construction and Building
Materials, 95, 65-73.
Kim, H., Jeong, K.-D., Lee, M. S., & Lee, S.-J. (2014). Performance properties of
CRM binders with wax warm additives. Construction and Building
Materials, 66, 356-360.
Larsen, O. R., Moen, Ø., Robertus, C., & Koenders, B. (2004). WAM Foam
Asphalt Production atLower Operating Temperatures as an Environmental
Friendly Alternative to HMA. 3rd Eurasphalt & Eurobitume Congress,
(pp. 641-650). Vienna.
Liu, X., Nie, Z., Wu, S., & Wang, C. (2015). Self-monitoring application of
conductive asphalt concrete under indirect tensile deformation. Case
Studies in Construction Materials, 3, 70-77.
Lusher, S. M. (2017). Cold Temperature Creep Compliance and Strength of
Missouri Hot Mix Asphalt (HMA) Mixtures Using Indirect Tensile Test
(No. cmr17-014). Missouri Department of Transportation.
Modarres, A., & Alinia Bengar, P. (2017). Investigating the indirect tensile
stiffness, toughness and fatigue life of hot mix asphalt containing copper
slag powder. International Journal of Pavement Engineering, 1-9.
Moreno, F., Rubio, M., & Martinez-Echevarria, M. (2011). Analysis of digestion
time and the crumb rubber percentage in dry-process crumb rubber
78
modified hot bituminous mixes. Construction and Building Materials,
25(5), 2323-2334.
Oliveira, J. R., Silva, H. M., Abreu, L. P., & Fernandes, S. R. (2013). Use of a
warm mix asphalt additive to reduce the production temperatures and to
improve the performance of asphalt rubber mixtures. Journal of Cleaner
Production, 41, 15-22.
Ozturk, H. I. (2013). Quantification of Quality of Foamed Warm Mix Asphalt
Binders and Mixtures. Michigan State University.
Ozturk, H. I., & Pamuk, O. C. (2017). Effect of Compaction Temperatures on the
Warm Mix Asphalt Volumetrics and Stability. Bearing Capacity of Roads,
Railways and Airfields (p. 8). Athen: CRC Press.
Ozturk, H., Tascioglu, B., Kutay, M., & Littrup, G. (2012). Impact of Crumb
Rubber Modified Binder Preparation Process on Hot Mix Asphalt
Performance. 5th Eurasphalt & Eurobitume Congress. Istanbul.
Padhan, R. K., Gupta, A., Mohanta, C. S., Badoni, R., & Bhatnagar, A. (2017).
Performance improvement of a crumb rubber modified bitumen using
polyoctenamer and cross linking agent. Road Materials and Pavement
Design, 18(4), 999-1006.
Peng, Y., Wan, L., & Sun, L. (2017). Three-Dimensional Discrete Element
Modelling of Influence Factors of Indirect Tensile Strength of Asphalt
Mixtures. International Journal of Pavement Engineering, 1-10.
PQCorporation. (2015, April). Safety Data Sheet. Retrieved may 18, 2018, from
www.pqcorp.com: https://www.pqcorp.com/docs/default-source/msds/pq-
corporation/zeolites/advera/advera-
wma_msds_2015.pdf?sfvrsn=94bbfd91_3
Prowell, B. (2007). Warm mix asphalt, the international technology scanning
program summary report. American Trade Initiatives, US.
79
Prowell, B. D., Hurley, G. C., & Frank, B. (2011). Warm-Mix Asphalt:Best
Practices. Lanham, MD: National Asphalt Pavement Association.
Prowell, B., Schreck, R., & Sasaki, S. (2011). Evaluation of Compaction Benefits
of Foamed Asphalt Mixtures at Varying Production Temperatures. 2nd
International Warm-Mix Conference, (pp. 11-13).
Qin, Q., Farrar, M., Turner, T. F., & Planche, J.-P. (2015). Characterization of the
Effects of Wax (Sasobit®) on Asphalt Binder. Western Research Institute.
Laramie: Federal Highway Administration.
Rahman, M. (2004). Characterisation of dry process crumb rubber modified
asphalt mixtures. (Doctoral dissertation, University of Nottingham).
Rahman, M., Airey, G., & Collop, A. (2005). The mechanical properties of the
dry process CRM asphalt mixtures following short-term and long-term
ageing. 7th International Conference on the Bearing Capacity of Roads
and Airfields. Tondheim, Norway.
Rahman, M., Airey, G., & Collop, A. (2010). Moisture susceptibility of high and
low compaction dry process crumb rubber-modified asphalt mixtures.
Transportation Research Record: Journal of the Transportation Research
Board(2180), 121-129.
Richardson, D. N., & Lusher, S. M. (2008). Determination of Creep Compliance
and Tensile Strength of Hot-Mix Asphalt for Wearing Courses in Missouri.
RMA. (2016, August). 2015 U.S. Scrap Tire Management Summary. Retrieved
March 10, 2018, from U.S. Tire Manufacturers Association.
Roberts, F. L., Kandhal, P. S., Brown, E. R., Lee, D., & Kennedy, T. W. (1996).
Hot Mix Asphalt Materials, Mixture Design and Construction. Second
Edition.
Roberts, F., Kandhal, P., Brown, E., Lee, D., & Kennedy, T. (1991). Hot mix
asphalt materials, mixture design and construction.
80
Rodríguez-Alloza, A., Gallego, J., Pérez, I., Bonati, A., & Giuliani, F. (2014).
High and low temperature properties of crumb rubber modified binders
containing warm mix asphalt additives. Construction and Building
Materials, 53, 460-466.
Sanchez, M. D., & Timm, D. H. (2014). Influence of Sustainable Recycled
Asphalt Technologies on Pavement Construction Cooling Predictions.
Transportation Research Board, 2408(1), 60-77.
Santucci, L. (2009, September). Rubber roads: waste tires find a home. Pavement
Technology Update, 1(2).
SasolPerformanceChemicals. (2016, February). Low Temperature Behaviour.
Retrieved May 18, 2018, from www.sasobit.com:
www.sasobit.com/files/downloads/en/sasobit/LowTemperatureBehaviour_
en.pdf
SasolPerformanceChemicals. (n.d.). ProductInformation_en. Retrieved May 19,
2018, from www.sasobit.com:
www.sasobit.com/files/downloads/en/sasobit/ProductInformation_en.pdf
Scherocman, J. A. (2000, December 28). Compacting Hot-Mix Asphalt
Pavements: Part I. Retrieved June 10, 2018, from Roads&Bridges:
https://www.roadsbridges.com/compacting-hot-mix-asphalt-pavements-
part-i
Sebaaly, P., Gopal, V., & Epps, J. (2003). Low Temperature Properties of Crumb
Rubber Modified Binders. Road Materials and Pavement Design, 4(1), 29-
49.
Shaw, J. (2007). Sasobit- Sasol Wax Americas. WMA technical Working Group
Meeting. Hunt Valley, MD.
Sheth , N. M. (2010). Evaluation of Selected Warm Mix Asphalt Additives.
81
Šimun, M., & Halle, M. (2014). Indirect Tensile Test of Asphalt Mixture Stiffness
Modulus. In Proceedings of the International Conference on Road and
Rail Infrastructure CETRA.
Song, J., & Ahmed, S. (2017). Comparing Cooling of Hot Mix and Warm Mix
Asphalts. 53rd ASC Annual International Conference. Seattle: ASC.
Subhy, A., Presti, D., & Airey, G. (2017). An investigation of the mechanical
properties of rubber modified asphalt mixtures using a modified dry
process. Bearing Capacity of Roads, Railways and Airfields. Athens,
Greece: CRC Press.
Texas. Department of Transportation. (2014). Standard Specifications for
Construction and Maintenance of Highways, Streets, and Bridges:
Adopted by the Texas Department of Transportation, November 1, 2014.
Texas Department of Transportation.
TheHubbardGroup. (n.d.). ASPHA–MIN WMA. Retrieved May 18, 2018, from
http://www.warmmixasphalt.org/submissions/43_20071227_Bob%20Bist
or%20-%20FHWA%20ASPHA%20%E2%80%93%20MIN.ppt
Timm, D. H., Voller, V. R., Lee, E. B., & Harvey, J. (2001). Calcool: A Multi-
Layer Asphalt Pavement Cooling Tool For Temperature Prediction During
Construction. International Journal of Pavement Engineering, 2(3), 169-
185.
Transportation Department the City of Calgary. (2012). Roads Construction 2012
Standard Specifications. Calgary: Transportation Department the City of
Calgary, Roads Construction Division.
Vargas-Nordcbeck, A., & Timm, D. H. (2011). Validation of Cooling Curves
Prediction Model for Nonconventional Asphalt Concrete Mixtures.
Transportation Research Board: Journal of the Transportation Research
Board(2228), 111-119.
82
Wang, H., Dang, Z., You, Z., & Cao, D. (2012). Effect of warm mixture asphalt
(WMA) additives on high failure temperature properties for crumb rubber
modified (CRM) binders. Construction and Building Materials, 35, 281-
288.
Wang, H., Zhang, C., Li, L., You, Z., & Diab, A. (2016). Characterization of Low
Temperature Crack Resistance of Crumb Rubber Modified Asphalt
Mixtures Using Semi-Circular Bending Tests. Journal of Testing and
Evaluation, 44(2), 847-855.
West, R., Rodezno, C., Julian, G., Prowell, B., Frank, B., Osbord, L. V., &
Kriech, T. (2014). Engineering Properties and Field Performance of
Warm Mix Asphalt Technologies. Washington, DC: National Cooperative
Highway Research Program, NCHRP Report 779.
White, T. D. (1985). Marshall procedures for design and quality control of asphalt
mixtures. In Association of asphalt paving technologists proc, 54.
Wright Asphalt Products Co. (2008). Tire Rubber Modified Asphalt. Retrieved
June 10, 2018, from
www.asphaltroads.org/assets/_control/content/files/tire-rubber-modified-
asphalt.pdf
Xiao, F., Punith, V., & Amirkhanian, S. N. (2012). Effects of non-foaming WMA
additives on asphalt binders at high performance temperatures. Fuel, 94,
144-155.
Yin, F., Garita, J., Taylor, A., & West, R. (2018). Refining the indirect tensile
(IDT) Nflex Factor test to evaluate cracking resistance of asphalt mixtures
for mix design and quality assurance. Construction and Building
Materials, 172, 396-405.
Yin, F., West, R., Xie, Z., Taylor, A., & Julian, G. (2017). Effects of Loading Rate
and Mix Reheating on Indirect Tensile Nflex Factor and Semi-Circular
Bend J-Integral Test Results to Assess the Cracking Resistance of Asphalt
Mixtures (No. NCAT Report 17-09).
83
Yin, H. (2009). Investigation of Rheological Behavior of Asphalt Binder Modified
by the ADVERA Additive. Region II University Transportation Research
Center.
Yu, H., Leng, Z., Xiao, F., & Gao Zheming. (2016). Rheological and chemical
characteristics of rubberized binders with non-foaming warm mix
additives. Construction and Building Materials, 111, 671-678.
Yu, M., Wu, G., Zhou, J., & Easa, S. (2014). Proposed compaction procedure for
dry process crumb rubber modified asphalt mixtures using air void content
and expansion ratio. Journal of Testing and Evaluation, 42(2), 328-338.
Zhang, D., Hou, S., Bian, J., & He, L. (2016). Investigation of the micro-cracking
behavior of asphalt mixtures in the indirect tensile test. Engineering
Fracture Mechanics, 163, 416-425.
Zhang, J., Liu, G., Xu Li, & Peo, J. (2015). Effecta of WMA Additive on the
Rheological Properties of Asphalt Binder and High Temperature
Performance Grade. Advances in Materials Science and Engineering.
Zhao, X., Yan, K., Yang, S., & Peng, H. (2018). Laboratory Research on the
Properties of Warm Amorphous Poly Alpha Olefin–Modified Asphalt
Mixture Using Sasobit and Deurex. Journal of Materials in Civil
Engineering, 30(5).
Ziari, H., Naghavi, M., & Imaninasab, R. (2016). Performance evaluation of
rubberised asphalt mixes containing WMA additives. International
Journal of Pavement Engineering, 19(7), 623-629.

84
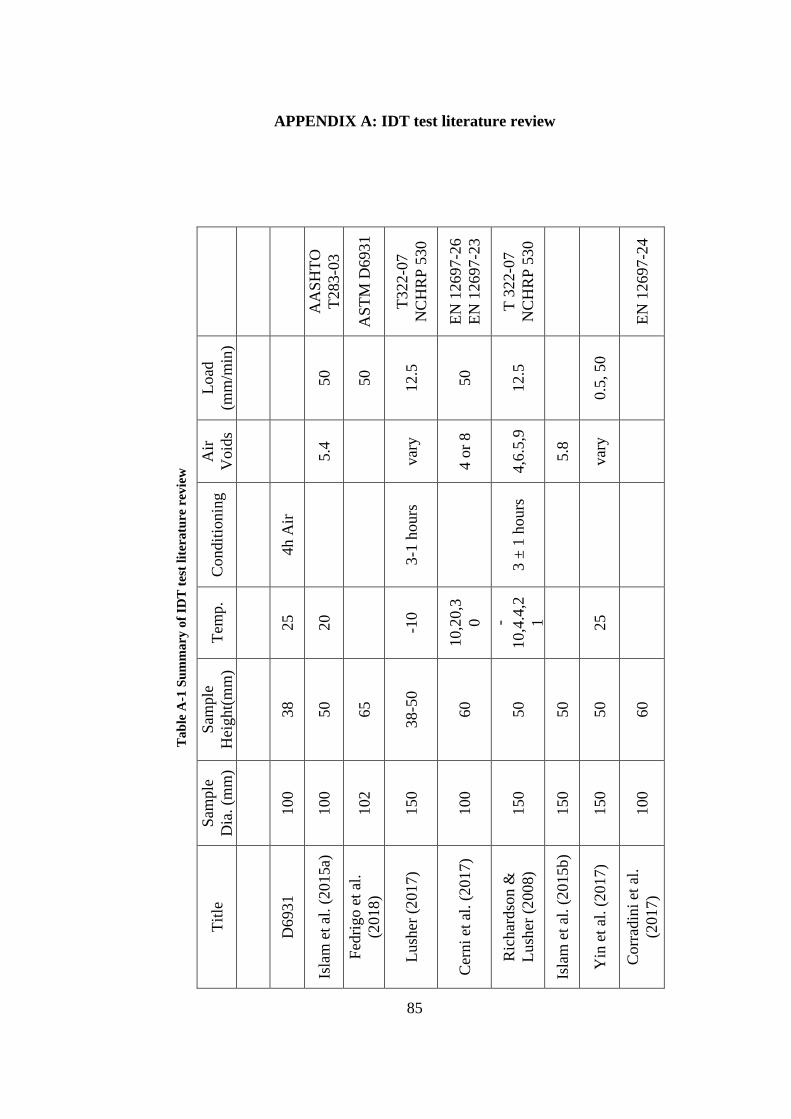
85
APPENDIX A: IDT test literature review
Ta
ble
A-1
Su
mm
ary
of
IDT
tes
t li
tera
ture
rev
iew
AA
SH
TO
T283-0
3
AS
TM
D6931
T322-0
7
NC
HR
P 5
30
EN
1269
7-2
6
EN
12697
-23
T 3
22-0
7
NC
HR
P 5
30
EN
12697
-24
Load
(mm
/min
)
50
50
12.5
50
12.5
0.5
, 50
Air
Void
s
5.4
var
y
4 o
r 8
4,6
.5,9
5.8
var
y
Condit
ionin
g
4h A
ir
3-1
hours
3 ±
1 h
ours
Tem
p.
25
20
-10
10,2
0,3
0 -
10,4
.4,2
1
25
Sam
ple
Hei
ght(
mm
)
38
50
65
38-5
0
60
50
50
50
60
Sam
ple
Dia
. (m
m)
100
100
102
150
100
150
150
150
100
Tit
le
D6931
Isla
m e
t al
. (2
015a)
Fed
rigo e
t al
.
(2018)
Lush
er (
2017)
Cer
ni
et a
l. (
2017)
Ric
har
dso
n &
Lush
er (
2008)
Isla
m e
t al
. (2
015b)
Yin
et
al. (2
017)
Corr
adin
i et
al.
(2017)
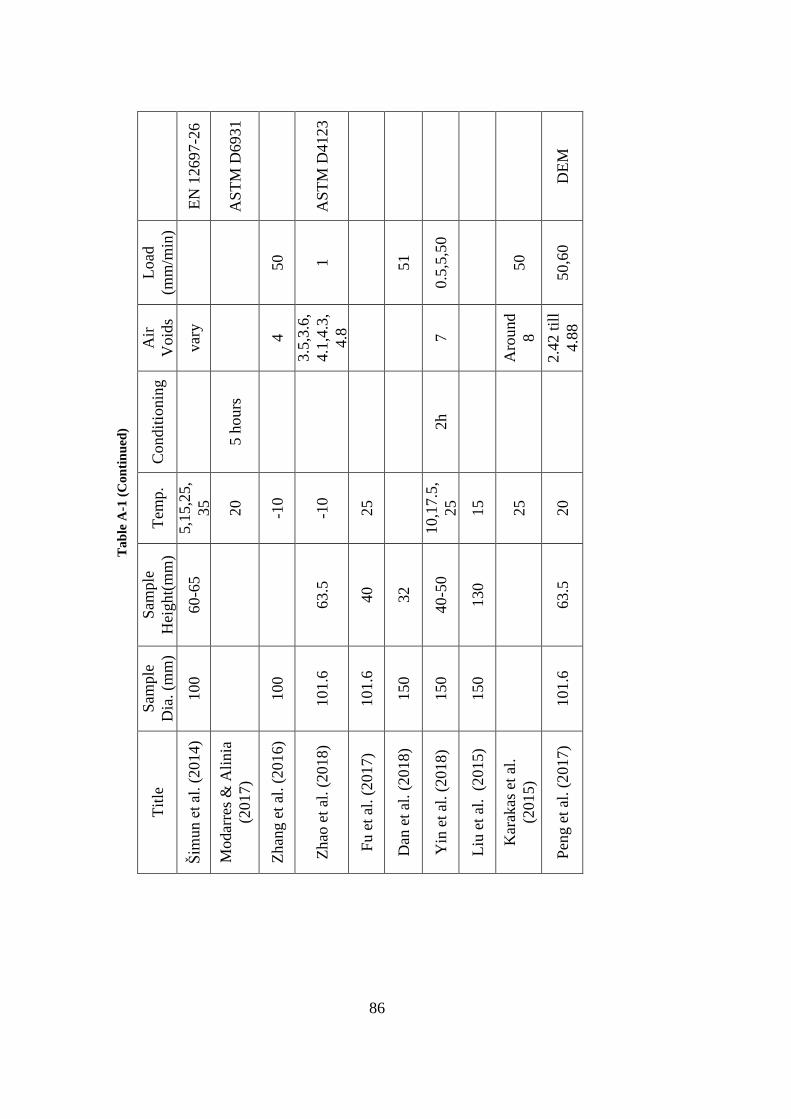
86
Ta
ble
A-1
(C
on
tin
ued
)
EN
12697
-26
AS
TM
D6931
AS
TM
D4123
DE
M
Load
(mm
/min
)
50
1
51
0.5
,5,5
0
50
50,6
0
Air
Void
s
var
y
4
3.5
,3.6
,
4.1
,4.3
,
4.8
7
Aro
und
8
2.4
2 t
ill
4.8
8
Cond
itio
nin
g
5 h
ours
2h
Tem
p.
5,1
5,2
5,
35
20
-10
-10
25
10,1
7.5
,
25
15
25
20
Sam
ple
Hei
ght(
mm
)
60-6
5
63.5
40
32
40-5
0
130
63.5
Sam
ple
Dia
. (m
m)
100
100
101.6
101.6
150
150
150
101.6
Tit
le
Šim
un e
t al
. (2
014)
Modar
res
& A
lin
ia
(2017)
Zhan
g e
t al
. (2
016)
Zhao
et
al. (2
018)
Fu e
t al
. (2
017)
Dan
et
al. (2
018)
Yin
et
al. (2
018)
Liu
et
al. (
2015)
Kar
akas
et
al.
(2015)
Pen
g e
t al
. (2
017)
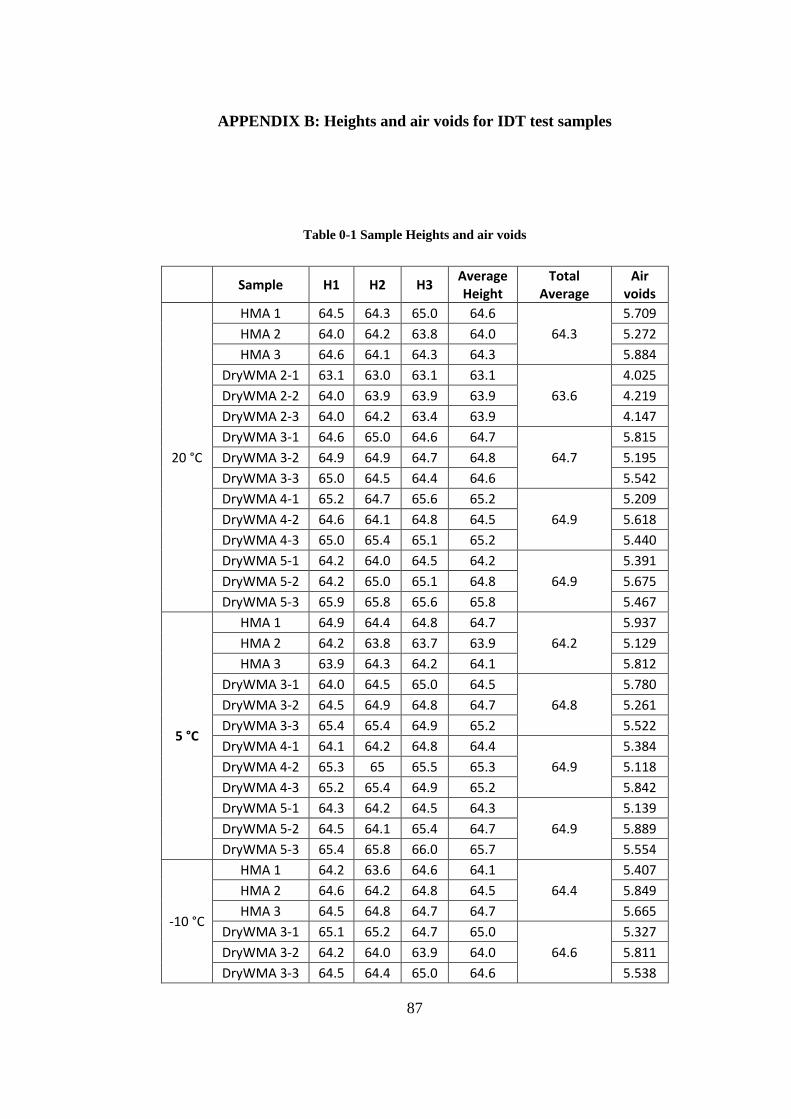
87
APPENDIX B: Heights and air voids for IDT test samples
Table 0-1 Sample Heights and air voids
Sample H1 H2 H3
Average Height
Total Average
Air voids
20 °C
HMA 1 64.5 64.3 65.0 64.6
64.3
5.709
HMA 2 64.0 64.2 63.8 64.0 5.272
HMA 3 64.6 64.1 64.3 64.3 5.884
DryWMA 2-1 63.1 63.0 63.1 63.1
63.6
4.025
DryWMA 2-2 64.0 63.9 63.9 63.9 4.219
DryWMA 2-3 64.0 64.2 63.4 63.9 4.147
DryWMA 3-1 64.6 65.0 64.6 64.7
64.7
5.815
DryWMA 3-2 64.9 64.9 64.7 64.8 5.195
DryWMA 3-3 65.0 64.5 64.4 64.6 5.542
DryWMA 4-1 65.2 64.7 65.6 65.2
64.9
5.209
DryWMA 4-2 64.6 64.1 64.8 64.5 5.618
DryWMA 4-3 65.0 65.4 65.1 65.2 5.440
DryWMA 5-1 64.2 64.0 64.5 64.2
64.9
5.391
DryWMA 5-2 64.2 65.0 65.1 64.8 5.675
DryWMA 5-3 65.9 65.8 65.6 65.8 5.467
5 °C
HMA 1 64.9 64.4 64.8 64.7
64.2
5.937
HMA 2 64.2 63.8 63.7 63.9 5.129
HMA 3 63.9 64.3 64.2 64.1 5.812
DryWMA 3-1 64.0 64.5 65.0 64.5
64.8
5.780
DryWMA 3-2 64.5 64.9 64.8 64.7 5.261
DryWMA 3-3 65.4 65.4 64.9 65.2 5.522
DryWMA 4-1 64.1 64.2 64.8 64.4
64.9
5.384
DryWMA 4-2 65.3 65 65.5 65.3 5.118
DryWMA 4-3 65.2 65.4 64.9 65.2 5.842
DryWMA 5-1 64.3 64.2 64.5 64.3
64.9
5.139
DryWMA 5-2 64.5 64.1 65.4 64.7 5.889
DryWMA 5-3 65.4 65.8 66.0 65.7 5.554
-10 °C
HMA 1 64.2 63.6 64.6 64.1
64.4
5.407
HMA 2 64.6 64.2 64.8 64.5 5.849
HMA 3 64.5 64.8 64.7 64.7 5.665
DryWMA 3-1 65.1 65.2 64.7 65.0
64.6
5.327
DryWMA 3-2 64.2 64.0 63.9 64.0 5.811
DryWMA 3-3 64.5 64.4 65.0 64.6 5.538

88
Table B-1 (continued)
Sample H1 H2 H3 Average Height
Total Average
Air voids Sample
-10 °C
DryWMA 4-1 64.8 65.4 65.2 65.1
65.1
5.447
DryWMA 4-2 64.9 65.1 65.3 65.1 5.374
DryWMA 4-3 65.3 65.6 64.6 65.2 5.575
DryWMA 5-1 64.5 64.3 64.5 64.4
65.2
5.501
DryWMA 5-2 65.7 64.8 65.3 65.3 5.710
DryWMA 5-3 65.9 65.8 65.6 65.8 5.363