digital consumers of tomorrow , here today
TRANSCRIPT

Digital Consumers of Tomorrow, Here TodayA SYNC SOUTHEAST ASIA REPORT

Table of contents
Five years of digital transformation in a single year 7
The digital consumer of tomorrow is here 19
Steering the future 41
How consumers discoverNew norms = new purchasing habitsThe 6 types of digital consumers
22 3037
How can brands adaptThe age of enablers
5156

Introduction
SYNC Southeast Asia
Southeast Asia digital consumer trends that shape the next normal
How have recent events spurred changes for digital consumers and which trends have accelerated or reversed vs last year?
3
R E A D T H E R E P O R T
How Southeast Asia’s emerging middle class is embracing the digital world of tomorrow.
2018
2019
2020
What the new consumer habits and digital journeys are for the fastest growing population in five Southeast Asian countries, and what this means for brands.
R E A D T H E R E P O R T
Riding the digital wave: Southeast Asia’s digital consumer in the Discovery Generation
What the spending behaviours of Southeast Asia’s online shoppers are, the challenges brands face in reaching them and the opportunities that lay ahead.
R E A D T H E R E P O R T
A thought-leadership series about keeping in tune with the consumers of tomorrow. Through this series, Facebook and Bain & Company take business leaders deeper into the emerging trends and rising opportunities shaping the vibrant region.
Introduction
Forward, faster
Our 2019 study Riding the Digital Wave introduced us to the new type of Southeast Asian consumer: The digital consumer who purchases goods or services online at least once a year, and a Discovery Generation whose purchasing habits are largely driven by inspiration and openness to digital discovery. We examined their rapid rise, their spending patterns, and what their emergence means for many brands.
Come 2020, the move from an offline to an online economy has taken off much faster than anyone expected. Change that was supposed to take place over a few years happened in one. Many of the trends we forecast took place, but at an accelerated (and exhilarating!) pace, which means more digital consumers with higher online spending across a broader set of categories.
As we entered a new decade, we spoke to these digital consumers again and asked how 2020 has shaped and continues to shape them. This is their story.
4

Introduction 5
Top 10 insights
Five years of digital transformation in a single year
Southeast Asia’s online retail penetration surpasses India’s
1
3
By the end of 2020, the number of digital consumers in Southeast Asia would reach 310 million, a number we previously forecast will be reached only by 2025. This means almost 70% of Southeast Asian consumers will go digital by the end of 2020. Southeast Asia’s online retail market penetration has also now surpassed India’s, increasing 1.6x to reach 5%.
Southeast Asia’s online retail market now accounts for 5% of its total (including offline), higher than India’s 4%. Its ecommerce gross merchandise value grew 23% per year from 2018 to 2020, faster than the compounded annual growth rate of China’s, India’s, and the United States’ GMV during the same period.
More categories now purchased online, especially groceries
Online retail penetration expands for all categories, while that of groceries nearly triple
2
4
Southeast Asian consumers aren’t just spending more online as we forecast in 2019, they’re also buying into more categories. In 2020, consumers are going online to buy an average of 5.1 categories — an increase of 40% in just one year. People are also now more receptive to grocery shopping online: 43% of respondents said they now shop online for packaged groceries.
Each category we looked at — be it consumer electronics and accessories; clothing, footwear and accessories; personal care and beauty; household, appliances and furnishings — saw at least a 1.4x increase in online retail penetration from 2019 to 2020. But the highest growth came from groceries, which achieved a 2.7x growth in online retail penetration as more people shopped online.

Introduction 6
Social media, video, and messaging are crowd favourites for Discovery Commerce
Reliability and value keep customers returning
Promoters make a difference: They spend ~2x more than Detractors
5
7
9
Social media, short videos, and messaging together are people’s most preferred online channels for discovering new brands and products, with 62% of consumers citing them as top channels for online discovery. Social media is also the top channel for discovering and viewing short and medium-length videos: Among those surveyed, 63% find new short videos primarily through social media, while 54% discover medium-length videos through this platform.
In the 6 Southeast Asian countries we surveyed, reliability and value are the top 2 reasons cited for switching brands. They were also the top factors cited for switching between most frequently used websites: 42% said they switched due to better pricing, while 34% cited better product quality.
Good value and reliability help retain Promoters.Businesses who want to keep Detractors at bay can benefit by addressing reliability issues such as lack of availability, mismatched product expectations, and poor quality control.
More openness towards switching brands
Spending gap between Tier 1 and 2 cities is closing
Disruptors are coming in full force with tech-enabled payments
6
8
10
Openness to different brands is a trait shared by many Southeast Asians: On average, 54% say they changed their most-purchased brand in the three months prior to the study. More customers switching brands means businesses will have to be more innovative to retain loyalty.
In Southeast Asia as a whole, high spenders now make up at least 52% of consumers in both Tier 1 and Tier 2 cities, the study found. The population of high spenders also saw a sharp rise this year in both locations.
Southeast Asian-based funds hit a record of US$8.7 billion in unspent capital at the end of 2019. This opens doors for internet and technology disruptors to secure more funding, grow profitably, and challenge the position of large brands.
Five years of digital transformation in a single year
7

Five years of digital transformation in a single year
Digital consumer adoption has exceeded 2025 forecasts
2020 is a pivotal year. Social distancing has paved the way to the home-centric lifestyles as well as commerce with minimal physical contact. This meant extensive economic disruption as there were fewer opportunities for people to leave home to spend, shop, travel, work, or even carry out essential tasks. For many businesses, the only way to secure their future was to establish a robust digital presence.
This disruption has inadvertently accelerated the growth of Southeast Asia’s digital economy. In 2019, Bain & Company projected that the number of digital consumers — anyone who has purchased a product or service online (excluding travel) in the past 12 months — in Southeast Asia will reach around 310 million by 2025.1
1 Data compiled and modelled from: Forrester ForecastView, Forrester Analytics: Online Retail Forecast, 2019 to 2024 (Asia-Pacific, China, India, Southeast Asia, USA) by Forrester Research. Passport: Economies and Consumers Annual Data 2018 to 2025, by Euromonitor. Digital 2019 (Indonesia, Malaysia, the Philippines, Singapore, Thailand, and Vietnam) by Hootsuite, Jan 2019. Riding the Digital Wave: Capturing Southeast Asia’s Digital Consumer in the Discovery Generation” by Bain & Company (Facebook-commissioned survey of 12,965 respondents from ID, MY, PH, SG, TH, VN), Jun 2019.
That day arrived much sooner than anticipated: Southeast Asia is projected to reach this figure by the end of 2020, with millions more expected to join in the coming years.1 By the end of 2020, 310 million digital consumers will make up 69% of Southeast Asia’s population that are 15 years old and older.
From 2018 to 2020, the number of digital consumers increased by around 60 million, a compounded annual growth rate of 12%. Almost 70% of the 443 million people in Indonesia, Malaysia, the Philippines, Singapore, Thailand, and Vietnam are now digital consumers.1 This growth was achieved as more non-internet users gained access to a smartphone or web-connected computer.
8

9Five years of digital transformation in a single year
Digital consumer growth surpasses expectations
Almost 7 in 10 Southeast Asian consumers will go digital by end 2020
Number of digital consumers Total SEA-6 Population
% of population
1.4X
64% 69%
2018 2018
Have purchased online
Not online users
Have Internet access but not purchased online
2019 20192020F 2020F2025F
Estimates from: Forrester ForecastView, Forrester Analytics: Online Retail Forecast, 2019 to 2024 (Asia-Pacific, China, India, Southeast Asia, USA) by Forrester Research. Passport: Economies and Consumers Annual Data 2018 to 2025, by Euromonitor. Digital 2019 (Indonesia, Malaysia, the Philippines, Singapore, Thailand, and Vietnam) by Hootsuite, Jan 2019. Riding the Digital Wave: Capturing Southeast Asia’s Digital Consumer in the Discovery Generation” by Bain & Company (Facebook-commissioned survey of 12,965 respondents from ID, MY, PH, SG, TH, VN), Jun 2019.
250M 280M 310M
431M
250M
280M
310M
340M
310M
437M 443M
57%
2025 (previous forecast)

Five years of digital transformation in a single year
~60 millionincrease in digital consumers from 2018 to 20202
~$85 billiontotal value of digital payments in Southeast Asia (2020)2
96%accessed the internet on their smartphone2
308 millionPeople in Southeast Asia accessed Facebook every day as of Q1 20203
2 Data compiled and modelled from: Forrester ForecastView, Forrester Analytics: Online Retail Forecast, 2019 to 2024 (Asia-Pacific, China, India, Southeast Asia, USA) by Forrester Research. Passport: Economies and Consumers Annual Data 2018 to 2025, by Euromonitor. Digital 2019 (Indonesia, Malaysia, the Philippines, Singapore, Thailand, and Vietnam) by Hootsuite, Jan 2019. Riding the Digital Wave: Capturing Southeast Asia’s Digital Consumer in the Discovery Generation” by Bain & Company (Facebook-commissioned survey of 12,965 respondents from ID, MY, PH, SG, TH, VN), Jun 2019.
3 Facebook internal data, Q2 2020
10

Five years of digital transformation in a single year
In every country, more offline shoppers are moving online
The continued rise of the digital consumer is apparent even when we look at individual Southeast Asian countries. Millions of offline shoppers became internet users and, eventually, digital consumers, across all the countries we looked at.
Among all the Southeast Asian countries, however, Indonesia’s digital consumer population growth outpaces its counterparts. Where growth in neighbouring countries averaged 5% to 9%, Indonesia’s digital consumer population rose 15% in 2020. Indonesia now has 137 million digital consumers, which represents 68% of its estimated total population who are 15 years old and above.4
Overall, Malaysia, Singapore, and the Philippines are still the countries with the highest percentage of digital consumers, with 83%, 79%, and 74% of its population (that are 15 years old and above), respectively, counted as digital consumers.4
ID
203M
PH
77M
VN
75M
TH
58M
MY
25M
SG
5M
119M(58%)
52M(68%)
46M(61%)
37M(63%)
20M(80%)
137M(68%)
57M(74%)
49M(65%)
39M(68%)
21M83%
4M(79%)
3.7M(74%)
Total SEA-6 population – 443M
4 Data compiled and modelled from: Forrester ForecastView, Forrester Analytics: Online Retail Forecast, 2019 to 2024 (Asia-Pacific, China, India, Southeast Asia, USA) by Forrester Research. Passport: Economies and Consumers Annual Data 2018 to 2025, by Euromonitor. Digital 2019 (Indonesia, Malaysia, the Philippines, Singapore, Thailand, and Vietnam) by Hootsuite, Jan 2019. Riding the Digital Wave: Capturing Southeast Asia’s Digital Consumer in the Discovery Generation” by Bain & Company (Facebook-commissioned survey of 12,965 respondents from ID, MY, PH, SG, TH, VN), Jun 2019.
11
Digital consumer population in 2019
Non-digital consumer population
Digital consumer population in 2020

12
Across Southeast Asia, preference to buy from online channels has seen a leap
41%of consumers switched to purchase mostly online in the past year
Five years of digital transformation in a single year
Source: “Digital Consumers of Tomorrow, Here Today” by Facebook and Bain & Company. (A Facebook-commissioned survey of 16,491 respondents from ID, MY, PH, SG, TH, VN. Survey data only includes digital consumers who are defined as: Respondents who selected 2 or more online retail categories: Consumer electronics and accessories; household appliances and furnishings; clothing, footwear, and accessories; personal care and beauty; toys and baby care; groceries and food delivery.) Data analysed by Bain & Company. Survey conducted May 2020.
30
44
SEA
Increased adoption of online as channel for shopping across markets% responses citing online as most used channel
Online (2019) Online (2020)
25
48
MY
1.9X
28
46
ID
1.6X
32
46
VN
1.4X
28
45
SG
1.6X
33
45
TH
1.3X
28
35
PH
1.3X1.5X

Five years of digital transformation in a single year
Online spending outperforms, to triple by 2025 to US$147bGross merchandise value (GMV) refers to the monetary value of goods or services sold through online marketplaces over a specific period of time. In Southeast Asia, the GMV is projected to outperform our 2019 forecast, both in average GMV per digital consumer and total GMV, despite economic disruptions.
By 2025, the digital consumer will spend, on average, 3.5x more than they did in 2018. This is higher than the 3.2x increase we forecast in 2019. At the same time, the total GMV across Southeast Asia as a region will see close to 3x growth, from US$53 billion by the end of 2020 to US$147 billion by 2025.5
By the end of 2020, the average GMV in Southeast Asia is forecast to be US$172 per person.
5 Data compiled and modelled from: Forrester ForecastView, Forrester Analytics: Online Retail Forecast, 2019 to 2024 (Asia-Pacific, China, India, Southeast Asia, USA) by Forrester Research. Passport: Economies and Consumers Annual Data 2018 to 2025, by Euromonitor. Digital 2019 (Indonesia, Malaysia, the Philippines, Singapore, Thailand, and Vietnam) by Hootsuite, Jan 2019. Riding the Digital Wave: Capturing Southeast Asia’s Digital Consumer in the Discovery Generation” by Bain & Company (Facebook-commissioned survey of 12,965 respondents from ID, MY, PH, SG, TH, VN), Jun 2019.
Industry-wide spending growth for 2020 also outpaces forecast made in 2019Online retail GMV (US $)
2.8X
2X 2.5X
3.7X
SEA
$26b
$72b
$48b
$4b $4b$9b $10b$9b $9b
ID MY PH VN
$7b
$25b $24b
13
2020F 2025F 2025F (previous forecast)
2.8X
$53b
$147b
$120b
Average digital spending per person to grow 3.5x by 2025Average spend per digital consumer (US$)
3.5X
2018 2019 2020F 2025F 2025(previous forecast)
$124$172
$429$392
$135
3X
TH
$7b
$22b $21b1.8X
$4b $8b $8b
SG
13
Average spend per digital consumer (US$)

Five years of digital transformation in a single year
Southeast Asia’s online retail market surpasses India’s
In 2019, we reported that Southeast Asia’s online retail penetration stood at 3%, on parity with India’s.6 Since then, the region’s online retail penetration has surpassed the South Asian country, increasing 1.6x to 5%. Its ecommerce GMV also grew 23% per year from 2018 to 2020, faster than the compounded annual growth rate of China’s, India’s, and the United States’ GMV during the same period.7
Southeast Asia also has a higher percentage of internet users who are online consumers — 79% — surpassing India’s 20% and roughly on a par with the US’ 75%.
In terms of overall retail penetration, China and the United States continue to lead the way. China has an online penetration rate that is 6x greater than Southeast Asia’s at 31%, while the United States’ is about 3x greater at 17%.7 Together, both countries show what’s possible for Southeast Asia’s online retail market for brands that respond to the opportunity.
6 Riding the Digital Wave: Capturing Southeast Asia’s Digital Consumer in the Discovery Generation” by Bain & Company (Facebook-commissioned survey of 12,965 respondents from ID, MY, PH, SG, TH, VN), Jun 2019.
7 Data compiled and modelled from: Forrester ForecastView, Forrester Analytics: Online Retail Forecast, 2019 to 2024 (Asia-Pacific, China, India, Southeast Asia, USA) by Forrester Research. Passport: Economies and Consumers Annual Data 2018 to 2025, by Euromonitor. Digital 2019 (Indonesia, Malaysia, the Philippines, Singapore, Thailand, and Vietnam) by Hootsuite, Jan 2019. Riding the Digital Wave: Capturing Southeast Asia’s Digital Consumer in the Discovery Generation” by Bain & Company (Facebook-commissioned survey of 12,965 respondents from ID, MY, PH, SG, TH, VN), Jun 2019.
Contribution of online retail to total retail
Southeast Asia’s ecommerce GMV grew 23% annually from 2018 to 2020
14
5%SEA
4%India
31%China

Every category we looked at — be it consumer electronics and accessories; clothing, footwear and accessories; personal care and beauty; household, appliances and furnishings — saw at least a 1.4x increase in online retail penetration from 2019 to 2020.
But the most dramatic growth came from groceries, which achieved a 2.7x growth in online retail penetration as more people became more receptive to buying them online.
Five years of digital transformation in a single year
Data compiled and modelled from: Forrester ForecastView, Forrester Analytics: Online Retail Forecast, 2019 to 2024 (Asia-Pacific, China, India, Southeast Asia, USA) by Forrester Research. Passport: Economies and Consumers Annual Data 2018 to 2025, by Euromonitor. Digital 2019 (Indonesia, Malaysia, the Philippines, Singapore, Thailand, and Vietnam) by Hootsuite, Jan 2019. Riding the Digital Wave: Capturing Southeast Asia’s Digital Consumer in the Discovery Generation” by Bain & Company (Facebook-commissioned survey of 12,965 respondents from ID, MY, PH, SG, TH, VN), Jun 2019.
15
Consumer electronics and accessories
Clothing, footwear and accessories
Personal care and beauty
Household appliances and furnishings
Groceries
29%
15%
10%
9% 7% 8%0.3%
19%
34%
7% 8% 8%
13%
84%
71%
50%
35%
7%
0.4%0.8%
1.5X
1.6X 1.6X1.4X
2.7X
$31B $42B $16B $26B $376B
Total retail spend (online and offline)
Expected SEA-6 CAGR (20-25F)
22% 26% 25% 19% 32%
SEA 2020F India 2020F
SEA 2018 China 2020F
% Online penetration
Online adoption increases across categories, but that of groceries nearly triple

Five years of digital transformation in a single year
Southeast Asian consumers are buying more categories online
Southeast Asian consumers aren’t just spending more online, they’re also buying into more categories — clothing, electronics, household appliances, groceries, toys, to name a few.
In 2019, each Southeast Asian digital consumer went online to purchase an average of 3.7 categories. In 2020, that number has grown to 5.1 — an increase of 40% in just one year.8
The growth is relatively consistent across each country but even more stark for Thailand, which saw an increase of 70% from 2019.8 This growth presents an opportunity for a diverse range of companies to participate in the digital economy as consumers open up to a wider range of goods and services online.8
16
2019 2020
Average number of categories purchased online
8 Data compiled and modelled from: Forrester ForecastView, Forrester Analytics: Online Retail Forecast, 2019 to 2024 (Asia-Pacific, China, India, Southeast Asia, USA) by Forrester Research. Passport: Economies and Consumers Annual Data 2018 to 2025, by Euromonitor. Digital 2019 (Indonesia, Malaysia, the Philippines, Singapore, Thailand, and Vietnam) by Hootsuite, Jan 2019. Riding the Digital Wave: Capturing Southeast Asia’s Digital Consumer in the Discovery Generation” by Bain & Company (Facebook-commissioned survey of 12,965 respondents from ID, MY, PH, SG, TH, VN), Jun 2019.
1.4Xaverage growth in number of categories purchased online per user
SEA
3.7
5.1
ID PHVNTH MY SG
3.2
5.4
3.9
5.2
3.6
5.1
3.8
5
3.8
5
3.7
4.7
1.4X 1.7X 1.3X 1.4X 1.3X 1.3X1.3X
Five years of digital transformation in a single year
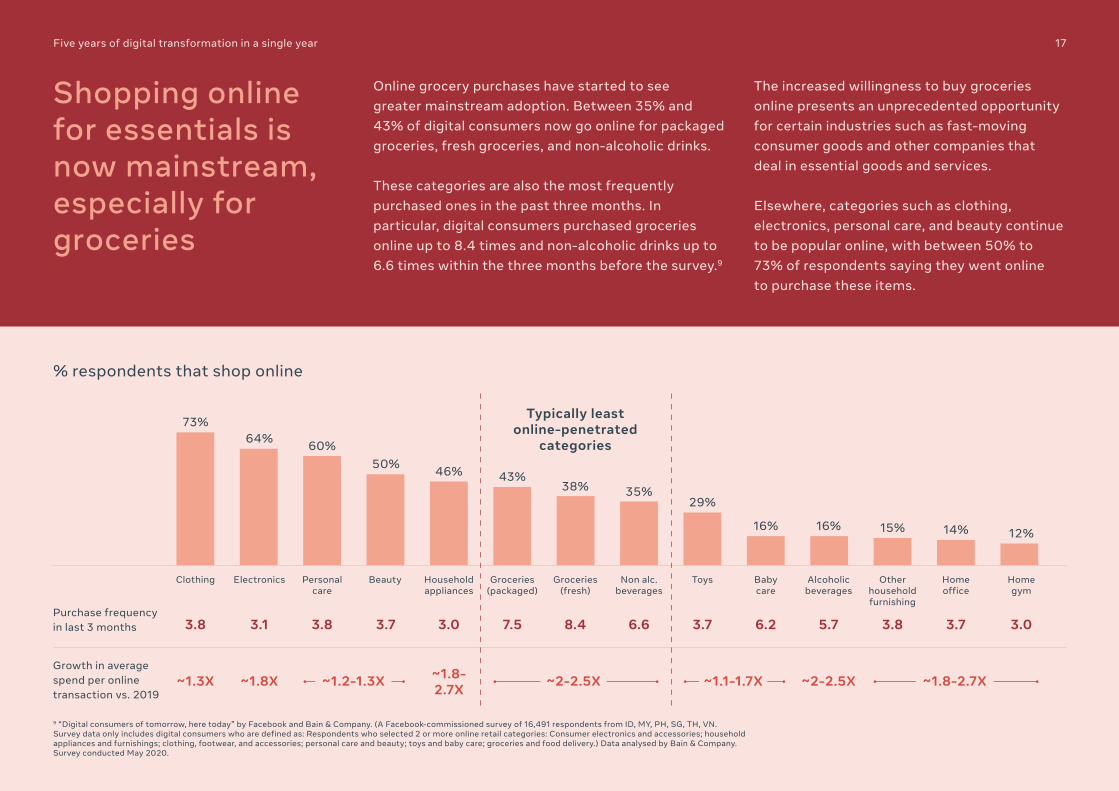
Shopping online for essentials is now mainstream, especially for groceries
Online grocery purchases have started to see greater mainstream adoption. Between 35% and 43% of digital consumers now go online for packaged groceries, fresh groceries, and non-alcoholic drinks.
These categories are also the most frequently purchased ones in the past three months. In particular, digital consumers purchased groceries online up to 8.4 times and non-alcoholic drinks up to 6.6 times within the three months before the survey.9
The increased willingness to buy groceries online presents an unprecedented opportunity for certain industries such as fast-moving consumer goods and other companies that deal in essential goods and services.
Elsewhere, categories such as clothing, electronics, personal care, and beauty continue to be popular online, with between 50% to 73% of respondents saying they went online to purchase these items.
17
9 “Digital consumers of tomorrow, here today” by Facebook and Bain & Company. (A Facebook-commissioned survey of 16,491 respondents from ID, MY, PH, SG, TH, VN. Survey data only includes digital consumers who are defined as: Respondents who selected 2 or more online retail categories: Consumer electronics and accessories; household appliances and furnishings; clothing, footwear, and accessories; personal care and beauty; toys and baby care; groceries and food delivery.) Data analysed by Bain & Company. Survey conducted May 2020.
% respondents that shop online
Typically least online-penetrated
categories
Clothing Electronics Personalcare
Beauty Householdappliances
Groceries(packaged)
Groceries(fresh)
Non alc.beverages
Toys Baby care
Alcoholicbeverages
Other householdfurnishing
Home gym
Home office
73%64% 60%
50% 46% 43%38% 35%
29%
16% 16% 15% 14% 12%
3.8 3.1 3.8 3.7 3.0 7.5 8.4 6.6 3.7 6.2 5.7 3.8 3.7 3.0
~1.3X ~1.8X ~2-2.5X~1.8- 2.7X~1.2-1.3X ~2-2.5X ~1.1-1.7X ~1.8-2.7X
Purchase frequency in last 3 months
Growth in average spend per online transaction vs. 2019

Five years of digital transformation in a single year
For first-time online purchases, the shopping cart has evolved over time, with latest surge in groceries
For first-time digital consumers, the shopping cart isn’t static, but changes season by season.
In the report Southeast Asia digital consumer trends that shape the next normal, we pointed out that people staying at home have increased the demand for essentials in the short term, both online and offline.
Indeed, in the past 3 months, the majority of recent first-time online purchases have been in grocery and food delivery, highlighting the impact of social distancing measures on consumer behaviour in the region.
18
Before Jun 2019 Dec ’19 to Feb ’20 Mar to May ’20
Food delivery
Home office
Groceries (fresh)
Consumer electronics
Household furnishing
Household appliances
Household appliances
Groceries (alcoholic drinks)
Beauty and cosmetics
Consumer electronics
Food delivery
Clothing Home gym equipment
Groceries (packaged)
Data compiled and modelled from: Forrester ForecastView, Forrester Analytics: Online Retail Forecast, 2019 to 2024 (Asia-Pacific, China, India, Southeast Asia, USA) by Forrester Research. Passport: Economies and Consumers Annual Data 2018 to 2025, by Euromonitor. Digital 2019 (Indonesia, Malaysia, the Philippines, Singapore, Thailand, and Vietnam) by Hootsuite, Jan 2019. Riding the Digital Wave: Capturing Southeast Asia’s Digital Consumer in the Discovery Generation” by Bain & Company (Facebook-commissioned survey of 12,965 respondents from ID, MY, PH, SG, TH, VN), Jun 2019.
Most essential Less essential Least essential
Groceries (non-alcoholic drinks)

The digital consumer of tomorrow is here
19

The digital consumer of tomorrow is here
Quantitative: What 16,000+ digital consumers had to say
Facebook and Bain & Company conducted a survey that seeks to better understand Southeast Asia’s digital consumers: Their spending habits, purchase journey, motivations, viewing behaviour, and digital presence. In doing so, we obtained a clear picture of the forces shaping the business landscape and influencing consumer behaviour in the next few years.
Ths survey covered 16,491 digital consumers from various age groups, income levels, and genders across six Southeast Asian countries, namely, Indonesia, Malaysia, the Philippines, Singapore, Thailand, and Vietnam. Digital consumers surveyed are those who have made an online purchase in at least 2 product categories in the past 3 months.
The survey, conducted online in May 2020, was commissioned by Facebook while data analysis and modelling were provided by Bain & Company.
Who we spoke to
20
Country
Age
Tier
Gender
ID 29%
MY 12%
PH12%
SG 8%
Tier 228%
Tier 172%
VN21% TH
18%
19-2416%
16-185%
Male48%
Female52%
60+1%
25-2920%
30-3419%
35-3917%
40-4914%
50-598%
The digital consumer of tomorrow is here
Qualitative: Perspectives from 20+ business leaders
In addition to the detailed survey, Facebook and Bain & Company also interviewed more than 20 senior executives from various industries. The business leaders we spoke to shared their outlook for the digital economy in areas such as technology, fast-moving
consumer goods, finance, ecommerce, venture capital, groceries, and many more. The insights shared here reflect their perspectives.
21
Interviewed executives across the ecosystem

How consumers discover
22
10 YouGov syndicated tracker (ID, MY, PH, SG, TH, VN), April 2020. As reported in “Southeast Asia digital consumer trends that shape the next normal” by Facebook and Bain & Company. June 2020. 11 Indonesia, Malaysia, the Philippines, Singapore, Thailand, Vietnam
How consumers discover 23
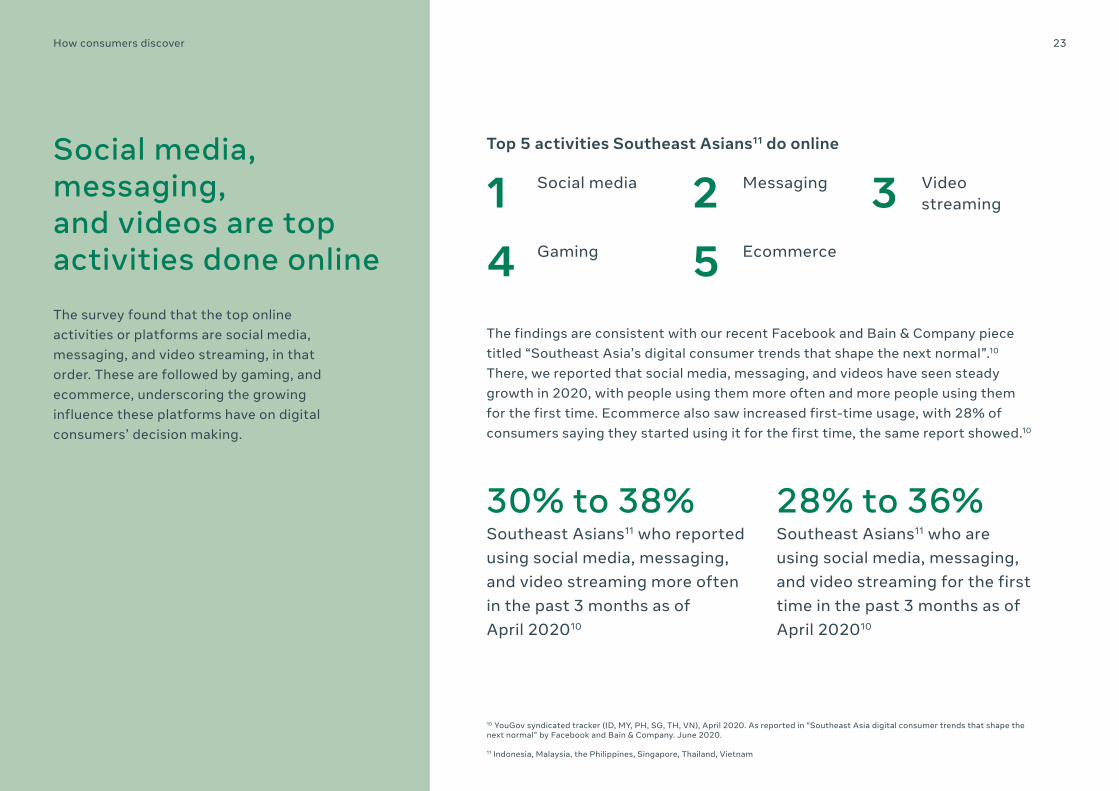
Social media, messaging, and videos are top activities done online
The survey found that the top online activities or platforms are social media, messaging, and video streaming, in that order. These are followed by gaming, and ecommerce, underscoring the growing influence these platforms have on digital consumers’ decision making.
The findings are consistent with our recent Facebook and Bain & Company piece titled “Southeast Asia’s digital consumer trends that shape the next normal”.10 There, we reported that social media, messaging, and videos have seen steady growth in 2020, with people using them more often and more people using them for the first time. Ecommerce also saw increased first-time usage, with 28% of consumers saying they started using it for the first time, the same report showed.10
30% to 38%Southeast Asians11 who reported using social media, messaging, and video streaming more often in the past 3 months as of April 202010
28% to 36%Southeast Asians11 who are using social media, messaging, and video streaming for the first time in the past 3 months as of April 202010
14
Social media Video streaming
Ecommerce
Messaging
Gaming
352
Top 5 activities Southeast Asians11 do online

How consumers discover 24
Consumers are driven by openness to digital discovery
That’s why we call them the Discovery Generation
68%of respondents discover new products largely through online inspiration and influence12
12 “Digital consumers of tomorrow, here today” by Facebook and Bain & Company. (A Facebook-commissioned survey of 16,491 respondents from ID, MY, PH, SG, TH, VN. Survey data only includes digital consumers who are defined as: Respondents who selected 2 or more online retail categories: Consumer electronics and accessories; household appliances and furnishings; clothing, footwear, and accessories; personal care and beauty; toys and baby care; groceries and food delivery.) Data analysed by Bain & Company. Survey conducted May 2020.
Who are they? Southeast Asian online shoppers whose purchasing habits are largely based on inspiration and openness to digital discovery

How consumers discover
Social media, video, and messaging are crowd favourites for Discovery Commerce
Social media, short videos, and messaging together form the largest source for discovering new brands and products, with 62% of consumers citing them as top channels for discovery-led engagement.13
Overall, increased access to the internet means most consumer engagements now take place online instead of offline. In Southeast Asia, 88% percent of consumers now cite online channels as their top source of brand engagement. In contrast, the remaining 12% say their top channel for engagement takes place via offline sources such as physical newspapers, word of mouth, brick-and-mortar stores, billboards, TV, and radio.13
Online channels are further broken down into 3 categories: Online discovery channels, online intentional channels, and others. Online discovery channels refer to channels in which people browse through a feed without looking for something specific, such as social media, podcasts, messaging, and gaming sites. By comparison, people who use intentional channels have to type out what they’re looking for, such as when they use an ecommerce site’s on-site search bar.13
More than half the volume of online purchases (53%) started via Discovery Commerce (online discovery channels), specifically through social media, short videos, and messaging (accounting for 62% of all Discovery Commerce).13 The findings suggest that online discovery channels play a bigger role in consumers’ decision -making than any other online channel, including intentional channels.
13 “Digital consumers of tomorrow, here today” by Facebook and Bain & Company. (A Facebook-commissioned survey of 16,491 respondents from ID, MY, PH, SG, TH, VN. Survey data only includes digital consumers who are defined as: Respondents who selected 2 or more online retail categories: Consumer electronics and accessories; household appliances and furnishings; clothing, footwear, and accessories; personal care and beauty; toys and baby care; groceries and food delivery.) Data analysed by Bain & Company. Survey conducted May 2020.
25
Social media, short videos and messaging account for 62% of online discovery% responses citing ‘top’ online channel for discovery
Online engagement channels
Social media, short video and messaging
62%Medium video
25%
Long video
5%
Others13%
Search led35%
Discovery led53%
How consumers discover
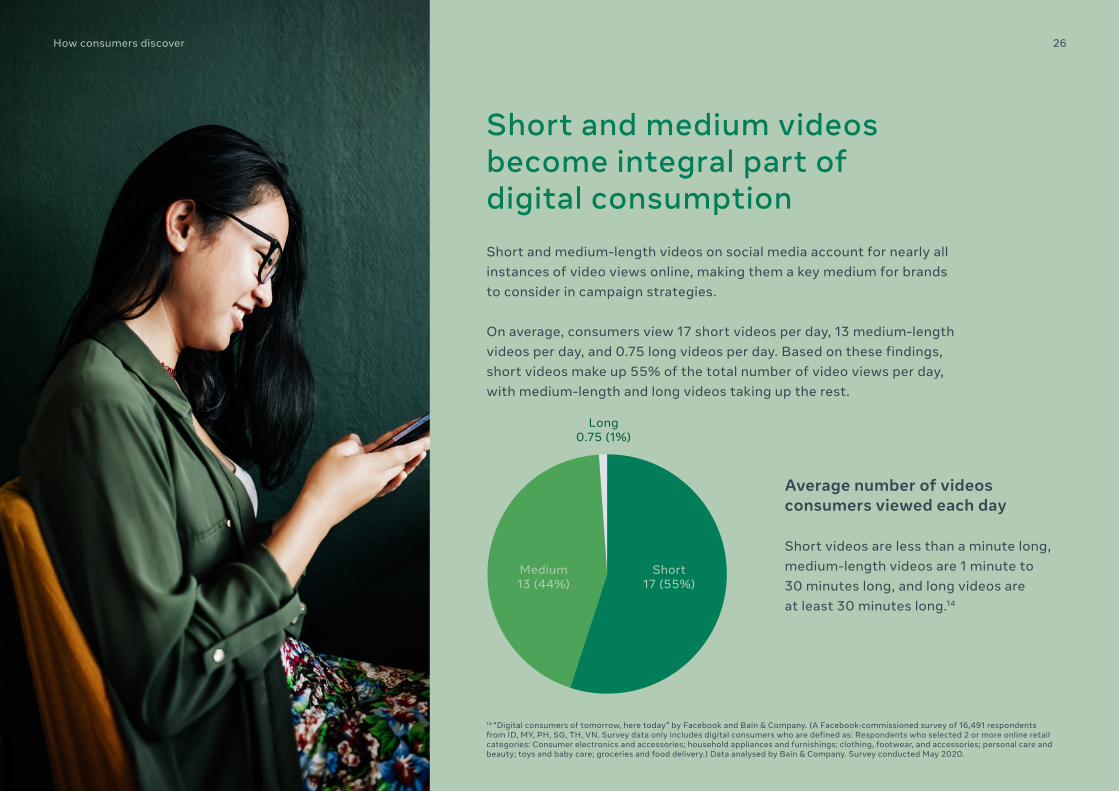
Short and medium videos become integral part of digital consumption
14 “Digital consumers of tomorrow, here today” by Facebook and Bain & Company. (A Facebook-commissioned survey of 16,491 respondents from ID, MY, PH, SG, TH, VN. Survey data only includes digital consumers who are defined as: Respondents who selected 2 or more online retail categories: Consumer electronics and accessories; household appliances and furnishings; clothing, footwear, and accessories; personal care and beauty; toys and baby care; groceries and food delivery.) Data analysed by Bain & Company. Survey conducted May 2020.
26
Short and medium-length videos on social media account for nearly all instances of video views online, making them a key medium for brands to consider in campaign strategies.
On average, consumers view 17 short videos per day, 13 medium-length videos per day, and 0.75 long videos per day. Based on these findings, short videos make up 55% of the total number of video views per day, with medium-length and long videos taking up the rest.
Long 0.75 (1%)
Medium 13 (44%)
Short17 (55%)
Average number of videos consumers viewed each day Short videos are less than a minute long, medium-length videos are 1 minute to 30 minutes long, and long videos are at least 30 minutes long.14

How consumers discover
Social media the leading platform for short- and medium-length videos
Social media is the primary way people discover and view short and medium-length videos, the survey showed. This suggests that discovery channels such as social media play a bigger role in facilitating video views compared to intentional channels.15
Among those surveyed, 63% find new short videos primarily through social media, while 54% discover medium-length videos through this platform.15 But when it comes to preference, social media and messaging are consumers’ most preferred platforms for viewing short and medium-length videos.
15 “Digital consumers of tomorrow, here today” by Facebook and Bain & Company. (A Facebook-commissioned survey of 16,491 respondents from ID, MY, PH, SG, TH, VN. Survey data only includes digital consumers who are defined as: Respondents who selected 2 or more online retail categories: Consumer electronics and accessories; household appliances and furnishings; clothing, footwear, and accessories; personal care and beauty; toys and baby care; groceries and food delivery.) Data analysed by Bain & Company. Survey conducted May 2020.
27
Up to 3 in 5 consumers discover the leading platform for short- and medium-length videos on social media
Short video Medium video
Most preferred platforms for viewing videos
Social media(63%)
Social media(54%)
Search(33%) Search
(41%)
Others (4%) Others (5%)
123
Social media
Messaging
Others
123
Video-streaming sites
Social media
Messaging

How consumers discover
Ecommerce now a platform for intentional purchases
While social-led Discovery Commerce is the primary way brands engage with consumers in Southeast Asia, ecommerce is now the preferred medium for online intentional channels (i.e. platforms that help people find specific information, item, or service online). As a whole, 70% of intentional engagements now happen through ecommerce, while the remaining 30% take place via general browsing.16
Live ecommerce has grown in popularity, too. Of the total engagements via ecommerce, 39% happen through live ecommerce, which refers to the selling of products using live video.16 The remaining 61% take place via traditional ecommerce, such as on-site search on ecommerce sites or mobile apps.
By comparison, in the United States 9 in 10 product views on Amazon come from its on-site search tool, showing the outsized potential of ecommerce to facilitate conversion16. As a result, large brands are recognising the impact of on-site searches done via ecommerce platforms, and are taking steps to leverage it as a key media channel.
16 “Digital consumers of tomorrow, here today” by Facebook and Bain & Company. (A Facebook-commissioned survey of 16,491 respondents from ID, MY, PH, SG, TH, VN. Survey data only includes digital consumers who are defined as: Respondents who selected 2 or more online retail categories: Consumer electronics and accessories; household appliances and furnishings; clothing, footwear, and accessories; personal care and beauty; toys and baby care; groceries and food delivery.) Data analysed by Bain & Company. Survey conducted May 2020. 17 “The Race is On: Jumpshot Releases The Competitive State of eCommerce Marketplaces Data Report”, by Jumpshot. Sept 2018. Disclosure: Since data is older than 1 year, consider changing market conditions before making business decisions based on this data. https://www.prnewswire.com/news-releases/the-race-is-on-jumpshot-releases-the-competitive-state-of-ecommerce-marketplaces-data-report-300707754.html
28
% responses citing as ‘top’ online channel for search
Overall, ecommerce is gaining preference over general browsing
Online engagement channels
ecommerce (non-live)
ecommerce (live streaming)
Browser
43%
27%
30%
Others(13%)
Search led(35%)
Discovery led(53%)
90% of product views on Amazon directly result from its on-site search platform17

How consumers discover 29
“As a lot of ‘search’ shifts onto ecommerce platforms, brands could start using it as a key media channel itself. Acquisitions through in-platform marketing and SEO/SEM, among others, point a path to the future — assuming platforms can offer such features.”
Managing Director, ASEAN-5 Kimberly Clark
“We rely heavily on digital platforms that help us segment and personalise marketing reach as well as to direct consumers to ecommerce. It’s important to help first-time digital consumers in gaining fluency.”
Hira Triadi Head of Ecommerce Unilever Indonesia
New norms = new purchasing habits
30

New norms = new purchasing habits
More openness towards switching brands
Southeast Asians are open to different brands: On average, 54% say they changed their most purchased brand in the three months prior to the study.18
For brands, this presents both an opportunity and challenge. On one hand, customers that are open to switching means businesses have to be more innovative to retain loyalty; on the other, a more receptive audience means brands have more breathing space to be creative and experimental in their offerings, approach, and outreach.
There is great variation among countries within the region, with consumers in Vietnam, Thailand, and Malaysia more willing to switch things up. In these countries, 51% to 69% of consumers have switched their most purchased brands. The Philippines and Indonesia have shown openness to switching as well. One outlier is Singapore, where switching brands was reported by only one-third of respondents.18
18 “Digital consumers of tomorrow, here today” by Facebook and Bain & Company. (A Facebook-commissioned survey of 16,491 respondents from ID, MY, PH, SG, TH, VN. Survey data only includes digital consumers who are defined as: Respondents who selected 2 or more online retail categories: Consumer electronics and accessories; household appliances and furnishings; clothing, footwear, and accessories; personal care and beauty; toys and baby care; groceries and food delivery.) Data analysed by Bain & Company. Survey conducted May 2020.
% of responses who switched most-purchased brand in last 3 months across categories
Majority of Southeast Asian respondents have switched their most purchased brands
31
SEA
54%
PH
48%
TH
67%
MY
51%
ID
45%
SG
33%
VN
69%
New norms = new purchasing habits
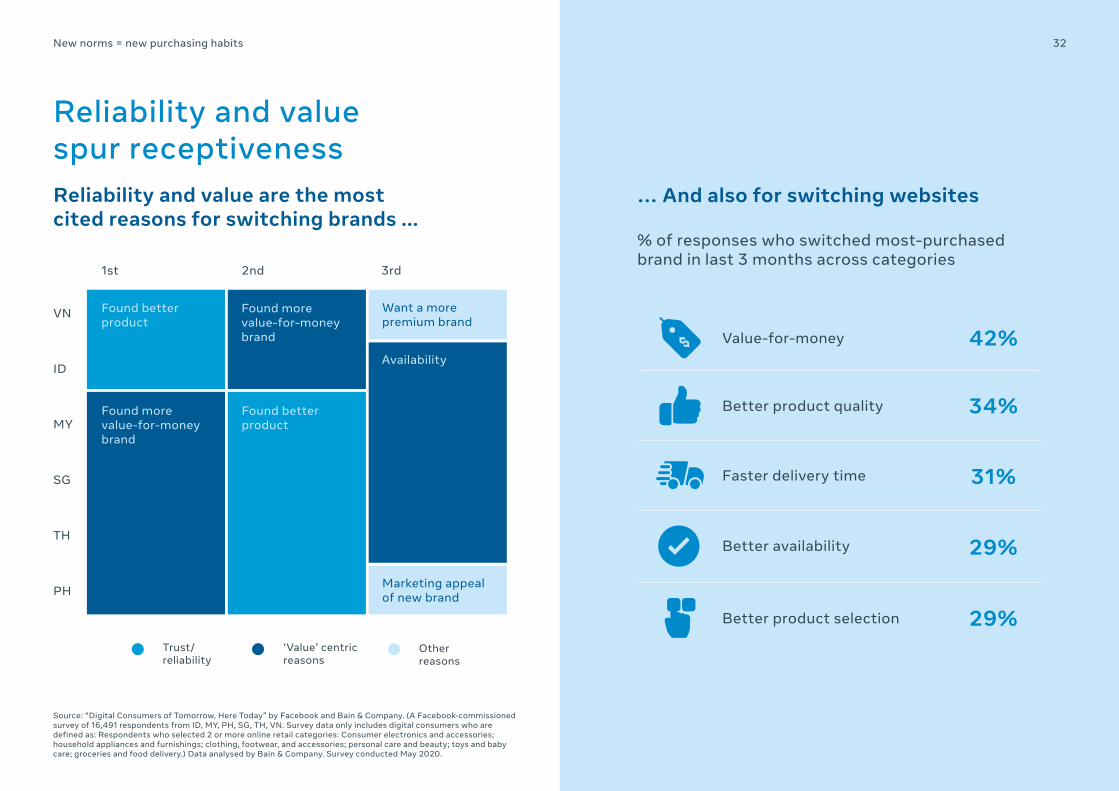
Reliability and value spur receptiveness
Source: “Digital Consumers of Tomorrow, Here Today” by Facebook and Bain & Company. (A Facebook-commissioned survey of 16,491 respondents from ID, MY, PH, SG, TH, VN. Survey data only includes digital consumers who are defined as: Respondents who selected 2 or more online retail categories: Consumer electronics and accessories; household appliances and furnishings; clothing, footwear, and accessories; personal care and beauty; toys and baby care; groceries and food delivery.) Data analysed by Bain & Company. Survey conducted May 2020.
32
MY
PH
ID
VN
SG
TH
1st 2nd 3rd
Found better product
Found more value-for-money brand
Want a more premium brand
Marketing appeal of new brand
Found more value-for-money brand
Found better product
Availability
Reliability and value are the most cited reasons for switching brands ...
Trust/ reliability
‘Value’ centric reasons
Other reasons
% of responses who switched most-purchased brand in last 3 months across categories
… And also for switching websites
42%
34%
31%
Value-for-money
Better product quality
Better availability
Faster delivery time
Better product selection
29%
29%

New norms = new purchasing habits 33
“Brands need to enhance their value proposition both online and offline, and be flexible and adaptable to change, now more than ever. We continue to focus on bringing renewed excitement and interest in our brands through innovation at Nestlé; for healthier and tastier foods, to suit changing consumer behaviours and also towards a more sustainable future. Within the ecommerce space, we aim to ensure strong digital content, product availability online and a robust supply chain. Our online selection prioritises delivering convenience, bulk purchases, and limited editions.”
Phee Chat Chow Executive Director Marketing, Communications and InnovationNestlé Malaysia and Singapore
New norms = new purchasing habits
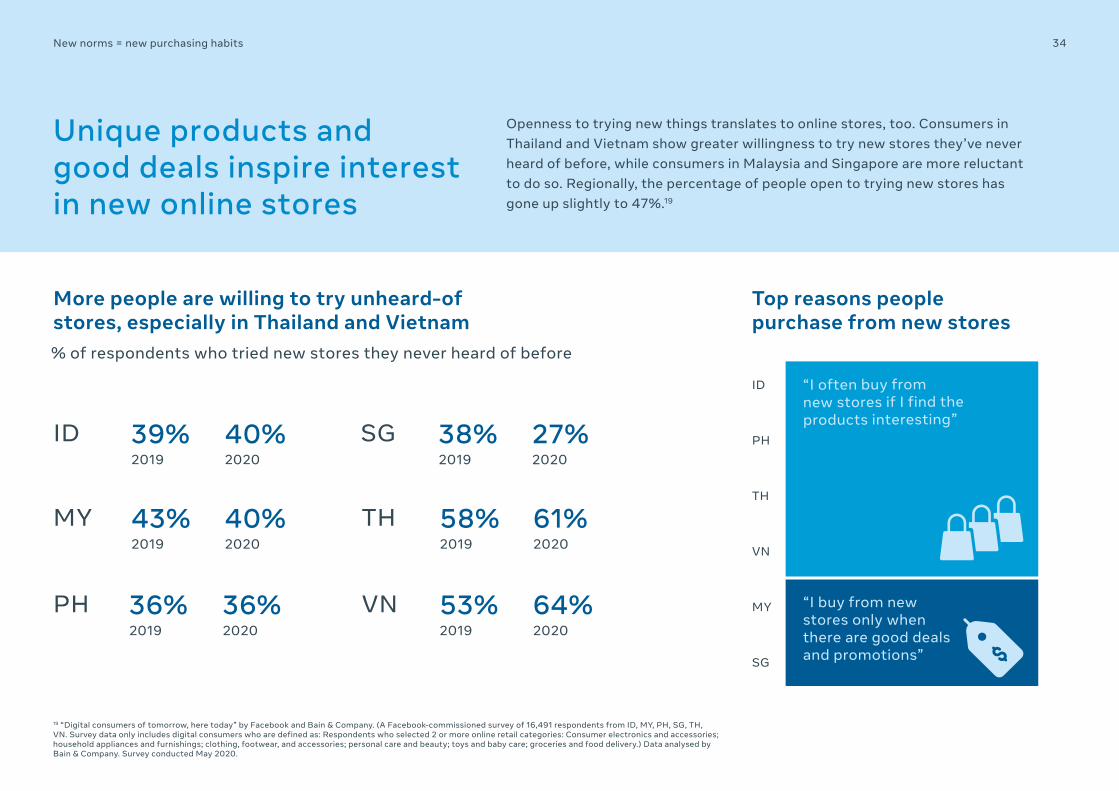
Unique products and good deals inspire interest in new online stores
19 “Digital consumers of tomorrow, here today” by Facebook and Bain & Company. (A Facebook-commissioned survey of 16,491 respondents from ID, MY, PH, SG, TH, VN. Survey data only includes digital consumers who are defined as: Respondents who selected 2 or more online retail categories: Consumer electronics and accessories; household appliances and furnishings; clothing, footwear, and accessories; personal care and beauty; toys and baby care; groceries and food delivery.) Data analysed by Bain & Company. Survey conducted May 2020.
34
TH
SG
PH
ID
VN
MY
“I often buy from new stores if I find the products interesting”
More people are willing to try unheard-of stores, especially in Thailand and Vietnam
Top reasons people purchase from new stores
“I buy from new stores only when there are good deals and promotions”
% of respondents who tried new stores they never heard of before
201939%
202040%ID
201936%
202036%PH
201958%
202061%TH
SG201938%
202027%
201943%
202040%MY
201953%
202064%VN
Openness to trying new things translates to online stores, too. Consumers in Thailand and Vietnam show greater willingness to try new stores they’ve never heard of before, while consumers in Malaysia and Singapore are more reluctant to do so. Regionally, the percentage of people open to trying new stores has gone up slightly to 47%.19

New norms = new purchasing habits
Embracing the contactless way of life, even in payments
E-wallets saw a surge in popularity even as preference for all other payment methods declined. Between 2019 and 2020, preference for e-wallets grew by 8 percentage points, with 22% of consumers now saying it’s their preferred way to pay.20 This comes at the expense of other modes of payment including cash-on-delivery, credit and debit cards, convenience stores, or bank transfers.
Cash transactions saw the biggest drop, from 40% preference among Southeast Asian consumers in 2019 to 34% in 2020 — a decrease of 6 percentage points.20
20 “Digital consumers of tomorrow, here today” by Facebook and Bain & Company. (A Facebook-commissioned survey of 16,491 respondents from ID, MY, PH, SG, TH, VN. Survey data only includes digital consumers who are defined as: Respondents who selected 2 or more online retail categories: Consumer electronics and accessories; household appliances and furnishings; clothing, footwear, and accessories; personal care and beauty; toys and baby care; groceries and food delivery.) Data analysed by Bain & Company. Survey conducted May 2020.
% of preferred payment methods
E-wallets now more popular at the expense of cash
35
E-wallet
Credit /debit card
Bank transfer
Cash
Outside of cash transactions, other forms of electronic payments also saw dips of up to 1 percentage point in 2020. These include credit and debit cards (down 30 basis points but still at 23%), bank transfers (from 20% to 19%), and convenience stores (from 3% to 2%).20
Overall, cash-on-delivery remains the most preferred payment method, followed by credit and debit cards which are neck and neck with e-wallets.
The growth in preference for e-wallets comes as authorities in the region sought to limit physical human contact, allowing e-payment companies to make inroads with consumers.
2019 2020
14%
23%
20%
40%
22%
22.7%
19%
34%
+8%
-0.3%
-1%
-6%

New norms = new purchasing habits 36
“Digital payments are really accelerating now. Q1 this year was our strongest quarter ever with increasing usage and adoption even by more senior populations. Moving ahead, online and contactless payments will be limited just by regulations now, as consumers have shown willingness to adopt.”
Prajit Nanu Co-Founder and Chief Executive Nium
“We are witnessing an exponential acceleration in digital usage and adoption for our financial services. Our first-time digibank signups surged in Q2 this year, growing by almost 2x year-on-year across all age segments, and in particular, more than 3x for seniors aged 62 years old and above. These new users have overcome the initial inertia of going digital and are unlikely to revert to previous habits — this behaviour is here to stay.”
Shee Tse Koon Group Executive and Country Head DBS Singapore

New norms = new purchasing habits
Revisiting the 6 types of digital consumers
Source: “Digital consumers of tomorrow, here today” by Facebook and Bain & Company. (A Facebook-commissioned survey of 16,491 respondents from ID, MY, PH, SG, TH, VN. Survey data only includes digital consumers who are defined as: Respondents who selected 2 or more online retail categories: Consumer electronics and accessories; household appliances and furnishings; clothing, footwear, and accessories; personal care and beauty; toys and baby care; groceries and food delivery.) Data analysed by Bain & Company. Survey conducted May 2020.
37
High-spenderssegment
Mid-spenderssegment
Low-spenders segment
Shops as the need arises
Evolved Shoppers
Wait for sales seasons
Deal Event Shoppers
Shops as the need arises
Targeted Shoppers
categories>5
categories5+
categories3+
categories1-2
categories1-2
categories2-3
of population28%
of population17%
of population7%
of population12%
of population20%
of population16%
average spend1.7X
average spend0.7X
average spend0.4X
average spend1.2X
average spend1.0X
average spend0.4X
Prefer promotions
Lifestyle Shoppers
Prefer promotions
Recent Adopters
Mixed
Gen Z
Majority from Tier 1 cities
Tier 1 and Tier 2 cities
Tier 1 and Tier 2 cities
US$50 per online purchase Greater than 1x average spend
US$30-50 per online purchase 0.7 to 1x average spend
Below US$30 per online purchase Less than 0.7x average spend

New norms = new purchasing habits
Ecommerce, social media, and video are top discovery channels across all
21 “Digital consumers of tomorrow, here today” by Facebook and Bain & Company. (A Facebook-commissioned survey of 16,491 respondents from ID, MY, PH, SG, TH, VN. Survey data only includes digital consumers who are defined as: Respondents who selected 2 or more online retail categories: Consumer electronics and accessories; household appliances and furnishings; clothing, footwear, and accessories; personal care and beauty; toys and baby care; groceries and food delivery.) Data analysed by Bain & Company. Survey conducted May 2020.
38
At least 1 in 2 shoppers21 from each consumer segment are “discoverers”: Consumers who don’t know exactly what they want or where to get it.
All consumer segments, whether an Evolved Shopper, a Recent Adopter, or a Gen Z, turn to the same top 3 discovery channels of ecommerce, social media, and medium-length videos.21
For some segments, certain discovery channels stand out more than others, however. Outside of the top 3 mentioned, news channels are also a source of discovery for Recent Adopters and Targeted Shoppers, while Super Apps are a top channel for Evolved Shoppers.21
Messaging is another top discovery channel for all except Recent Adopters.
Discover via social media, short videos, messaging (% of those who are discovery-led)
Evolved Shoppers
Recent Adopters
Targeted Shoppers
Lifestyle Shoppers
Gen Z
61%
70%
75%
67%
73%
Deal Event Shoppers 66%

New norms = new purchasing habits
Spending gap between Tier 1 and 2 cities is closing
22 “Digital consumers of tomorrow, here today” by Facebook and Bain & Company. (A Facebook-commissioned survey of 16,491 respondents from ID, MY, PH, SG, TH, VN. Survey data only includes digital consumers who are defined as: Respondents who selected 2 or more online retail categories: Consumer electronics and accessories; household appliances and furnishings; clothing, footwear, and accessories; personal care and beauty; toys and baby care; groceries and food delivery.) Data analysed by Bain & Company. Survey conducted May 2020.
39
In Southeast Asia as a whole, high spenders now make up at least 32% of consumers in both Tier 1 and Tier 2 cities, the study found. The population of high spenders also saw growth this year in both locations.
In Tier 1 cities, the number of high spenders grew 3 percentage points from 2019, rising to 44%. In Tier 2 cities, the rise was much sharper at 6 percentage points, to 32%.22
Tier 1 cities refer to highly urbanised areas, while Tier 2 locations refer to towns, suburban districts, and rural areas.
Even when broken down by country, the number of high spenders is mostly consistent with the region-wide data. One outlier is Singapore, where 59% of consumers are high spenders — much higher than the Southeast Asia average for Tier 1 cities.
SEA ID SG
Tier 2 Tier 2 Tier 2 Tier 2 Tier 2Tier 2
TH
Tier 1 Tier 1 Tier 1 Tier 1Tier 1 Tier 1Tier 1
VNMY PH
44%38%
48%41%
49% 46%
59%
32%29%
41%35%
40%32%
2019 2020
Tier 2 cities’ spending is now playing catch up to that of Tier 1 cities% of high spenders in Tier 1 and Tier 2 shoppers across countries
41%34%
44%35%
40% 41%
26%18%
30%25% 28%
25%
54%

New norms = new purchasing habits
Tier 1, Tier 2 gap also narrowing in behaviour, discovery, and frequency of purchase
23 “Digital consumers of tomorrow, here today” by Facebook and Bain & Company. (A Facebook-commissioned survey of 16,491 respondents from ID, MY, PH, SG, TH, VN. Survey data only includes digital consumers who are defined as: Respondents who selected 2 or more online retail categories: Consumer electronics and accessories; household appliances and furnishings; clothing, footwear, and accessories; personal care and beauty; toys and baby care; groceries and food delivery.) Data analysed by Bain & Company. Survey conducted May 2020.
Note: Tier 1 and 2 cities defined in tandem with 2019 report; Survey questions: Q24. Which statement would best describe your purchasing journey for the following categories online? (excluding food delivery & ride-hailing), Q41. When browsing and discovering products, which applications were you using across the following channels?, Q45, For the following categories, where did you find information and compare products, before you ended up buying your selected product?, Q14. For <category X> ?, have you recently (in the last 3 months) switched the brand that you buy the most?, Q20. On average, how much did you typically spend on each category, each time you purchased ONLINE?, Q19. How many times did you purchase each category online in the last 3 months? (*) Excludes food delivery and ride-hailing
40
Outside of spending, Tier 1 and Tier 2 spenders are also becoming more similar in other ways: Both segments don’t know exactly what they want; both discover products via social media, short videos, and messaging; both have switched brands in the past 3 months; and both have bought 4 to 5 times online in the past 3 months.23
Tier 1 Tier 2
Don’t know what products they want 69% 66%
Discover via social media, short videos, messaging (% of those who are discover-led)
62% 62%
Average spend per online purchase $46 $38
Switched brands in the ‘last 3 months’ 55% 54%
Frequency of online purchase in the last 3 months 4.7 4.1
Search via ecommerce (% of those who are search-led)
69% 72%

Steering the future
41

Steering the future
Purchasing from online channels gains traction across all markets
Online is no longer just one of many channels. For many businesses, it has become their main channel. The omnichannel option is no longer optional.
Nowhere is this more stark than in the category of groceries. Across Southeast Asia, the number of grocery shoppers who cite online as their most used channel has gone up by 1.5x, from 21% of consumers in 2019 to 32% in 2020.24
Among the six countries, the most notable changes were in Singapore, where online usage nearly tripled to 30%, and Malaysia, where online usage more than doubled to 40% of consumers.24
42
24 “Digital consumers of tomorrow, here today” by Facebook and Bain & Company. (A Facebook-commissioned survey of 16,491 respondents from ID, MY, PH, SG, TH, VN. Survey data only includes digital consumers who are defined as: Respondents who selected 2 or more online retail categories: Consumer electronics and accessories; household appliances and furnishings; clothing, footwear, and accessories; personal care and beauty; toys and baby care; groceries and food delivery.) Data analysed by Bain & Company. Survey conducted May 2020.
% respondents who say they primarily buy groceries online, by market (2019 vs. 2020) 2019 2020
Groceries (fresh)
SEA
21%
32%
1.5X
SG
2.7X
30%
11%
PH
1.0X
25%
25%
MY
2.1X
19%
40%
TH
1.2X
26%
32%
VN
1.5X
21%
32%
ID
1.6X
20%
31%
1.5Xmore respondents cited online as their most-used channel for groceries in 2020 compared with the previous year

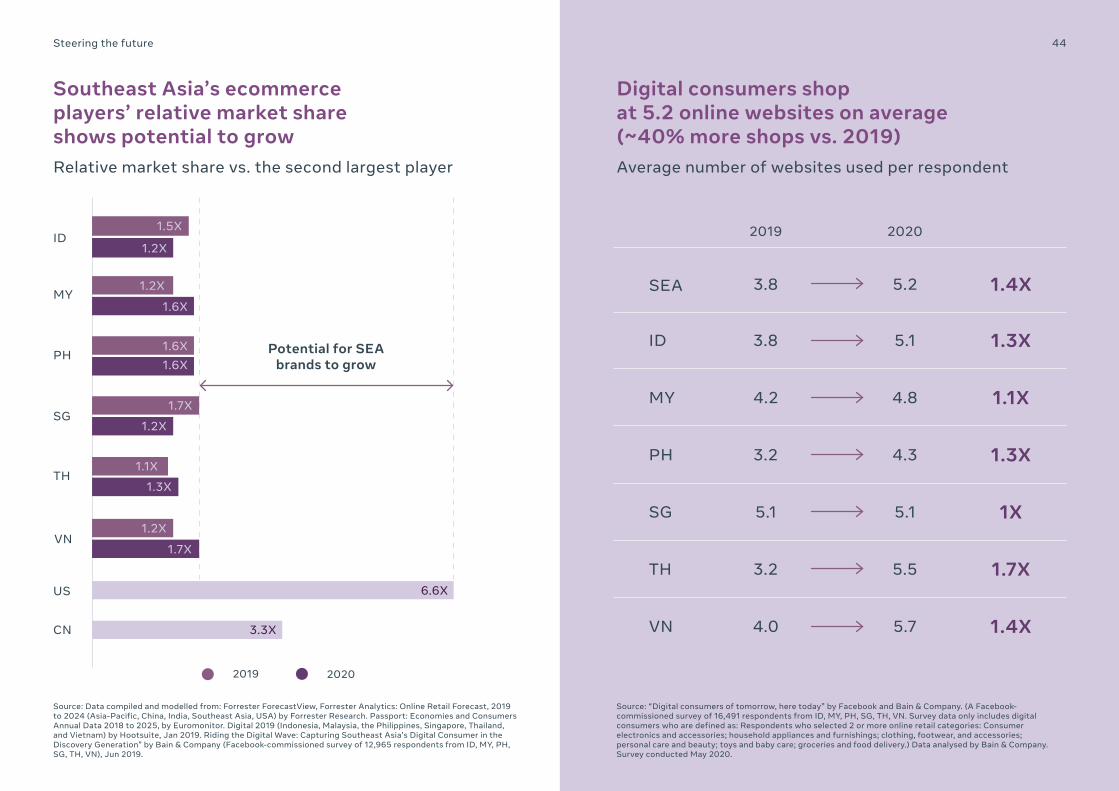
Ecommerce landscape booms but remains highly fragmented
Southeast Asia’s ecommerce story is still being written, both in terms of relative market share (RMS) and the number of websites consumers shop at. The RMS refers to the leader’s market share compared with the second largest player.
Overall, we see a higher level of cross-shopping across multiple websites compared with 2019. In 2020, digital consumers shopped at an average of 5.2 websites, up from 3.8 in 2019 — a one-year increase of 40%.25
Southeast Asia’s ecommerce players also remain relatively evenly matched, with the biggest player being 1.7x larger than its closest competitor. By comparison, the largest players in the US and China have an RMS of 6.6x (Amazon) and 3.3x (Alibaba), respectively.26
The picture suggests a highly fragmented market where ecommerce players have room to grow.
25 “Digital consumers of tomorrow, here today” by Facebook and Bain & Company. (A Facebook-commissioned survey of 16,491 respondents from ID, MY, PH, SG, TH, VN. Survey data only includes digital consumers who are defined as: Respondents who selected 2 or more online retail categories: Consumer electronics and accessories; household appliances and furnishings; clothing, footwear, and accessories; personal care and beauty; toys and baby care; groceries and food delivery.) Data analysed by Bain & Company. Survey conducted May 2020.
26 Data compiled and modelled from: Forrester ForecastView, Forrester Analytics: Online Retail Forecast, 2019 to 2024 (Asia-Pacific, China, India, Southeast Asia, USA) by Forrester Research. Passport: Economies and Consumers Annual Data 2018 to 2025, by Euromonitor. Digital 2019 (Indonesia, Malaysia, the Philippines, Singapore, Thailand, and Vietnam) by Hootsuite, Jan 2019. Riding the Digital Wave: Capturing Southeast Asia’s Digital Consumer in the Discovery Generation” by Bain & Company (Facebook-commissioned survey of 12,965 respondents from ID, MY, PH, SG, TH, VN), Jun 2019.
Steering the future 43
1.7X
1.2X
1.1X
1.3X
Steering the future
Southeast Asia’s ecommerce players’ relative market share shows potential to grow
Digital consumers shop at 5.2 online websites on average (~40% more shops vs. 2019)
Relative market share vs. the second largest player Average number of websites used per respondent
44
1.2X
1.6X
1.6X1.6X
1.5X
1.2X
6.6X
3.3X
SG
TH
MY
PH
ID
US
CN
VN1.2X
1.7X
Potential for SEA brands to grow
2019 2020
2019 2020
1X5.1 5.1SG
1.7X5.53.2TH
1.1X4.2 4.8MY
1.3X4.33.2PH
1.3X3.8 5.1ID
1.4X5.74.0VN
1.4X3.8 5.2SEA
Source: Data compiled and modelled from: Forrester ForecastView, Forrester Analytics: Online Retail Forecast, 2019 to 2024 (Asia-Pacific, China, India, Southeast Asia, USA) by Forrester Research. Passport: Economies and Consumers Annual Data 2018 to 2025, by Euromonitor. Digital 2019 (Indonesia, Malaysia, the Philippines, Singapore, Thailand, and Vietnam) by Hootsuite, Jan 2019. Riding the Digital Wave: Capturing Southeast Asia’s Digital Consumer in the Discovery Generation” by Bain & Company (Facebook-commissioned survey of 12,965 respondents from ID, MY, PH, SG, TH, VN), Jun 2019.
Source: “Digital consumers of tomorrow, here today” by Facebook and Bain & Company. (A Facebook-commissioned survey of 16,491 respondents from ID, MY, PH, SG, TH, VN. Survey data only includes digital consumers who are defined as: Respondents who selected 2 or more online retail categories: Consumer electronics and accessories; household appliances and furnishings; clothing, footwear, and accessories; personal care and beauty; toys and baby care; groceries and food delivery.) Data analysed by Bain & Company. Survey conducted May 2020.

“Customers understandably are seeking discounts and value … due to that sensitivity, platform stickiness encounters significant challenges.”
Khanh Ngo Group Vice President, Tiki Vietnam
45Steering the future

Steering the future
In comparison, food delivery sees a less fragmented landscape
Unlike ecommerce, Southeast Asia’s food delivery customers tend to stick to just 1 or 2 platforms, averaging at just 1.9 platforms per respondent. This reduces fragmentation and makes it easier for individual platforms to stand out. At the same time, the micro-local plays in each market make it less likely for a single-player winner to emerge.27
The number of platforms are consistent regardless of country. Usage per person maxes out to 2.3 platforms per respondent in Thailand, Vietnam, and Malaysia, and bottoms out in Indonesia at 1.7 platforms per respondent.27
27 “Digital consumers of tomorrow, here today” by Facebook and Bain & Company. (A Facebook-commissioned survey of 16,491 respondents from ID, MY, PH, SG, TH, VN. Survey data only includes digital consumers who are defined as: Respondents who selected 2 or more online retail categories: Consumer electronics and accessories; household appliances and furnishings; clothing, footwear, and accessories; personal care and beauty; toys and baby care; groceries and food delivery.) Data analysed by Bain & Company. Survey conducted May 2020.
Average number of food delivery platforms used per respondent
46
1.8SG
2.3TH
2.0MY
1.9PH
1.7ID
2.0VN
Source: “Digital consumers of tomorrow, here today” by Facebook and Bain & Company. (A Facebook-commissioned survey of 16,491 respondents from ID, MY, PH, SG, TH, VN. Survey data only includes digital consumers who are defined as: Respondents who selected 2 or more online retail categories: Consumer electronics and accessories; household appliances and furnishings; clothing, footwear, and accessories; personal care and beauty; toys and baby care; groceries and food delivery.) Data analysed by Bain & Company. Survey conducted May 2020.

47Steering the future
Food delivery players’ wide NPS® ranges offer room to win customer loyaltyCustomer loyalty remains fragile among food delivery companies in Southeast Asia, an analysis of their Net Promoter Score showed.
Net Promoter Score among food delivery apps across the region averages at 31%, suggesting low customer satisfaction in general. The low Net Promoter Score results from the massive gap in scores between food delivery companies: From -19% at the lowest to 67% at the highest, highlighting huge gaps in customer loyalty between competitors.28
The Net Promoter Score differs not just from company to company, but from country to country, too. Food delivery companies in Indonesia enjoy the highest and most consistent customer satisfaction rating, while those in Malaysia, the Philippines, and Singapore have the lowest. The contrasting scores suggest a great opportunity for players to expand their customer loyalty.28
28 “Digital consumers of tomorrow, here today” by Facebook and Bain & Company. (A Facebook-commissioned survey of 16,491 respondents from ID, MY, PH, SG, TH, VN. Survey data only includes digital consumers who are defined as: Respondents who selected 2 or more online retail categories: Consumer electronics and accessories; household appliances and furnishings; clothing, footwear, and accessories; personal care and beauty; toys and baby care; groceries and food delivery.) Data analysed by Bain & Company. Survey conducted May 2020.
Net Promoter®, NPS®, NPS Prism® and the NPS-related emoticons are registered trademarks of Bain & Company, Inc., Satmetrix Systems, Inc. and Fred Reichheld. Net Promoter ScoreSM and Net Promoter SystemSM are service marks, of Bain & Company, Inc., Satmetrix Systems, Inc., and Fred Reichheld.
What is a Net Promoter Score®?
Average and max Net Promoter Score shows high variation between food delivery firms
47
The Net Promoter Score is a measure of customer loyalty developed by Bain & Company in 2003. It gauges answers to a simple question: “On a scale of 1 (lowest) to 10 (highest), how likely are you to recommend our product or service to a friend or colleague?”
People who respond with a 9 or 10 are Promoters while those who give a 6 or below tend to be Detractors. People who answer 7 or 8 are “passives” who are satisfied with a business but may leave for a better offer. The Net Promoter Score is determined by subtracting the percentage of Detractors from the percentage of Promoters.
A high Net Promoter Score means a company has more Promoters and fewer Detractors, and is likely to be worth more than its competitors over the long run.
Average and max. NPS scores of food delivery players (%, 2020)
Highest Net Promoter Score Lowest Net Promoter Score
ID MY PH SG TH VN
51%
-19%
14%
41%
57%
32%
55%
12%
51%
67%
38%

48Steering the future 48
How to convert delivery Detractors into Promoters?
Top 3 reasons for positive Net Promoter Score:
Top 3 reasons for negative Net Promoter Score:
When asked to explain their views, Promoters and Detractors cited delivery time, delivery fees, price, and product variety, as important factors.
123
Delivery time
Menu price
Product variety
123
Delivery fees
Menu price
Delivery time
Net Promoter®, NPS®, NPS Prism® and the NPS-related emoticons are registered trademarks of Bain & Company, Inc., Satmetrix Systems, Inc. and Fred Reichheld. Net Promoter ScoreSM and Net Promoter SystemSM are service marks, of Bain & Company, Inc., Satmetrix Systems, Inc., and Fred Reichheld.

49Steering the future
“Digital consumers of tomorrow, here today” by Facebook and Bain & Company. (A Facebook-commissioned survey of 16,491 respondents from ID, MY, PH, SG, TH, VN. Survey data only includes digital consumers who are defined as: Respondents who selected 2 or more online retail categories: Consumer electronics and accessories; household appliances and furnishings; clothing, footwear, and accessories; personal care and beauty; toys and baby care; groceries and food delivery.) Data analysed by Bain & Company. Survey conducted May 2020.
49
Promoters make a difference: They spend ~2x more than Detractors
On average, promoters spent 2.1X more than detractors across categories
Personal care
2.3X
Consumer electronics
2.1XClothing2X
Householdappliances
2.2X
Baby care1.4X

Steering the future
Reliability and value keep customers returning
High price is unlikely to create Detractors, even as good value helps retain Promoters. Businesses who want to keep Detractors at bay can benefit from addressing reliability issues such as lack of availability, mismatched product expectations, and poor quality control, the survey found.
Similarly, price is the only value-related factor behind Promoter satisfaction. The rest involve reliability factors such as availability, product range, and sufficient information. The findings suggest that businesses who pay attention to reliability and value concerns will have a greater chance of standing out in a crowded market.
50
Source: “Digital consumers of tomorrow, here today” by Facebook and Bain & Company. (A Facebook-commissioned survey of 16,491 respondents from ID, MY, PH, SG, TH, VN. Survey data only includes digital consumers who are defined as: Respondents who selected 2 or more online retail categories: Consumer electronics and accessories; household appliances and furnishings; clothing, footwear, and accessories; personal care and beauty; toys and baby care; groceries and food delivery.) Data analysed by Bain & Company. Survey conducted May 2020.
Promoters Detractors
Price Product quality
Product meetsexpectations
Availability
Returns process
Price
Availability
Product range
Information
Product quality
1 1
2 2
3 3
4 4
5 5
Top 5 reasons cited by
The omnichannel option is no longer optional. How can brands adapt?
51

52How can brands adapt
A fully omnichannel audience calls for brands to go full with digital capabilities
52
Preparing for an omnichannel future doesn’t just mean having a website or a social media page (although that’s a start). Companies will also need to develop omnichannel capabilities by partnering or investing to build proprietary assets.
For instance, it also involves tracking profit and loss (account management), strategising on their retailer portfolio, planning a digital marketing approach, managing logistics and customer service, and obtaining insights on shopping behaviour.
For example, Singapore’s DBS Bank demonstrated agility by pivoting to a 360 digital approach that included moving away from traditional above-the-
line campaigns — ads that reach a broad, untargeted set of audience — and onto digital platforms.
The company has intensified its digital engagement efforts to be even more contextual when reaching out to its customers, engaging them at the right time with the right solution through the right channel for their needs.
The bank also upped the ante on its investments in customer-centric efforts recently — almost all of their non-cash branch services can now be done online. They also introduced a digital wealth advisory service called Teleadvisory in March, gaining 23,000 appointments since.
Developing Capitalising Harnessing Optimising
1 2 3 4
internal capabilities or build partnerships to know their consumers better
on online moments that matter to give consumers what they need
the power of tech, data and analytics for innovation
the shopper journey and shaping the perfect online experience
Capabilities to consider for an omnichannel future

53How can brands adapt
An omnichannel world needs a fully digital purchasing funnel
53
The phrase “research online, purchase offline” no longer applies. Discovery and decisions aren’t the only ones happening online; many transactions are, too. It is no longer enough for companies to influence buying decisions online and then move back offline to close a sale.
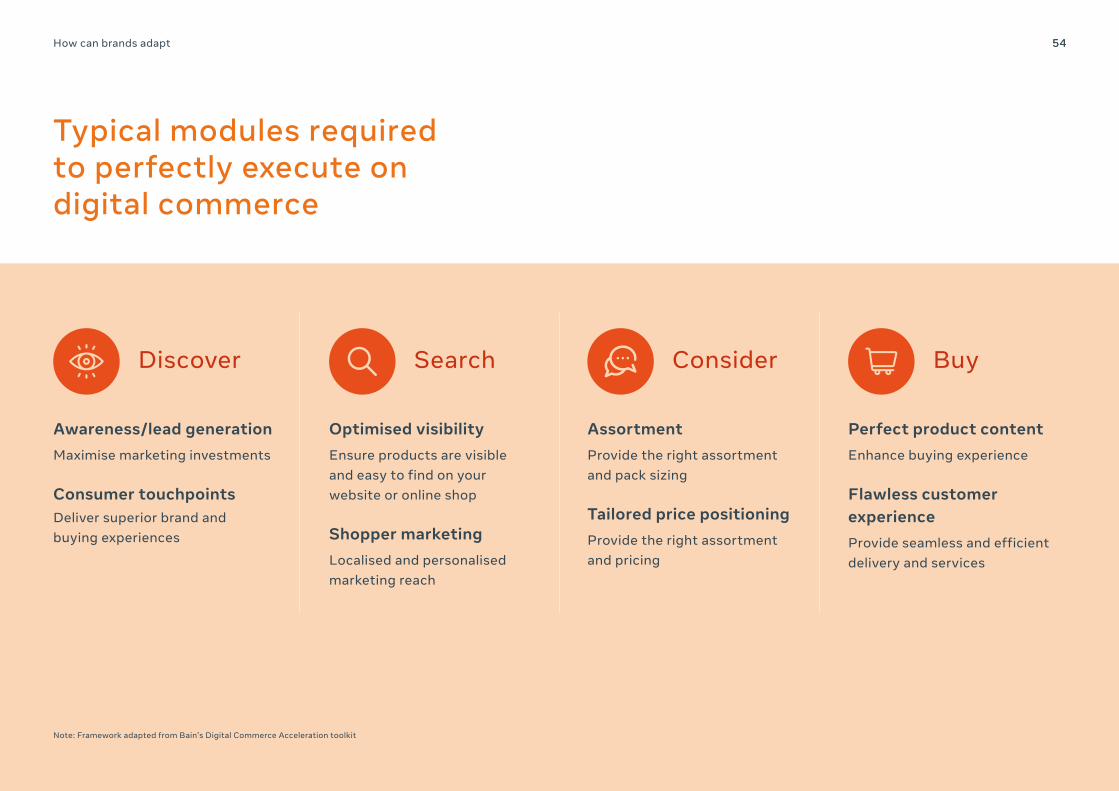
Companies should map the full customer journey online by transforming their marketing and channel mix to become omnichannel. Executing a digital commerce strategy means planning for the distinct phases of the consumer journey, as indicated in Bain’s Digital Commerce Acceleration toolkit:
Discover1Understand consumer omnichannel shopping behaviour and activation through brand and customer marketing. These include promoting awareness, generating leads, and delivering superior brand and buying experiences.
Search2Make it easier for consumers find a product through on-site search. This can be done through strategies that make products more visible and by showcasing ideal stock-keeping units.
Consider3Provide the right combination of products and a tailored pricing strategy to boost conversion or shopping cart use.
Buy4Enhance customer loyalty and relationships by improving the purchasing experience and gain insights from buying behaviour.
54How can brands adapt 54
Discover Search Consider Buy
Awareness/lead generationMaximise marketing investments
Consumer touchpointsDeliver superior brand and buying experiences
Optimised visibilityEnsure products are visible and easy to find on your website or online shop
Shopper marketingLocalised and personalised marketing reach
AssortmentProvide the right assortment and pack sizing
Tailored price positioningProvide the right assortment and pricing
Perfect product contentEnhance buying experience
Flawless customer experienceProvide seamless and efficient delivery and services
Typical modules required to perfectly execute on digital commerce
Note: Framework adapted from Bain’s Digital Commerce Acceleration toolkit

How can brands adapt 55
“Consumers are moving online now for many categories. So, for all consumer packaged goods, ecommerce is even more important and we devise more omnichannel strategies moving ahead. It’s the growth lever for us, and not a passive channel at all. We choose our partners accordingly, based on category fit and the drive they have to grow together.”
“With the onset of COVID-19, we as a company moved to ‘high agility’ mode and heavily prioritised digital. Smartphone penetration is so high in Southeast Asia, even in rural areas. That’s why digital channels are more important for consumers in low socio-economic tiers.”
“FairPrice has invested heavily to upgrade its online grocery infrastructure to meet increasing demand, including hiring and training staff. We plan to increase online capacity by another 30%.”
Hira Triadi Head of EcommerceUnilever Indonesia
Head of Digital Heineken Vietnam
General ManagerFairPrice

Sailing forward: The age of enablers
56

Sailing forward: The age of enablers
More deals for digital disruptors as unspent capital grows
Private equity funds and venture capital firms have been accumulating billions of dollars in unspent capital in the past decade, according to data compiled by Bain & Company.29
This record amount of unused capital means more potential firepower for start-ups, emerging mid-sized companies, and “unicorns” — successful start-ups valued at more than US$1 billion.
For insurgent brands, available capital means opportunities to attract more funding and grow. On the flip side, large brands must continue to transform themselves as they face recurring challenges from insurgent brands. Staving off disruption means winning customers again and again, every day, by raising awareness and earning their loyalty.
Regardless of size, both types of businesses can benefit from partnerships that can reduce their cost of acquiring new customers and help them grow profitably.
57
US$8.7 billionUnspent capital by Southeast Asian private-equity funds as of year-end 201929
29 “Preqin Insights capital markets database – Southeast Asia-based private equity funds unspent capital” by Preqin, June 2020

58Sailing forward: The age of enablers
Disruptors are coming in full force with tech-enabled payments
30 AVCJ (Asia Venture Capital Journal) transactions database (2019 to Q1 2020 PE/VC transactions in Southeast Asia)
58
Many crises result in disruptive new business models, and this time is no different. Billions in unused capital from venture capital and private equity firms are likely to keep flowing into insurgent brands in Southeast Asia — B2B enablers, fintech, and ecommerce firms — providing them with more capital to grow and posing a challenge to established brands.
In Q1 2020, more than two-thirds — 72% — of such funds went towards internet and technology disruptors, mainly ecommerce enablers and fintechs. An even higher percentage of funding went to such companies the previous year, in Q1 2019.30
While funding deals have slowed down in Q1 2020 due to the pandemic, they haven’t stopped: Early 2020 saw US$1.4 billion being invested in emerging companies across the region.30
Internet and technology
Utilities
Computer-related
Services (non-FS)
Digital payments, lending, ecommerce enablers, telehealth, and Super Apps
Renewable energy solutions and investment platforms
Digital enterprise solutions including AI, big-data SaaS (software as a service), and cybersecurity
Online education and recruitment
This points to a healthy pipeline of new, disruptive businesses going online, including those in the following areas:

59Sailing forward: The age of enablers 59
72%of private equity and venture capital funds in Southeast Asia have flowed into internet and technology in Q1 202031
“We are in the midst of a step change in the growth of the digital economy, which in turn drives a strong demand for digital financial services. As more consumers and businesses shift to online, we see an increased need for both online payments and various financial services, including our businesses under SeaMoney.”
Dr Santitarn Sathirathai Group Chief Economist Sea
Q1 2020 Q1 2020Internet &
technology
Internet and technology
(82%)
Ecommerce enabler(34%)
FinTech (16%)
B2B Tech (13%)
Ecommerce (12%)
Real estate (10%)
Health (9%)
Food delivery (6%)
Financial services(7%)
Utilities (6%)
Computer related(5%)
31 AVCJ (Asia Venture Capital Journal) transactions database (2019 to Q1 2020 PE/VC transactions in Southeast Asia)
Q1 2020: Investments still pouring into emerging internet, tech firmsDeal value by sector of investment (in billions of US$, Q1 2020)
US$1.4B

“The home-centric lifestyle has really driven a huge surge in the uptake of e-learning, gaming, ecommerce, and food delivery platforms. There is momentum for more disruptors to thrive now. As consumers become more open to disruption, we will add more functionalities to our apps that will support activities such as gaming, stock-trading, and other features to boost on-app usage.”
Prajit Nanu Co-Founder and Chief ExecutiveNium
60Sailing forward: The age of enablers
Healthcare, online entertainment and education are emerging trends
60
The rise of disruptive businesses — such as digital health, gaming live-streaming, online gaming and digital education — has accelerated as a result of the recent crisis.

61Sailing forward: The age of enablers 61
Gaming live-streamingPeople spending more time indoors has increased viewership for live-streaming. In the long term, greater awareness and stickiness can fuel growth in this space. Gaming live-streaming’s viewership is mainly on desktop, but there is potential to extend its reach further into mobile.
Moving forward, companies that want to succeed can explore exclusive distribution agreements, attracting high-quality streamers, and an innovative approach to monetisation.
Digital educationSchool closures and social distancing have led to a greater demand for digital education, or EdTech. Companies exploring this area should ensure a seamless online/offline student experience, as well as an efficient model to onboard customers at low cost.
Online gamingThe same recent and long-term trends in gaming live-streaming also apply to online gaming. Companies looking to succeed in this space can benefit from a robust pipeline of potential hits, have proven scaled publishing capabilities, as well as an effective approach to monetising content.
Digital health (telemedicine)Social distancing and limited capacity in hospitals has led to a surge in demand for telemedicine, in which patients consult with medical professionals remotely. In the long term, the “next normal” could lead to behavioural changes and make patients more open to this option.
To succeed in this space, companies will need to have an efficient model to on-board and acquire customers at a low cost. The ability to manage a seamless offline and online patient experience would also be beneficial.

“Telemedicine and healthtech have huge potential that are limited only by the supply. Regulations should evolve as entrepreneurs build solutions for this untapped opportunity.”
Rajan Anandan Managing DirectorSequoia Capital
62Sailing forward: The age of enablers 62
7XExpected growth in the US telehealth market by 202532
32 “COVID-19 Accelerates the Adoption of Telemedicine in Asia-Pacific Countries” by Bain & Company. 27 April 2020
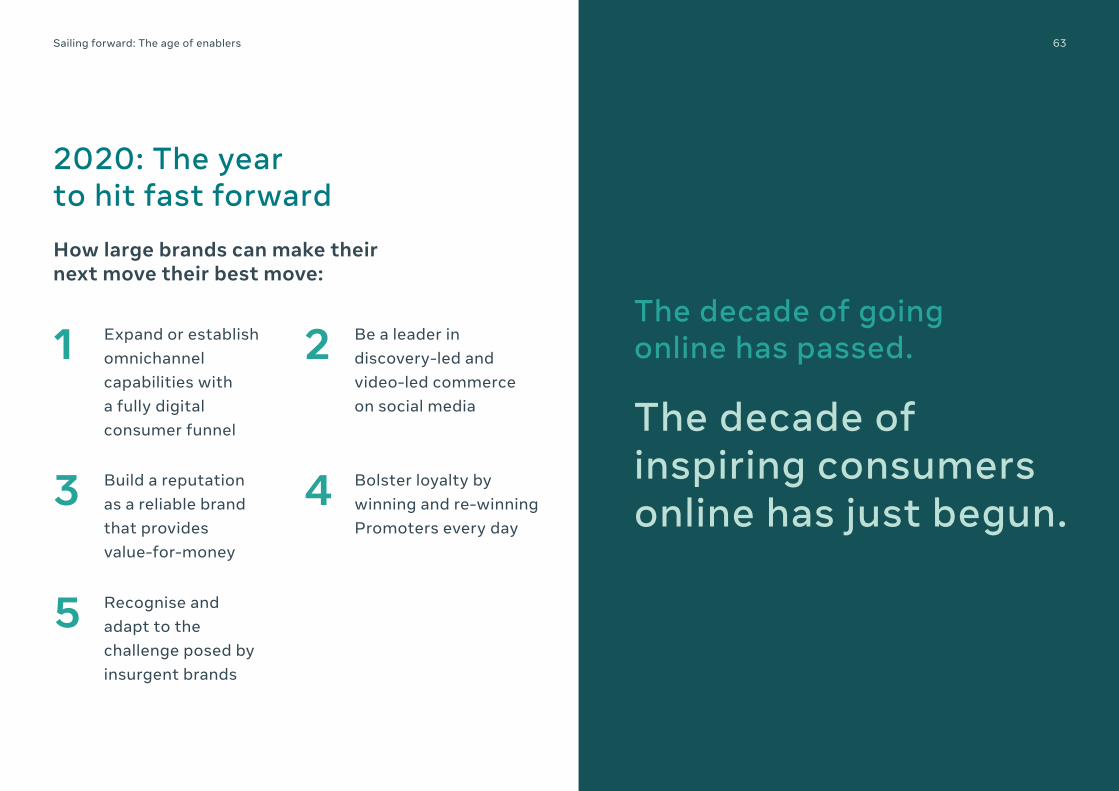
63Sailing forward: The age of enablers
2020: The year to hit fast forward
63
How large brands can make their next move their best move:
Expand or establish omnichannel capabilities with a fully digital consumer funnel
Build a reputation as a reliable brand that provides value-for-money
Recognise and adapt to the challenge posed by insurgent brands
Be a leader in discovery-led and video-led commerce on social media
Bolster loyalty by winning and re-winning Promoters every day
1
3
5
2
4
The decade of going online has passed.
The decade of inspiring consumers online has just begun.

About FacebookFounded in 2004, Facebook’s mission is to give people the power to build community and bring the world closer together. People use Facebook to stay connected with friends and family, to discover what’s going on in the world, and to share and express what matters to them.
About Bain & CompanyBain & Company is a global consultancy that helps the world’s most ambitious change-makers define the future. Across 58 offices in 37 countries, we work alongside our clients as one team with a shared ambition: to achieve extraordinary results that outperform their competition and redefine their industries. We complement our tailored, integrated expertise with a curated ecosystem of digital innovators to deliver better, faster and more enduring outcomes to our clients. Since our founding in 1973, we have measured our success by the success of our clients. We proudly maintain the highest client advocacy in the industry, and our clients have outperformed the stock market 4:1. Learn more at www.bain.com and follow us on Twitter @BainAlerts.
Published August 2020© Facebook, Inc, and Bain & Company, Inc
About Facebook and About Bain & Company