dielectric properties of li-aluminates for ceramic breeder materials
TRANSCRIPT

Dielectric Properties of Li-Aluminates for Ceramic Breeder Materials Wafa I. Abd EI-Fattah*, W. G. Osiris' , A. A. El-Sayed ~, and M. A. Faded *Ceramics Department, National Research Centre, and tBiophysics Department, Faculty of Science, Cairo University, Giza, Egypt
High-alumina ceramic bodies having Li-~-alumina and lithium aluminate structure with variable alkali and boron contents were prepared. The optimization of the ceramic prop- erties was assessed through measuring their vitrification parameters within firing temper- atures ranging from 1100 to 1300°C. Accompanying structural changes were followed through x-ray diffraction as well as scanning electron microscopy. Their D.C. resistivity as well as dielectric properties-relative dielectric constant, loss angle, relative dielectric loss constant, and A.C. resistivity at variable frequencies within 2-50kHz and 200-500kHz ranges at 60, 90 and 120°C-were measured. The results indicated that optimum vitrification parameters are attained at 1250°C. The presence of boron oxide enhanced densification probably through more liquid formation with lower viscosity. The dielectric results are successfully correlated with variable structure and densiflcation.
INTRODUCTION
In a project to produce lithium-bearing ce- ramics from solid-state reactions, various compositions of Li20, K20, Na20, A1203, and B203 were prepared [1]. The present article deals with the characterization of Li- aluminate ceramics dosimeters [1] having the Li-13-alumina structure and also contain- ing boron oxide to satisfy the requirements for such devices as skin dosimeters [2], boron-neutron capture, and increasing the probability of nucleus recoils as proton re- coils when irradiated with fast neutrons [3]. Moreover, the presence of boron and/or lith- ium in Na-13-alumina has been reported to enhance densihcation at lower temperatures and reduce volume resistivity. The impor- tance of 13-alumina ceramics with different oxides, including their characteristics and physical, mechanical, chemical, and infrared properties, has been documented [4-8], but relevant studies of Li-13-alumina are rarely
127
encountered. Furthermore, lithium ceram- ics continue to show promise as candidate breeder materials, as recognized recently by the International Thermonuclear Experi- mental Reactor (ITER) [9], to generate and recover both tritium and heat in the Fusion Reactor Blanket [10].
Applications such as neutron dosimetry and tritium breeding require very closely controlled properties. The present work re- ports on the production of Li-aluminate ceramics and the effect of boron oxide and alkali oxides content on material densiflca- tion and dielectric properties.
EXPERIMENTAL PROCEDURES
SPECIMENS
Five batches of high-alumina ceramic bodies were prepared from chemically pure mate- rials using different alkali, boron, and alu-
© Elsevier Science Publishing Co., Inc., 1993 MATERIALS CHARACTERIZATION 30:127-135 (1993) 655 Avenue of the Americas, New York, NY 10010 1044-5803/93/$6.00
128
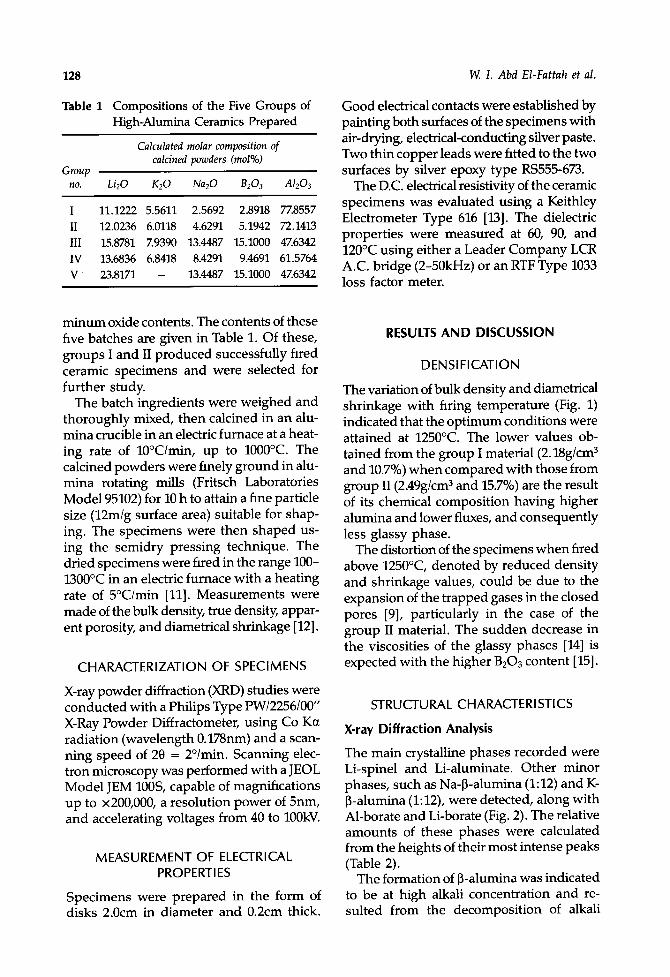
Table 1 Compositions of the Five Groups of High-Alumina Ceramics Prepared
Calculated molar composition of calcined powders (mol% )
Group no. Li20 K20 Na20 B203 Al203
I 11.1222 5.5611 2.5692 2.8918 77.8557 II 12.0236 6.0118 4.6291 5.1942 72.1413 III 15.8781 Z9390 13.4487 15.1000 47.6342 IV 13.6836 6.8418 8.4291 9.4691 61.5764 V 23.8171 - 13.4487 15.1000 4Z6342
W. I. Abd EI-Fattah et al.
Good electrical contacts were established by painting both surfaces of the specimens with air-drying, electrical-conducting silver paste. Two thin copper leads were htted to the two surfaces by silver epoxy type RS555-673.
The D.C. electrical resistivity of the ceramic specimens was evaluated using a Keithley Electrometer Type 616 [13]. The dielectric properties were measured at 60, 90, and 120°C using either a Leader Company LCR A.C. bridge (2-50kHz) or an RTF Type 1033 loss factor meter.
minum oxide contents. The contents of these five batches are given in Table 1. Of these, groups I and II produced successfully fired ceramic specimens and were selected for further study.
The batch ingredients were weighed and thoroughly mixed, then calcined in an alu- mina crucible in an electric furnace at a heat- ing rate of 10°C/min, up to 1000°C. The calcined powders were finely ground in alu- mina rotating mills (Fritsch Laboratories Model 95102) for 10 h to attain a hne particle size (12m/g surface area) suitable for shap- ing. The specimens were then shaped us- ing the semidry pressing technique. The dried specimens were fired in the range 100- 1300°C in an electric furnace with a heating rate of 5°C/rain [11]. Measurements were made of the bulk density, true density, appar- ent porosity, and diametrical shrinkage [12].
CHARACTERIZATION OF SPECIMENS
X-ray powder diffraction (XRD) studies were conducted with a Philips Type PW/2256/00" X-Ray Powder Diffractometer, using Co Ks radiation (wavelength 0.178nm) and a scan- ning speed of 20 = 2°/min. Scanning elec- tron microscopy was performed with a JEOL Model JEM 100S, capable of magnifications up to x200,000, a resolution power of 5nm, and accelerating voltages from 40 to 100kV.
MEASUREMENT OF ELECTRICAL PROPERTIES
Specimens were prepared in the form of disks 2.0cm in diameter and 0.2cm thick.
RESULTS AND DISCUSSION
DENSIFICATION
The variation of bulk density and diametrical shrinkage with firing temperature (Fig. 1) indicated that the optimum conditions were attained at 1250°C. The lower values ob- tained from the group I material (2.18g/cm 3 and 10.7%) when compared with those from group II (2.49g/cm 3 and 15.7%) are the result of its chemical composition having higher alumina and lower fluxes, and consequently less glassy phase.
The distortion of the specimens when fired above 1250°C, denoted by reduced density and shrinkage values, could be due to the expansion of the trapped gases in the closed pores [9], particularly in the case of the group II material. The sudden decrease in the viscosities of the glassy phases [14] is expected with the higher B203 content [15].
STRUCTURAL CHARACTERISTICS
X-ray Diffraction Analysis
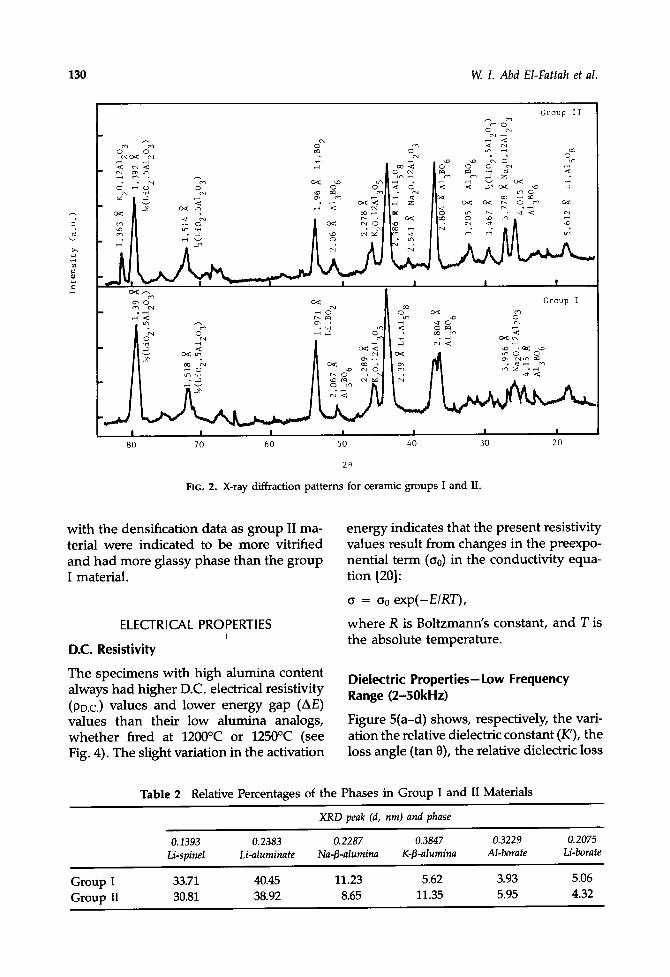
The main crystalline phases recorded were Li-spinel and Li-aluminate. Other minor phases, such as Na-~-alumina (1:12) and K- [~-alumina (1:12), were detected, along with Al-borate and Li-borate (Fig. 2). The relative amounts of these phases were calculated from the heights of their most intense peaks (Table 2).
The formation of ~-alumina was indicated to be at high alkali concentration and re- suited from the decomposition of alkali

Properties of Li-Aluminates 129
1 5 . 6 i \
- - 4 - - - - \ \ - - 2 . 7
1 5 . 2 -- 2 . 6
14 .8 - - 2 . 5
14.4 -- 2.4 ~ K
10.6 \ _2.3
.4
1 0 . 2 __ • - - 2 . 3
9.8 -- 2 . 2
9.4 _ ~ 2.1
9.0 I I I I I 2 o l l O 0 1 1 5 0 1200 125() 1~00
F i r i n g temperature ( ° C )
Fro. 1. Variation of shrinkage percent and bulk density as a function of firing temperatures. (0, ~) group I and (@, A) group II.
aluminates [16]. The mechanism of phase formation might have proceeded initially via Li-aluminate and Al-borate, followed by K- B-alumina and Na-~-alumina, probably at higher temperatures. The reactivity of the alkalis in alkali carbonate and alumina mix- tures is in the order Li > Na > K [17]. Boric oxide has been reported to be a good fluxing agent for the formation of B-alumina [18].
Microstructural Analysis
Scanning electron micrographs of groups I and II are shown in Fig. 3(a-d). It is appar- ent from Fig. 3(a, b) that the group I mate- rial is comprised mostly of randomly and loosely packed particles. By contrast, the
crystallites in the group II material are dis- tinguishably aligned in a specihc direction and in contact with each other, characteris- tic of the higher glass content [19]. The crys- tallization of some phases detected inside the pores yielded a more compact structure, resulting in the higher densihcation of this material.
These hndings were verified by scanning electron microscopy examination of the frac- ture surfaces obtained from both materials [Fig. 3(e, f)]. From these fractographs, the mean sizes of the round pores, and of those irregularly connected pores that had rounded ends, were calculated and corre- lated with the density values (Table 3).
These structural findings are in agreement
130 W. I. Abd EI-Fattah et al.
,q.
4 v
b
o ~
v < • ,'~ O < <
c N
!
Group I I ~ C
u~ C oO ~
o, o ~ o< Group I
. c.-) . .,-4 Lr~ < o c~
c oa .~ . , -~ o < c q
~ •
80 70 60 50 40 30 20
2~
FIG. 2. X-ray diffraction patterns for ceramic groups I and II.
wi th the densihcation data as group II ma- terial were indicated to be more vitrihed and had more glassy phase than the group I material.
ELECTRICAL PROPERTIES t
D.C. Resistivity
The specimens with high alumina content always had higher D.C. electrical resistivity (PD.C.) values and lower energy gap (AE) values than their low alumina analogs, whether fired at 1200°C or 1250°C (see Fig. 4). The slight variation in the activation
energy indicates that the present resistivity values result from changes in the preexpo- nential term (o0) in the conductivity equa- tion [20]:
o = Oo e x p ( - E / R T ) ,
where R is Boltzmann's constant, and T is the absolute temperature.
Dielectric Properties-Low Frequency Range (2-50kHz)
Figure 5(a-d) shows, respectively, the vari- ation the relative dielectric constant (K'), the loss angle (tan 0), the relative dielectric loss
Table 2 Relative Percentages of the Phases in Group I and II Materials
XRD peak (d, nm) and phase
O. 1393 0.2383 0.2287 0.3847 0.3229 0.2075 Li-spinel Li-aluminate Na-~-alumina K-[J-alumina Al-borate Li-borate
Group I 33.71 40.45 11.23 5.62 3.93 5.06 Group II 30.81 38.92 8.65 11.35 5.95 4.32

Properties of Li-Aluminates 131
(a) (b)
I0 ~m
(c) (d)
I0 ~Im I0 ~m
(e) (0
FIG. 3. Scanning electron surfaces of group I (a, b) and group II (c, d). Scanning electron fractograph of group I (e) and group II (f).

132
Table 3 Pore Sizes, Densities, and Porosities of Group I and II Materials
Round pore True Bulk True
A[203 size density density porosity a Group (wt. %) (#m) (g/cm 3) (g/cm 3) (%)
I 80.245 2.033 2.74 2 .17 20.80 II 71.796 1.725 2 .76 2.49 9.78
a True p o r o s i t y = [1 - (bulk d e n s i t y / t r u e dens i ty) ] x 100.
constant (K"), and the A.C. resistivity (0A.C.) with frequency (f) over the range 2-50kHz. These parameters were measured for both ceramic groups at three temperatures: 60, 90, and 120°C.
The results indicate that these dielectric properties were independent of temperature for both groups within the frequency range form 2-50kHz. Moreover, while K', PAC., and tan 0 were all three frequency-dependent, the first two properties decreased as the fre-
W. I. Abd EI-Fattah et al.
quency increased, whereas tan 0 increased. On the other hand, the loss constant, K", initially increased with frequency before reaching a peak value, after which it slowly decreased [Fig. 5(c)]. The K" peak values were recorded at frequencies of 13 and 13.75kHz for groups I and II, respectively.
The frequency location of the loss peaks and their magnitude suggest an apprecia- ble interfacial polarization [21]. The high- conductivity crystals of f~-aluminas, because of their open crystal structure, give rise to Maxwell-Wagner-Sillars interfacial polariza- tion [22]. The lower magnitude of the loss peak coincides with the decreased volume fraction of the conducting [~-alumina crystal- lites in the group II material.
The higher dielectric loss of the group I material, compared to that of the group II material, is compatible with its higher po- rosity and with its higher Li- and K-~- aluminate content, whose phases are known to suffer higher dielectric losses [23]. Poros-
i0 I'
o
v
~-'i01_"
1012
o6
Group I
//
G r o u p II
I o6
I I " I I I I I 25 26 27 28 29 30 31
I I I I i t t 25 26 27 28 29 30
1 0 4 / T (K -1)
FIG. 4. Dependence of D.C. resistivity for Li-alurninates on reciprocal temperature of group I (@,O) and group II (A,~) .

Properties of Li-Aluminates 133
10 20 30 40
Frequency (kHz)
(a)
50
2.0
,<
1.0
O. 0
]O 20 30 40
Frequency (kHz)
(b)
50
. 4
2
(c)
I I I I 0 I 0 20 30 40 50
Frequency (kHz)
20
< 18
=
16
I I I I io ZO 3O 4O
Frequency (kHz)
(d)
Fie. 5. Dependence of the relative dielectric constant, K' (a); loss angle, tan 6 (b); relative dielectric loss constant, K" (c); and A.C. resistivity, PA.c. (d) for group I (©) and group II (@) on frequency.
ity reduces dielectric loss, especially below 200°C, as a result of moisture retention in the submicroscopic pores. The substitution of K or Li ions for Na ions causes a shift toward higher resistivity [24] of the substi- tuted ~-alumina.
The corresponding relaxation times, (= 1/21Ifp, where fp is the value of the fre- quency at the peak position), calculated from the results obtained in Fig. 5(c), are 1.224 x 10 -5 and 1.157 x 10 -5 s for groups I and II, respectively. Relaxation processes indicate the presence of transitional mechanisms possibly corresponding to the alkali and bo- ron ions [25].
Dielectric Properties-High Frequency Range (200-500kHz)
The results of the tests in the high frequency range are shown in Fig. 6 and indicate that each group possessed its own specific be- havior, reflecting its particular structural characteristics.
The group I material had K' values that were independent of both frequency and temperature [Fig. 6(a)]. However, the values of tan 6, K', and Oa.c. were clearly temper- ature dependent, the first two increasing as
the temperature increased while the resis- tivity decreased [Fig. 6(b-d)].
By contrast, the values of all four proper- ties for the group II material showed only a very small dependence on temperature, and all but the resistivity were insensitive to changes in the frequency. The PA.C. val- ues suffered a decrease amounting to 50.3% as the frequency rose from 200 to 450kHz. This enhanced conductivity appeared to be due to an increase in the preexponential fac- tor (Co) because no change in the activation energy could be detected.
CONCLUSIONS
Several high-alumina ceramics containing Li-~-alumina and Li aluminate, with variable alkali and boron contents, have been pre- pared and the structural characteristics and electrical properties of two of them assessed. The results indicated that optimum vitrifica- tion parameters are attained at 1250°C. The presence of boron oxide enhanced densihca- tion, probably through more liquid formation with lower viscosity• The variations in dielec- tric properties correlate well with changes in the microstructures and densification.

134 W. I. Abd El-Fattah et al.
i0
8
10
8
group I 0.02 m
:," o o l
group I I ~ oup 11 -- 0.01 g r
I I I I o.oc I I I I 200 300 400 500 2~0 300 400 500
frequency (kHz) frequency (kHz)
°-~ II-- o ~ ~ ~. ~ ~ -
I O.ip group I
O. roup [I
| 0 . 0 |
18 - Rroup I
groun I I
I I I 16 I I I 200 300 400 500 200 300 400 500
frequency (kHz) frequency (kHz)
FIG. 6. Dependence of the dielectric parameters on frequency for both groups measuring at 60°C (x), 90°C (A), and 120°C (O).
R e f e r e n c e s
1. W. G. Osiris, Radiation effect on ceramics and glasses in the system alkali-aluminum-boron oxides for the application in radiation dosimetry, Ph.D. Thesis, Faculty of Science, Cairo University, Egypt (1987).
2. G. Marinello, C. Barret, and J. P. Le Bourgeois, Lith- ium borate discs for skin dose measurements: ap- plications to total body superficial electron beam therapy, Nucl. Instr. Meth. 175:198-200 (1980).
3. M. A. Fadel, Wafa I. Abdel-Fattah, M. B. E1-Kohli, and R. A. Abd-Alla, Neutron damage of ultralow- expansion whitewares, Sci. Ceramics 14:333 (1989).
4. R. C. De Vries and W. L. Roth, Critical evaluation of the literature data on beta-alumina and related phases. I. Phase equilibria and characterization of beta-alumina phases, ]. Am. Ceram. Soc. 52:364-379 (1969).
5. C. R. Peters, M. Bettman, J. W. Moore, and M. D. Click, Refinement of the structure of sodium ~- alumina, Acta Cryst. See. B 27:1826C (1971).
6. W. L. Roth, Crystallography of superionic conduc- tors, Trans. Am. Cryst. Assoc. 11:51-61 (1975).
7. J. B. Bates, R. Frech. Emgstrom, J. C. Wang, and T. Kaneda, Infrared absorption and Raman scatter- ing from water in sodium lithium (Nal_xLix) ]~- aluminas, Solid State Ionics 1:15 (1980).
8. G. Flor, M. Marini, V. Massarotti, and M. Villa, Resistivity of ~-aluminas with water, Solid State Ion- ics 2:195 (1981).
9. W. I. Abdel-Fattah and A. A. EI-Kolali, Production of ~-alumina bodies and their volume resistivity, Sprechsaal 6:361 (1977).
10. G. Alvani and S. Gasadio, Ceramic process versus property optimization of lithium aluminate as tri- tiurn breeding material, 7th CIMTEC World Ceramic Congress, Italy (June 24-30, 1990).
11. W. I. Abdel-Fattah and M. Z. Mostafa, Formation and stability of sodium ~-alumina, Z. Anorg. Allg. Chem. 453:284-292 (1977).
12. Standard Test Method for Apparent Pososity, Water Absorption, Apparent Specific Gravity, and Bulk Density of Burned Refractory Brick and Shapes by Boiling Water, ASTM C-20, American Society for Testing and Materials, Philadelphia, PA (1979).
13. A. E. Owen, Electronic conduction mechanisms in glasses, Glass Industry 8:637-642 (1967).
14. E. M. Levin, H. E McMurdie, and F. P. Hall, Phase Diagram for Ceramists, American Ceramic Society, Westerville, OH (1956).
15. W.: A. Weyl, A contribution to the constitution of alumino and borosilicate glasses, Cent. Glass Ceram. Res. Bull. 9:49 (1962).
16. R. Ryshkewitch, Oxide Ceramics-Physical Chemis- try and Technology, Academic Press, New York (1960).
17. E.K. Belyaev and V. F. Annopol'skii, Comparative study of the reactivity of lithium, sodium and po- tassiurn carbonates and hydroxides in a mixture with aluminium oxide, Russian J. Inorganic Chem- istry (English trans.) 17:1078-1081 (1972).
Properties of Li-Aluminates 135
18. W. I. Abdel-Fattah and A. A. E1-Kolali, Effect of four fluxing oxides on some physical and electrical properties of porcelain, J. Aust. Ceram. Soc. 15:14-19 (1979).
19. Electron Microscopy in Mineralogy, H. R. Wenk et al., eds., Springer-Verlag, New York (1976).
20. C. Kittel, Introduction to Solid State Physics, 5th ed., John Wiley, New York (1976).
21. N. Weber and J. T. Kummer, Sodium-sulfur sec- ondary battery, Int. Soc. Energy Conversion Eng. Conf., Advanced Energy Conversion Eng. Group, American Society of Mechanical Engineers, New York, pp. 913-916 (1967).
22. L.L. Hench, Dielectric relaxation in material analy-
sis, Adv. Tech. Mater. Invest. Fabr., Proc. 14th Ann. Symp. Soc. Aerosp. Mat. Proc. Eng., I-2-2 (1968).
23. G. S. Perry, Effects of impurities on high tempera- ture X-band dielectric properties of sintered alu- mina, Trans. Br. Ceram. Soc. 69:177-182 (1970).
24. H. R. Radzilowski, Y. E. Yao, and J. T. Kummer, "Dielectric loss of [3-alumina and ion-exchanged [3-alumina, J. Appl. Phys. 40:4716-4725 (1969).
25. P. L. Higby and I. E. Shelby, Properties of some simple glass/ceramic systems, J. Am. Ceram. Soc. 6~;:445-449 (1984).
Received March 1992; accepted September 1992.