debugging and profiling with arm tools - nerscdebugging by discipline debugging a problem is much...
TRANSCRIPT

© 2018 Arm Limited
• Ryan Hulguin• 4/21/2018
Debugging and Profiling with Arm
Tools

2 © 2018 Arm Limited
Agenda
• Introduction to Arm Tools
• Remote Client Setup
• Debugging with Arm DDT
• Other Debugging Tools
• Break
• Examples with DDT
• Lunch
• Profiling with Arm MAP
• Examples with MAP
• Obtaining Support
© 2018 Arm Limited
Introduction to Arm HPC Tools
4 © 2018 Arm Limited
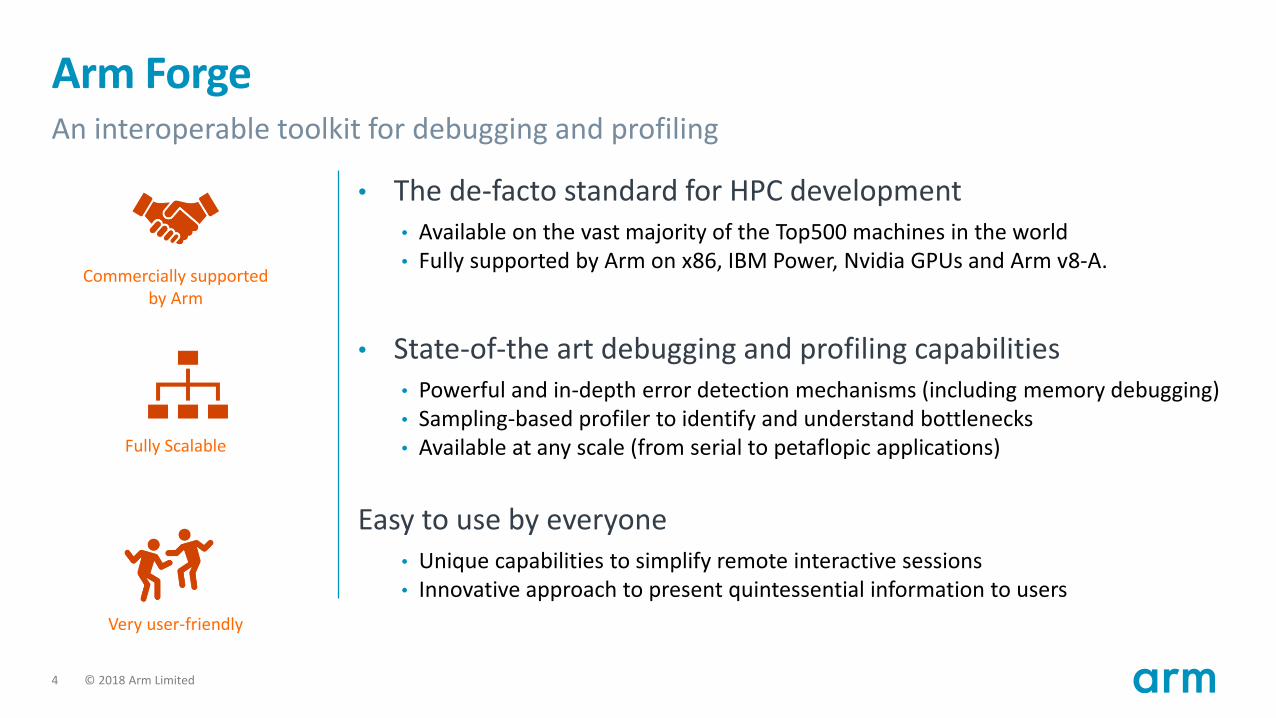
Arm ForgeAn interoperable toolkit for debugging and profiling
• The de-facto standard for HPC development• Available on the vast majority of the Top500 machines in the world• Fully supported by Arm on x86, IBM Power, Nvidia GPUs and Arm v8-A.
• State-of-the art debugging and profiling capabilities• Powerful and in-depth error detection mechanisms (including memory debugging)• Sampling-based profiler to identify and understand bottlenecks• Available at any scale (from serial to petaflopic applications)
Easy to use by everyone• Unique capabilities to simplify remote interactive sessions• Innovative approach to present quintessential information to users
Very user-friendly
Fully Scalable
Commercially supportedby Arm

5 © 2018 Arm Limited
Arm Performance ReportsCharacterize and understand the performance of HPC application runs
Gathers a rich set of data• Analyses metrics around CPU, memory, IO, hardware counters, etc.• Possibility for users to add their own metrics
• Build a culture of application performance & efficiency awareness• Analyses data and reports the information that matters to users • Provides simple guidance to help improve workloads’ efficiency
• Adds value to typical users’ workflows• Define application behaviour and performance expectations• Integrate outputs to various systems for validation (e.g. continuous integration)• Can be automated completely (no user intervention)
Relevant adviceto avoid pitfalls
Accurate and astuteinsight
Commercially supportedby Arm

6 © 2018 Arm Limited
Software tools-centric view
Arm Forge
ANALYZE
(Arm Performance
Reports)
DEBUGGING
(Arm DDT)
PERFOPTIMIZATION
(Arm MAP)
Demand for software efficiency
Debug/optimize, edit, commit, build, repeat
Demand for developer efficiency
Version Control(e.g. GIT, etc…)
Continuous Integration(e.g. Jenkins, etc.)
Open Interfaces(e.g. JSON APIs) DB
NEW VERSION
© 2018 Arm Limited
Using Forge and the remote client
8 © 2018 Arm Limited
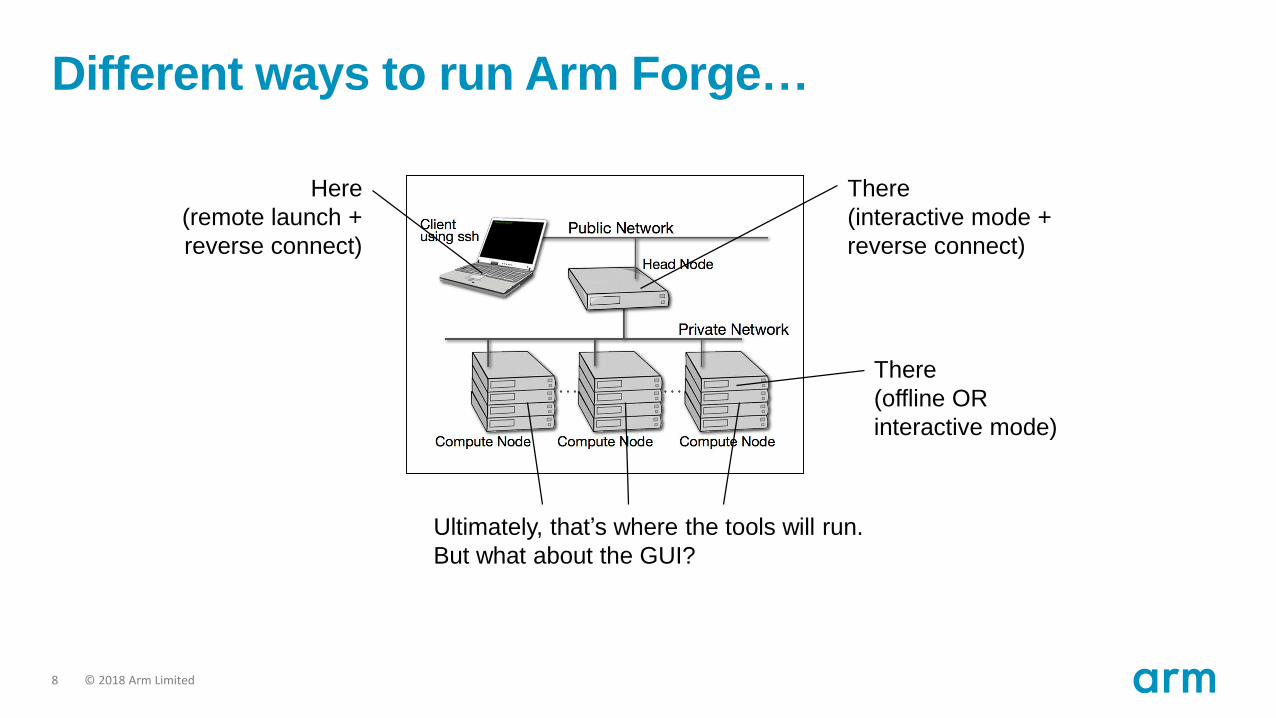
Different ways to run Arm Forge…
Ultimately, that’s where the tools will run.
But what about the GUI?
There
(interactive mode +
reverse connect)
There
(offline OR
interactive mode)
Here
(remote launch +
reverse connect)

9 © 2018 Arm Limited
Forge Remote Client
• The latest version of Forge can be downloaded fromhttps://developer.arm.com/products/software-development-tools/hpc/downloads/download-arm-forge
• It is important to have the remote client version match what is installed on the system

10 © 2018 Arm Limited
Forge Remote Client
http://www.nersc.gov/users/software/performance-and-debugging-tools/ddt/
© 2018 Arm Limited
Debugging with Arm DDT

12 © 2018 Arm Limited
Print statement debugging
• The first debugger: print statements• Each process prints a message or value at
defined locations
• Diagnose the problem from evidence and
intuition
• A long slow process• Analogous to bisection root finding
• Broken at modest scale• Too much output – too many log files
x
f(x)

13 © 2018 Arm Limited
Typical types of bugs
• Steady and dependable, I’ll be there for you.
BOHRBUG
• Oh, you are debugging? Let me hide for a sec!
HEISEN BUG
• Chaos is my name and you shall fear me.
MANDEL BUG
• I am buggy AND not buggy. How about that?
SCHRODINBUG
14 © 2018 Arm Limited
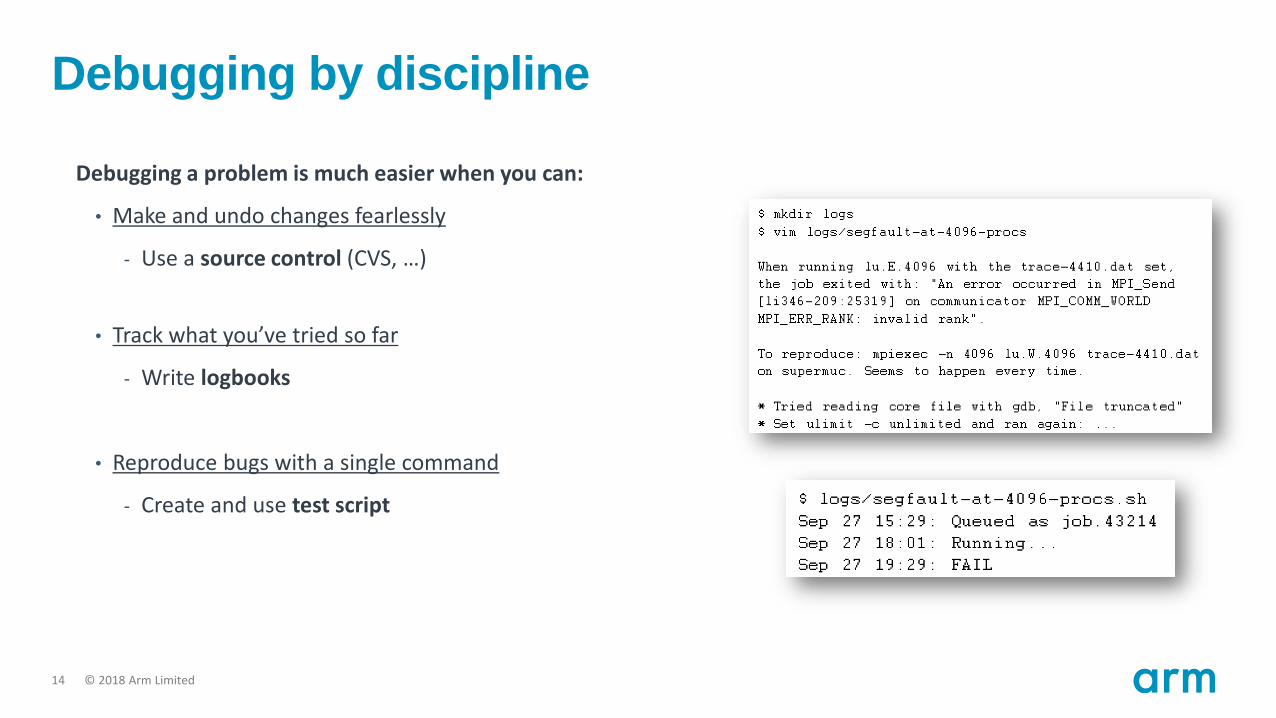
Debugging by discipline
Debugging a problem is much easier when you can:
• Make and undo changes fearlessly
- Use a source control (CVS, …)
• Track what you’ve tried so far
- Write logbooks
• Reproduce bugs with a single command
- Create and use test script
15 © 2018 Arm Limited
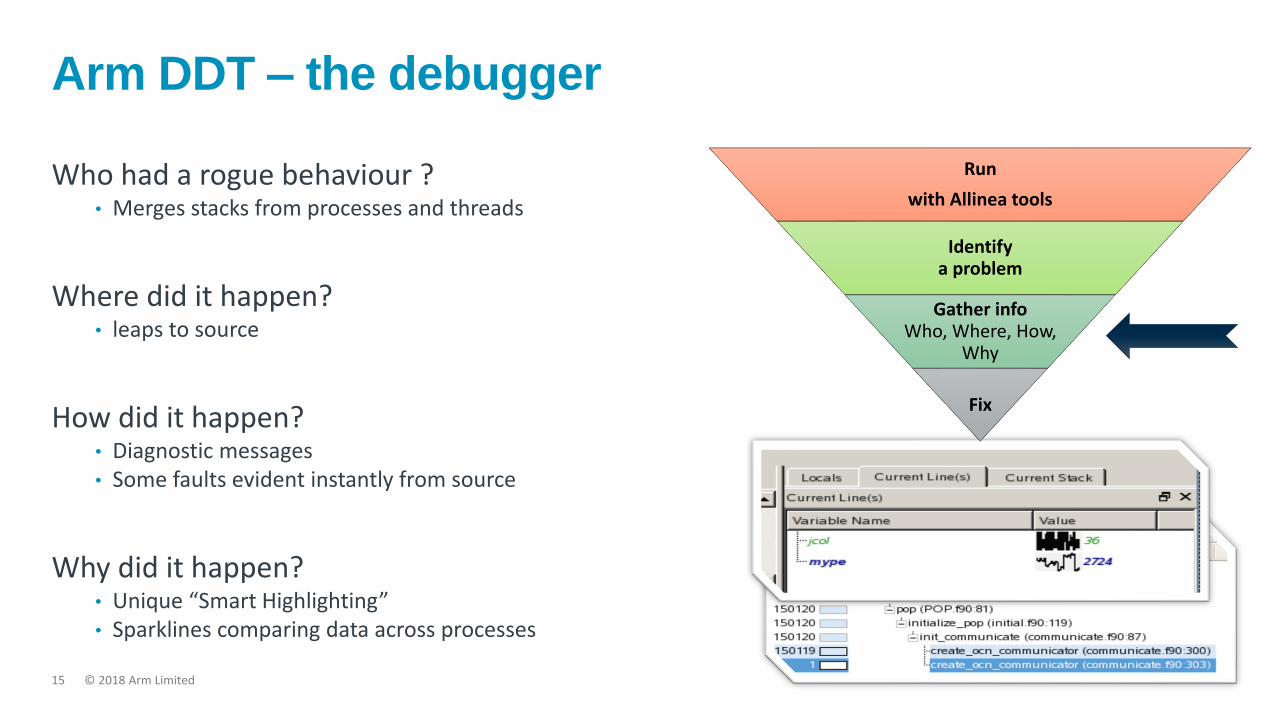
Arm DDT – the debugger
Who had a rogue behaviour ?• Merges stacks from processes and threads
Where did it happen? • leaps to source
How did it happen? • Diagnostic messages• Some faults evident instantly from source
Why did it happen?• Unique “Smart Highlighting”• Sparklines comparing data across processes
Run
with Allinea tools
Identify a problem
Gather infoWho, Where, How,
Why
Fix

16 © 2018 Arm Limited
Arm DDT cheat sheet
Load the environment module (on Cori/Edison)• $ module load allinea-forge
Prepare the code• $ cc -O0 -g myapp.c –o myapp.exe
Start Allinea DDT in interactive mode• $ ddt srun -n 8 ./myapp.exe arg1 arg2
Or use the reverse connect mechanism• On the login node:
• $ ddt &• (or use the remote client)• Then, edit the job script to run the following command and submit:
• ddt --connect srun -n 8 ./myapp.exe arg1 arg2
© 2018 Arm Limited
Examples
18 © 2018 Arm Limited
Example Files
• Once connected to cori, download the examples to your home directory
• cp /project/projectdirs/training/DebugProfile_201804/NERSC_Training.tar.gz ~/

© 2018 Arm Limited
DDT Demonstration
© 2018 Arm Limited
Exercise:
Fixing a simple crash
21 © 2018 Arm Limited
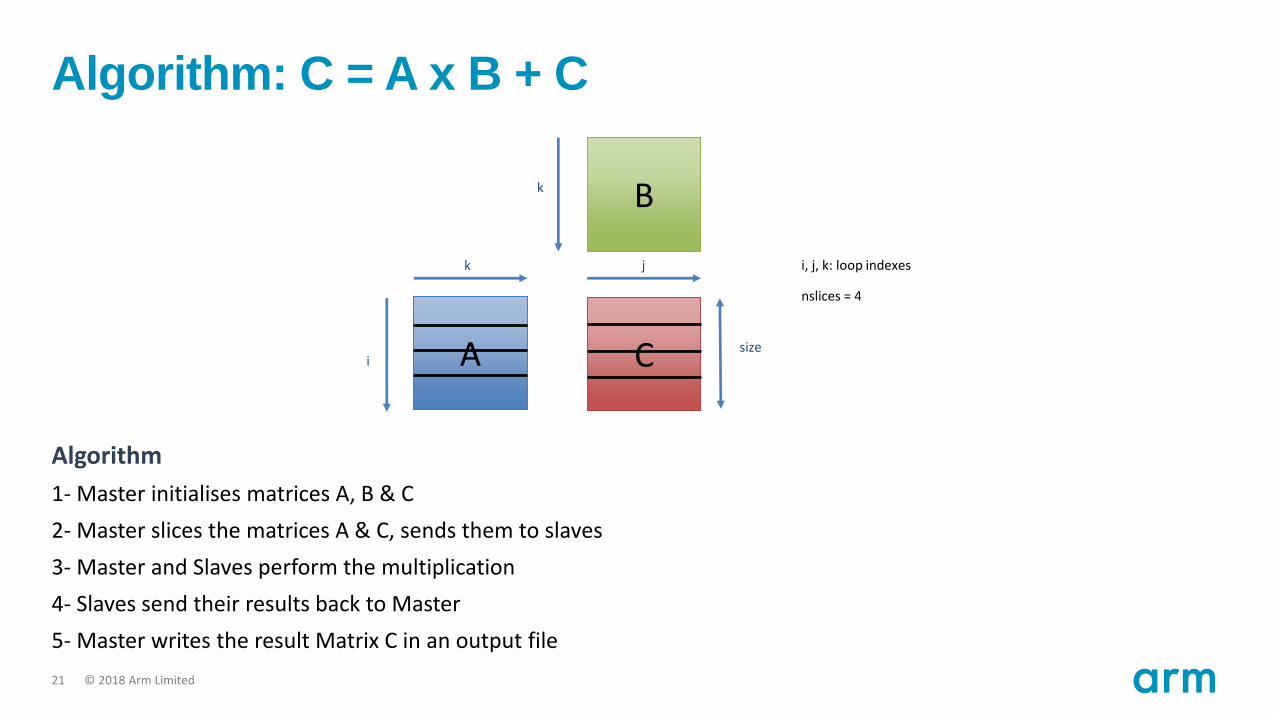
Algorithm: C = A x B + C
Algorithm
1- Master initialises matrices A, B & C
2- Master slices the matrices A & C, sends them to slaves
3- Master and Slaves perform the multiplication
4- Slaves send their results back to Master
5- Master writes the result Matrix C in an output file
k
k
i A
B
C size
j i, j, k: loop indexes
nslices = 4
22 © 2018 Arm Limited
Fix a simple crash in a MPI code
Objectives:
• Discover Arm DDT’s interface
• Debug a simple crash in a MPI application interactively
• Use the tool in a cluster environment
Key commands:
• Compile the application: $ make
• Clean and recompile for debugging: $ make clean && make DEBUG=1
• Use the debugger with reverse connect
• Accept the incoming connection!
• Can you find out and fix the bug?
© 2018 Arm Limited
Exercise:
Identifying Out-of-MemoryAccesses

24 © 2018 Arm Limited
Critical memory crash
Objectives:
• Use the memory debugging feature
• Diagnose and fix a memory problem
Key commands:
• Compile the application with debugging flags: $ make
• Recompile using the memory debugging library (statically link through Makefile LFLAGS)
• Enable memory debugging in the “Run window”
• Change the amount of checks, enable guard pages
• Can you see the memory issue can you fix it?

© 2018 Arm Limited
Exercise:
Understanding hangs
26 © 2018 Arm Limited
Deadlock
Objectives:
• Witness a deadlock and attach to the running processes• Use Arm DDT Stack feature• Use Arm DDT evaluation window
Key commands:
• Compile with: $ make• Submit the job to run the application with 10 processes: it works.• Run it again with 8 processes: it hangs!• Leave the application run in the queue and attach to it with the debugger• OR (if attaching is not supported) Submit the job again with the debugger• Observe where it hangs. Can you fix the problem?
© 2018 Arm Limited
Exercise:
Detecting memory leaks

28 © 2018 Arm Limited
Memory leaks
Objectives:• Use Arm DDT’s offline mode
• Use the memory debugging feature
• Diagnose and fix a memory leak problem
Key commands:• Compile the application for debugging
$ make
• Edit a job script to use the debugger in offline mode with memory debugging on and submit the job
• Open the resulting *.html file
• Can you see the memory leak?
• Restart the debugger in interactive mode. Can you see any hint from the debugger?
© 2018 Arm Limited
Profiling with Arm MAP
30 © 2018 Arm Limited
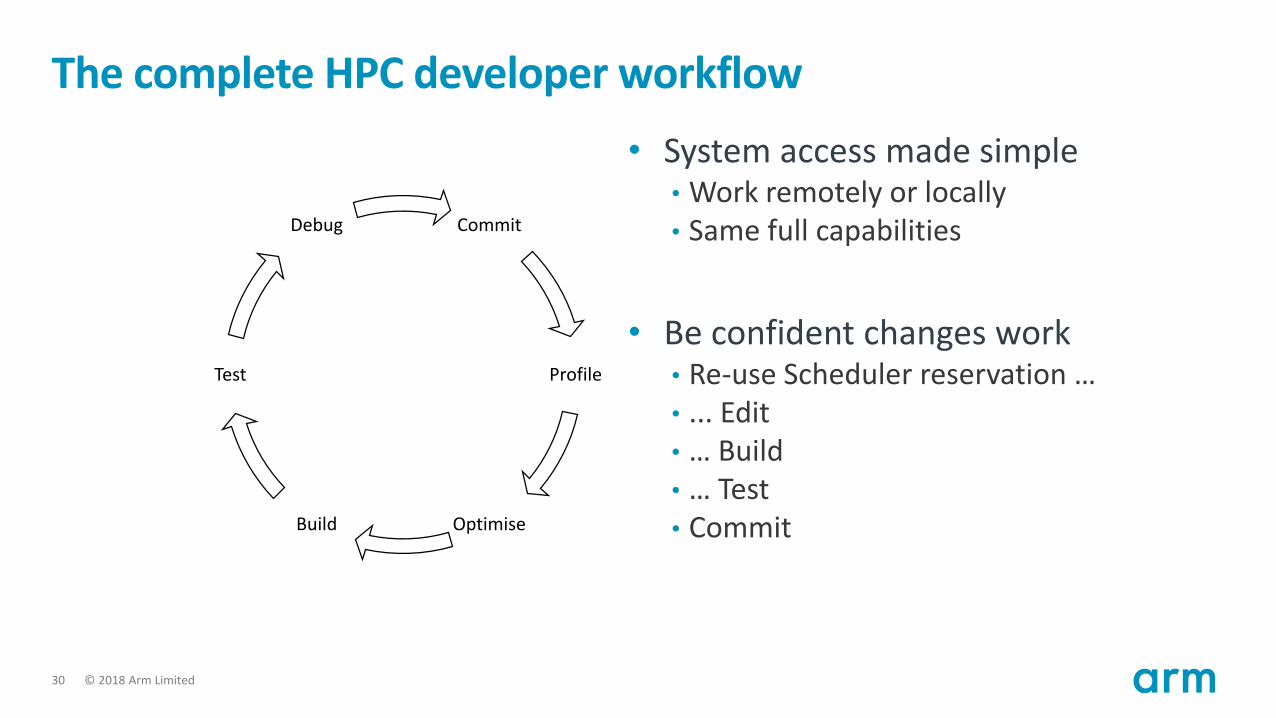
The complete HPC developer workflow
Commit
Profile
OptimiseBuild
Test
Debug
• System access made simple• Work remotely or locally• Same full capabilities
• Be confident changes work• Re-use Scheduler reservation …• ... Edit• … Build• … Test• Commit
31 © 2018 Arm Limited
Why profiling?
How to improve the performance of an application?
Profiling: a form of dynamic program analysis that measures, for example, the space (memory) or time complexity of a program, the usage of particular instructions, or the frequency and duration of function calls. Most commonly, profiling information serves to aid program optimization.
(Wikipedia)
How?– Select representative test case(s)– Profile– Analyse and find bottlenecks– Optimise– Profile again to check performance results and iterate

32 © 2018 Arm Limited
How to profile?
Different methods• Tracing
–Records and timestamps all operations–Intrusive
• Instrumenting–Add instructions in the source code to collect data–Intrusive
• Sampling–Automatically collect data–Not intrusive

33 © 2018 Arm Limited
Some types of profiles
Hotspot
• One function corresponds to more 80% of the runtime
• Large speed-up potential
• Best optimisation scenario
Spike
• The application spends most of the time in a few functions
• Speed-up potential depends on the aggregated time
• Variable optimisation time
Flat
• Runtime split evenly between numerous functions, each one with a very small runtime
• Little speed-up potential without algorithmic changes
• Worst optimisation scenario
34 © 2018 Arm Limited
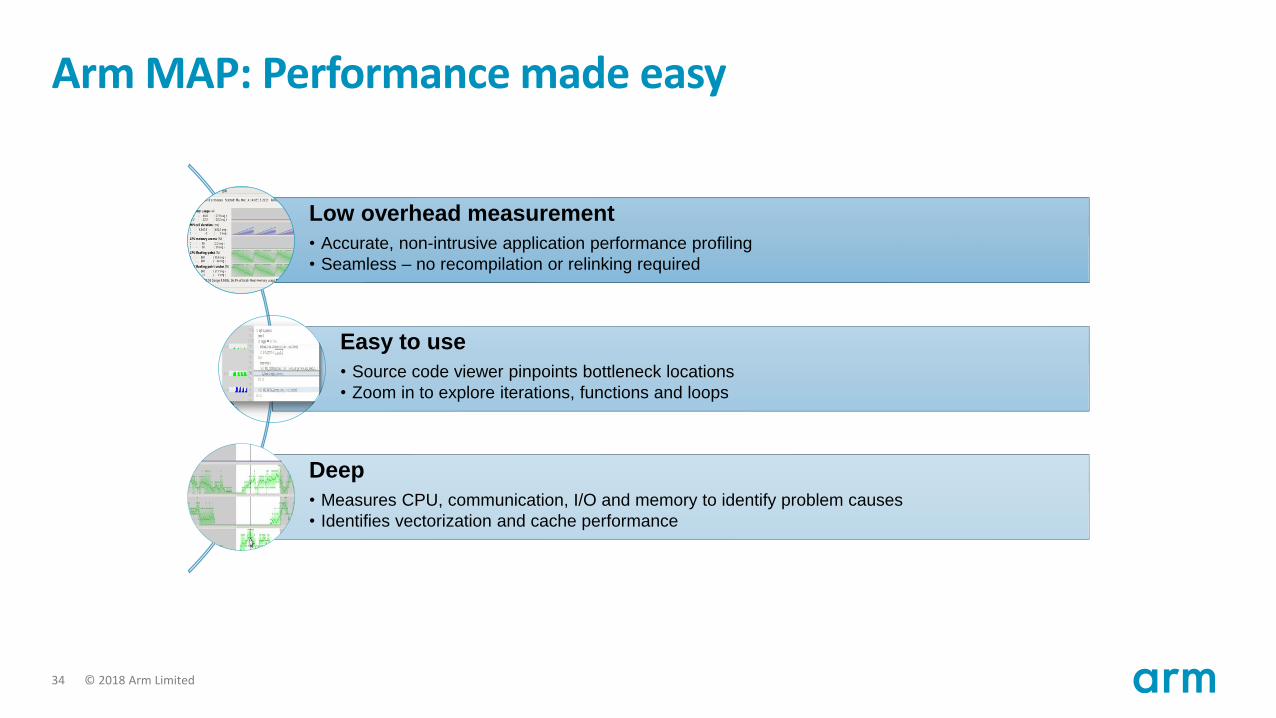
Arm MAP: Performance made easy
Low overhead measurement
• Accurate, non-intrusive application performance profiling
• Seamless – no recompilation or relinking required
Easy to use
• Source code viewer pinpoints bottleneck locations
• Zoom in to explore iterations, functions and loops
Deep
• Measures CPU, communication, I/O and memory to identify problem causes
• Identifies vectorization and cache performance

35 © 2018 Arm Limited
Arm MAP cheat sheet
Load the environment module• $ module load allinea-forge
Prepare the code• $ cc –O3 -g myapp.c –o myapp.exe
Edit the job script to run Arm MAP in “profile” mode• $ map --profile srun ./myapp.exe arg1 arg2
Open the results• On the login node:
• $ map myapp_Xp_Yn_YYYY-MM-DD_HH-MM.map• (or load the corresponding file using the remote client connected to the remote system or locally)

36 © 2018 Arm Limited
Typical memory hierarchy
Registers
L1 Cache
L2 Cache
L3 Cache
Main memory
Size (bytes)Latency from next
level (cycles)192
32k
256k
2M
2G
4
12
26
230-360
?
Example of Intel Sandy Bridge

37 © 2018 Arm Limited
Speeding up memory accesses
High performance is possible when:• There is an opportunity for cache re-use
• Data is local to the core for quick usage
• CPU gets data from memory to cache before it is actually needed
Registers
L1 Cache
L2 Cache
L3 Cache
Main memory
CPUs
DATA
STREAM

38 © 2018 Arm Limited
Memory access patterns
Data locality• Temporal locality: use of data within a short time of its last use• Spatial locality: use memory references close to memory already referenced
Temporal locality examplefor (i=0 ; i < N; i++) {
for (loop=0; loop < 10; loop++) {… = … x[i] …
}}
Spatial locality examplefor (i=0 ; i < N*s; i+=s) {
… = … x[i] …}

39 © 2018 Arm Limited
Memory Accesses and Cache Misses• for(i=0; i<n; i++) {
• for(j=0; j<n; j++) {
• A[i*n+j]=…
• }
• }
i=0, n=4
j=0 j=1
for(i=0; i<n; i++) {
for(j=0; j<n; j++) {
A[j*n+i]=…
}
}
A
Ai=0, n=4
j=0
HIT
MISSj=1

© 2018 Arm Limited
Exercise:
Optimizing memory accesses
41 © 2018 Arm Limited
Resolve high memory accesses issues
Objectives:
• Discover Arm MAP’s interface
• Profile the MPI matrix multiplication example and find out the performance issue
• Use the tool in a cluster environment
Key commands:
• Compile the application
$ make
• $ map --profile srun myApp.exe
• Open the result in the GUI on the login node once the job has completed
$ map *.map
• What is the bottleneck of the application? Can you identify performance problems?

© 2018 Arm Limited
Resolving workload imbalances
43 © 2018 Arm Limited

44 © 2018 Arm Limited
Load balancing in theory
Balancing the workload is critical because:– Processors may be idle for an extended period of time
– They could have been doing some work instead of burning energy
Examples of load balancing• Owner computes
Balance done through data distribution
• Independent tasks
Balance done through prediction/statistics
• A mix of various components
Balance between scalar workload and communications (for instance)
45 © 2018 Arm Limited
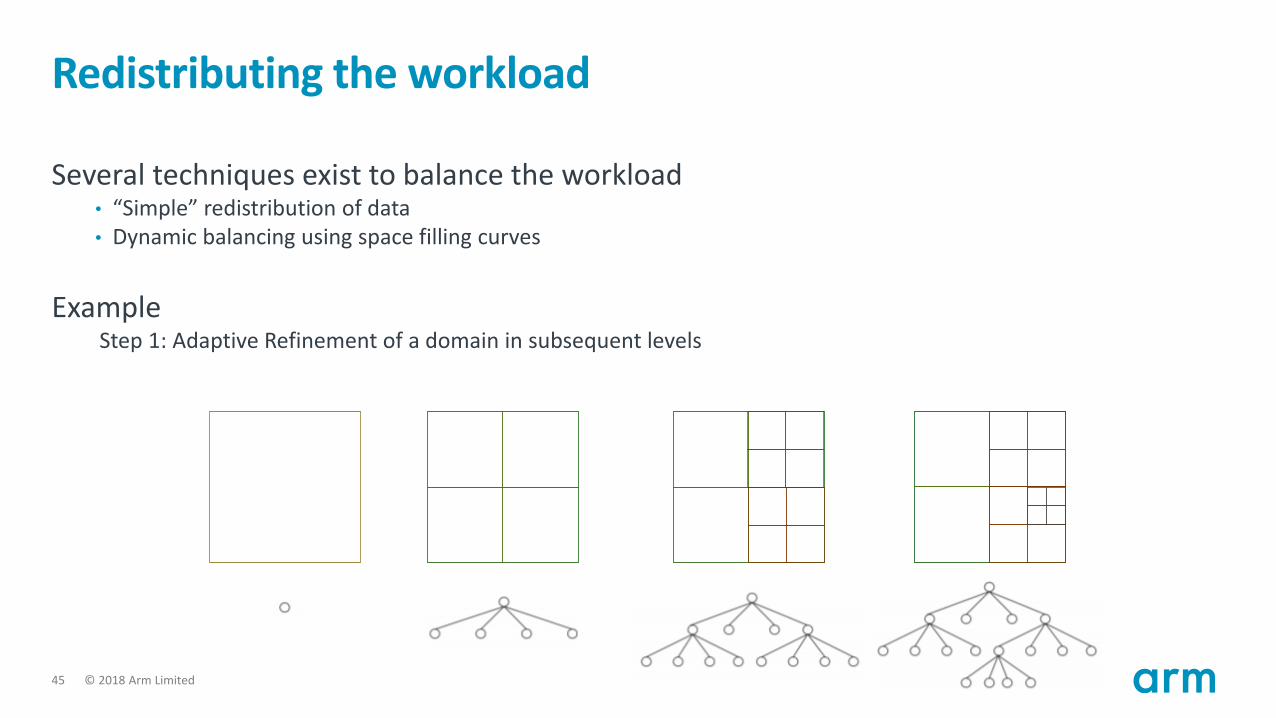
Redistributing the workload
Several techniques exist to balance the workload• “Simple” redistribution of data• Dynamic balancing using space filling curves
ExampleStep 1: Adaptive Refinement of a domain in subsequent levels
46 © 2018 Arm Limited
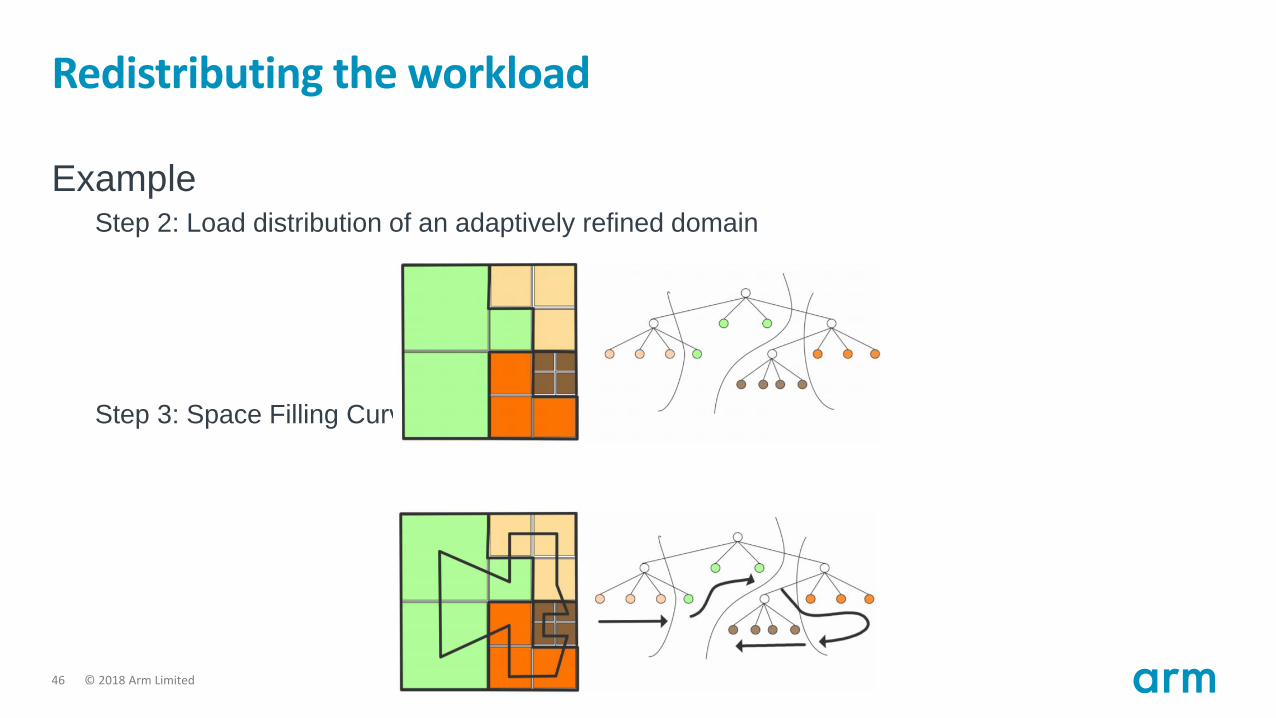
Redistributing the workload
ExampleStep 2: Load distribution of an adaptively refined domain
Step 3: Space Filling Curve for the load balanced tree
47 © 2018 Arm Limited
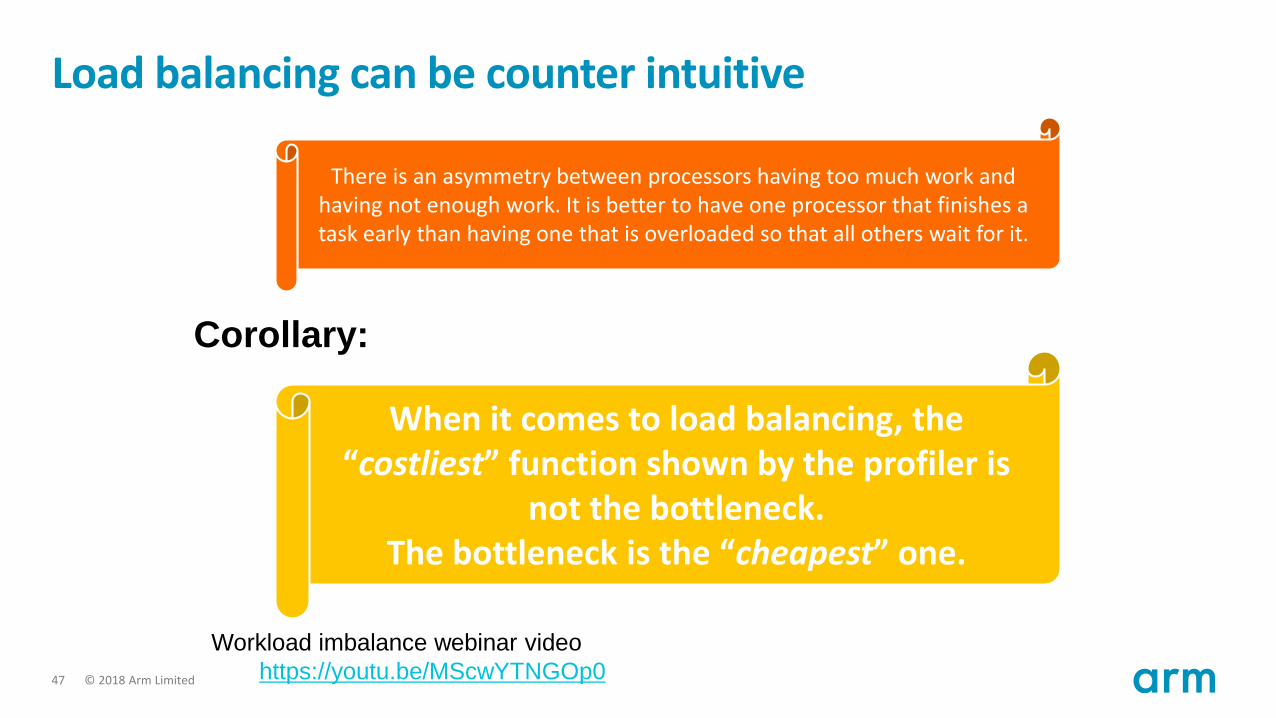
Load balancing can be counter intuitive
Corollary:
There is an asymmetry between processors having too much work and having not enough work. It is better to have one processor that finishes a task early than having one that is overloaded so that all others wait for it.
When it comes to load balancing, the “costliest” function shown by the profiler is
not the bottleneck. The bottleneck is the “cheapest” one.
Workload imbalance webinar video
https://youtu.be/MScwYTNGOp0

© 2018 Arm Limited
Exercise:
Improving IOs

49 © 2018 Arm Limited
Detect workload imbalance and optimise IO
Objectives:
• Exhibit the workload imbalance in the code (on 1 or 2 nodes)
• Make suggestions to fix the problem
Key commands:
• Compile the application
$ make
• $ map --profile srun -n 8 ./myApp.exe
• Open the profiling results in the GUI on the login node once the job has completed
$ map *.map
• How can you fix the imbalance problem?
© 2018 Arm Limited
Maximizing application efficiency with Performance Reports
51 © 2018 Arm Limited
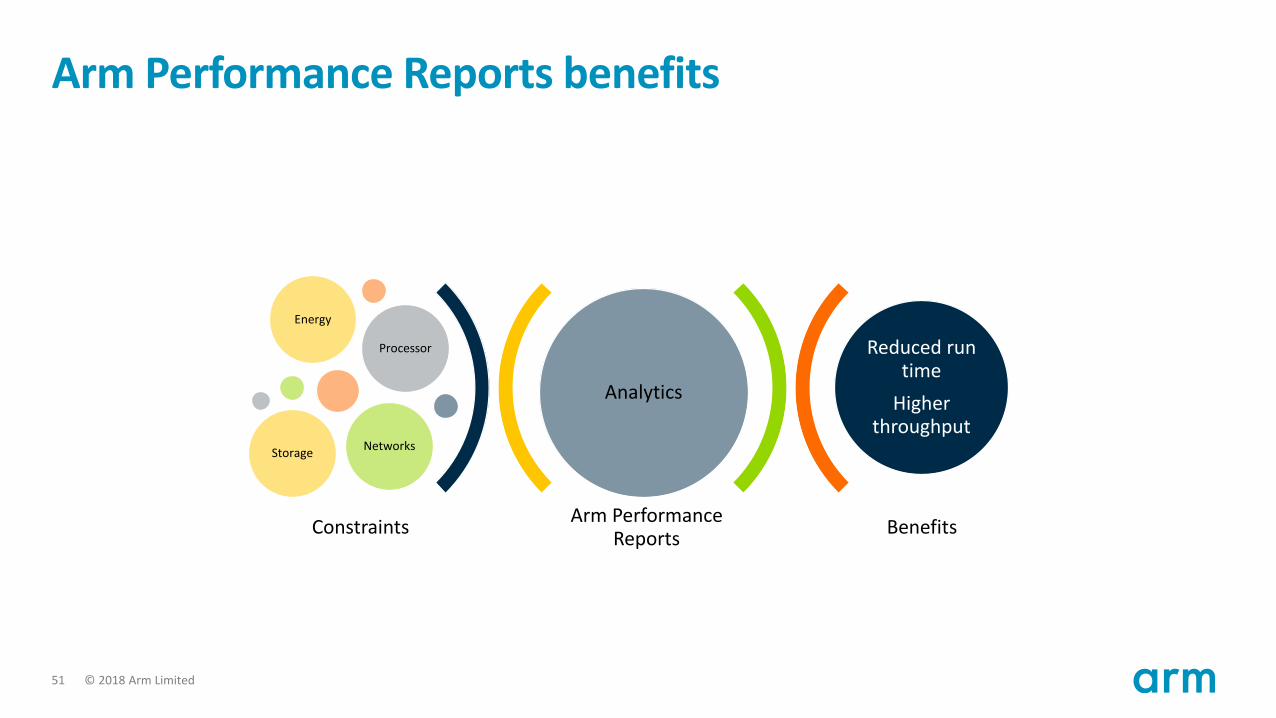
Arm Performance Reports benefits
Arm Performance Reports
Benefits
Analytics
Energy
Processor
StorageNetworks
Reduced run time
Higher throughput
Constraints

52 © 2018 Arm Limited
“Learn” with Arm Performance Reports
Very simple start-up
No source code needed
Fully scalable, very low overhead
Rich set of metrics
Powerful data analysis

53 © 2018 Arm Limited
Metrics overview
Multi-threaded parallelism
SIMDparallelism
Loadimbalance
OMP efficiency
System usage
54 © 2018 Arm Limited
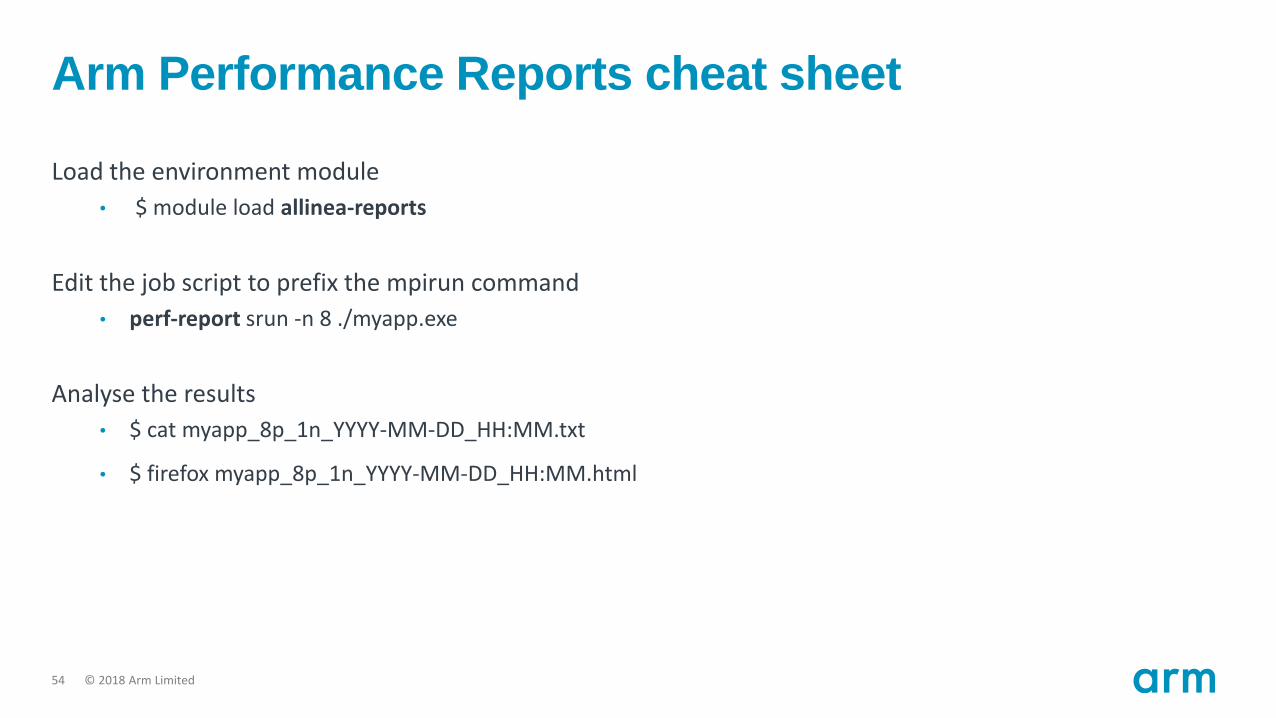
Arm Performance Reports cheat sheet
Load the environment module
• $ module load allinea-reports
Edit the job script to prefix the mpirun command
• perf-report srun -n 8 ./myapp.exe
Analyse the results
• $ cat myapp_8p_1n_YYYY-MM-DD_HH:MM.txt
• $ firefox myapp_8p_1n_YYYY-MM-DD_HH:MM.html

© 2018 Arm Limited
Exercise:
Maximizing scientific output

56 © 2018 Arm Limited
Maximise efficiency
Objectives:
• Generate a performance report of a simple code
• Find the best parameters to maximize the application efficiency
– Compilation flags
– Number of processes
– Number of nodes
Key commands:
• Compile:
$ make
• $ perf-report srun -n 8 ./myapp.exe

© 2018 Arm Limited
User Guide

58 © 2018 Arm Limited
Forge User Guide
• Online documentation is always available athttps://developer.arm.com/products/software-development-tools/hpc/documentation
• Direct link to DDT User Guidehttps://developer.arm.com/docs/101136/latest/ddt
• Local user guide is available in your Forge installation/path/to/arm/forge/doc/userguide-forge.pdf

© 2018 Arm Limited
Obtaining Support
60 © 2018 Arm Limited
Obtaining Support
• For simple queries, use the web form athttps://www.arm.com/products/development-tools/hpc-tools/contact-support
• For more advanced issues, email [email protected] allows you attach screenshots, source code, and debug log files
© 2018 Arm Limited
Debug Log Files

62 © 2018 Arm Limited
Debug Log Files
• In the event that DDT crashes or does not work like expected, a debug log file will be helpful to the arm support team
• Debug log files can be generated by passing arguments to DDT
• For Example:
ddt --debug --log=crash.log aprun -n 16 ./myProgram.exe

© 2018 Arm Limited
Q&A

6464
Thank YouDankeMerci谢谢ありがとうGraciasKiitos감사합니다धन्यवादתודה
© 2018 Arm Limited