d1.1 review of new forms of mobility, freight distribution
TRANSCRIPT

@Harmony_H2020
#harmony-h2020
D1.1 Review of new forms of mobility, freight distribution and their business models; gaps
identification in KPIs and SUMPs
Holistic Approach for Providing Spatial & Transport Planning Tools and Evidence to Metropolitan and Regional Authorities to Lead a Sustainable Transition to a New Mobility Era
Submission date: 31/10/2019

D1.1 Review of new forms of mobility, freight distribution and their business models; gaps identification in KPIs and SUMPs
1
SUMMARY SHEET
PROJECT
Project Acronym: HARMONY Project Full Title: Holistic Approach for Providing Spatial & Transport Planning
Tools and Evidence to Metropolitan and Regional Authorities to Lead a Sustainable Transition to a New Mobility Era
Grant Agreement No. 815269 (H2020 – LC-MG-1-2-2018) Project Coordinator: University College London (UCL) Website www.harmony-h2020.eu
Starting date June 2019
Duration 42 months
DELIVERABLE
Deliverable No. - Title D1.1 Review of new forms of mobility, freight distribution and their business models; gaps identification in KPIs and SUMPs
Dissemination level: Public Deliverable type: Report Work Package No. & Title: WP1 - HARMONY conceptual framework Deliverable Leader: TRT
Responsible Author(s): TRT: Angelo Martino, Francesca Fermi, Stefano Borgato, Simone Bosetti; UAEGEAN: Ioanna Pagoni, Ioannis Tsouros, Amalia Polydoropoulou
Responsible Co-Author(s): UoW: Panagiotis Georgakis, Angelica Salas ; Aimsun: Tamara Djukic ; TUD: Ioanna Kourounioti, Michiel de Bok ; UCL-MaaSLab: Lampros Yfantis, Andreas Schäfer ; UCL-CASA: Michael Batty, Thomas Evans, Ed Manley ; ICCS: Babis Magoutas, Efthimios Bothos, Gregoris Mentzas ; AIRBUS: Mark Biell, Dirk Schindler ; GRIFF: Hans Petter Førde TNO : Tariq van Rooijen, Comune di Torino : Giuseppe Estivo, Michela Pollone, Gemeente Rotterdam : JRichard van der Wulp, Jos Streng, Marc Seij, Oxfordshire County Council : George Economides, Sridhar Raman, OASA Athens: Nellie Tzivelou, E-Trikala : Georgios Klonaris, Odisseas Raptis, Vassilios Apostolakoulis, Loukas Vavitsas, Athanasios Ballis, Elena Patatouka, Gornoslasko-Zaglebiowska Metropolia : Wojciech Skrzypek, Municipality of Hellinikon-Argyroupoli, : Ioannis Konstantatos
Peer Review: Quality Assurance Committee Review:
Submission Date:
DOCUMENT HISTORY
Version Date Released by Nature of Change
0.1 08/10/2019 TRT (UAGEAN) Initial version to reviewers 0.2 15/10/2019 Aimsun, TNO Revisions and comments
0.3 22/10/2019 UAEGEAN Revised version section A 0.4 23/10/2019 TRT Final version

D1.1 Review of new forms of mobility, freight distribution and their business models; gaps identification in KPIs and SUMPs
2
TABLE OF CONTENTS
EXECUTIVE SUMMARY ..................................................................................................................... 9
Introduction ..................................................................................................................................... 10
Project Summary ......................................................................................................................... 10
Objectives of the deliverable ...................................................................................................... 11
Structure of the deliverable ........................................................................................................ 11
SECTION A: NEW MOBILITY SERVICES AND TECHNOLOGIES .................................................. 13
A1. New mobility technologies .................................................................................................. 13
A1.1 Introduction ...................................................................................................................... 13
A1.2 New mobility technologies for passengers .................................................................... 13
A1.2.1 Connected vehicles for passengers ............................................................................................ 13
A1.2.2 Autonomous Vehicles for passengers ........................................................................................ 13
A1.2.3 Air taxis ........................................................................................................................................ 14
A1.3 New mobility technologies for freight ............................................................................ 16
A1.3.1 Autonomous Vehicles for freight ................................................................................................. 16
A1.3.2 Delivery bots................................................................................................................................ 17
A1.3.3 Drones for freight ........................................................................................................................ 18
A1.4 Data and Infrastructure needs for new mobility technologies ...................................... 18
A1.4.1 Data needs for new mobility technologies .................................................................................. 18
A1.4.2 Infrastructure needs for new mobility technologies ..................................................................... 19
A1.5 Final considerations ........................................................................................................ 20
A2. New mobility services .......................................................................................................... 21
A2.1 Introduction ...................................................................................................................... 21
A2.2 New mobility services for passengers ........................................................................... 21
A2.2.1 Vehicle-Sharing services ............................................................................................................. 21
A2.2.2 Ride-sharing services (Carpooling, On-demand Ride Services, Microtransit) ........................... 22
A2.2.3 Mobility as a Service ................................................................................................................... 24
A2.3 New mobility services for freight .................................................................................... 25
A2.3.1 Innovative freight delivery services ............................................................................................. 25
A2.3.2 Cargo bikes ................................................................................................................................. 26
A2.4 Final considerations ........................................................................................................ 27
A3. Inputs for the baseline scenarios for regional and transport planning ............................ 29
A3.1 New opportunities for urban mobility of the future ....................................................... 29
A3.2 Future scenarios and projected timeline ........................................................................ 31
A4. State-of-the-art models ........................................................................................................ 33
A4.1 Introduction ...................................................................................................................... 33
A4.2 Spatial and regional planning models ............................................................................ 34

D1.1 Review of new forms of mobility, freight distribution and their business models; gaps identification in KPIs and SUMPs
3
A4.2.1 Demographic forecasting models................................................................................................ 34
A4.2.2 Regional Economic models ......................................................................................................... 35
A4.2.3 Land Use Transport Interaction Models ...................................................................................... 36
A4.2.4 Land supply and development models ....................................................................................... 39
A4.2.5 Translators for aggregate to disaggregate models ..................................................................... 39
A4.2.6 Challenges and gaps .................................................................................................................. 40
A4.3 Agent-based simulation models for passengers ........................................................... 41
A4.3.1 Overview of Agent-Based models for passengers ...................................................................... 41
A4.3.2 Data requirements ....................................................................................................................... 43
A4.3.3 Challenges and gaps ................................................................................................................. 44
A4.4 Agent-based simulation models for freight .................................................................... 45
A4.4.1 Overview of models ..................................................................................................................... 45
A4.4.2 Methodologies ............................................................................................................................. 48
A4.4.3 Data requirements ....................................................................................................................... 48
A4.4.4 Challenges and gaps .................................................................................................................. 49
A4.5 Multimodal network models / Operational models ........................................................ 50
A4.5.1 Overview of Multimodal Dynamic Traffic Assignment models .................................................... 50
A4.5.2 Data requirements to build the network model for traffic simulation ........................................... 58
A4.5.3 Urban air network models ........................................................................................................... 59
A4.5.4 Challenges and gaps .................................................................................................................. 62
A4.6 Integrated spatial and transport planning models ......................................................... 63
A4.6.1 Overview of platforms ................................................................................................................. 63
A4.6.2 Integration Methodology-Data communications .......................................................................... 65
A4.6.3 Challenges and gaps .................................................................................................................. 66
A4.7 Final considerations ........................................................................................................ 67
A5. Review of existing metropolitan areas models .................................................................. 69
A5.1 Introduction ...................................................................................................................... 69
A5.2 Rotterdam ......................................................................................................................... 69
A5.3 Oxfordshire ....................................................................................................................... 70
A5.4 Athens ............................................................................................................................... 72
A5.5 Turin .................................................................................................................................. 73
A5.6 Final considerations ........................................................................................................ 74
A6. Considerations on new services, models and data requirements ................................... 76
A6.1 Advancements needed in different dimensions ............................................................ 76
A6.1.1 Infrastructure ............................................................................................................................... 76
A6.1.2 Regulatory and institutional issues.............................................................................................. 76
A6.1.3 Transport models ........................................................................................................................ 76
A6.1.4 Data needs .................................................................................................................................. 77
D1.1 Review of new forms of mobility, freight distribution and their business models; gaps identification in KPIs and SUMPs
4
A6.1.5 Expected challenges ................................................................................................................... 77
A7. References ........................................................................................................................... 78
SECTION B: REVIEW OF SUSTAINABLE URBAN MOBILITY PLANS, POLICY APPRAISAL METHODS AND KPIs ....................................................................................................................... 92
B1. The concept of Sustainable Urban Mobility Plans ............................................................. 92
B1.1 Introduction ...................................................................................................................... 92
B1.2 What are SUMPs about? .................................................................................................. 92
B1.3 How does a SUMP work? ................................................................................................ 93
B1.4 Principal benefits of SUMPs ............................................................................................ 94
B1.5 EC SUMP Guidelines........................................................................................................ 95
B1.5.1 The SUMP Guidelines 2013 edition ............................................................................................ 95
B1.5.2 The last update of the SUMP guidelines ..................................................................................... 96
B2. Policy appraisal in urban planning ..................................................................................... 97
B2.1 Policy appraisal process for SUMPs .............................................................................. 97
B2.2 Policy appraisal methodologies ...................................................................................... 98
B2.2.1 Comparison of CBA and MCA .................................................................................................... 99
B2.2.2 Simplified methods .................................................................................................................... 100
B3. Key Performance Indicators .............................................................................................. 101
B3.1 Introduction .................................................................................................................... 101
B3.2 Choosing indicators for SUMPs .................................................................................... 101
B3.3 Indicator categories ....................................................................................................... 102
B3.4 Examples of indicators to measure sustainable mobility in urban areas .................. 102
B3.5 Key performance indicators in the HARMONY project ................................................ 105
B4. References ......................................................................................................................... 106
SECTION C: SUMPs AND SPATIAL AND TRANSPORT STRATEGIES OF THE HARMONY METROPOLITAN AREAS .............................................................................................................. 108
C1. Introduction ........................................................................................................................ 108
C2. Rotterdam ........................................................................................................................... 108
C2.1. The metropolitan area ................................................................................................ 108
C2.2. Overview of urban planning ...................................................................................... 110
C2.3. Key elements of the SUMP ........................................................................................ 110
C2.3.1. The planning process ................................................................................................................ 110
C2.3.2. The set of measures ................................................................................................................. 111
C3. Oxfordshire county ............................................................................................................ 112
C3.1. The metropolitan area ................................................................................................ 112
C3.2. Overview of urban planning ...................................................................................... 113
C3.3. Key elements of the SUMP ........................................................................................ 114
C3.3.1. The planning process ................................................................................................................ 114

D1.1 Review of new forms of mobility, freight distribution and their business models; gaps identification in KPIs and SUMPs
5
C3.3.2. The set of measures ................................................................................................................. 116
C4. Turin .................................................................................................................................... 117
C4.1. The metropolitan area ................................................................................................ 117
C4.2. Overview of urban planning ...................................................................................... 118
C4.3. Key elements of the SUMP ........................................................................................ 118
C4.3.1. The planning process ................................................................................................................ 118
C4.3.2. The set of measures ................................................................................................................. 120
C5. Athens ................................................................................................................................ 121
C5.1. The metropolitan area ................................................................................................ 121
C5.2. Overview of urban planning ...................................................................................... 122
C5.3. Key elements of the SUMP ........................................................................................ 123
C5.3.1. The planning process ................................................................................................................ 123
C5.3.2. The set of measures ................................................................................................................. 125
C6. Trikala ................................................................................................................................. 126
C6.1. The metropolitan area ................................................................................................ 126
C6.2. Overview of urban planning ...................................................................................... 127
C6.3. Key elements of the SUMP ........................................................................................ 128
C6.3.1. The planning process ................................................................................................................ 128
C6.3.2. The set of measures ................................................................................................................. 129
C7. Upper Silesian-Zaglebe ..................................................................................................... 130
C7.1. The metropolitan area ................................................................................................ 130
C7.2. Overview of urban planning ...................................................................................... 131
C7.3. Key elements of the SUMP ........................................................................................ 132
C7.3.1. The planning process ................................................................................................................ 132
C7.3.2. The set of measures ................................................................................................................. 133
ANNEXES ....................................................................................................................................... 135
Annex 1 - Detailed review of regional economic models ............................................................ 136
Annex 2 - LUTI Models .................................................................................................................. 138
The Essential Logic of LUTI Models ......................................................................................... 138
Past and Contemporary Classifications and Reviews of LUTI Models .................................. 139
Detailed review of the LUTI Models .......................................................................................... 142
Annex 3 - Detailed review of service controllers for passengers operations optimization ...... 154

D1.1 Review of new forms of mobility, freight distribution and their business models; gaps identification in KPIs and SUMPs
6
LIST OF TABLES
Table 1. Overview of air taxis’ services .............................................................................................. 15 Table 2. Main characteristics of Autonomous Vehicles for freight ...................................................... 16 Table 3. Main characteristics of delivery bots .................................................................................... 17 Table 4. Main characteristics of drones for freight .............................................................................. 18 Table 5. Data needs for new mobility technologies ............................................................................ 19 Table 6. Infrastructural needs for new mobility technologies .............................................................. 19 Table 7. Main characteristics of car sharing, bike-sharing and e-scooters. ........................................ 22 Table 8. Overview of ridesharing initiatives around the world............................................................. 24 Table 9. Main elements of MaaS ....................................................................................................... 25 Table 10. Main elements of Innovative freight delivery services ......................................................... 25 Table 11. Overview of cargo bike implementation in Europe ............................................................. 27 Table 12. Population synthesizers ..................................................................................................... 35 Table 13. Overview of the existing Regional Economic models and their key functionalities .............. 36 Table 14. A List of the LUTI Models Reviewed .................................................................................. 37 Table 15. Examples of Activity-Based transport simulation models ................................................... 42 Table 16. Freight ABM models overview ........................................................................................... 47 Table 17. Data requirements for the freight agent-based simulation models ...................................... 49 Table 18. Research attempts to evaluate the impact of new mobility service operations in service and network performance ......................................................................................................................... 54 Table 19. Overview of transport freight models .................................................................................. 55 Table 20. Data requirements needed for estimation and application of freight transport models. ....... 55 Table 21. Overview of noise models .................................................................................................. 57 Table 22. Data requirements needed for application of noise models ................................................ 58 Table 23. Overview of data required for building use case's network models in HARMONY .............. 58 Table 24. Overview of data to be considered when considering future UAM services ........................ 61 Table 25. HARMONY MS application and data availability for Rotterdam .......................................... 69 Table 26. HARMONY MS application and data availability for Oxfordshire ........................................ 71 Table 27. HARMONY MS application and data availability for Athens ............................................... 72 Table 28. HARMONY MS application and data availability for Turin .................................................. 73 Table 29. Overview of transport simulation models in HARMONY project. ........................................ 75 Table 30. Strengths and weaknesses of policy appraisal methods .................................................. 100 Table 31. Key performance indicators of the SUMI project .............................................................. 104 Table 32. Indicative KPIs that could be estimated within HARMONY model suite............................ 105 Table 33: Action lines and measures of the SUMP of the Oxfordshire county .................................. 116 Table 34: Action lines and measures of the SUMP of the Turin metropolitan area ........................... 120 Table 35: Selected examples of measures of the SUMP of the municipality of Helliniko- Argyroupoli ........................................................................................................................................................ 125 Table 36: Service controllers for passengers operations optimization .............................................. 154
D1.1 Review of new forms of mobility, freight distribution and their business models; gaps identification in KPIs and SUMPs
7
LIST OF FIGURES
Figure 1. The HARMONY conceptual architecture ............................................................................. 10 Figure 2. Examples of autonomous vehicles for passengers (From left to right: The Smart Electric Van of ARRIVAL; Waymo driver-less car, which began as the Google Self-Driving Car Project in 2009; Tesla Autopilot) ................................................................................................................................. 14 Figure 3: Air taxis for passenger transfer (from left to right: Vahanna, City Airbus, Volocopte, Uber Air) .......................................................................................................................................................... 15 Figure 4. Semi-autonomous and autonomous vans and trucks (From left to right: Arrival, TU Simple, Semi-Tesla, Vera-Volvo, Embark truck) ............................................................................................. 16 Figure 5. Examples of delivery bots from left to right: Starship Robots, Kiwibot, FedEx SameDay bot, Amazon Scout ................................................................................................................................... 17 Figure 6. Examples of automated delivery vans (Continental and Anymal- left, Nuro-right) ............... 17 Figure 7 UAVs for freight (From left to right: Griff135, Amazon Prime, DP DHL) ................................ 18 Figure 8. Car sharing services in North America (left) and Europe (middle) (based on CSA, 2019) and bike sharing schemes worldwide as of December 2017(right) (Roland Berger, 2018) ....................... 21 Figure 9. Projected timeline of the new services and technologies .................................................... 32 Figure 10: Land Use - Transport Feedback Cycle (Wegener and Fürst, 1999) .................................. 33 Figure 11. The Urban Model Family Tree (EUNOIA, 2013). ............................................................... 37 Figure 12. A taxonomy of traffic simulation models with corresponding network loading models adopted ............................................................................................................................................. 52 Figure 13. Flight routes (corridor network) over smart cities and at airports ....................................... 60 Figure 14. Physical and network model representation of a UAM system (Rothfeld et al., 2018) ....... 62 Figure 15. Temporal Integration of Land-use and Transport Models .................................................. 65 Figure 16. Transport model Area for the Metropolitan Region Rotterdam Den Haag (MRDH). .......... 70 Figure 17. Area of Detailed Modelling and Fully Modelled Area for Oxfordshire Strategic Model (OSM) .......................................................................................................................................................... 71 Figure 18. Fully Modelled Area for Transportation Model of Athens metropolitan area ...................... 72 Figure 19. Homogenous zones and municipalities in the metropolitan area of Turin .......................... 73 Figure 20. The 12 Steps of Sustainable Urban Mobility Planning (SUMP 2.0) – A planner's overview. [October 2019] ................................................................................................................................... 94 Figure 21: Land-use map of greater Rotterdam (on the left) and location of the municipality of Rotterdam (on the right) ................................................................................................................... 108 Figure 22: Demographic trends in Rotterdam .................................................................................. 109 Figure 23: The mobility strategy of Rotterdam Urban Traffic Plan 2017 - 2030+ .............................. 111 Figure 24: Highway network in Oxfordshire in the morning peak in 2031 with no intervention (left) and the Oxford Green Belt (right) ........................................................................................................... 112 Figure 25: Oxford Neighbourhood Planning Toolkit ......................................................................... 115 Figure 26: The Turin metropolitan area ............................................................................................ 117 Figure 27: Attica Region and the Athens Public Transport Network ................................................. 121 Figure 28: The planned Hellinikon road network and the Hellinikon Master Plan ............................. 124 Figure 29: Geographical location of the city of Trikala ..................................................................... 126 Figure 30: Urban Transportation network integrated with main Bus Stops per direction ................... 127 Figure 31: The GZM Metropolitan area ............................................................................................ 130 Figure 32: Population of municipalities in the GZM metropolitan area .............................................. 130 Figure 33. Typical Structure for a LUTI Model ................................................................................. 139
D1.1 Review of new forms of mobility, freight distribution and their business models; gaps identification in KPIs and SUMPs
8
LIST OF ABBREVIATIONS
Abbreviation Explanation ABM Agent-Based Models ADA Aggregate-Disaggregate-Aggregate AGVs Automated Guided Vehicles ATC Air Traffic Control ATM Air Traffic Management AV Autonomous Vehicle BCR Benefit/Cost Ratio CAV Connected and Autonomous vehicles CBA Cost Benefit Analysis DTA Dynamic Traffic Assignment DUE Dynamic User Equilibrium EBA Economic Base Analysis EU European Union FHA Federal Highway Administration I-O Input-Output IPF Iterative Proportional Fitting ITDP Institute for Transportation and Development Policy ITS Intelligent Transportation Systems KPI Key Performance Indicators LIDAR LIght Detection And Ranging LTS London Transportation Studies Model LUTI Land Use Transport(ation) Interaction MaaS Mobility as a Service MCA Multi-Criteria Appraisal MSPs Mobility Service Providers M&E Monitoring and Evaluation NPV Net Present Value OD Origin-Destination OECD Organization for Economic Co-operation and Development PAV Personal Air Vehicles REM Regional economic models RP Revealed Preference SAE Society of Automotive Engineers SAV Shared Autonomous Vehicle SP Stated Preference SSA Shift-Share Analysis SUE Stochastic User Equilibrium SUMI Sustainable Urban Mobility Indicators SUMMA Sustainable Mobility, Policy Measures, and Assessment SUMP Sustainable Urban Mobility Plan SWIM System Wide Information Management TAZ Traffic or Transportation Analysis Zones TEN-T Trans-European Network-Transport TERM Transport and environment report mechanism UA Unmanned Aircraft UAM Urban Air Mobility UAS Unmanned Aircraft System UTM Unmanned Aircraft System Traffic Management VTOL Vertical Take-Off and Land WBCSD World Business Council for Sustainable Development ZE Zero Emission ZECL Zero Emission City Logistics

D1.1 Review of new forms of mobility, freight distribution and their business models; gaps identification in KPIs and SUMPs
9
EXECUTIVE SUMMARY
This deliverable aims to build a rich knowledge bank to be used as a basis for the discussion of key
topics with stakeholders and the definition of the conceptual HARMONY MS architecture. Three
different areas of analysis are covered: i) the new mobility technologies and services for
passenger and freight, complemented by the analysis of strategic, tactical and operational models
that are currently developed and used; ii) the policy appraisal methods, the KPIs, and SUMPs
guidelines that EU uses for regional spatial and transport planning has been conducted and iii) the
SUMPs and the spatial and transport strategies of the six HARMONY areas (Rotterdam,
Oxfordshire county, Turin, Athens, Trikala and Upper Silesian-Zaglebe).
The review the new mobility technologies and services for passenger and freight has been completed
by conducting extensive desk research on documents regarding the European Union’s strategies as
well as publications from individual researchers and research groups. This analysis is reported in
Section A, and it has been the basis to extrapolate the key input for the definition of baseline
scenarios for regional and transport planning. Having in mind the projected timeline of the new
services and technologies, different baseline scenarios have been defined for short-term (about 5
years), mid-term (up to 15 years from today), and long-term (15 to 30) years regional and transport
planning.
To complement the analysis, an extensive and comprehensive review of the state-of-the-art of for
multi-scale spatial and transport planning has been conducted. Considering that HARMONY’s
ultimate objective is to deliver a fully operational integrated land-use and transport simulation
platform, a few attempts to integrate and operationalize independent simulators have been presented.
The analysis of the Sustainable Urban Mobility Plans (SUMPs) guidelines is presented in Section B of
the report, identifying gaps and evaluating the validity of the process in the light of new mobility
services. An overview of policy appraisal methods used for regional spatial and transport planning is
also included, together with the analysis of Key performance indicators used to measure sustainable
mobility in urban areas.
Following the overview on SUMP and appraisal methods, the final section of the deliverable provides
a description of the status of spatial and transport strategies and SUMPs of the six HARMONY areas:
Rotterdam, Oxfordshire county, Turin, Athens, Trikala and Upper Silesian-Zaglebe. The picture
resulting from the analysis of the involved metropolitan areas is quite heterogeneous: in some cases a
SUMP has been developed and it is planned to be updated or integrated with action programmes for
specific aspects, in other cases it is under definition for the first time, while in some others similar
planning documents (sharing most of the basic principles) are being developed. In the document, for
each case study first a description of each metropolitan area is provided, then an overview of the
status of urban planning is reported, and finally the focus is on the key elements of the SUMP or the
similar planning document (depending case by case on the development stage).
D1.1 Review of new forms of mobility, freight distribution and their business models; gaps identification in KPIs and SUMPs
10
Introduction
Project Summary
HARMONY envisages developing a new generation of harmonised spatial and multimodal transport
planning tools which comprehensively model the dynamics of the changing transport sector and
spatial organisation, enabling metropolitan area authorities to lead the transition to a low carbon new
mobility era in a sustainable manner. Co-creation labs will be established in order for citizens,
authorities and industry to design together new mobility and spatial organisation concepts. At the
same time, demonstrations with electric AVs, and drones will take place to understand in real-life their
requirements. The HARMONY model suite will be designed to assess the multidimensional impacts of
the new mobility concepts and technologies, integrating land-use models (strategic/long-term), people
and freight activity based models (tactical/mid-term), and multimodal network (operational/short-term)
models allowing for vertical planning.
This integrated approach is useful for authorities to understand if policies are sustainable, while also
contribute to meeting COP22 targets, social equality and wellbeing. HARMONY's concepts and the
model suite will be applied and validated on six EU metropolitan areas on six TEN-T corridors:
Rotterdam (NL), Oxfordshire (UK), Turin (IT), Athens (GR), Trikala (GR), Upper Silesian-Zaglebie
Metropolis (PL).
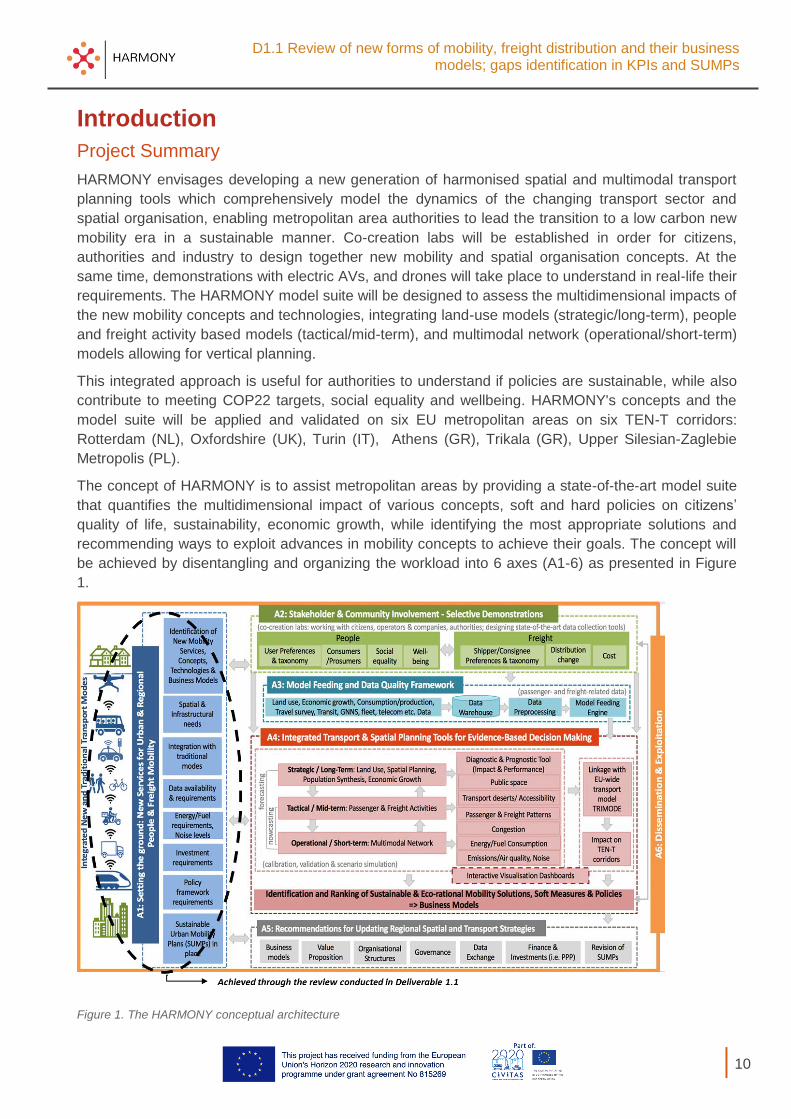
The concept of HARMONY is to assist metropolitan areas by providing a state-of-the-art model suite
that quantifies the multidimensional impact of various concepts, soft and hard policies on citizens’
quality of life, sustainability, economic growth, while identifying the most appropriate solutions and
recommending ways to exploit advances in mobility concepts to achieve their goals. The concept will
be achieved by disentangling and organizing the workload into 6 axes (A1-6) as presented in Figure
1.
Figure 1. The HARMONY conceptual architecture
D1.1 Review of new forms of mobility, freight distribution and their business models; gaps identification in KPIs and SUMPs
11
This deliverable contributes to the fulfilment of HARMONY Axis A1. This axis aims at building
consensus regarding the transport and spatial planning challenges that metropolitan areas face and
identify new mobility services, technologies and spatial planning options that could contribute to their
sustainability, economic growth liveability and citizen’s well-being.
The rich knowledge bank of this deliverable will be used as a basis for the future activities of the
project. More specifically, the outputs of this deliverable will be used to discuss with the stakeholders
at the HARMONY co-creation labs, as well as to conceptualize the whole HARMONY MS modelling
framework, architecture and design approach.
Objectives of the deliverable
The purpose of this deliverable D1.1 is to create a knowledge base of the future forms of mobility for
passenger and freight, present the strategic, tactical and operational models that are currently
developed and used, identify existing gaps and review the policy appraisal methods, the KPIs, and
SUMPs guidelines that EU uses for regional spatial and transport planning.
More specifically, this deliverable D1.1 aims to:
Identify the new mobility services and technologies for people and freight that are already or
will become available for urban, suburban and regional transport up to 2050;
Review the models that currently exist for spatial and regional planning: agent-based
simulation of passengers and freight, integrated land-use and transport modelling and
multimodal network models;
Present the models that are currently available at the HARMONY metropolitan areas;
Identify the gaps regarding the current state-of-practice and develop baseline scenarios for
regional and transport planning;
Review the KPIs and the policy appraisal methods that EU uses for regional spatial and
transport planning;
Analyse the SUMPs guidelines and glossary based on the identified new mobility and freight
distribution services, identifying gaps and checking the validity of the process;
Review the local SUMPs and the spatial and transport strategies of the six HARMONY areas.
Structure of the deliverable
This document is divided into three sections. Section A is focused on new mobility services and
technologies and is comprised of the following chapters:
Chapters A1 and A2 review the new mobility technologies and services for passenger and
freight. These chapters have been completed by conducting extensive desk research on
documents regarding the European Union’s strategies (e.g. STRIA Roadmap; EC, 2017) as
well as publications from individual researchers and research groups.
Chapter A3 provides input for the definition of baseline scenarios for regional and transport
planning.
Chapter A4 presents state-of-the-art strategic, tactical and operational models for multi-scale
spatial and transport planning.
Chapter A5 provides the main data of the Harmony metropolitan areas
Chapter A6 concludes Section A with the analysis of the main challenges.
Section B provides a review of policy appraisal methods, KPIs and SUMPs:

D1.1 Review of new forms of mobility, freight distribution and their business models; gaps identification in KPIs and SUMPs
12
Chapter B1 describes the SUMPs guidelines and glossary, identifying gaps and evaluating the
validity of the process in the light of new mobility services.
Chapter B2 provides an overview of policy appraisal methods used for regional spatial and
transport planning.
Chapter B3 analyse the role of Key performance indicators to measure sustainable mobility in
urban areas.
Section C is related to the review of the SUMPs and the spatial and transport strategies of the six
HARMONY areas. It is structured in 6 chapters, each related to a specific study area: Rotterdam,
Oxfordshire county, Turin, Athens, Trikala and Upper Silesian-Zaglebe.
Each section is complemented by a chapter devoted to the references.
Annexes are the last component of the deliverable.

D1.1 Review of new forms of mobility, freight distribution and their business models; gaps identification in KPIs and SUMPs
13
SECTION A: NEW MOBILITY SERVICES AND TECHNOLOGIES
A1. New mobility technologies A1.1 Introduction
The growing pressure on passenger and freight transport systems has increased the need for
innovative, sustainable and more efficient mobility solutions. This section reviews the state-of-the art
of these new mobility technologies for both freight and passenger transport. It also describes the data
and infrastructural needs for their seamless integration in the transport systems.
A1.2 New mobility technologies for passengers A1.2.1 Connected vehicles for passengers
Connected cars can be defined as the vehicles equipped with several devices that enable the
exchange of information between the car and its surroundings, either through local wireless networks
or via the internet (Lengton et al., 2015). The interactions made possible by this connectivity can
roughly be divided in three categories (Jadaan et al., 2017; Coppola and Morisio, 2016; Lengton et
al., 2015):
Vehicle-to-vehicle (V2V) communications, i.e. cars interacting with other cars;
Vehicle-to-infrastructure (V2I) communications, i.e. cars interacting with (roadside)
infrastructure and vice versa
Vehicle-to-device (V2X) communications, i.e. wireless communication to any device.
The connected vehicle concept is about supplying useful information to the driver (e.g. potentially
dangerous situations to avoid) to help drive safer, avoid real-time hazards, drive more comfortably
make more informed decisions (KPMG International, 2016; Jadaan et al., 2017). It is composed of the
following distinct product categories (Lengton et al., 2015): (i) Safety, with the aim to protect driver,
passenger and road user safety (e.g. avoid crashes, warning systems for traffic jams, or adverse
weather conditions); (ii) Vehicle management, aiding the driver in reducing operating costs and
improving ease of use (e.g. dynamic vehicle service reminders, vehicle condition information); (iii)
Mobility management, aiming at improving traffic flow and allowing drivers travel quickly, safely and in
a cost-efficient manner; (iv) Driver’s comfort, including applications that impact a driver’s comfort,
ability and fitness to drive. The information can be provided to the driver either as light warnings in the
instrument panel, dashboard messages or alerts, voice warnings, while drivers could even feel the
signals through vibration of their seat (Jin and Orosz, 2014). Section A1.4 presents the data and
infrastructural needs for the connected vehicles to operate.
A1.2.2 Autonomous Vehicles for passengers
Autonomous vehicles1 (AVs) are vehicles that are equipped with a variety of technologies (radars,
global positioning systems, cameras, sensors, etc.) and can sense the road environment and
navigating without driver effort (Howard and Dai, 2014; Zmud and Sener, 2017). They are
independent vehicles meaning that can safely operate with the existing infrastructure using on-board
sensors (such as the Google and Tesla trials). The Society of Automotive Engineers (SAE)
1 The terms “self-driving” and “driverless” vehicles have been also used to refer to driving automation systems. Based on SAE (2014), the terms Automated Driving Systems (ADS) and Driving Automation Systems are used to refer to the functional modules to be offered in modern vehicles at various levels of automation.

D1.1 Review of new forms of mobility, freight distribution and their business models; gaps identification in KPIs and SUMPs
14
International has defined six levels of automation as follows: No-Automation (Level 0), Driver
Assistance (Level 1), Partial automation (Level 2), Conditional automation (Level 3), High automation
(Level 4) and Full automation (Level 5) (SAE, 2014). The above levels have different capabilities,
levels of human intervention, as well as infrastructural requirements to deploy AVs in real road traffic
conditions. Major distinctions draw between Levels 0-2 and 3-5, based on whether the human or the
automated system is primarily responsible for conducting the driving task.
AVs could be introduced in the mobility market in two different ways (Haboucha et al., 2017). The first
option is a privately-owned AV, where the AV is purchased and owned by the household, similar to a
regular car. However, due to the high production costs of the autonomous technology, it is expected
that private AVs may not be affordable for the average consumer when first brought to market
(Stocker and Shaheen, 2017). Thus, the second option is that AVs are introduced as part of a shared-
autonomous vehicle service (EC, 2018). This option involves the subscription to a shared AV system,
in which the customer does not own the car but has access to a fleet of AVs. These shared AVs will
pick the customers up and drop them off directly at their destination. In this way, the shared
autonomous vehicles (SAVs) will bring together the benefits of autonomous driving and shared
mobility.
Figure 2. Examples of autonomous vehicles for passengers (From left to right: The Smart Electric Van of ARRIVAL; Waymo driver-less car, which began as the Google Self-Driving Car Project in 2009; Tesla Autopilot)
Over the last years, a considerable number of new and conventional companies invested in
autonomous technology and AVs’ operations (see for examples Figure 2). Based on Chan (2017), the
AV-related industry has reached a pivotal point in 2016, as various developments towards the
realization of AVs took place. Audi/VW (Level 3 of autonomous driving), Bosch, Google (its self-
driving car is now branded as Waymo) and Tesla (Tesla Autopilot) are some of the companies that
have delivered AVs and tested them in multiple sites, while the projections indicate that AVs might be
fully deployed by 2020-2025. Other examples of autonomous vehicles for passengers include2: Volvo
autonomous driving, Apollo 5.0, ARRIVAL, EasyMile, NAVYA.
A1.2.3 Air taxis
As electrical propulsion gets cheaper and the complexity of automated aerial vehicle development is
manageable much easier, Unmanned Aircraft (UA) or drones are being brought into market by
aviation companies. Various UAs’ demonstrations have been carried out by traditional companies,
start-ups as well as research projects to test flight capability and reliability of the technology. The
market analysis forecasts a huge business potential for future automated aerial services. Different
kind of missions (e.g. farming video analysis, cargo delivery, video taking, heavy lift facilitation,
passenger transfer) are under consideration by many stakeholders. However, this section focuses on
the operation of air taxis for passenger transfer.
2 More information can be found in the following links: https://www.tesla.com/en_EU/autopilot?redirect=no; https://waymo.com/; https://www.audi.com/en.html; http://apollo.auto/; https://arrival.com/; https://www.volvocars.com/en-kw/own/own-and-enjoy/autonomous-driving; http://www.easymile.com/; https://navya.tech/en/

D1.1 Review of new forms of mobility, freight distribution and their business models; gaps identification in KPIs and SUMPs
15
In the perspective of this vision, industry is developing different types of UAs to enable future aerial
mobility services. A vertical take-off and land (VTOL) air taxi for one person (Vahanna) has been
developed and tested for flight by Airbus, also one by Volocopter and several others like Ehang 104
(from China) or Lillium (from Germany). Also, a 2-tonne heavy air taxi for 4 persons named City
Airbus is under development as a prototype (see Figure 3). Finally, Uber is working towards enabling
shared VTOL aircraft as one leg of the users’ journey, riding between conveniently located Skyports,
from ground to air to ground.
Figure 3: Air taxis for passenger transfer (from left to right: Vahanna, City Airbus, Volocopte, Uber Air)
Several projects are currently under way founded by SJU (SESAR3 Joint Undertaking) in order to
drive the evolution of technical, procedural and regulating aspects of unmanned traffic management
and urban air mobility. Examples for those projects are: i) CORUS (Concept of Operation for
EuRopean UTM Systems), a reference CONOPS (Concept of Operation) for U-Space4; ii) PercEvite,
a project to develop a sensor, communication, and processing suite for small drones for
autonomously detecting and avoiding “ground-based” obstacles and flying vehicles such as manned
aircraft and other drones; iii) GOF USPACE, a project to prepare a plan for the demonstration
activities that have a specific emphasis on urban area, access to controlled airspace and automation;
and iv) SAFIR, a project to demonstrate multiple U-space service providers can operate in a same
urban geographical area. Interfaces with ATC, dynamic geofencing and tactical deconfliction will be
implemented.
Table 1. Overview of air taxis’ services
U-Space services eRegistration for UA; Booking service; Weather service; Flight planning service; Payment service; Deconfliction service (strategic); Flight clearance service; Flight information service; Tracking; Monitoring; Coordination service with ATM (at airports); Coordination with urban traffic (for timing and scheduling); Deconfliction service (real-time).
Besides the described targets other projects have been launched, in order to gain experience on
related fields of knowledge, like communication, ground support to unmanned vehicles, traffic and
airspace coordination for automated flights beyond visual line of sight (BVLOS), strategic de-
confliction, sense and avoid technology, collision detection, etc. However, the timeframe for rules and
regulations to come into place plus global coordination between authorities (ICAO, FAA, EASA,
Eurocontrol, Eurocae, GUTMA, JARUS, and further) will be years from now. It seems logical that that
aerial services will start with small projects and initial flights for testing and trials, on the path to
passenger transport over cities around 2050. The vision is to have urban air mobility brought to the
customer on request. Just by a click in the smart phone app, the future air taxi could be ordered to the
nearest suitable landing position. After identification of the passenger and processing of the booking
3 SESAR is the abbreviation of Single European Sky ATM (Air Traffic Management) Research 4 U-Space is the name for a set of new services and specific procedures designed to support safe, efficient and secure access to airspace for large numbers of drones. (See SJU U-Space Blueprint)

D1.1 Review of new forms of mobility, freight distribution and their business models; gaps identification in KPIs and SUMPs
16
request, the air taxi will take off and fly on a pre-planned route to the destination. Aerial ports for air
taxis for passenger pick up would be one way to bring mobility service to the end users, but also
landing on secure locations like soccer fields, big empty places, flat house roofs, etc. are foreseen to
expand urban mobility to the spot from where the flight has been requested. Section A1.4 presents
further infrastructural and data requirements for air taxis to operate.
A1.3 New mobility technologies for freight A1.3.1 Autonomous Vehicles for freight
Table 2. Main characteristics of Autonomous Vehicles for freight
Description of the technology Automated Guided Vehicles (AGVs) are already popular for in-house transport in warehouses and distribution centers for picking and palletizing products. AGVs are also applied in container terminals to move containers between craned and stacking areas (ECT, 2018). Freight Automation is moving to a next step via the development of fully and semi-autonomous long-haul trucks manufacturers. Driverless trucks and vans operate without the intervention of a driver while in semi-autonomous trucks the driver is alerted and ready to take control of the vehicle in case an incident happens. Business – Ways the technology is provided to end users Arrival has already created autonomous vans (Arrival, 2019). These vans have been used by UPS (Ong, 2018) and UK Royal Mail (Lambert, 2017) to deliver mail. For the moment, companies mostly benefit from the electrification of the vans as it enables them to reduce their emissions. TuSimple, a US start-up has developed the first automated truck that transfers products from depot to depot (Figure 4) (TuSimple, 2019). Autonomous trucks from Embark have already been transporting Frigidaire’s refrigerated goods from a warehouse in Texas to a distribution center in Palm Springs, California (Davies, 2017). UPS has already invested in this company in order to use the autonomous trucks to deliver mail (Boudway, 2019) Car manufacturer Tesla has developed Semi, a semi-autonomous electric truck with autopilot that is able to maintain an average speed of 105km/hour (Figure 4).
Figure 4. Semi-autonomous and autonomous vans and trucks (From left to right: Arrival, TU Simple, Semi-Tesla, Vera-Volvo, Embark truck)
Volvo, on the other hand, has a fully autonomous self-driving truck Vera. Vera is designed for regular and repetitive tasks, over short distances, where large volumes of goods need to be delivered on time, such as in ports, factory areas and mega-logistics centers (Figure 4). Vera’s first pilot assignment was to deliver goods from a logistics center to a port terminal in Gothenburg, Sweden (Vera, 2019). To enable the application of semi-automated trucks for long-haul trips, the technique of truck platooning has been developed which wirelessly connects a convoy of trucks to the leading truck allowing them to cruise safely together and ensure higher fuel efficiency. The first European Truck Platooning Challenge has already been carried out in 2016 by the Dutch Ministry of Transport with the participation of large truck manufacturers such as Volvo and Scania (Rijkswaterstaat, 2016).

D1.1 Review of new forms of mobility, freight distribution and their business models; gaps identification in KPIs and SUMPs
17
A1.3.2 Delivery bots
Table 3. Main characteristics of delivery bots
Description of technology Large companies and startups have already started to experiment with the development of short-range delivery robots (bots) which aim to make the last-mile deliveries from a local depot to the final recipient. These bots offer a quick and efficient solution for moving mail, parcels, groceries, pharmacy and food within a limited range. Business – Ways the technology is provided to end users Some examples include (Figure 5): 1) Starship Robots: they look like a basket on wheels and can be summoned with a phone app, travel to the pick-up location and then drive to the drop-off destination. Starship robots are already operational in many U.S. college campuses such as George Mason University and Northern Arizona University (Diaz, 2019); 2) Kiwibots are already operating in UC Berkeley campus and are specialized in food deliveries. They have an average delivery time of 27 minutes. An automated kiwi bike picks up deliveries from restaurants, delivers them to a specific location where an employee loads the kiwibots for the last mile trip to the recipient (Kiwicampus, 2019); 3) Amazon Scout: Amazon has already tested Scout for deliveries to its prime customers in Washington state neighborhoods (Amazon robotics, 2019); 4) FedEx SameDay robot is now being tested in deliveries from local and distribution centers to their consumers (Vincent, 2019).
Figure 5. Examples of delivery bots from left to right: Starship Robots, Kiwibot, FedEx SameDay bot, Amazon Scout
Some companies went a step further and tried to find solution to the limited rage problem of these robots. Continental together with Anymal have developed a two-part solution: They combine an autonomous delivery van developed by Continental with robotic dogs developed by Anymal (Diaz, 2019). When the van gets to a particular area, it opens its doors and the dogs emerge, carrying packages and delivering them to their destinations with the help of AI algorithms. By deploying them from a larger vehicle, robots can easily reach their destination, get back to the mothership to ride to another destination while recharging. This solution has not been tested yet. An additional autonomous van is Nuro (Nuro, 2019) which is equipped with both refrigerated and heated compartments and it can deliver groceries, refrigerated products and hot food. When it arrives at its destination the recipient needs to head out to the van to pick up the packages. Nuro is already delivering groceries in Arizona US.
Figure 6. Examples of automated delivery vans (Continental and Anymal- left, Nuro-right)

D1.1 Review of new forms of mobility, freight distribution and their business models; gaps identification in KPIs and SUMPs
18
A1.3.3 Drones for freight
Table 4. Main characteristics of drones for freight
Description of technology Drones for freight are designed to transport cargo. Drones flight automatically with the aid of radio and GPS signals. The flight is plotted into a computer and the data are uploaded to the air drone. The flight is monitored by the operator via GPS signals and video monitors. Business – Ways the technology provided to end users Examples of businesses providing drones to users are: Griff135 can deliver up to 30kgs cargo to up to 10-15kms (Griff Aviation, 2019); Amazon air drone will service Amazon’s prime customers and can make deliveries within 30 minutes after the order is placed. (Amazon, 2019); DHL’s air delivery drone is already operational and covers approximately 8 km between the customer premises and the DHL service center in Liaobu, Dongguan, Guangdong Province in China (DP-DHL, 2019).
Figure 7 UAVs for freight (From left to right: Griff135, Amazon Prime, DP DHL)
Operational requirements To operate drones, training and proper license issued by the authorities are required. For flights in populated areas extra permissions are necessary.
A1.4 Data and Infrastructure needs for new mobility technologies A1.4.1 Data needs for new mobility technologies
New mobility technologies rely on significant volumes of information which describe various aspects
of the transport network and its conditions, as well as relevant contextual information such as the
weather, events etc. More specifically, they require the handling, processing, fusing and harmonizing
huge amounts of data coming from numerous sources, such as GPS, car-floating, traffic operator,
weather, GIS and road network, in-car sensor, road sensor or fleet operator data, just to name a few.
In order to efficiently manage and use the required data for new mobility technologies, the adoption of
existing Big Data technologies in the Transportation sector is a requirement that needs to be met.
However, to the best of our knowledge only a minority of scientific literature related to Big Data
technologies in transportation currently exists. On a European wide-level, the most notable effort is
the Infrastructure for Spatial Information in the European Community (INSPIRE) which is essentially a
geoportal for storing data of a number of thematic areas, including land cover / land use, population
related data and transport network data. The importance of transport data management and statistical
analysis as well as the increased opportunities emerging from big data in transport modelling and
planning approaches that incorporate the dynamics and requirements of new mobility technologies
are highlighted in recent work (Milne and Watling, 2018).
Big data allow analyses at a more ‘raw’ level, free of assumptions sometimes made in converting raw
data to a manageable form (e.g. ‘mechanisms’ to convert inductive loop data to vehicle counts)
whereas, continuous monitoring allows the study of new kinds of variation (time-of-day, day-to-day,
time-of-year, scenario-specific) to correlate with data on events/weather or unexpected events. The
use of big data allows for a more widespread monitoring which leads to finer disaggregation of effects
and more opportunity to study small and/or disadvantaged groups. It also provides the potential to
develop transferable behavioural models with more explanatory factors, due to much larger sample

D1.1 Review of new forms of mobility, freight distribution and their business models; gaps identification in KPIs and SUMPs
19
sizes which may be applicable to a wider range of policy contexts, socio-political backdrops and
locales, rather than just marginal changes from the present, as is often the case in current studies.
The deployment of big data warehouses which aggregate the required data for transport modeling,
while providing the necessary data operations for data management is still at its infancy and novel
solutions are required to render data accessible, usable and interoperable for transport modelling
incorporating the dynamics and requirements of new mobility technologies.
Table 5 presents the data needs for the operation of the new mobility technologies for passenger and
freight described in the previous sections.
Table 5. Data needs for new mobility technologies
Technology Data needs
Passenger transport Connected Vehicles
Traffic data, GPS data, road network (road profiles, curbs and sidewalks, lane markers, crosswalks, traffic lights, stop signs), information on the road network status (road works information, data on incidents, etc.), weather data (Carreras et al., 2018).
Autonomous vehicles
The above data are needed for the AVs to provide optimal routing. Otherwise, sensors data will suffice.
Air taxis Take-Off and landing area position data; No Fly Zones (geofencing); Routes and corridors (airspace management); Waypoint data; Flight route data; Operating times; Communication channels
Freight transport Automated Guided Vehicles
GPS data, sound and motion sensor data, road network data (from 3D maps), LIght Detection And Ranging (LIDAR) data, speed data, video image data, road network status data (traffic conditions, incidents etc.) (Viscelli, 2018).
Delivery bots GPS data, sound and motion sensor data, road network data (taken from 3D maps), LIDAR data, speed data, video image data, road and pedestrian traffic data. Data on the transported goods (weight, origin, destination, handling conditions). Recipient’s authentication data. Data on location of docking and charging stations
Drones Drones use preloaded offline flight data that include route, origin and destination, etc. They require real time position, weather and wind speed data.
A1.4.2 Infrastructure needs for new mobility technologies
Infrastructure for air passenger and freight traffic: Air vehicles require the creation of secure
locations for landing and taking off in areas such as soccer fields, big empty places, flat house roofs,
etc. Drones used for the cargo deliveries are electric and need access to a power outlets or charging
stations. For air urban traffic, it is important to submit and receive radio links and signals that require
free line of sight.
Infrastructure needs for passenger and freight vehicles: Depending on their level of automation
and their size, connected vehicles and autonomous vehicles require different levels of investment and
changes in the existing infrastructure. Table 6 summarizes the infrastructural needs for the operation
of the new mobility technologies for passenger and freight.
Table 6. Infrastructural needs for new mobility technologies
Technology Infrastructural needs
Passenger transport Connected Vehicles
The operation of connected vehicles would require investments, e.g. roads being equipped with sensors, cameras, detectors and other infrastructure (roadside units to transmit data to the vehicles, traffic signal controllers, speed limit beacons) to enable Vehicle-to-infrastructure (V2I) communication (Sobanjo, 2019; Zhang, 2013; Kockelman et al., 2017; Lyon et al., 2017; Johnson, 2017).

D1.1 Review of new forms of mobility, freight distribution and their business models; gaps identification in KPIs and SUMPs
20
Technology Infrastructural needs
Passenger transport Autonomous vehicles
AVs would require some degree of upgrade or investment in existing infrastructure, which may range from modest changes to make signage or lane markings recognizable by the AVs to much more expensive investments where CAVs are in constant contact with the infrastructure network (Lyon et al., 2017). For example, a particular type of lane marking could be needed to enable AVs’ operation on particular sections of the network. In addition, signs should be standardized and designed to be ‘readable’, as AVs enter the road system. In any way, having the road infrastructure maintained at a high standard (i.e. line markings, road signs, traffic lights, etc. maintained in good conditions) is a prerequisite for the successful implementation of AVs (Muritala, 2018). In addition, based on Zhang (2013), dedicated lanes to enable platooning of vehicles might be needed for AVs in Levels 3 and 4. In addition, electric vehicle charging stations will be required, partly as most AVs are likely to be EVs (KPMG International, 2018). Finally, based on Duvall et al. (2019) and Lyon et al. (2017), AVs (and especially SAVs) could also change city planning and existing infrastructure since other structures may be needed, such as parking areas, drop-off zones, staging areas, to allow AVs idle when picking up or discharging passengers.
Air taxis Take-Off and Landing places will be needed. Providing safe and secure entry and exit for the end users. Together with equipment for the vehicles, like power supply, highly precise and reliable navigation aids, continuous stable communication, video surveillance of the area, lighting, Wifi, etc. Emergency landing places will be also needed.
Freight transport Automated Guided Vehicles
Semi-autonomous/autonomous trucks are expected to travel in convoys so they will require the use of a dedicated innermost lanes in highways (Kulmala et al., 2019). Automated freight traffic should be able to communicate with the infrastructure (V2I communication) and get information on incidents and maintenance works in the highways, time and space lane restrictions, etc. Dedicated areas should be designed in the end of the corridors to enable the driver take over the control of the truck as well as automated bays for the transfer of loads from one vehicle to another. Roads should have clear and visible marking in order for the trucks to detect the dedicated lanes. Adequate signaling and real time information on incidents and events is necessary.
Delivery bots Delivery robots are able to navigate on pavements and streets together with vehicle and pedestrian traffic. Most of them are not able to climb stairs and they require recipients to pick up their products from the street. For the moment their applications have been limited to low dense and low height urban environments such as college campuses. They also require docking and charging infrastructure.
Drones The drones are electric and need access to a power outlet or charging station. For submitting and receiving radio links and signals they require free line of sight.
A1.5 Final considerations
The rapid development of autonomous and air passenger and freight vehicles are expected to shape
the design of urban mobility plans in a way that accommodates their physical and data infrastructural
needs. Taking advantage of the more sustainable and reliable mobility solutions offered by the
technologies described in these chapter, urban plans should be modified in order to include charging
stations for freight and passenger AVs, loading and unloading areas for urban freight and landing and
taking off areas for air vehicles. At first AVs will share the existing road network with traditional means
of transport, hence the secure interaction between vehicles and pedestrians should be reassured.
High quality network maintenance combined with real time transmission of V2I information is essential
for the operation of these technologies. At the moment, the development of regulatory frameworks
that will permit an unhindered and safe air and autonomous traffic remains one of the biggest
challenges.

D1.1 Review of new forms of mobility, freight distribution and their business models; gaps identification in KPIs and SUMPs
21
A2. New mobility services A2.1 Introduction
The rapid advancement of Internet of Things and their introduction in the transportation sector have
resulted in the emergence of various new mobility services which aim at addressing the issues of
traffic congestion, accessibility, air pollution, energy use and social inclusion (EC, 2017; Sprei, 2018).
In addition, the rise of sharing economy has unrevealed new opportunities for products and services
in the transport sector both for passengers and for freight. This chapter concerns the review of new
mobility services that are brought about by the sharing economy and are deployed in the passenger
and freight transport. The operation of these services is based on the sharing of a vehicle instead of
ownership, and the use of technology to connect users and providers. For the passenger transport,
the review is focused on three types of new services: (i) Vehicle-sharing services, where end users
can have short-term access to shared vehicles according to their needs and convenience (Machado
et al., 2018); ii) Ride-sharing services, where users arrange one-time shared rides on very short
notice, usually arranged through a mobile app and; iii) Mobility as a Service, which constitutes a
recent mobility concept integrating shared mobility with traditional mobility options under the umbrella
of a single platform. Regarding freight transport, the following services are reviewed: i) Innovative
freight delivery services, which encompass the use of online applications or platforms to connect
couriers with freight, and ii) Cargo bikes, used as a last-mile solution for parcel delivery.
A2.2 New mobility services for passengers A2.2.1 Vehicle-Sharing services
The rationale of vehicle-sharing services is the provision of access to cars, bicycles and scooters
respectively for short periods of time (i.e. couple of minutes or hours), thus, providing complementary
transport services to the major mass transit facilities. This section reviews vehicle-sharing services
and distinguishes them in car sharing, bike sharing and scooters (mainly electric scooters).
Figure 8. Car sharing services in North America (left) and Europe (middle) (based on CSA, 2019) and bike sharing schemes worldwide as of December 2017(right) (Roland Berger, 2018)
Although both car and bike sharing schemes have existed since 1960s, their growth has exploded
worldwide in the latest two decades (ITDP, 2013). Today, carsharing is operated by 236
companies/organizations in approximately 3,128 cities worldwide, in 59 countries (Phillips, 2019). In
the past three years, car sharing was implemented in about 1,000 cities. The highest number of
providers are in the United States (33 on total) followed by Italy (27 operators) and Russia (21
operators). The leading car sharing companies are Zipcar and ShareNow. Zipcar operates more than
16,000 vehicles and serves more than 1 million members in 384 cities most of which are in the United

D1.1 Review of new forms of mobility, freight distribution and their business models; gaps identification in KPIs and SUMPs
22
States or Canada (Phillips, 2019). ShareNow is the joint venture between Daimler’s and BMW’s suite
of mobility services (car2go, Mytaxi, DriveNow, etc.). Figure 8 presents the geographical coverage of
car sharing providers in Europe and North America. Regarding bike sharing, recent statistics indicate
that more than 1,600 bike-sharing programs are in operation worldwide, providing more than 18
million bicycles for public use (as of May 2018 based on Richter, 2018). The leading bike share
providers are Mobike and Lime. MoBike is based in Beijing, China and operates in more than 200
cities globally, while Lime was founded in California, U.S. and operates in several cities of the U.S.
and Europe (e.g. Bremen, Frankfurt, Paris, Zurich). Shared electric scooters (e-scooters) is a very
recent mobility concept, which was launched in 2017 by Lime and Bird Rides Inc. in the United States
(PBOT, 2018). Table 7 provides the main characteristics of the vehicle-sharing services.
Table 7. Main characteristics of car sharing, bike-sharing and e-scooters.
Business: How is the service provided to end users? Car sharing: It can be offered as: i) Business-to-Consumer (B2C), where the organization (operating for-profit or not-for-profit) owns a fleet of cars that the customers can use, ii) Business-to- Business (B2B), where the service is provided only to client organisations and client individuals (i.e. employees are given access to a car sharing service through their employer); and iii) Peer-to-Peer (P2P) where existing car owners make their vehicles available for others for hire or rental (Münzel et al., 2018; Sarasini and Langeland, 2017; Cohen and Kietzmann, 2014). The B2C business model is generally further divided into roundtrip and one-way models, as well as station-based and free-floating services (Vaskelainen, 2014; Shaheen et al., 2015). B2B and P2P models seem to mostly focus on station-based services. Bike sharing: It is generally regarded as being evolved through four different generations (Shaheen et al., 2014). The latest (4th) generation schemes include the provision of real-time information to the users for any imbalances in demand and supply, fleet of electric bikes, as well as the adoption of the dockless bike-sharing model (Parkes et al., 2013; Shaheen at al. 2014). The dockless bike-sharing systems do not rely on street infrastructure for bicycle docking and allow users to find and rent bikes through a mobile app. Dockless systems are rapidly replacing the traditional docked model, while examples can be found in the U.S. (such as Social Bicycles), in Europe (such as Call-A-Bike, Nextbike) and worldwide (such as Mobike). E-scooters: Shared e-scooters operate in a similar way to car and bike sharing. They are generally dockless and are dropped off and picked up from arbitrary locations in the service area. Infrastructural and Technological requirements for the service to operate Platform (back-end) and front-end that facilitate the data integration, operations and service provision; Smartcard system to access the sharing vehicles; prepaid usage cards; widespread penetration of high-speed mobile data networks; high levels of connectivity; dedicated parking spaces/docking stations (for the station-based sharing systems); on-street parking space (for the free-floating car sharing); electric vehicle charging stations (for e-scooters and shared electric vehicles). Data requirements for the service to operate Information on the vehicle-sharing stations/docks (data on where customers can access the shared services), Real time information on vehicle position, road network information. Notable services / demonstrations / pilots Car sharing: ZipCar (https://www.zipcar.com/); SHARENOW (https://www.your-now.com/our-solutions/share-now); Car2Go (https://www.car2go.com/US/en/); Enjoy (https://enjoy.eni.com/en); ubeeqo (https://global.ubeeqo.com/en/es); GoMove (http://www.gomoveusa.com/); ShareIT (http://shareit.fi/); Cambio Carsharing (https://www.cambio-carsharing.de/) Bike sharing: Mobike (https://www.mobike.com/uk/); Lime (https://v1.li.me); JUMP Bikes (https://jump.com/); Ofo (http://www.ofo.com/); Baywheels (https://help.baywheels.com/hc/en-us); Nextbike (https://www.nextbike.net/en/); Call a Bike (https://www.callabike-interaktiv.de/en) E-scooters: Lime (https://v1.li.me); Bird (https://www.bird.co/); Spin (https://www.spin.app/); Skip (https://skipscooters.com/); Ride (https://www.ride.com.br/); TIER (https://www.tier.app/)
A2.2.2 Ride-sharing services (Carpooling, On-demand Ride Services, Microtransit)
Over the last decade, there has been an increasing number of application-based shared mobility
initiatives across both the developed and developing world. These initiatives have often been referred

D1.1 Review of new forms of mobility, freight distribution and their business models; gaps identification in KPIs and SUMPs
23
to as ridesharing services, where the user arranges a ride on a privately-owned vehicle (peer-to-peer)
through a smartphone application. Depending on the service offered, Shaheen and Chan (2016)
classified ridesharing services in three categories: Carpooling, on-Demand ride services
(ridesourcing, ridesplitting and e-hail) and Microtransit (fixed and flexible). Table 8 provides a
summary of the most popular ridesharing initiatives around the world, along with the respective
categories that they belong to.
Carpooling services have been around for decades and were initially implemented to encourage
individuals to commute to work together, splitting travel costs such as gas, toll and parking fees (Hahn
and Metcalfe, 2017). Nowadays, and in the light of new advancements in information and
communication, ridesourcing companies (such as UberCOMMUTE, Lyft Carpool, LiftShare and Waze
carpool) have launched different services to target commuters looking for real-time carpooling
services. In fact, some of these platforms have partnered with local governments or private employers
to provide on-demand carpooling services. An example of this is LiftShare, which has partnered with
different private companies in the UK to provide a carpooling interface for their employees. In
addition to these services, several internet-based matching companies have focused on providing
carpooling for long distance trips. The demand for this type of services refer to travellers interested in
long trips (inter-city, inter-country), and have more flexible travel schedules (Furuhata et al., 2013). A
good example of this type of service is BlaBlaCar, one of the biggest long-distance carpooling
providers in Europe. On-Demand Ride Services refer to real-time demand responsive trips, where
passengers request a ride through a mobile application. These services include ridesourcing (also
known as Transportation Network Companies), ridesplitting and e-Hail services. Ridesourcing
providers such as Uber, Ola and Lyft are amongst the most popular services across the world,
offering smartphone applications to link users with community drivers (Ghoseiri et al., 2010). These
applications charge a distance- and time-variable fare, and contrary to traditional Taxis, in periods of
high demand, prices increase to incentivize drivers to complete rides (also known as surge pricing)
(Jin et al., 2018). Ridesplitting can be considered as a type of ridesourcing, where a user can split a
fare with another person on a similar route. Many ridesourcing companies include ridesplitting
services, such as UberPool and LyftLine. Opposed to carpooling services, ridesplitting drivers do not
share a destination with the passenger, but they offer the service in exchange for an income (Rayle et
al., 2014). Due to the rising popularity of using mobile applications for ridesourcing/ridesplitting
purposes, e-Hail applications have arisen as a way to electronically hail a taxi. These services are
either maintained by a taxi company or a third-party provider. Some of the most popular e-Hail
providers are Arro, Curb, TaxiApp and TaxiEU. While they provide similarities with existing
ridesourcing applications, these applications hail licensed taxi drivers, rather than community drivers.
Microtransit services have recently emerged as a form of private transit which emulates public
transportation by using privately owned large vehicles to pick up passengers along a route that may
be either predetermined, or assembled on-demand (Schaller, 2018). While there are several potential
configurations, the most popular models are those with fixed route and scheduling, and flexible routes
and on-demand scheduling (Via, Bridj). The former operates similar to public transportation systems,
where the arrival/departure time of the vehicle are fixed (Wong et al., 2018), while the latter operate
similar to ridesplitting services, where a user can request a ride on-demand (Westervelt et al., 2018).
The aforementioned services are provided to the users through a digital platform, in the form of a
mobile application or webpage (in the case of most carpooling services). The infrastructure required
to support these platforms are mobile data for connection, and an Application Programming Interface
(API) for data handling. Depending on the specific characteristics offered by the service, there are
different data requirements for their operation. The data requirements can be divided in two: supply

D1.1 Review of new forms of mobility, freight distribution and their business models; gaps identification in KPIs and SUMPs
24
(drivers) and demand (riders). The first one, supply data, refers to information on the location of the
driver (GPS), type of vehicle, model, number of seats, wheelchair access and seat allocation (for
carpooling and ridesplitting services). The real-time tracking of the drivers, in conjunction with
mapping applications, are important information needed to estimate the road conditions and the
expected time of arrival. For demand, data is needed with regards of GPS location of the user,
requirements of the ride (vehicle size, type of service, seats needed), date/time of the trip (carpooling
services), and payment information.
Table 8. Overview of ridesharing initiatives around the world
Category
Initiative
Waze C
arp
oo
l1
Bla
Bla
Ca
r2
Ub
er3
Lyft
4
Lif
tSh
are
5
Go
CarS
hare
6
Via
7
Cu
rb8
Carm
a9
Ju
no
10
Arr
o11
Gett
12
Bla
ncri
de
13
Eri
de
sh
are
14
Po
olm
yri
de
15
Icarp
oo
l16
Ola
17
TaxiA
pp
18
TaxiE
U19
Bri
dj2
0
Carpooling x x x x x
x x x x x x
Ridesourcing x x x x
Ridesplitting x x
E-Hailing x x x x x
Microtransit x x x
Table Notes: 1 https://www.waze.com/carpool; 2 https://www.blablacar.co.uk/; 3 https://www.uber.com/; 4https://www.lyft.com/; 5 https://liftshare.com/; 6 https://gocarshare.com/; 7 https://ridewithvia.com/; 8https://gocurb.com/; 9 https://www.gocarma.com/; 10 https://gojuno.com/; 11 https://www.ridearro.com/; 12 https://gett.com/; 13 https://blancride.com/; 14 https://www.erideshare.com/; 15 https://poolmyride.com/; 16 https://www.icarpool.com/; 17 https://www.olacabs.com/; 18 https://www.taxiapp.com/; 19https://www.taxi.eu/; 20 https://www.bridj.com/.
A2.2.3 Mobility as a Service
Mobility as a Service (MaaS) is a relatively new mobility concept which relies on the integration of
multiple mobility service providers under the umbrella of a unique digital interface (MaaSLab, 2018;
Hietanen, 2014; Kamargianni and Matyas, 2017). This user-centric, intelligent mobility management
and distribution system enables end users to seamlessly plan and pay their journeys, thus offering
flexible, reliable and seamless mobility based on their travel needs (Hensher, 2017). Although the
MaaS concept began just a few years ago in 2012 in Gothenburg of Sweden, where the real-life
demonstration of UbiGo took place as part of the Go:Smart project (Karlsson et al., 2016), a number
of MaaS demonstrations have arisen in Europe and worldwide. A successful example of MaaS
implementation is the so-called “Helsinki Model”, which was first proposed by Heikkilä (2014) and was
subsequently commercialized as Whim application. Table 9 presents several MaaS applications that
have been developed mainly in Europe as well as in the United States and Australia. Since MaaS is a
promising concept, the European Commission is currently funding three projects on MaaS: i)
MaaS4EU, ii) IMOVE and iii) MyCorridor5. Based on the current state of the art and practice, the main
elements of MaaS are presented in Table 9.
5 More information can be found in: i) http://www.maas4eu.eu/; ii) https://www.imove-project.eu/; iii) http://www.mycorridor.eu/.
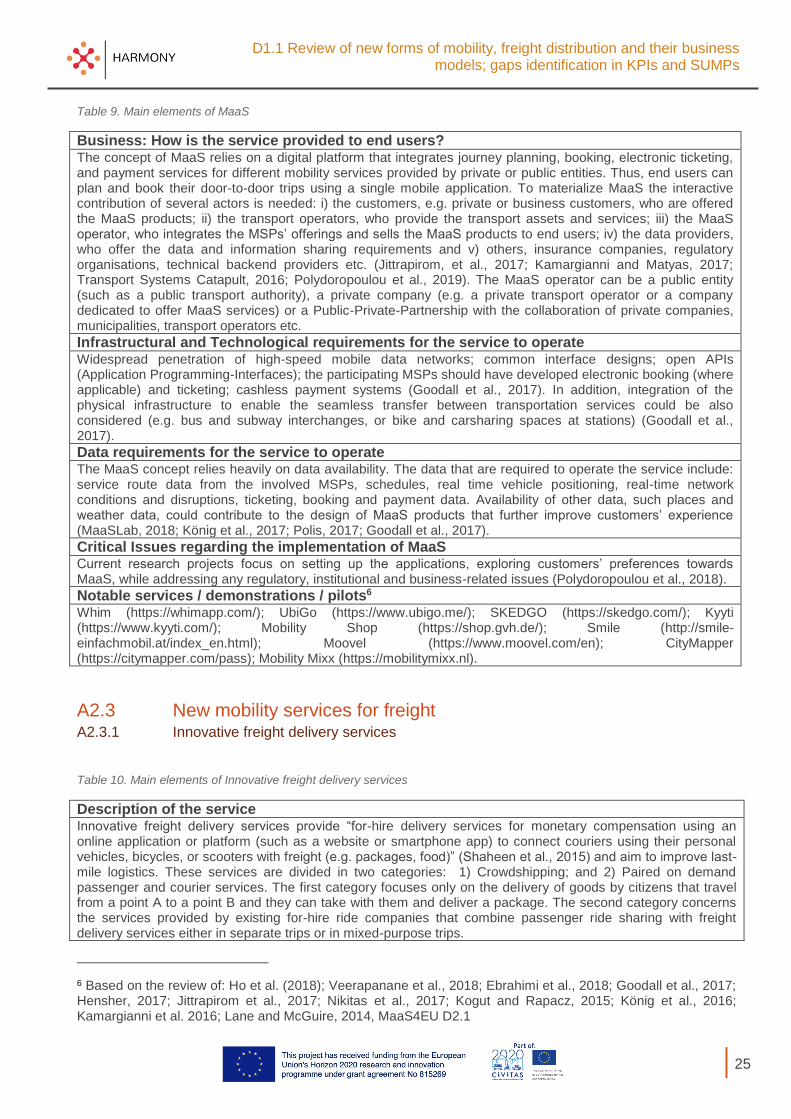
D1.1 Review of new forms of mobility, freight distribution and their business models; gaps identification in KPIs and SUMPs
25
Table 9. Main elements of MaaS
Business: How is the service provided to end users? The concept of MaaS relies on a digital platform that integrates journey planning, booking, electronic ticketing, and payment services for different mobility services provided by private or public entities. Thus, end users can plan and book their door-to-door trips using a single mobile application. To materialize MaaS the interactive contribution of several actors is needed: i) the customers, e.g. private or business customers, who are offered the MaaS products; ii) the transport operators, who provide the transport assets and services; iii) the MaaS operator, who integrates the MSPs’ offerings and sells the MaaS products to end users; iv) the data providers, who offer the data and information sharing requirements and v) others, insurance companies, regulatory organisations, technical backend providers etc. (Jittrapirom, et al., 2017; Kamargianni and Matyas, 2017; Transport Systems Catapult, 2016; Polydoropoulou et al., 2019). The MaaS operator can be a public entity (such as a public transport authority), a private company (e.g. a private transport operator or a company dedicated to offer MaaS services) or a Public-Private-Partnership with the collaboration of private companies, municipalities, transport operators etc. Infrastructural and Technological requirements for the service to operate Widespread penetration of high-speed mobile data networks; common interface designs; open APIs (Application Programming-Interfaces); the participating MSPs should have developed electronic booking (where applicable) and ticketing; cashless payment systems (Goodall et al., 2017). In addition, integration of the physical infrastructure to enable the seamless transfer between transportation services could be also considered (e.g. bus and subway interchanges, or bike and carsharing spaces at stations) (Goodall et al., 2017).
Data requirements for the service to operate The MaaS concept relies heavily on data availability. The data that are required to operate the service include: service route data from the involved MSPs, schedules, real time vehicle positioning, real-time network conditions and disruptions, ticketing, booking and payment data. Availability of other data, such places and weather data, could contribute to the design of MaaS products that further improve customers’ experience (MaaSLab, 2018; König et al., 2017; Polis, 2017; Goodall et al., 2017).
Critical Issues regarding the implementation of MaaS Current research projects focus on setting up the applications, exploring customers’ preferences towards MaaS, while addressing any regulatory, institutional and business-related issues (Polydoropoulou et al., 2018). Notable services / demonstrations / pilots6 Whim (https://whimapp.com/); UbiGo (https://www.ubigo.me/); SKEDGO (https://skedgo.com/); Kyyti (https://www.kyyti.com/); Mobility Shop (https://shop.gvh.de/); Smile (http://smile-einfachmobil.at/index_en.html); Moovel (https://www.moovel.com/en); CityMapper (https://citymapper.com/pass); Mobility Mixx (https://mobilitymixx.nl).
A2.3 New mobility services for freight A2.3.1 Innovative freight delivery services
Table 10. Main elements of Innovative freight delivery services
Description of the service Innovative freight delivery services provide “for-hire delivery services for monetary compensation using an online application or platform (such as a website or smartphone app) to connect couriers using their personal vehicles, bicycles, or scooters with freight (e.g. packages, food)” (Shaheen et al., 2015) and aim to improve last-mile logistics. These services are divided in two categories: 1) Crowdshipping; and 2) Paired on demand passenger and courier services. The first category focuses only on the delivery of goods by citizens that travel from a point A to a point B and they can take with them and deliver a package. The second category concerns the services provided by existing for-hire ride companies that combine passenger ride sharing with freight delivery services either in separate trips or in mixed-purpose trips.
6 Based on the review of: Ho et al. (2018); Veerapanane et al., 2018; Ebrahimi et al., 2018; Goodall et al., 2017; Hensher, 2017; Jittrapirom et al., 2017; Nikitas et al., 2017; Kogut and Rapacz, 2015; König et al., 2016; Kamargianni et al. 2016; Lane and McGuire, 2014, MaaS4EU D2.1

D1.1 Review of new forms of mobility, freight distribution and their business models; gaps identification in KPIs and SUMPs
26
Business: Ways the service provided to end users In their majority, innovative freight delivery services are provided by startup companies that offer online platforms. Users can access the services via a smartphone app, insert the information and pick-up and delivery requirements of their package and then an algorithm matches shipments with transporter. Every citizen with a smartphone and a private vehicle or in some cases, a bike is able to become a transporter. Crowdshipping companies operate under a variety of business models (Shaheen et al., 2015). Some companies use only motorized vehicles (cars, motorbikes) while others only bikes (UberEats, DelivCo). A variety of products can be transported ranging from food (UberEats, DelivCo, Postmates) and groceries (Roadie, Postmates), to library books (PiggyBaggy). Crowdshipping operates with various ranges from long haul where companies focus on packages that can be transported in a passenger’s luggage (Filmy luggage) to city-range last mile deliveries. Finally, some platforms permit transporters to deviate from their predefined route to deliver a shipment (McKinnon, 2016). The majority of companies offering crowdshipping services face various issues related startup operations such as experimental business models, under-capitalization, high failure rates and many mergers (McKinnon, 2016). However, larger players have already started entering the market with Amazon introducing AmazonFlex in 2016. AmazonFlex is a crowdshipping service aiming to increase the cost efficiency of last-mile deliveries. DHL has introduced a similar service in Norway (DHL MyWay) Regarding the paired-on demand passenger and courier services, existing ride-hailing companies such as Uber (UberRush) and Sidecar (Sidecar Deliveries) had unsuccessfully tried to create services that combine passenger transport with last mile deliveries.
Infrastructural requirements for the service to operate
There are not specific infrastructural requirements for these services to operate.
Data requirements for the service to operate All services offer an online platform where the customer inserts information on: pick up location, delivery information, details of the parcel (weight, dimensions, handling/delivery requirements) and in some cases the maximum amount of money they are willing to pay. The transporter accesses the platform, inserts the route he is following, and an optimization algorithm matches the sender with the transporter. Transporters can also provide data on availability and the distance they are willing to deviate from their route. Additional data involve the rating of transporters and customers. Other requirements No other requirements. Notable services / demonstrations / pilots Crowdshipping services: 1) PiggyBaggy, where local people can transport library books for a fee of 2-5 euros (Transport Reduction by Crowdsourced Deliveries: a Library Case in Finaland, 2016); 2) Roadie offers companies a safe, affordable and reliable solution to make same day deliveries. Roadie specializes in home décor, furniture, pharmacy products, prescriptions and groceries (www.roadie.com); 3) Trunkrs: A Dutch crowdshipping company focusing on delivery time by offering same day, next day and evening delivery options (https://www.trunkrs.nl); 4) Postmates specialized in food, drinks and groceries deliveries in USA cities (https://postmates.com); 5) DelivCo uses only bikes for deliveries (https://www.deliv.co/courier-service/nyc/); 6) FilmyLuggage connects people who want to move goods with travelers that can transport them in the luggage; 7) ShipBid is a shipping service that connects everyday commuters with individuals seeking couriers (https://shipbird.com/); 8) DoorDash is a service where transported are paid a fee to go to a restaurant and deliver to customer’s home or office (https://www.doordash.com); 9) Uber Eats: Delivers foods from restaurants to customers (https://www.ubereats.com/nl-NL/); 10) Amazon Flex (https://flex.amazon.com); 11) DHL MyWays (https://www.dhl.com/en/press/releases/releases_2013/logistics/dhl_crowd_sources_deliveries_in_stockholm_with_myways.html#.XXZCti2B2qQ) Paired on demand passenger and courier services: There are two such services, UberRush (by Uber) and Sidecar Deliveries (by Sidecar), which have already gone out of business.
A2.3.2 Cargo bikes
In recent years, human-powered bikes, or cargo bikes, have gained popularity as an environmentally
friendly mode for the movement of local goods in European and North American cities. Cargo bikes
are specifically designed for transporting load, with a cargo area consisting of an open or enclosed
box and are often enhanced by electrically assisted drivetrains. They are especially suitable for
courier logistics with a high amount of small short-distance shipments in metropolitan centres (Gruber

D1.1 Review of new forms of mobility, freight distribution and their business models; gaps identification in KPIs and SUMPs
27
and Kihm, 2016), due to their advantages with regards to low operational cost, less driver fatigue,
higher payload and environmental benefits (TFL, 2009). In addition to their application for the
movements of food, pharmaceutical and other products, these bikes are also used as a last-mile
solution for parcel delivery in very congested urban centres.
E-cargo bike fleets usually operate through a bike monitoring platform where is possible to track the
cargo bike location, obtain routing assistance and provide real-time information on the condition of the
bike. The data needed for this service to operate is related to the location (GPS), altitude, existing
cycle infrastructure (for routing), and current state of the fleet. In terms of technical infrastructure, the
bike monitoring system requires an embedded mobile platform, and an Application Programming
Interface (APIs) to operate (Kiefer and Behrendt, 2016). In addition, physical infrastructure
requirements that supports the use of e-cargo bikes include designated loading areas, charging
facilities, microdistribution hubs and dedicated cycle lanes (DfT, 2019).
Studies have examined the potential of cargo bikes for goods delivery in different European and North
American cities, with the most popular implementations in cities such London, Paris and Berlin (Lenz
and Riehle, 2013; Schliwa et al., 2015). Table 11 provides an overview of the different studies and
current implementations of cargo bikes in Europe, by private firms and publicly funded projects. The
general conclusion from these studies is that cargo bikes have proven to be a viable solution for
urban freight transport, as they are less expensive to purchase, maintain and power, more reliable
and offer more parking flexibility in comparison with motorised vehicles. However, their limited
capacities and service ranges require more space for transloading, as well as more vehicles and
drivers than comparable services (Koning and Conway, 2016).
Table 11. Overview of cargo bike implementation in Europe
Company Cities Source/Link
Private firms United Parcel Service Hamburg, Bremen, Hanover and
Bochum https://www.ups.com/
Dynamic Parcel Distribution Hamburg https://www.dpd.com/
Zedify Cambridge https://www.zedify.co.uk/
Gnewt Cargo London https://www.gnewt.co.uk/
E-cargo Bikes London https://e-cargobikes.com/
Royal mail e-trike London https://www.royalmail.com/
Bikes for business London https://www.teamlondonbridge.co.uk/
Publicly funded projects
I substitute a car Berlin https://www.dlr.de/vf/
CycleLogistics Berlin, Budapest, Cambridge, Graz, Mechelen, Milan, Prague, San Sebastian
http://www.cyclelogistics.eu/
Cycle freight London http://content.tfl.gov.uk/cycle-freight-
study.pdf
Pro E-bike Valencia, Genova, Zadar, Heerhugowaard, Lisboa, Vedra, Moravske Toplice, Motala, Torres
http://www.pro-e-bike.org/
A2.4 Final considerations
This chapter identified the mobility services that have already become available in the passenger and
freight mobility sector. Based on the review, these services have mainly emerged from the rise of
sharing economy, while the introduction of information technology and digitalization in the transport

D1.1 Review of new forms of mobility, freight distribution and their business models; gaps identification in KPIs and SUMPs
28
industry, the continuous development of mobile applications and the use of smart phones have
significantly contributed to their emergence.
The deployment of the reviewed mobility services may affect spatial and transportation planning in
different ways, since changes in location choices, modal choices, land use organization and
infrastructure design are expected. For example, shared mobility schemes could lead to the decrease
of personal automobile use (Shaheen et al., 2015). In addition, the new mobility services require
several infrastructural changes and/or improvements for their successful implementation. Dedicated
parking spaces, docking stations, electric vehicle charging stations are some of the physical
infrastructure needs for the deployment of these services. Besides, widespread penetration of high-
speed mobile data networks, open APIs and other technological advancements (e.g. electronic
booking and ticketing, cashless payment systems) are required. Authorities should consider the
impact from the new mobility services on cities and the future challenges for transport planning.
Collection and exchange of data about mobility is another important component to achieve the
successful integration of these mobility services in the spatial and transport planning. Road network
data, real time information on vehicle position and characteristics, real-time network conditions and
disruptions, ticketing, booking and payment data are some of the data needs. Combining large
datasets from mobility service providers, infrastructure operators (road, parking, etc.), authorities, in-
car systems and mobile telephones is essential to this. Finally, regulatory/legal, institutional and social
acceptance challenges should be addressed and considered by the corresponding authorities to
promote the materialization the new mobility services.

D1.1 Review of new forms of mobility, freight distribution and their business models; gaps identification in KPIs and SUMPs
29
A3. Inputs for the baseline scenarios for regional and transport planning
A3.1 New opportunities for urban mobility of the future
Nowadays, we are witnessing a revolution in the world of transport. Technological drivers such as
automation, connectivity, and low-carbon technologies, coupled with new sharing trends are
completely redefining the way people and goods move around. In addition, mobility is being strongly
affected by a series of external trends including population growth and ageing, changing attitudes and
behavior among younger people (e.g. changing environmental norms), and the growth of the sharing
economy and of connectivity and digital services (e.g. e-commerce, home working). Such trends are
not under the direct responsibility of governments, organizations, or firms, but it is fundamental to
consider their impacts when planning the transport systems of the future and when forecasting
regional and transport planning scenarios (Government Office for Science, 2019).
It can be observed that there are mainly four fast-moving trends that are currently shaping mobility
and have a disruptive potential to transform transport in the way we are used to know it: automation,
connectivity, decarbonisation, and sharing. The combination of these four elements can lead to a
radical transformation of transport as the interplay and integration between them could have a
reinforcing effect. For example, AVs could accelerate the adoption of shared mobility, while vehicle
electrification could be accelerated by shared, automated mobility (Rupprecht et al., 2019).
The overall result of these trends is that the transport system is changing and evolving at a pace that
has never been that fast before, thus making extremely difficult to carefully predict how mobility will
look like in the future. It could be forecasted that in place of cars powered by fossil fuels and internal
combustion engines, we will have electric and autonomous vehicles. Sharing mobility services might
escape from their niche status. High speed rail could transform journeys between our major cities,
and hugely enhance freight capacity. Drones might deliver goods to people’s houses (Government
Office for Science, 2019).
Also, people would continue to play an active role by using and producing more data than ever before
as ICT will be fully integrated in the daily life of travelers, with massive implications for transport
system management. Traffic and travel information could then support the implementation of
advanced mobility demand management systems. People might have available a greater chose of
mobility solutions and new information services that will become readily available to the consumer.
Access to services could be made easier, allowing travelers to move seamlessly from door-to-door.
Multimodal hubs could provide easy transfer between modes and collective transport could become
more diversified and efficient than ever, while sustainable and active modes of transportation might be
encouraged. The urban logistics strategies might lead to a greater efficiency in freight delivery, with
greater integration of urban freight challenges into urban planning (ERTRAC, 2009).
A huge role in understanding how the future of transportation will be shaped, is played by the
development path that new technologies and services will follow. In the first two chapters, the
HARMONY project thoroughly described some of these technologies and services. The potential role
that each of them might have in the future is briefly presented in the following lines.
In terms of new mobility technologies for passengers, Autonomous Vehicles (AVs) are currently at
the forefront of both public and private consciousness. At this stage, it is highly uncertain what will be
their adoption rate and their future market penetration as they depend on a variety of factors,
including take-up of autonomous vehicles by manufacturers and public attitudes. Potential impact of
autonomous vehicles is also a hot topic of discussion among researchers. What is certain is that a

D1.1 Review of new forms of mobility, freight distribution and their business models; gaps identification in KPIs and SUMPs
30
hellish scenario might happen if AVs will be individually-owned and gasoline-powered. On the other
hand, if they will be electrically-powered and used for shared trips in shared cars, they have the
potential to make cities more livable, sustainable, and equitable: sharing cars will reduce the need for
parking, sharing trips will reduce congestion, and people will have the chance to get door-to-door
transport with an individualised service comparable to private car travel, for the cost of a subway
ticket.
Beyond AVs, the market analysis forecasts a huge business potential for future automated aerial
services, such as Air Taxis. Different kind of missions are under consideration by many stakeholders.
In the perspective of this vision, industry is developing different types of unmanned aircrafts to enable
future aerial mobility services, also interconnected with those of other transport modes. The vision for
the future is to have urban air mobility brought to the customer on request.
In addition to the new technologies available, the development of innovative services and new
paradigms of mobility is going to shape the future of how people will move around in the future. These
paradigms include the concept of both vehicle and ride sharing. Travel behaviors are expected to
change and services such as car-sharing, bike-sharing, and ride-sharing are expected to grow.
However, they are unlikely to be transformative without clear incentives and stimulus from
government or industry to boost their uptake. Even if people are counting more and more on sharing
options, these alternatives are currently constrained by their low ease of use, cost, social norms, and
potential risks of travelling with strangers. In addition, the success of shared car travel will highly
depend on an effective public transport system that can fill the gaps. This is because sharing
alternatives alone won’t be able to satisfy all of a household’s travel needs. It is safe to say that
vehicle sharing and ride sharing will bring changes in urban driving and driver’s behavior. However,
they are not a true game changer as they won’t redirect a stream of revenues to a disruptive upstart,
and they won’t spark a widespread change in consumption.
Finally, Mobility as a Service will bring the opportunity to provide flexible, tailored mobility with
minimal costs. The ultimate scope of MaaS is to integrate multiple modes of transport in order to
provide a single mobility solution, through ride-sourcing, route-planning and ticketing apps. Central to
the concept is that the overall journey is more important than the mode used, placing the user at the
heart. There are indications that it can have positive impacts on public transport services and active
modes, removing private vehicles from roads (see chapter A2.2.3 ). Even if it is technologically
feasible, it will require altering well-established financial and organizational structures and systems,
and coordination across public and private transport operators, as well as differing regulations.
New technologies and service will be pivotal in defining the future of urban logistics as well. Freight
delivery is already being asked to respond to a challenging twofold task. On one hand, it must satisfy
the demand of globalized trade in which customer’s expectations grow daily (by 2025, the online retail
sector will have risen to nearly 20% of total retailing), on the other, it has to take into account the
overall sustainability of the city environment.
Among the new technologies that will affect logistics, automation will be at the centerpiece. As cyclists
are today’s symbol of alternative delivery options, the future will see automation playing a central role,
with electric robots and drones increasingly occupying pavements and the urban sky. Autonomous
Vehicles for freights are already moving from an in-house transport in warehouse and distribution
centres to a next step via the development of fully and semi-autonomous long-haul truck
manufacturers. Similarly, large companies and startups have already started to experiment with the
development of short-range delivery robots (bots) to fulfill the last-mile deliveries from a local depot
to the final recipient. Finally, a lot of efforts are put into drones for freights, considering their

D1.1 Review of new forms of mobility, freight distribution and their business models; gaps identification in KPIs and SUMPs
31
capability to avoid surface congestions and delays, to offer a faster a customized delivery, and to
improve the market access for remote places. At the moment, they are still at a very experimental
ground, however they are definitely more than a mere concept and not that far from real life scenario.
Beside the new technologies, a lot on innovative freight delivery services are constantly being
tested and implemented in order to keep up with the growing demand for the delivery of goods and
services. Crowdshipping, a platform that employs technology to marshal a large group of people to
accomplish deliveries, is now a rising paradigm that could provide some help towards the challenges
posed by increasing urbanization and e-commerce. Currently, most of crowdshippers are startups, but
some big companies are arriving.
Finally, in order to limit air and noise pollution linked to the increasing volume of traditional freight
vehicles, many urban areas are witnessing an increase in the employing alternative vehicle types for
delivery. Cargo bikes represent the main one, as it can be a more cost-effective method when
compared to delivery trucks within dense urban areas, and holds the great potential to tackle some of
the detrimental effects associated with heavily polluting vehicles for last mile deliveries, especially in
cities with an already well-established cycling infrastructure.
A3.2 Future scenarios and projected timeline
Having in mind the projected timeline of the new services and technologies mentioned above,
different baseline scenarios can be defined for short-term, mid-term, and long-term regional and
transport planning.
For the purpose of this deliverable, it is assumed that a short-term scenario describes the mobility in
the near future, i.e. with a time horizon of maximum 5 years, basically considering services already
available. A medium-term scenario is assumed to take into account forecasts up to 15 years from
today, including technological aspects which are almost ready. A long-term scenario is assumed to
look further into the future, i.e. with a time horizon from about 15 to 30 years, up to 2050.
In the short-term, the time seems not ripe yet to expect the diffusion of disruptive technologies such
as AVs, air taxis, robots and drones. It is therefore assumed that within the next 3 years urban
mobility will mainly be supported by the further development of sharing services and MaaS for
passengers and crowdshipping and cargo bikes for freight.
The following Figure 9 provides an overview of the projected timeline of the new services and
technologies.
Looking over the next decade, in the medium term some of the new services and technologies are
assumed to appear in the urban mobility context. Autonomous vehicles nowadays still face many
technological challenges as well as issues with regulatory constraints, customer trust and affordability
and it will take several years before this technology is widely deployed. Nevertheless, it can be
assumed that over the next decade AVs will likely gain more traction, and adoption rates will start to
grow first for freight and then for passenger. Over time, as the technology advances and public
acceptance increases, also delivery robots will likely become more popular and their commercial
rollouts can be expected on the market. Finally, the use of drones will likely grow once new
regulations are issued and as the economics continue to improve, likely at the beginning with a
primarily use by large retailers, such as Amazon and Walmart.
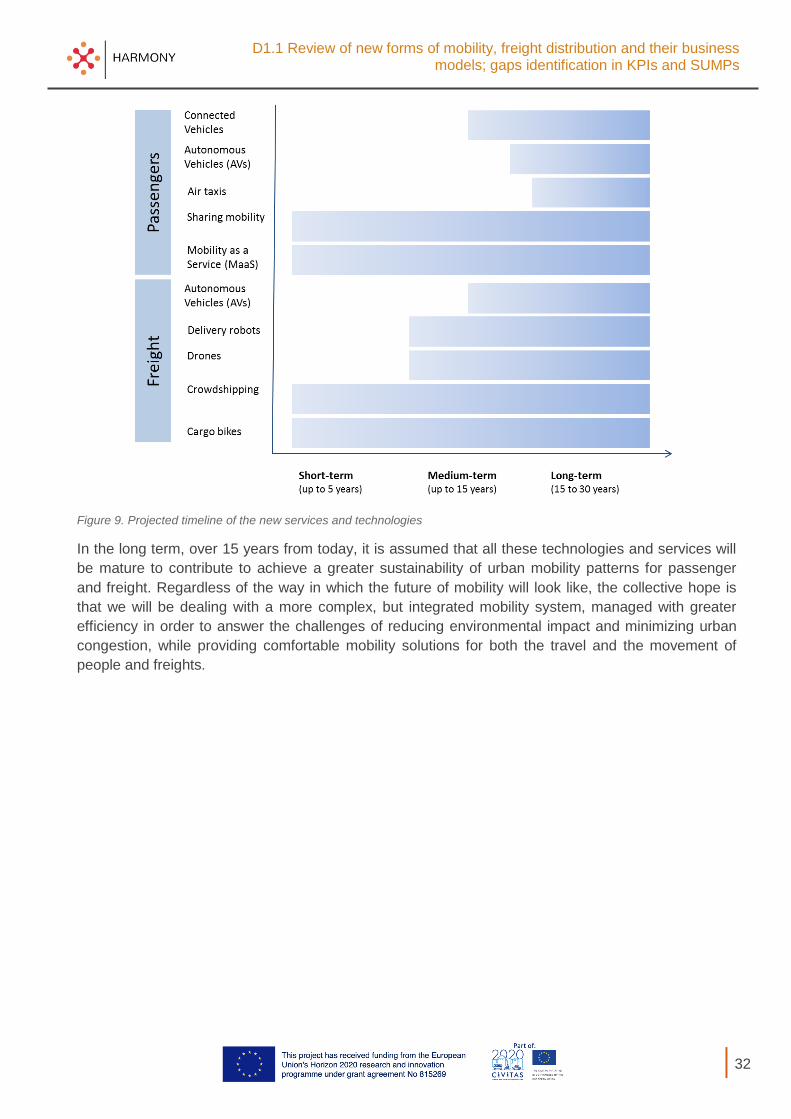
D1.1 Review of new forms of mobility, freight distribution and their business models; gaps identification in KPIs and SUMPs
32
Figure 9. Projected timeline of the new services and technologies
In the long term, over 15 years from today, it is assumed that all these technologies and services will
be mature to contribute to achieve a greater sustainability of urban mobility patterns for passenger
and freight. Regardless of the way in which the future of mobility will look like, the collective hope is
that we will be dealing with a more complex, but integrated mobility system, managed with greater
efficiency in order to answer the challenges of reducing environmental impact and minimizing urban
congestion, while providing comfortable mobility solutions for both the travel and the movement of
people and freights.
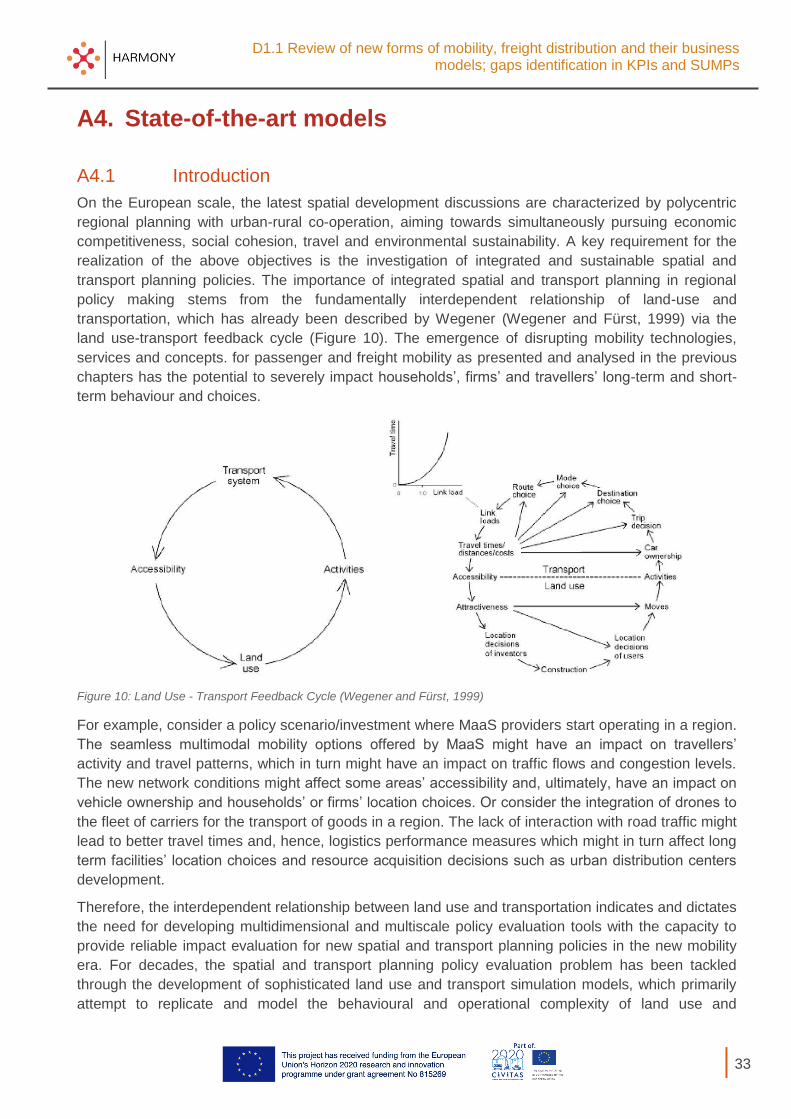
D1.1 Review of new forms of mobility, freight distribution and their business models; gaps identification in KPIs and SUMPs
33
A4. State-of-the-art models
A4.1 Introduction
On the European scale, the latest spatial development discussions are characterized by polycentric
regional planning with urban-rural co-operation, aiming towards simultaneously pursuing economic
competitiveness, social cohesion, travel and environmental sustainability. A key requirement for the
realization of the above objectives is the investigation of integrated and sustainable spatial and
transport planning policies. The importance of integrated spatial and transport planning in regional
policy making stems from the fundamentally interdependent relationship of land-use and
transportation, which has already been described by Wegener (Wegener and Fürst, 1999) via the
land use-transport feedback cycle (Figure 10). The emergence of disrupting mobility technologies,
services and concepts. for passenger and freight mobility as presented and analysed in the previous
chapters has the potential to severely impact households’, firms’ and travellers’ long-term and short-
term behaviour and choices.
Figure 10: Land Use - Transport Feedback Cycle (Wegener and Fürst, 1999)
For example, consider a policy scenario/investment where MaaS providers start operating in a region.
The seamless multimodal mobility options offered by MaaS might have an impact on travellers’
activity and travel patterns, which in turn might have an impact on traffic flows and congestion levels.
The new network conditions might affect some areas’ accessibility and, ultimately, have an impact on
vehicle ownership and households’ or firms’ location choices. Or consider the integration of drones to
the fleet of carriers for the transport of goods in a region. The lack of interaction with road traffic might
lead to better travel times and, hence, logistics performance measures which might in turn affect long
term facilities’ location choices and resource acquisition decisions such as urban distribution centers
development.
Therefore, the interdependent relationship between land use and transportation indicates and dictates
the need for developing multidimensional and multiscale policy evaluation tools with the capacity to
provide reliable impact evaluation for new spatial and transport planning policies in the new mobility
era. For decades, the spatial and transport planning policy evaluation problem has been tackled
through the development of sophisticated land use and transport simulation models, which primarily
attempt to replicate and model the behavioural and operational complexity of land use and
D1.1 Review of new forms of mobility, freight distribution and their business models; gaps identification in KPIs and SUMPs
34
transportation systems capturing the evolution of and interactions between demand and supply
through time and space. Land use simulation models focus primarily on predicting the economic and
demographic activities such as households’ and firms’ location choices (strategic decisions).
Transport demand simulation models operate on a more granular level predicting either mode-specific
trips or individuals’ daily activity schedules including their respective departure time, destination and
mode choices (tactical decisions), while traffic simulation models emulate within-day transport system
dynamics including traffic propagation, including individual’s dynamic route choices and driving
behaviour, leading to the need of an accurate representation of the infrastructure.
However, the added modelling complexity that new disruptive mobility services and technologies
introduce has only recently started being investigated and integrated into transport simulation tools
from either a behavioural or operational perspective. Efficient policy making for evaluation of new
passenger and freight mobility concepts requires comprehensive representation of their
organizational, behavioural and operational dynamics. Preferences for new technologies like AVs and
drones or personalized multimodal app-based mobility services (e.g. ride-hailing, MaaS) require more
disaggregate demand modelling approaches (microsimulation) based on the activity-based modelling
paradigm (Jittrapirom et al., 2017). At the same time, the operational dynamics that new services and
technologies introduce need to be integrated into large-scale simulation models (Kamargianni et al.,
2019; Basu et al., 2018) and enable, thus, assessing their impact on network performance, energy
and emissions levels.
In this chapter, we provide an overview of the state-of-the-art in large-scale land-use, transport
demand and transport supply modelling and simulation approaches for both passenger and freight
systems. We further identify and evaluate the scientific and technical challenges on extending and
updating existing models towards efficiently modelling disruptive mobility concepts and evaluating
integrated land use and transport policies for the new mobility era.
A4.2 Spatial and regional planning models
A4.2.1 Demographic forecasting models
The first step in developing an activity-based or agent-based model is to define the unit of analysis;
people, households and businesses for passenger and freight simulation models. A common term for
this step is “population synthesis” which implies the development of a synthetic population,
introducing agents and their relationships, as well as, the geographic allocation of agents,
households, firms or vehicles. A primary source of data is a census survey, which is periodically
conducted in most countries. Population synthesis models usually care to fill in gaps of such data and
to combine census data with travel survey, time-use or other kind of data to: a) recreate realistically
the population of the study area and b) to optimally prepare datasets for the use of future modules in
the activity-based model. Müller and Axhausen (2011) deliver a state-of-the-art review of population
synthesizers. The following table presents a list of such population synthesizers.
A common goal for all software packages and modules is to provide a solution that takes into account
all the different geographic contexts, respects individual and household marginal distributions,
optimally in an open-source software module. Additionally, taking advantage of publicly available
location data (e.g. Google Places API or OpenStreetMaps) can lead to more realistic syntheses and
least intensive data collection and processing.

D1.1 Review of new forms of mobility, freight distribution and their business models; gaps identification in KPIs and SUMPs
35
Table 12. Population synthesizers
Model Name Key functionalities - components covered
Data requirements Authors / Lab/Company
PopSynWin Adjusting household selection probabilities based on individual probabilities. Used for Chicago, IL
Census data at the highest resolution available (TAZ, neighborhood, block) Establishments/buildings by category
(Auld and Mohammadian, 2012)
ILUTE Used for large attributes spaces, developed for Toronto, Canada
(Salvini and Miller, 2005)
PopGen Standalone software package. Utilizes novel technique based on Iterative Proportional Fitting (IPF) to simultaneously fit household and individual marginal distributions
Ye et al. (2009)
FSUMTS Developed for Florida, uses probabilistic procedure to allocate households
Srinivasan and Ma
CEMDAP Part of the CEMDAP simulator (see section 3.3)
Bhat et al. (2004)
ALBATROSS Part of the ALBATROSS simulator (see section 3.3)
Arentze et al. (2009)
A4.2.2 Regional Economic models
Regional economic models (REM) were created to forecast socioeconomic variables (employment,
population, growth, income, consumption). In early stages, these models were usually
macroeconomic models due to lack of computational power and statistics, while the emergence of
computers and data availability gave rise to Leontief approaches (Input Output Tables). While the first
generation of models had solid economic ground for forecasting but lacked empirical validation, the
second generation was the exact opposite. But the REM field grew in both vertical and horizontal
directions, giving birth to new methods and merging among them. Shift – Share was created as a
simple and straightforward approach but for descriptive purposes only. On the other hand,
Programming approaches were conceived for strictly normative purposes like maximizing specific
variables or finding optimal distributions. The last modelling technique is the econometric approach,
which derives from macroeconomic theory but enlarged by blending with other methods like gravity-
type, spatial integration or input-output models. The brief history of regional economic modelling
provides a simple but powerful conclusion, no perfect universal model exists. The criteria for the
approach selection are crucial, it should take under consideration three main aspects: resources
(budget, time and data), scope (forecasting, describing or analyzing) and dimension (time and space)
of the project.
The Regional Economic module must be adjusted to fit with other modules and interact soundly to
provide generate data and provide meaningful information. HARMONY intends to conceive an
integrated, long term, trend-based forecasting model for policy making. Regional level data is difficult
to gather and usually has to be estimated, therefore a Leontief-based approach will lack its main
advantage, precise data-driven modelling. On the other hand, Programming has little flexibility for
integration and accuracy for long-term forecasting. Hence, the econometric method is the most
suitable as it is data driven, easily integrated, and do not compromise the model’s verification and
validation.
Econometric modelling distinguishes not for the underlying theory, but for the way the model is
specified and how coefficients are estimated. While Input Output approaches are naturally rigid

D1.1 Review of new forms of mobility, freight distribution and their business models; gaps identification in KPIs and SUMPs
36
because they are based in the Leontief Matrix (limiting the algebra), econometric model can be
modelled through a great deal of methods, allowing the module to be adapted and shaped in order to
satisfy both integration with the complete model and fitting the data for the module self-functioning
while keeping the forecasting and descriptive power needed for the project. Table 13 provides an
overview of the major models developed in regional economic studies along with their key
functionalities. It must be noticed that RHOMOLO is the only one designed specifically for Europe,
while REMI, IMPLAN and RIMS II were built for the U.S.A. A more detailed description of these
models is reported in the Annex.
Table 13. Overview of the existing Regional Economic models and their key functionalities
Model Name
Key functionalities - components covered Data requirements
Authors / Lab/Company
MAAST Macroeconomic, sectoral, social, territorial model. Solid economy description and scenario creating for reliable forecasting. Great trade-off balance between model fit and data collection easiness.
National and NUTS2 data
Roberta Capello
RHOMOLO General equilibrium model. Strong theoretical base in regional economics and interregional links. The downside is difficulty to collect and then fit the data to the model needs.
National and NUTS2 data, Industry specifics
JRC + DG REGIO
RED Economic base analysis and shift share. Solid theoretical base and clear economic description. Methodology too simple for the project’s scope.
National data with regional horizontal parameters
James Paul Quintero, Texas University
REMI Econometric and I-O model. Precise forecast of economic performance and industry trends. Data needs to feed the model are overwhelming.
National data, Regional specifics, Industry specifics
Regional Economic Models, Inc.
IMPLAN Pure I-O analysis. Impressive detailed composition and interaction among industries, but lack of overall economic description and difficult for forecasting.
Regional specifics, Industry specifics
IMPLAN Group, LLC.
RIMSII I-O analysis and Survey method. Detailed industrial composition for forecasting and analyzing but lacks interregional links and many resources are needed for feeding the model.
National data, Regional specifics, Industry specifics
Bureau of Economic Analysis, USA.
A4.2.3 Land Use Transport Interaction Models
Land Use Transport(ation) Interaction (LUTI) models essentially explain the location of economic and
demographic activities at a scale usually above Traffic Analysis Zones (TAZ) but provide simulations
of trips linking these activities to one another at a scale somewhat coarser than the conventional
transportation models discussed elsewhere in this review. Although they are called land use models,
insofar as land use or its proxies are to be predicted by such models, these involve a translation of the
main locational activities such as population and employment into land use requirements which is a
related but different spatial layering of the urban system than the activity layer. The coarser
distribution of trips from such models usually act as a constraint on more detailed simulations of
transportation associated with the conventional transportation models. LUTI models increasingly
simulate activities using accessibility measures computed from finer scale transport models that are
operated in such a way that the land use simulation plugs into the transportation model and vice
versa.
In short, the land use model is separate from the transportation model, often built at different spatial
scales but linked through a close coupling which enables land use to be input to the transportation
models and the trips from this model to be converted into more aggregate measures of accessibility

D1.1 Review of new forms of mobility, freight distribution and their business models; gaps identification in KPIs and SUMPs
37
that determine the location of land use and their respective activities. This is increasingly the case in
LUTI models, that is, that as the transportation and land use components have got more detailed and
complicated, rather than being developed in an integrated way, they are loosely coupled with land use
and transportation models iterating with one another so that capacity constraints and other locational
limits can be taken account of (Moeckel, 2018; Moeckel et al., 2018). A good example is the LonLUTI
model built by David Simmons Consultants for Transport for London (TfL) which interfaces with the
London Transportation Studies Model (LTS). In this section, a brief review of the existing LUTI models
is provided. The essence of these models as well as a more detailed review is given in Annex 2.
Table 14 presents the list of the reviewed LUTI models. Each of them follows the broad structure of
activities shown in Error! Reference source not found. although some explicitly link to external
transport models. In such cases, transportation is modelled either implicitly through accessibility
indicators as in the very first models of the genus by Lowry (1964) or by interacting with fully-fledged
transportation models as with the DSC London model LonLUTI which interfaced with the London
Traffic model System LTS. A detailed review of these models is provided in the Annex 2.
Figure 11. The Urban Model Family Tree (EUNOIA, 2013).
Table 14. A List of the LUTI Models Reviewed
Model Launch Year
Typical Application Area
Key Reference and/or Website
Model Availability
MEPLAN 1969
Sacramento, London, Dortmund, Helsinki, Cambridgeshire, Caracas, Naples, Bilbao, San Paulo, Santiago
Discontinued when merged with WSP but continued under REVISIONS and LUISA below Echenique et al. (1990)
With consultancy only but now discontinued
TRANUS 1979 Baltimore, Over 100 cities and metropolitan areas in
http://www.tranus.com/tr anus-english
Free to download but also
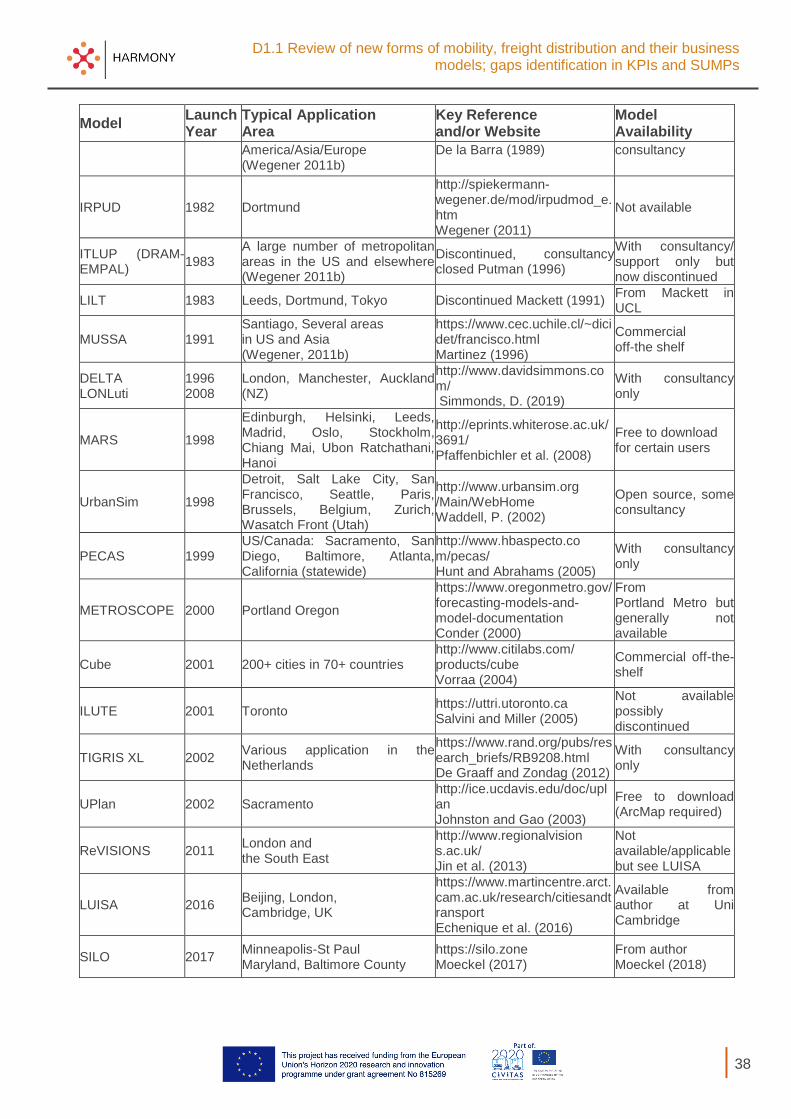
D1.1 Review of new forms of mobility, freight distribution and their business models; gaps identification in KPIs and SUMPs
38
Model Launch Year
Typical Application Area
Key Reference and/or Website
Model Availability
America/Asia/Europe (Wegener 2011b)
De la Barra (1989) consultancy
IRPUD 1982 Dortmund
http://spiekermann-wegener.de/mod/irpudmod_e.htm Wegener (2011)
Not available
ITLUP (DRAM- EMPAL)
1983 A large number of metropolitan areas in the US and elsewhere (Wegener 2011b)
Discontinued, consultancy closed Putman (1996)
With consultancy/ support only but now discontinued
LILT 1983 Leeds, Dortmund, Tokyo Discontinued Mackett (1991) From Mackett in UCL
MUSSA 1991 Santiago, Several areas in US and Asia (Wegener, 2011b)
https://www.cec.uchile.cl/~dicidet/francisco.html Martinez (1996)
Commercial off-the shelf
DELTA LONLuti
1996 2008
London, Manchester, Auckland (NZ)
http://www.davidsimmons.com/ Simmonds, D. (2019)
With consultancy only
MARS 1998
Edinburgh, Helsinki, Leeds, Madrid, Oslo, Stockholm, Chiang Mai, Ubon Ratchathani, Hanoi
http://eprints.whiterose.ac.uk/3691/ Pfaffenbichler et al. (2008)
Free to download for certain users
UrbanSim 1998
Detroit, Salt Lake City, San Francisco, Seattle, Paris, Brussels, Belgium, Zurich, Wasatch Front (Utah)
http://www.urbansim.org /Main/WebHome Waddell, P. (2002)
Open source, some consultancy
PECAS 1999 US/Canada: Sacramento, San Diego, Baltimore, Atlanta, California (statewide)
http://www.hbaspecto.co m/pecas/ Hunt and Abrahams (2005)
With consultancy only
METROSCOPE 2000 Portland Oregon
https://www.oregonmetro.gov/forecasting-models-and-model-documentation Conder (2000)
From Portland Metro but generally not available
Cube 2001 200+ cities in 70+ countries http://www.citilabs.com/ products/cube Vorraa (2004)
Commercial off-the- shelf
ILUTE 2001 Toronto https://uttri.utoronto.ca Salvini and Miller (2005)
Not available possibly discontinued
TIGRIS XL 2002 Various application in the Netherlands
https://www.rand.org/pubs/research_briefs/RB9208.html De Graaff and Zondag (2012)
With consultancy only
UPlan 2002 Sacramento http://ice.ucdavis.edu/doc/uplan Johnston and Gao (2003)
Free to download (ArcMap required)
ReVISIONS 2011 London and the South East
http://www.regionalvision s.ac.uk/ Jin et al. (2013)
Not available/applicable but see LUISA
LUISA 2016 Beijing, London, Cambridge, UK
https://www.martincentre.arct.cam.ac.uk/research/citiesandtransport Echenique et al. (2016)
Available from author at Uni Cambridge
SILO 2017 Minneapolis-St Paul Maryland, Baltimore County
https://silo.zone Moeckel (2017)
From author Moeckel (2018)

D1.1 Review of new forms of mobility, freight distribution and their business models; gaps identification in KPIs and SUMPs
39
A4.2.4 Land supply and development models
Most LUTI models articulate the urban system from the point of view of demand for activities or land
uses. The supply of these variables is seldom modelled explicitly as the process of providing facilities
that satisfy their demands for residential, services and industrial locations is part of a much more
tortuous process of land development that cannot easily be generalised. Whereas in LUTI models the
main variables are based on employment and population at different scales of disaggregation all the
way down to agents such as households and individuals, and firms, the provisions of facilities for
meeting these demands involves the development process that is dominated by more idiosyncratic
factors such as the availability of capital, land ownership and tenure, international ownership of land,
constraints posed by government policy such as greenbelts and a host of other more local and global
factors that pertain to the particular cultural, political and technological contexts.
The land development process at the level of developers and related agents is lumpy to say the least
and thus the kinds of models that have been developed tend to be backcloths that define key
variables but do not presume some sort of standardised decision process. Insofar as decision
processes are modelled, these are rule-based and thus cellular automata and agent-based models
that contain many more qualitative factors are relevant. In fact, insofar as formal models of land
supply have been developed these are incorporated within the LUTI models structures as ways in
which the demand for land which comes from the demand side of those models generates a supply
which is predicted from the land available. If demand does not equal supply in this context, usually a
price for the land is fixed or rather a predetermined price for land is changed so that demand and
supply are likely to balance. Demand for too much land leads to a rise in price of land which is then
fed back into the model which acts to reduce demand on the next round and in this way an iterative
process of matching demand to supply occurs which is likely to lead to some equilibrium where
demand is equal to supply,
These kinds of mechanisms are built into some LUTI models particularly those that deal with housing
markets and retail activities where floorspace is one of the key intermediate variables. The same
kinds of demand-supply mechanisms are sometimes involved in terms of the allocation of trip
movements to the highway which in turn activates a process of balanced which is often referred to as
capacity constrained modelling. In the models to be built in HARMONY, we will probably build our
own market mechanisms from scratch but use ideas from many of the more elaborate and recent
LUTI models such as UrbanSim and SILO. A good review of all these models from the residential side
and from the employment side are continued in the key edited books noted above.
A4.2.5 Translators for aggregate to disaggregate models
The demographic, economic, land use transportation interaction, and land supply models reviewed
here for the most part deal with spatially aggregated activities, that is, summations of data pertaining
to population, economic activities such as employment, income and related attributes of employment
and population, land use activities, and physical development which pertain to spatial zones that are
extensive in area with hundreds if not thousands of units, objects or peoples. Typically in
demographic and economic models these may be large areas such as entire cities or regions while in
LUTI models these will be at the scale of traffic analysis zones (TAZs), or larger such as output areas
in terms of the UK Census geography and/or block groups or census tracts in terms of the US
Population Census. It is rare for these models to be built at the level of the most detailed census
geography although some models such as UrbanSim and PECAS attempt to model the urban system
at the level of land parcels where individuals (agents) can be explicitly defined.

D1.1 Review of new forms of mobility, freight distribution and their business models; gaps identification in KPIs and SUMPs
40
One basic reason for working at more aggregate levels than individuals and parcels is one of data
availability, which in turn is directly attributable to confidentiality and privacy restrictions. Data is
invariably collected at the individual level but because the rights of individuals are enshrined in
legislation to forbid the release of their data in the public domain, data is aggregated to a level at
which it is impossible to reveal any attributes pertaining to the individual. This is in terms of public
data but this still tends to be the gold standard for the models reviewed here where individual data is
extremely hard to assemble from open sources. Another reason for working at the aggregate level is
that as we aggregate, we generalise and our data becomes more homogeneous. In this sense,
aggregate models being more parsimonious are likely to generate better fits and also reveal more
generic, less idiosyncratic behaviour. In short – although we rarely ever test this, the law of large
numbers is more appropriate for aggregate data.
However the real problem with scaling interactions between different spatial scales relates to the
networks at these different scales and therein lies a major problem which is one of our greatest
challenges which we note below. Our LUTI models, for example, usually model transportation flows at
a coarser level than more disaggregate models – either four stage or microsimulation models – where
essentially the network is at a much finer level. An example suffices. If we build a land use
transportation model at say the census tract level, we need a network at that level and this has to be
constructed from a network at a finer spatial scale and thus there is an issue in how this is to be done.
It is usually accomplished by using rules of aggregation that aggregate intersections between
segments or arcs into larger segments and in so doing aggregate nodes so that eventually nodes
pertaining to each spatial units at the LUTI model scale are generated. This involves various
assumptions about how people travel on the fine scale network compared to the more aggregate
scale. The LUTI model is then run using the coarser network. The problem then becomes: how are
the LUTI model predictions of trips factored down to the finer scale network where often congestion
and capacities are measured? If capacity constraints are to be involved, this is necessary and thus a
factorization in reverse from the way the coarser network has been constructed in the first place is
required. There is no standard procedures for this process and it is usually accomplished
pragmatically. It is a major issue in linking more aggregate models to disaggregate and will preoccupy
us throughout HARMONY. Thus there is no standard template for enabling such translations to take
place; in other words they are all based on common-sense factorizations where one variable is used
as a proxy to allocate another subject to various control totals that often pertain to the different spatial
scales. This is a major issue however in linking models at different scales and remains one of the
major gaps in linking models together that we will address in section 3.2.6 which follows.
A4.2.6 Challenges and gaps
There are three key challenges amongst the many that we need to grasp in HARMONY with respect
to the models of this section. The first relates to spatial aggregation which given that these models
deal with population and employment – demography and economy as well as the flows between them
measured as trips – translates to questions of how we derive individuals from these aggregates.
Individuals at the level of trip-makers or households are key to the microsimulation transportation
models that form the reviews in the other parts of this chapter. The translators noted in section 3.2.5
are relevant here while the various methods of population synthesis that are used to generate data for
microsimulation play a part. The question is whether HARMONY will develop new methods for model
coupling in these terms.
The second challenge relates to dynamics. Most of the models reviewed here are temporally static,
simulating the structure of the city system at a cross section in time. Even though the microsimulation
models simulate trip making throughout the typical working day, in terms of urban structure these

D1.1 Review of new forms of mobility, freight distribution and their business models; gaps identification in KPIs and SUMPs
41
models are still cross-sectional because they only simulate activities during a typical day which is a
kind of cross-section in itself. The notion of long-term change over years and even decades is not
really part and parcel of the more detailed transportation models which we focus on here. Arguably
this limits these models in that they cannot deal with the impact of large infrastructure projects that
take place over years although in the time honoured way, the impacts of these changes are assumed
to be predictable through the comparative static approach which underlies the testing of ‘what if’
scenarios.
Data is a major challenge in these models. In particular, trip distributions that are required for the
mainstream transportation models are often incomplete and difficult to source unless one-off
transportation studies/households surveys have been conducted which are expensive. Ways of
synthesizing different types of movement data together have been explored but there are always
difficulties of combination since there is rarely a common key available to stitch different data sets
together. Work with extracting transportation data from other related interaction data sets from the
Call Data Records (CDR) of mobile phones calls and social media data from the platform companies
is suggestive but problematic in the extreme. In fact, these challenges are central to the transportation
models review elsewhere in this review and we will not explore them further in this section. In fact, a
bigger problem is getting data on detailed employment for the input-output and economic forecasting
models for such linkage and flows which determine the social accounting in many LUTI models.
These I/O models either drive LUTI models externally or are modelled internally but they depend on
very detailed data that is usually not available and has to be pieced together from diverse sources. No
standard practice is available although various kind of iterative factoring dominate this area of
application.
A4.3 Agent-based simulation models for passengers A4.3.1 Overview of Agent-Based models for passengers
A multitude of agent-based transport simulation models for passengers exists. During the last
decades there have been robust cases of development and usage of such models and given the
increased complexity of human behaviour regarding transportation decisions and the growing
availability of human generated data in the field, recent advances in agent-based modelling are
aiming towards a robust integration of behavioural modelling and growing capability of explanatory
power of the models. In this section, we perform a state-of-the-art review of agent-based models
(ABM) for passenger transport and discuss challenges and opportunities for the HARMONY MS.
Activity-based transport models started to appear and gain popularity in 1990s, mostly acting as an
alternative to the traditional 4-step transport simulation model (Mcnally, 2007). Activity-based models
focus more on the behavioural aspect of transportation and shift the focus to a more disaggregate
analysis (person and household become the unit of analysis), rather than the aggregate traffic zones
of the 4-step model. This shift is based on the idea that demand from transport is a derived demand,
mostly originating from the demand to conduct activities that are disperse in space and time.
To achieve an in-depth analysis of human travel behaviour, activity-based models aim to model
decisions in different temporal context ranging from strategic decisions (household location) to within-
day mode choice for specific trips. A general structure of decisions modelled is the following (Bradley
and Bowman, 2006):
Population synthesis (location of households, family dynamics)
Long term decisions (e.g. car ownership)
Person or household daily schedule
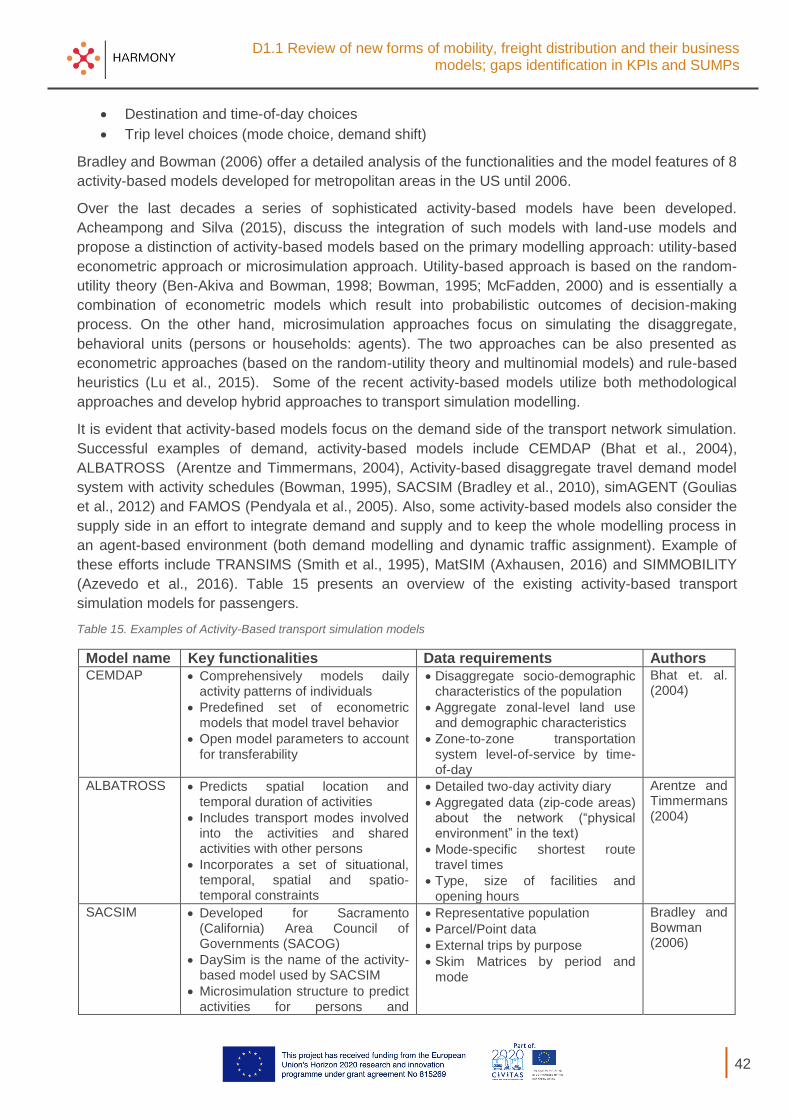
D1.1 Review of new forms of mobility, freight distribution and their business models; gaps identification in KPIs and SUMPs
42
Destination and time-of-day choices
Trip level choices (mode choice, demand shift)
Bradley and Bowman (2006) offer a detailed analysis of the functionalities and the model features of 8
activity-based models developed for metropolitan areas in the US until 2006.
Over the last decades a series of sophisticated activity-based models have been developed.
Acheampong and Silva (2015), discuss the integration of such models with land-use models and
propose a distinction of activity-based models based on the primary modelling approach: utility-based
econometric approach or microsimulation approach. Utility-based approach is based on the random-
utility theory (Ben-Akiva and Bowman, 1998; Bowman, 1995; McFadden, 2000) and is essentially a
combination of econometric models which result into probabilistic outcomes of decision-making
process. On the other hand, microsimulation approaches focus on simulating the disaggregate,
behavioral units (persons or households: agents). The two approaches can be also presented as
econometric approaches (based on the random-utility theory and multinomial models) and rule-based
heuristics (Lu et al., 2015). Some of the recent activity-based models utilize both methodological
approaches and develop hybrid approaches to transport simulation modelling.
It is evident that activity-based models focus on the demand side of the transport network simulation.
Successful examples of demand, activity-based models include CEMDAP (Bhat et al., 2004),
ALBATROSS (Arentze and Timmermans, 2004), Activity-based disaggregate travel demand model
system with activity schedules (Bowman, 1995), SACSIM (Bradley et al., 2010), simAGENT (Goulias
et al., 2012) and FAMOS (Pendyala et al., 2005). Also, some activity-based models also consider the
supply side in an effort to integrate demand and supply and to keep the whole modelling process in
an agent-based environment (both demand modelling and dynamic traffic assignment). Example of
these efforts include TRANSIMS (Smith et al., 1995), MatSIM (Axhausen, 2016) and SIMMOBILITY
(Azevedo et al., 2016). Table 15 presents an overview of the existing activity-based transport
simulation models for passengers.
Table 15. Examples of Activity-Based transport simulation models
Model name Key functionalities Data requirements Authors CEMDAP Comprehensively models daily
activity patterns of individuals
Predefined set of econometric models that model travel behavior
Open model parameters to account for transferability
Disaggregate socio-demographic characteristics of the population
Aggregate zonal-level land use and demographic characteristics
Zone-to-zone transportation system level-of-service by time-of-day
Bhat et. al. (2004)
ALBATROSS Predicts spatial location and temporal duration of activities
Includes transport modes involved into the activities and shared activities with other persons
Incorporates a set of situational, temporal, spatial and spatio-temporal constraints
Detailed two-day activity diary
Aggregated data (zip-code areas) about the network (“physical environment” in the text)
Mode-specific shortest route travel times
Type, size of facilities and opening hours
Arentze and Timmermans (2004)
SACSIM Developed for Sacramento (California) Area Council of Governments (SACOG)
DaySim is the name of the activity-based model used by SACSIM
Microsimulation structure to predict activities for persons and
Representative population
Parcel/Point data
External trips by purpose
Skim Matrices by period and mode
Bradley and Bowman (2006)

D1.1 Review of new forms of mobility, freight distribution and their business models; gaps identification in KPIs and SUMPs
43
Model name Key functionalities Data requirements Authors households
Four integrated levels—longer term person and household choices, single day-long activity pattern choices, tour-level choices, and trip-level choices
FAMOS Produces activity patterns for individuals along the continuous time axis, respecting inter-dependency among trips due to trip chaining
Time-of-day modelling capabilities
Socio-economic data (population, household, employment)
Level-of-service data for the network zones
Household travel survey data
Pendyala et. al. (2005)
simAGENT Simulator of Activities, Greenhouse Emissions, Networks, and Travel (SimAGENT) in Southern California
Uses CEMSELTS for long term choices, POPGEN for population synthesis and CEMDAP for daily schedules and choices
Activity-based diaries
Socio-economic data (population, household, employment)
Household and business places locations
Goulias et al. (2012)
MatSIM An open-source software to implement agent-based simulation models
Activity-based model for demand
Hosts dynamic, agent-based traffic simulator
Modular approach to account for user-based extensions and use-cases
Hosts agent evolution algorithms
Network topology
Socio-demographic information
Agent plans (from travel survey)
Opening hours, location and type of points of interest (work places, shops, etc.)
Horni et al. (2016)
TRANSIMS Open-source, Integrated set of tools for regional transportation analysis
Based on a CA (cellular automata) microsimulator
Network data
Socio-demographic information
Travel survey data and activity diaries
Smith et al. (1995)
SIMMOBILITY Models decisions in three temporal levels (long-term, mid-term and short-term)
Provides an integrated solution for demand and supply simulation
Mid-term simulator (travel demand) generates daily activity schedules and trip chains for all agents and households
Includes within-day modules and agent evolution capabilities
Socio-demographic characteristics of agents
Travel survey
Network information
Land-use and vehicle ownership information (derived from existing module)
Azevedo et al. (2016)
A4.3.2 Data requirements
Data requirements are listed in Table 15. Most important input data can be organized into three major
categories: socio-demographic data (disaggregate level is desirable), travel survey data (activity or
travel survey, in some older examples level-of-service data is enough) and additional data such as
points-of-interest location and opening hours.
Socio-demographic data is the basis for the development of the activity-based model. Using
the highest resolution available, the developer can produce a detailed analysis and run the
D1.1 Review of new forms of mobility, freight distribution and their business models; gaps identification in KPIs and SUMPs
44
population synthesis modules (usually the first step in the process of developing an activity-
based model) in a block area level, or even in an individual building/household level. Socio-
demographic data found in a typical census is usually enough for the purposes of a
regional/metropolitan area model
Travel-survey data is usually the hardest to collect or have access to, but it is imperative for
the purposes of the modelling process as it contains useful information about the organization
of traveler’s choices and schedules. Data may contain tour types, trip chains and dependency,
time-of-day choices, mode choice, individual, temporal or spatial constraints, destination
choice.
Other relevant data is usually utilized by models that incorporate a traffic assignment module
and model supply and demand simultaneously (MatSIM, SIMMOBILITY or TRANSIMS for
example). These models require activity location and opening hours, network geography files,
traffic flows for calibration, available transportation systems (public transport supply and
schedules for example). Depending on the level of analysis detail, more detailed information
about the network may be needed (for example traffic lights or junction details in cases of
microscopic simulation models).
A4.3.3 Challenges and gaps
As described earlier in this review, the growing complexity of modern life, uncertainty (Petrik et al.,
2018), coupled with the unprecedented changes in computational power and data availability result in
very complex and powerful simulation models. Along with the new generation of these models, come
some considerable challenges for modellers and developers. The most important from the
HARMONY perspective are listed here:
Computational requirements of new models: Large database, model combinations and
iterative processes can result in longer run times and larger database and computational
requirements. This may be unacceptable in cases where dynamic results are expected or
specific modules of the model are dependent on live or almost live results from previous
modules.
Data needs: More complex and integrated models demand more complex and larger
datasets. Collecting this kind of data can be costly, time-consuming and ineffective. Innovative
data collection processes (Bassolas et al., 2019) and tools (Tsirimpa and Polydoropoulou,
2015; Cottrill et al., 2013), as well as, human-generated data (Drchal et al., 2019) may provide
an alternative and a smart way to facilitate this process
Data privacy: Recent data protection regulation (such as GDPR) makes data collection and
data processing of sensitive private information harder. Activity-based models feed on
personal transport and activity data, reshaping the way data is collected and handled is
imperative to account for the needs and regulations of the new era.
Changing societies: Socio-demographic changes (aging population, climate change,
immigration, global economic situation, technological developments) can shift attitudes,
perceptions and trends regarding home location choice, vehicle ownership and usage and
other transport-related decisions. These should be considered in our modelling efforts.
Modelling frameworks such as hybrid-choice models can incorporate latent traits into the
decision-making process modelling.
New forms of mobility: Autonomous vehicles, mobility-as-a-service, drones (Grether et al.,
2013; Mualla et al., 2019), shared vehicles (Salanova Grau et al., 2018), active transportation
(Ziemke et al., 2017) are innovative modes of transport which will shape the city of tomorrow.

D1.1 Review of new forms of mobility, freight distribution and their business models; gaps identification in KPIs and SUMPs
45
Major effort has to be committed to modelling the effect of new forms of mobility on the
transport system. HARMONY aims to explore this effect as one of its main goals.
Integration of metropolitan, regional and national models: Towards an EU-wide model or
further integration, finding common ground, sharing parameters or modules and exploring
heterogeneity.
A4.4 Agent-based simulation models for freight A4.4.1 Overview of models
Freight simulation models are an important tool for policymakers to analyse the effects of different
freight policies and scenarios on factors such as emissions and congestion. Traditionally these
models have followed the four-step modelling approach developed for forecasting passenger travel
demand. These aggregate freight models can be divided into trip-based models, which predict trips
directly, and commodity-based models, which predict commodity flows which are then assigned to
trips (FHA, 2007). Examples of aggregate commodity-based freight models are the freight model of
the European TRIMODE transport model and the Dutch national freight model BasGoed.
As logistics behaviour is becoming increasingly complex, these aggregate models fail to provide the
necessary detail to answer many relevant policy questions. For example, the effects of logistics
concepts such as just-in-time deliveries, urban consolidation centres and e-commerce cannot be
analysed with aggregate four-step freight models. Therefore, newer freight models are getting more
and more disaggregate. In disaggregate models the logistics behaviour is represented in finer detail.
For example, decisions may be modelled at the level of shipments between firms instead of
commodity flows between zones. As such, these models are able to account more accurately for the
complex nature of logistics (e.g. multimodal supply chains, multi-agent decision making, complex
truck tours). The most detailed models, agent-based models (ABM), feature an explicit representation
of agents and in some cases their interactions and learning processes.
Two of the earliest freight modelling efforts that include disaggregate components are SMILE
(Tavasszy et al., 1998) and GoodTrip (Boerkamps and van Binsbergen, 1999). In SMILE the
development of freight demand is forecasted on a year-to-year basis using make-use tables and
economic growth trends as input. Resulting goods flows are divided into shipments after which a
logistics choice model assigns the shipments to distribution chains based on total logistics costs
(inventory, handling and transport). While SMILE covers all freight transport on the Dutch transport
network, the GoodTrip model focuses on urban distribution of supermarket goods in Groningen, the
Netherlands. The GoodTrip model also features a truck tour formation step and a traffic assignment to
obtain network indicators such as total emissions and vehicle kilometres. The Tokyo urban goods
delivery model of Wisetjindawat et al. (2006) follows a similar design structure. In this model, shipper
agents choose the vehicle type and carrier with the lowest costs and the carrier agents form tours
which minimize transport costs.
The regional travel model of Calgary, Canada further emphasizes tour formation with its tour-based
architecture for commercial vehicle transport (Hunt and Stefan, 2007). Incorporating tour formation
allows to consider that trucks often perform multiple deliveries in a single tour and, consequently,
allows to improve forecasts of vehicle Origin-Destination (OD) patterns. The commercial vehicle
model of Calgary consists of the following three main steps: firstly the number of tours originating from
each zone is estimated using regression models, secondly the vehicle type choice, tour purpose and
departure time are determined with discrete choice models and empirical distribution sampling, and
finally tours are formed. Instead of applying normative tour optimization methods, Hunt and Stefan
(2007) model tour formation using an incremental trip chaining approach in which discrete choice

D1.1 Review of new forms of mobility, freight distribution and their business models; gaps identification in KPIs and SUMPs
46
models guide the decision for ‘next stop locations’ and the decision to return to the home base. These
discrete choice models are estimated on truck tour diary data.
De Jong and Ben-Akiva (2007) developed the Aggregate-Disaggregate-Aggregate (ADA) approach in
which the shipment size choice of shippers and the transport chain choice of forwarders/carriers are
modelled. The ADA framework allows modelling these disaggregate choices in an aggregate freight
model by disaggregating zonal commodity flows to shipments between senders and receivers. A
constant shipment size is determined for each commodity flow by minimizing the total logistics costs.
The transport chain choice consists of three components: (1) the number of legs in the chain, (2) the
use and location of consolidation/distribution centres, and (3) the modes and vehicle/vessel types
used in each leg. It is modelled with a discrete choice model based total logistics costs. Consolidation
of shipments and related cost savings are modelled through iterative application of the transport chain
choice model. Afterwards the results are aggregated towards number of vehicles/vessels per origin-
destination pair. The ADA approach has been successfully calibrated and implemented in the national
freight models of Norway and Sweden. Samimi et al. (2010) propose using the ADA approach for
shipment size and transport chain choice too in FAME, a disaggregate model covering freight
transport in the United States.
The INTERLOG model of Germany (Liedtke, 2009) models explicitly the agent interactions that lead
to freight transport demand. Shippers, receivers and carriers are synthesized using firm size
distributions by sector and region. Production rates per firm are deduced from empirical data, while
attraction rates are based on make-use tables. Productions and attractions are then connected with a
gravity model, after which shippers and receivers decide together on the shipment size based on total
logistics costs. Shippers consider different carriers for transporting a shipment, with a preference for
carriers known from previous contracts. Carriers then determine a rate for which they would accept
the contract. For this purpose, they calculate the additional costs of inserting the shipment in the
current tour planning. As the simulation progresses, the cost minimizing behaviour of the agents, in
combination with learning processes based on previous orders and contracts, leads to a dynamic user
equilibrium of the simulated freight transport system.
FREMIS (Cavalcante and Roorda, 2013) has an agent-based approach similar to INTERLOG. Agent
interactions, such as contracts between shippers and carriers, are modelled explicitly. FREMIS builds
further on INTERLOG by incorporating product differentiation and firmography processes (e.g.
establishment and failure of firms).
Alho et al. (2017) developed SimMobility Freight, an agent-based framework for modelling freight
truck movements, for which they show an application in Singapore. Three planning horizons are
distinguished in the model: strategic, tactical and operational. At the strategic level, establishments
are synthesized and their vehicle fleet size, annual demand for goods, and typical shipment size are
determined. An x-means clustering algorithm then determines the set of suppliers for each receiving
establishment. The tactical model simulates the formation of truck tours given the shipments
synthesized at the strategic level. Unique to this model is that shippers can transport some shipments
using their own fleet (=own-account) and outsource transport of other shipments to a carrier (=third
party logistics, 3PL). In addition, learning processes are found at the tactical level, e.g. previously
simulated travel times influence future route choices. Shipments are clustered based on geographical
proximity and then assigned to truck tours in an iterative process. Finally, at the tactical level the truck
tours are assigned to the network to obtain vehicle flows on links.

D1.1 Review of new forms of mobility, freight distribution and their business models; gaps identification in KPIs and SUMPs
47
Table 16. Freight ABM models overview
Model Name Key functionalities - components covered
Data requirements Authors / Lab/Company
SMILE Year-to-year development
Commodity production/consumption
Shipments
(Multimodal) supply chains
Survey on product characteristics and distribution structures
Make-use tables
Economic growth trends
Regional labor productivity
Tavasszy et al. (1998) Dutch Ministry of Transport, NEI, TNO
GoodTrip Commodity production/consumption
Shipments
Supply chains
Mode choice
Tour formation
Traffic assignment
Firm data (location, average consumer shopping expenditure, goods flows)
Infrastructure network
Boerkamps & van Binsbergen (1999) TRAIL (TU Delft)
Tokyo model for urban goods delivery
Commodity production and attraction
Shipments
Supply chains
Tour formation
Vehicle type choice
Carrier choice
Traffic assignment
Firm data (location, industry, size, goods flows, truck flows)
Wisetjindawat et al. (2006) Nagaoka University of Technology
Calgary regional travel model
Tour formation
Vehicle type choice
Departure time choice
Truck tour data (visited zones, vehicle type, departure time)
Hunt & Stefan (2007), University of Calgary
ADA Shipments
(Multimodal) supply chains
Empty trips
Shipment data (either disaggregate or aggregate)
Location of freight terminals and consolidation / distribution centres
Cost parameters, e.g. transport costs/km
de Jong & Ben Akiva (2007) Significance
INTERLOG Firm generation
Sourcing / contracts
Supply chains
Shipments
Tour formation
Firm data (location, industry, size)
Liedtke (2009) Universität Karlsruhe
FAME Firm generation
Shipments
Supply chains
Individual shipments
Mode choice
Traffic assignment
Firm data (location, sector, size)
Commodity OD matrix (value and weight), preferably by industry
Shipper survey (for mode choice and possibly supply chains)
Infrastructure network
Samimi et al. (2010) University of Illinois
FREMIS Firm generation
Sourcing / contracts
Supply chains
Shipments
Firm developments
Shipment data
Data regarding carrier selection
Cost parameters
Carrier level of service preferences
Cavalcante & Roorda (2013) University of Toronto
SimMobility Freight
Firm generation
Sourcing
Shipments
Vehicle fleet size
Tour formation
Traffic assignment
Make-use tables
Firm data (location, industry, size, vehicle fleet)
Shipment data
Truck tour data
Alho et al. (2017) MIT

D1.1 Review of new forms of mobility, freight distribution and their business models; gaps identification in KPIs and SUMPs
48
A4.4.2 Methodologies
Agent-based and disaggregate simulation models for freight apply a large variety of methods, most of
which are rooted in statistics or operations research. In this section, we will discuss the most
commonly applied methods.
Discrete choice models are often used to model choices with discrete options made in various stages
of the supply chain. These models allow the researcher to calculate probabilities for the different
discrete options based on observed attributes and unobserved heterogeneity. Examples of choice
situations where discrete choice models are applied include mode choice, supplier choice and
transport chain/route choice. Discrete choice models can also be used to model more complex
decisions that do not have a clear finite set of options. An example of this is the tour formation model
of Hunt and Stefan (2007), where a series of ‘next stop location’ choices lead to complex tour
patterns.
Many agent-based freight simulation models apply Monte Carlo sampling at some stage. This is
useful in situations where a discrete outcome is needed but only probabilities can be obtained. An
example of such a situation is an agent who determines which vehicle to use for a tour, when
modelled with a discrete choice model. Another example is shipment synthesis. Here, empirical
statistics may be used to determine the probability that a synthesized shipment will have a certain
size and goods type, given, for example, characteristics of the shipper and receiver.
Instead of statistical approaches, optimization methods and heuristics from the field of operations
research may be applied for modelling logistics behaviour too. Given that many actors in freight
transport apply such methods to make decisions, this is a reasonable option to consider when the
empirical data required to estimate statistical models is not available. De Jong and Ben-Akiva (2007),
for example, use the Economic Order Quantity formula to determine the optimal shipment size.
Wisetjindawat et al. (2006) formulate and solve a Vehicle Routing Problem to construct the optimal
set of truck tours to deliver shipments.
To calculate the production and attraction of commodity flows in a region or by a firm, usually
regressions models, input-output models, or a combination of both is applied. Regression models give
the predicted amount of produced/attracted goods based zonal or firm attributes such as land use and
firm size. Input-output models may be used to determine attractions; make-use tables provide the
required input to produce the previously determined amount of produced goods. Gravity modelling is
a common method to connect the productions and attractions, i.e. to construct the origin-destination
matrix of commodity flows. Here, the size of the commodity flow is larger for origin-destination pairs
with greater productions/attractions and a lower travel impedance.
A4.4.3 Data requirements
Depending on the exact dimensions, scope and methods chosen, agent-based freight simulation
requires a large amount and variety of data to model logistics behaviour in a valid way. The collection
of these data is one of the greatest challenges of freight models, as will be discussed in the next
section. In this section, the different types of data used in freight models is discussed.
Firm characteristics data are crucial for the synthesis of a realistic set of firms in a freight model. Not
only do we need to know the location of firms, but also relevant attributes to base logistics behaviour
on, such as industry sector and size (e.g. number of employees, floor space, annual revenue). To
estimate discrete choice models and validate model results, more detailed behavioural firm data is
needed. Examples of relevant behavioural data include data on shipped and received shipments,
chosen vehicle types and constructed truck tours. This data can be collected using surveys, either as
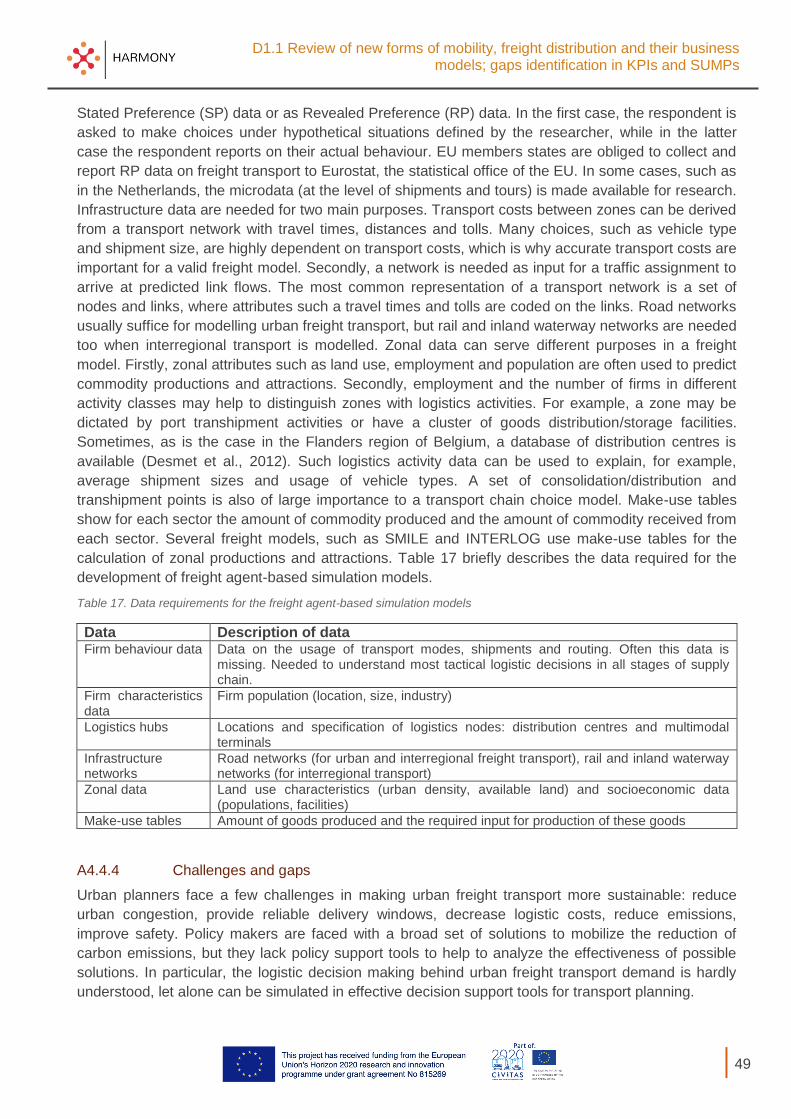
D1.1 Review of new forms of mobility, freight distribution and their business models; gaps identification in KPIs and SUMPs
49
Stated Preference (SP) data or as Revealed Preference (RP) data. In the first case, the respondent is
asked to make choices under hypothetical situations defined by the researcher, while in the latter
case the respondent reports on their actual behaviour. EU members states are obliged to collect and
report RP data on freight transport to Eurostat, the statistical office of the EU. In some cases, such as
in the Netherlands, the microdata (at the level of shipments and tours) is made available for research.
Infrastructure data are needed for two main purposes. Transport costs between zones can be derived
from a transport network with travel times, distances and tolls. Many choices, such as vehicle type
and shipment size, are highly dependent on transport costs, which is why accurate transport costs are
important for a valid freight model. Secondly, a network is needed as input for a traffic assignment to
arrive at predicted link flows. The most common representation of a transport network is a set of
nodes and links, where attributes such a travel times and tolls are coded on the links. Road networks
usually suffice for modelling urban freight transport, but rail and inland waterway networks are needed
too when interregional transport is modelled. Zonal data can serve different purposes in a freight
model. Firstly, zonal attributes such as land use, employment and population are often used to predict
commodity productions and attractions. Secondly, employment and the number of firms in different
activity classes may help to distinguish zones with logistics activities. For example, a zone may be
dictated by port transhipment activities or have a cluster of goods distribution/storage facilities.
Sometimes, as is the case in the Flanders region of Belgium, a database of distribution centres is
available (Desmet et al., 2012). Such logistics activity data can be used to explain, for example,
average shipment sizes and usage of vehicle types. A set of consolidation/distribution and
transhipment points is also of large importance to a transport chain choice model. Make-use tables
show for each sector the amount of commodity produced and the amount of commodity received from
each sector. Several freight models, such as SMILE and INTERLOG use make-use tables for the
calculation of zonal productions and attractions. Table 17 briefly describes the data required for the
development of freight agent-based simulation models.
Table 17. Data requirements for the freight agent-based simulation models
Data Description of data Firm behaviour data Data on the usage of transport modes, shipments and routing. Often this data is
missing. Needed to understand most tactical logistic decisions in all stages of supply chain.
Firm characteristics data
Firm population (location, size, industry)
Logistics hubs Locations and specification of logistics nodes: distribution centres and multimodal terminals
Infrastructure networks
Road networks (for urban and interregional freight transport), rail and inland waterway networks (for interregional transport)
Zonal data Land use characteristics (urban density, available land) and socioeconomic data (populations, facilities)
Make-use tables Amount of goods produced and the required input for production of these goods
A4.4.4 Challenges and gaps
Urban planners face a few challenges in making urban freight transport more sustainable: reduce
urban congestion, provide reliable delivery windows, decrease logistic costs, reduce emissions,
improve safety. Policy makers are faced with a broad set of solutions to mobilize the reduction of
carbon emissions, but they lack policy support tools to help to analyze the effectiveness of possible
solutions. In particular, the logistic decision making behind urban freight transport demand is hardly
understood, let alone can be simulated in effective decision support tools for transport planning.

D1.1 Review of new forms of mobility, freight distribution and their business models; gaps identification in KPIs and SUMPs
50
In HARMONY we aim to develop a freight activity simulation model for urban logistics. This simulation
model describes logistics decision making in the context of urban transport planning. Logistics
choices that will be simulated include vehicle type choice, formation of tours, use of urban distribution
centres, and departure time choice. Developing a freight simulation model is a very challenging task.
This complexity follows from several different characteristics of the freight transport system:
Logistics behaviour is often the result of decisions made by several actors with conflicting
interests (Anand et al., 2014).
Vehicle/vessel flows often do not match the directionality of the commodity flows from shipper
to receiver; multiple customers may be served in a truck tour or shipments may follow a
complex (intermodal) supply chain with intermediate storage or transhipment facilities
(Holguín‐Veras et al., 2014).
An actor can take on different roles, even for the same shipment (de Bok et al., 2018). For
example, a firm is both the sender and carrier (i.e. transporting party) of a shipment in the
case of own-account transport.
Many decisions in freight transport are inherently interwoven, such as vehicle type choice and
tour formation.
The freight transport system is highly heterogeneous; many different types of markets (e.g.
own-account, 3PL), shapes (e.g. parcels, containerized, bulk), commodities, firms, and
vehicles can be distinguished.
Other challenges in modelling freight transport are of a more practical nature:
Data on freight transport is often not (publicly) available due to the high expenses of data
collection and privacy concerns of firms (Alho et al., 2017).
Both the large scale and computational complexity of modelling freight transport can easily
lead to unpractical running times. The daily number of transported shipments in a region is
gigantic and decisions such as route choice and tour formation can usually not be solved to
optimality in a reasonable amount of time.
As a consequence of these challenges, many aspects of freight transport are not fully understood yet.
The scientific literature on descriptive modelling of logistics decisions such as tour formation,
outsourcing of transport and use of distribution centres is quite scarce when compared to modelling
passenger transport decisions. The number of freight models applied in practice that describe such
logistics choices is even more limited. Subsequently, the effects of many logistics developments and
policies have never been quantified either. Using emergent data collection and employing an agent-
based simulation approach will allow to gain more insight into these relatively poorly understood
logistics decisions, developments and policies.
A4.5 Multimodal network models / Operational models A4.5.1 Overview of Multimodal Dynamic Traffic Assignment models
A Dynamic Traffic Assignment (DTA) estimates the evolution and propagation of traffic congestion
through detailed models that capture travel demand, network supply and their complex interactions.
Unlike a static traffic assignment model, a DTA modelling approach can describe time-dependent
dynamics of traffic and replicate the interactions between travellers’ choices (route and departure
time) and the traffic network state. From a traveller behaviour standpoint, DTA is a technique that
allows for modelling of both long-term traveller adaptation to experienced congestion and modelling of
traveller behaviour in response to unexpected congestion that occurs within a single day. DTA
D1.1 Review of new forms of mobility, freight distribution and their business models; gaps identification in KPIs and SUMPs
51
modelling approach consists of the two main models: Route choice model and Network Loading
model.
4.5.1.1 Route choice modelling
The main underlying hypothesis of the route choice models is that travellers travel from origin to
destination of their trip in the network along the available multimodal routes connecting them, which
involves modelling how travellers chose their routes, modes and departure times through the network.
The modelling hypothesis that supports the main traffic simulation models based on DTA modelling
approach is based on the concept of user equilibrium, which assumes that travellers try to minimize
their individual travel times, that is, travellers chose the routes that they perceive as the shortest
under the prevailing traffic conditions: first Wardrop’s principle (Wardrop, 1952). The travellers route
choice decisions within DTA are built on the premise that a dynamic user equilibrium (DUE) exists in
the network. The definition of DUE is an extension of the 1st Wardrop’s principle along the temporal
dimension formulated by (Ran and Boyce 1996). Equilibrium in DTA is typically based on the premise
that the experienced travel time for all used routes is the same for travellers departing at the same
time. Route choice algorithms can be further grouped into two classes: preventive, which implicitly
assumes that traffic conditions in the network are predictable and travellers are aware of these
conditions (e.g., by previous experience), and reactive, which assumes that traffic conditions in the
network are not predictable (e.g., due to incidents, variability of demand, stochasticity of the traffic
system).
A variety of solution algorithms have been proposed for solving a DTA problem to provide DUE
solutions with preventive route choice decision making: from projection algorithms, or methods of
alternating directions to various versions of the method of successive averages (MSA) and gradient-
based methods. Other DTA models that consider modelling of reactive route choice decision making
are those that model the process from the point of view of probabilistic theory and discrete choice
modelling, and they are referred as stochastic user equilibrium (SUE) models. Discrete choice models
consider that the set of available routes for each traveller is a finite choice set of alternatives, each
one with a perceived utility by the traveller (Ben-Akiva and Lerman 1985). Examples of this could be
perceived travel time or travel costs. In general, the utility for each alternative path can be considered
a random variable consisting of deterministic component, the measured utility and an additive random
error (i.e., perception error due to the lack of perfect information).
The most used probabilistic models are Logit, modified Logit models (C-Logit and Path-Size Logit),
and Probit models (Cross-Nested Logit, Probit, Logit Kernel), and they depend on behavioural
parameters that have to be calibrated. Multi-Probit models can account for partially overlapping routes
and routes with significantly different lengths, while simple logit models can not properly handle
overlap, and assume that all route costs are subject to the same level of stochasticity. However, logit
models have closed form solutions for choice probabilities, while Probit equilibria can only be
determined using sampling techniques or numerical integration and are therefore highly
computationally intensive. In conclusion, it would be very useful to know how important the
differences between these models are likely to be in real-world situations. Majority of the traffic
simulation tools today in the market has adopted both DUE and SUE concepts, and transport
modellers can select the one that fits the best project needs.
4.5.1.2 Network loading modelling
Typically, a network loading in traffic simulation models are classified into four categories based on
their level of detail and aggregation, including macroscopic, mesoscopic, microscopic and hybrid. In
the context of macroscopic models, traffic is described as a continuum flow based on flow-density

D1.1 Review of new forms of mobility, freight distribution and their business models; gaps identification in KPIs and SUMPs
52
functions and explicit modelling of detailed components, such as lanes and vehicles, is not
incorporated. Microscopic traffic simulation models, on the contrary, attempt to mimic the real traffic
dynamics in a very detailed manner. Individual vehicles are modelled and represented in the
simulation with their interactions with other vehicles and geometry. Models concerning driver’s
behaviour, such as car following, lane changing and gap acceptance behaviours, play a critical role in
the performance of simulation results. Mesoscopic models are another available option to many
researchers and practitioners lying between microscopic and macroscopic models. Although
individual vehicles are represented in mesoscopic simulations, detailed modelling of their second-by-
second movement is avoided. Due to computational constraints, the level of details is always
inversely proportional to the network size and complexity.
Recently, hybrid models have been developed to enable the simultaneous performing of microscopic
and mesoscopic simulation in a way that modelling of the large areas can be realized by zooming out
without a less finer level of detailed presentation. Combining an event-based mesoscopic model with
a more detailed time-sliced microscopic simulation offers a best-of-both-worlds scenario, blending
superior computational efficiency with precise representation of traffic dynamics. In conclusion,
different simulation models need to be selected in accordance to the faced problems.
Figure 12, shows a taxonomy of today’s traffic simulation models based on DTA concept, including
both commercial and open source, depending on the network loading models they use.
Figure 12. A taxonomy of traffic simulation models with corresponding network loading models adopted
All these traditional traffic simulation tools based on DTA modeling approach (route choice analysis
and network loading in traffic networks) are not directly applicable in the multimodal context. Most
traffic simulation software currently consider a different vehicle types, referred as multi-class models.
In this context a vehicle class indicates a type of vehicle, such as a car, truck, HGV, bus, tram, train,
bicycle, other two- wheeler types, etc. In addition, some traffic simulation software, such as Aimsun
Next and VISSIM, offer modeling of slow mode traffic, such as pedestrians. However, these
D1.1 Review of new forms of mobility, freight distribution and their business models; gaps identification in KPIs and SUMPs
53
properties do not meet all the requirements if the multimodal DTA. To represent a multimodal trip as a
path, it is necessary to combine the networks of available modes via transfer, waiting and/or access
links into a so-called supernetwork (Sheffi, 1985). An additional difficulty is the limited availability of
public transport services. The additional service layer needs to be implemented, which implies limited
temporal and spatial availability of the public transport network and results with a more complex
definition of path alternatives and consequently the sequence of travel decisions.
Mobility is more than just car movements and therefore an increasing trend shows a movement
towards so-called multimodal DTA models which consider a trip or path as a chain of the multiple
modes of transport (e.g., trip is represented as a ride a bicycle, take a public transport, then walk). It
makes sense that if the population have the ability to consider a combination of different forms of
transport for a trip, that these should be simultaneously considered. Difficulties in multimodal
modelling often stem from a necessity to use different propagation models, a lack of information on
the Value of Time (VOT) and behavioural changes, the ability to switch between modes, and the
interaction between the modes in the model. However increased urbanisation and mobility in cities
demands that all modes be considered as feasible intermodal possibility of travel, especially in urban
areas. Examples of the current multiclass models presented in Figure 12 are expected to be further
developed and other new multimodal models are expected to be developed and applied to a greater
extent in the future.
4.5.1.3 Service Controllers for passengers operations optimization
New mobility services are mainly enabled via novel and intelligent online management platforms
(back-end and front-end) which, depending on the service type, are responsible for fleet and demand
management operations and/or data integration, journey planning, payment, booking, ticketing. To
take advantage of a platform’s full potential, efficient design and operational planning is needed to
offer reliable, cost- and energy-efficient service to consumers. Due to growing customer needs,
competition with new service providers, the complexity and uncertainty of modern transport networks
and the need to evaluate the true potential of new services on sustainable regional and urban
transport, testing and evaluating service designs and operational strategies in artificial simulation
environments is needed.
An increasing number of research studies have and are still being focused on the field of transport
operations research for new mobility services and concepts using either simulation or analytical
methods. In in this review, we focus on the latest studies that focus on integrating and testing new
mobility services and concepts in transport simulation frameworks. The combination of optimization
and simulation models allows for identifying the trade-off between important performance indicators
for passengers’ experience, service efficiency and network performance, including, among others,
vehicle miles travelled, average vehicle utilization, passenger waiting times and travel times and
fleet/capacity requirements for desired levels of services. The norm for service operations testing and
evaluation in simulation environments includes the development of three basic components: i) a
demand generation component, ii) a supply model, representing the network and the fleet movement
and iii) a service controller, a module responsible for interfacing with the above and making strategic,
tactical and operational/dynamic operating choices.
In the following table we provide an overview of the latest research attempts to simulate and evaluate
the efficiency and impact of new mobility service operations in service and network performance.
Studies under consideration capture the following systems; i) ride-sharing/ride-hailing, ii) car-sharing
and bike-sharing systems, iii) autonomous mobility on-demand systems and iv) integrated multimodal
systems. The focus of the review (Table 24) is to present the operational problem/case study under

D1.1 Review of new forms of mobility, freight distribution and their business models; gaps identification in KPIs and SUMPs
54
evaluation. A more detailed review on the methodological approach for solving it using a combination
of simulation and optimization approaches is presented in Annex 3.
Table 18. Research attempts to evaluate the impact of new mobility service operations in service and network performance
Authors Characteristics Operational problem/study focus
Linares et al. (2016) Shared taxis/vans Centralised time-dependent fleet dispatching and routing
Mora et al. (2016) Shared taxis and vans Centralised real-time multiple passenger assignment and vehicle routing
Martinez et al. (2015) Shared taxis Centralised real-time vehicle dispatching
Boyaci et al. (2017) One-way electric vehicle station-based carsharing with reservations
Vehicle and Personnel relocation; maximisation of served requests; minimization of relocation cost
Alfian et al. (2017) Reservation-based one-way station-based carsharing
Vehicle Relocation
Ghosh et al. (2017) Station-based bike-sharing Dynamic repositioning and routing problem to reduce lost demand
Dubernet and Axhausen (2014)
Station-based bike-sharing Bike redistribution evaluation
Horl et al. (2018) Autonomous taxi service Vehicle dispatching and rebalancing algorithms
Hyland and Mahmassani (2018)
Shared-use on-demand autonomous taxi service
Vehicle Assignment and Routing redistribution
Fagnant and Kockelman 2018
Shared on-demand autonomous taxis with ridesharing options
Ridesharing, fleet size and operators’ profitability
Azevedo et al. (2016) Station-based autonomous taxi service Station locations, vehicle assignment policies and relocation policies of the service
Shen et al. (2018) Integrated public transport services with AVs on demand ridesharing services. Replacements of low demand bus routes with the ridesharing AV service for first and last mile
Fleet sizing, ridesharing, vehicle dispatching and relocation
Basu et al. (2018) Integrated public transport services with autonomous vehicles on demand single and ridesharing services (AMoD) AMoD service used as both door-to-door and first-/last-mile to train
Integrated demand and supply simulation of AMOD services restricted to ABD area
Atasoy et al. (2015) Flexible Mobility on-Demand (FMoD); Integration of taxi, shared taxi and fixed route demand-responsive transit services
Vehicle scheduling and routing, assortment optimization and mode choices; pricing
4.5.1.4 Service Controllers for freight operations optimization
Urban freight is facing several economic and environmental challenges due to the growing demand of
e-commerce in modern cities. In fact, e-commerce, specially business-to-consumer (B2C), has been
identified as a major challenge in urban logistics literature, due to the increased demand of home
delivery services. In recent years, several solutions have been introduced for improving the
environmental sustainability of ‘last mile’ delivery, these include electric powered vehicles (e.g. cargo
bikes), crowd-shipment, and self-pick-up services.
A considerable amount of literature has been focused on conducting simulation-based studies to
evaluate different environmental, economic, and operational aspects of these emerging concepts. For

D1.1 Review of new forms of mobility, freight distribution and their business models; gaps identification in KPIs and SUMPs
55
instance, Melo and Baptista (2017) developed different scenarios in AIMSUN, in order to assess and
evaluate the replacement of conventional vans with electric cargo bikes. Their results showed
improvements in term of mobility, costs and environment, depending on an adequate implementation
strategy. Simoni et al. (2019) adopted a simulation-based approach to determine the environmental
effects of crowd-shipping in Italy. They employed a hybrid dynamic traffic simulation that used
macroscopic features (triggering of congestion, traffic signal interaction), in combination with
microscopic component of delivery operations (tracking of delivery vehicles, parking behaviour).
Arnold et al. (2018) developed different scenarios for urban distribution using cargo bikes and self-
pick-up services. They concluded that the operational costs can be reduced by encouraging
customers to use self-pick up services, while external costs decrease with the implementation of
cargo bike distribution systems. An overview of the different studies found in the literature, along with
their key functionalities can be found in Table 19. The data requirements needed for these models to
operate are related to internal and external costs, type of vehicle, travel time, terminal locations and
city constraints (Arnold et al., 2018; Perboli et al., 2018). Table 20Error! Reference source not
found. summarises the key data requirements needed for estimation and application of service
controller for freight operations.
Table 19. Overview of transport freight models
Authors Characteristics Key functionalities - components covered
Melo and Baptista (2017)
Cargo bikes Develop different scenarios within AIMSUN to evaluate environmental, economic and operational performance
Perboli et al. (2018) Cargo bikes Self-pick-up
Simulation-optimisation based framework , based on the Monte Carlo method. Different scenarios, integrating different modes for last mile delivery
Simoni et al. (2019) Crowdshipping
Hybrid dynamic traffic simulation, combining macroscopic features of traffic (triggering of congestion, queue spillbacks and interactions with traffic signals) with the microscopic features of delivery operations (vehicle tracking)
Fikar, Hirsch and Gronalt (2018)
Cargo bikes Agent-based simulation model, which uses dynamic optimisation procedures to generate and select vehicle routes and trans-shipment points.
Chen and Chankov, (2017)
Crowdshipping Agent-based simulation model that analyses the performance of the system based on individual behaviour
Sárdi and Bóna (2018) Cargo bikes Electric vans
Macroscopic simulation model for logistic and operation of a multistage electric vehicles delivery system
Arnold et al. (2018) Cargo bikes Self-pick-up Failed deliveries
Simulation study that analysed external and internal costs of operating cargo bikes, self-pick-up services and the impact of failed deliveries.
Table 20. Data requirements needed for estimation and application of freight transport models.
Data Description of data City network map Customer locations, location of the depots, available road network.
Behavioural and sociodemographic data
Customer Demand, O-D matrix, purchasing behaviour
Choice information Transport chains and transfer locations at the individual shipment level
Time and distance Time and distance between origins and destinations by mode
Operational and external costs
Labour costs, time per delivery, emissions, vehicle operational costs, capacity limit
Terminal locations Terminal locations for trans-shipment

D1.1 Review of new forms of mobility, freight distribution and their business models; gaps identification in KPIs and SUMPs
56
Vehicle Type, capacity, speed, emissions, fuel consumption, travel time, time per stop
4.5.1.5 Energy and emissions
Most models simulating road vehicle energy use and emissions can be characterized as aggregate
(quasi-static) engineering models, which quantify the performance of key vehicle components at
sufficient detail to be reasonably accurate. These models back-calculate the fuel consumed by the
propulsion system. The calculation starts with a driving cycle, specified as an array of vehicle velocity
versus time at intervals of typically one second. From this input, the vehicle acceleration is calculated,
which, in turn, is used to calculate the instantaneous power needed to operate the vehicle, by adding
aerodynamic drag, tire rolling resistance, and inertial force (vehicle mass times acceleration). The
required total power is converted to the torque needed to drive the tires, which through a transmission
is converted to the torque needed at the engine output shaft. In addition to the power required as
engine output, all the engine losses (due to engine cycle inefficiencies, engine friction, changes in
rotational kinetic energy, and auxiliary component power requirements) are summed together to
obtain the total rate at which fuel chemical energy is consumed. Using the lower heating value (the
stored useable chemical energy of a fuel), this "fuel power” is converted to the amount of fuel needed,
thus generating the desired result—energy consumption per unit distance travelled (see Weiss et al.,
2000). The calculation is fundamentally similar for alternative drivetrains, such as hybrid-electric and
battery-electric vehicles.
Many models follow this approach, including the Matlab Simulink simulation programs developed at
ETH Zurich by Guzzella and Amstutz (1998) and the ADVISOR (ADvanced VehIcle SimulatOR)
model, created by the U.S. Department of Energy's National Renewable Energy Laboratory's (NREL)
Center for Transportation Technologies and Systems (https://sourceforge.net/projects/adv-vehicle-
sim/files/ADVISOR/). The ADVISOR model has recently been succeeded by Argonne’s most recent
FASTSim model (Brooker et al., 2015; https://www.nrel.gov/transportation/fastsim.html), which is
fundamentally similar. As with other models, FASTSim allows using any driving cycle, e.g., as
generated by traffic simulation models. Any of these models is appropriate for simulating road vehicle
energy use and emissions for the HARMONY project.
4.5.1.6 Noise models
Environmental models play an important role towards the understanding of environmental systems
and in dealing with various pressures (Hamilton et. al, 2019). The accuracy of an environmental
model, especially in the case of noise modeling, depends on the data available and on its flexibility for
the identification and classification of new data to be incorporated (Gao et. al, 2019). Traffic noise
models were developed with different conditions in mind, such as specific noise indices, and different
types of roads, vehicles, terrain, buildings. Noise indices are developed in order to provide an
assessment of noise in certain circumstances. Noise (Lden, Leq) and acoustic indices refer to a
statistic that summarizes an aspect of the distribution of acoustic energy and other information from a
noise measurement or a sound recording (Li et. al, 2002; Suthanaya, 2015).
Noise pollution sources in urban areas can be classified into two groups, the stationary sources and
the mobile sources. Stationary sources include industrial, construction, commercial, domestic, and
recreational facilities. Mobile sources include mainly ground and air transportation (Quiñones-Bolaños
et. al, 2016). Therefore, an improved traffic noise model is needed to consider not only automobiles
and heavy vehicles but also motorcycles. Furthermore, as technology evolves and new forms of
mobile noise sources (e.g. drones) should be incorporated in the noise modeling procedures.
There are several successful noise models that are being widely used for several occasions. The
TRAffic Noise EXposure model (TRANEX) is a model that is used to assess and predict traffic related

D1.1 Review of new forms of mobility, freight distribution and their business models; gaps identification in KPIs and SUMPs
57
noise sources (Gulliver et. al, 2015). Another noise traffic related model is the “Calculation of Road
Traffic Noise” (CORTN) (Givargis & Mahmoodi, 2008) which takes into consideration the traffic flow
adjustment, the gradient adjustment, the pavement type adjustment, the distance adjustment, the
shielding adjustment, the angle of view adjustment and the reflection adjustment.
Furthermore, the Nordic prediction model of road traffic noise (Chang et. al, 2012) also known as
NORD2000 applies a new approach of boundary element methods to predict refraction effects on
noise levels in the presence of ground and barriers. It is obvious that each model developed uses
assumptions correlated with the conditions and the needs of the case under consideration. The
Nordic prediction method was developed using five assumptions: the road surface is dry without snow
or ice; the weather is a moderate, downwind condition with a wind speed < 2 m/s, there is no
reflection from façades when the noise source is in front of a building, the distance is less than 300 m
from the road and the tire–road interaction due to the temperature is ignored. Under these standard
conditions, this method can calculate the A-weighted equivalent sound level (Leq) in decibels (dB)
over a period of time.
Noise maps are created in order to visualize the propagation of one or several noise sources in an
urban or rural area, which in most cases is road traffic noise. The specific type of anthropophony has
always been a major source of annoyance in urban environments (Ow & Ghosh, 2017), while
numerous efforts for its reduction has been tested with various results. An effort of noise modeling
resulting into noise maps is the CNOSSOS-EU noise model. The main objective of the CNOSSOS-
EU process is the development of a comprehensible methodological framework in order to assess
environmental noise and its impact on human health, enabling consistent and accurate reporting of
strategic noise maps (Kephalopoulos et. al, 2014).
Finally, CadnaA and SoundPLan could be used in order to model, predict and visualize noise events
from various sources. Structural morphology data must be collected and imported to CadnaA software
(‘DataKustik’, 2018), along with noise measurement data in order to produce noise maps.
The amount of noise radiated in an urban environment depends on the sound power level of the
source, on the nature of the building structure with possible gaps and on the number of sources.
Simultaneously, the noise received depends on the degree of attenuation provided by the distance
from source, the attenuation provided by the ground type, the screening by walls and other buildings,
the wind direction and meteorological conditions, such as temperature fluctuations and finally from the
atmospheric absorption. Table 21 presents an overview of the above noise models, while Table 22
describes the data needed to apply such noise models.
Table 21. Overview of noise models
Model Name Key functionalities - components covered
Data requirements Authors / Lab/Company
TRANEX Traffic related noise sources Measurements taken in A-Weighted dB
Gulliver et al. (2015)
CORTN Traffic related noise sources Measurements taken in A-Weighted dB
Givargis and Mahmoodi (2008)
NORD2000 Traffic related noise sources Measurements taken in A-Weighted dB
Chang et al. (2012)
CNOSSOS-EU
Assesses environmental noise and its impact on human health
Measurements taken in A-Weighted dB
Kephalopoulos et al. (2014 )
CadnaA Strategic Noise maps Measurements taken in A-Weighted dB
DataKustik’ (2018)
SoundPLan Strategic Noise maps Measurements taken in A-Weighted dB
SoundPLAN GmbH

D1.1 Review of new forms of mobility, freight distribution and their business models; gaps identification in KPIs and SUMPs
58
Table 22. Data requirements needed for application of noise models
Data Description of data Noise Levels Projection of noise levels regarding traffic related and other noise sources
Noise Maps Maps that visualize noise propagation from one or several sources
Strategic Noise Maps Noise maps that highlight the effect of noise on inhabitants
Infrastructure networks
Road networks (for urban and interregional freight transport), rail and inland waterway networks (for interregional transport)
Population data Population density
Vehicle volume Number of vehicles in a specific area
Building information Building height and exact location
Vegetation Vegetation height and exact location
Road type Road type classification (Motorway, Ordinary Road, Local)
Road condition Condition of road surface (smooth/rough)
Speed limitation Speed limitation (most commonly used 50 km/h)
Traffic lights location Traffic lights location and operation (information gathered from local authorities and field observation)
Cartographic representation
Detailed cartographic representation of the area under consideration (buildings, roads, vegetation)
A4.5.2 Data requirements to build the network model for traffic simulation
Building a network model for application in microscopic simulation models typically requires more data
than other types of modelling approaches, such as macroscopic simulation models. For example,
microscopic models typically require the most data due to their need to model individual vehicle
behaviour in details. Mesoscopic models may require slightly fewer data depending on the
simplifications made in their driver behaviour models. Macroscopic models typically require the least
amount of data, as traffic behaviour is usually only characterized by flow rates, average observed
speeds, and observed link densities.
The required data to build the graph and network model for each use case in HARMONY project, can
typically be grouped into the categories shown in Table 23. Two major factors often drive data
requirements: developing an accurate graph representation of the existing transport network elements
and ensuring that simulated and/or predicted flows replicate observed behaviour. The modelling of
network geometry in the graph form can be seen as a relatively straightforward process since this
process generally focuses on the fixed and well defined elements, that can be imported from Open
Street Maps and other GIS-based files, or from the existing network models available in traffic
simulation software.
Table 23. Overview of data required for building use case's network models in HARMONY
Data Category
Data Sub-Category
Data items
Network geometry
Road geometry elements
Road/section shape, length, curvature and slope
Road category
Number of lanes
Purpose of lane (general traffic, HOV vehicles, managed lane, etc.)
Allowed turnings directions at the node
Lane utilization: turnings from lane to lane (through lane, left-turn lane, etc.)
Pedestrian crossings
Placement of traffic signs along roadway links
Node/intersection layout
Basic Functional Section maximum speed

D1.1 Review of new forms of mobility, freight distribution and their business models; gaps identification in KPIs and SUMPs
59
Data Category
Data Sub-Category
Data items
parameters Section Capacity
Section user defined costs
Turn maximum speed
Traffic Monitoring
Location and type of traffic sensors
Traffic control
Intersection control
Type of intersection control (stop sign, yield sign, traffic signals)
Type of traffic signal control (fixed time, actuated, traffic responsive)
Signal timing plan (start time, cycle length, yellow, phases, green)
Arterial signal coordination plan (offset relative to other control plans)
Data interchange interface for actuated and adaptive control plans
Ramp metering
Type of ramp meter
Metering plan
Location of traffic sensors
Demand
Vehicle fleet characteristics
Vehicle mix
Truck percentages and/or volumes
Vehicle occupancy
Traffic zones Zone boundaries
Centroids and connectors
Travel patterns
OD flow matrices
Network entry flows, if OD matrices are not used
Mode shares (only if for models including transit or non-vehicle modes)
Freeway traffic patterns
Freeway mainline counts
Freeway ramp volumes
Arterial traffic patterns
Link counts along major arterial segments
Intersection turning counts
Transit operations
Public transport data
Transit routes (ideally GPS based, GTFS file)
Stop locations
PT Service schedules and headways (including stop-time mean and deviation)
Fleet size and composition
Signal priority scheme
Network performance
Traffic state and behaviour
Volume, speed and occupancy data from mainline loop detector stations, on-ramps, off-ramps, tube counts
Travel times along major arterial segments
Bottlenecks
Time bottleneck stations
Location and extent
Cause of bottleneck
A4.5.3 Urban air network models
On the path to a full developed Urban Air Mobility (UAM) service environment, a fast implementation
of Unmanned Aircraft System (UAS) Traffic Management, or UTM/U-Space services will be possible,
if based on existing Air Traffic Management (ATM) and Air Traffic Control (ATC) processes and
solutions. This aligns to current concepts from various aviation organizations (such as FAA, NASA,
EASA and Eurocontrol)7. Making re-use of existing airspace plus flight plan management and
coordination functions, works for UA / drones as well as for today’s general aviation.
7 Text passage from EASA „Proposal for a Concept of Certified Category Operation of Drones and Certification of Drones Issue 1“: When the intrinsic risk of operation rises to a level such that the operation cannot be conducted with an acceptable level of safety without mitigations at the highest level of robustness, then the

D1.1 Review of new forms of mobility, freight distribution and their business models; gaps identification in KPIs and SUMPs
60
Good examples for successful re-use of existing ATM and ATC concepts can be found in the
Operaton Zenith (https://www.operationzenith.com/altitude-angel/) at Manchester airport in the year
2018, where fluent operations of manned and unmanned flight operations are coordinated by using
existing technology. Furthermore, the polish UTM (https://www.pansa.pl/index.php?lang=_eng)
solution from PANSA (Polish Air Navigation Service Agency) has also been developed from existing
ATM/ATC systems and standards. The PANSA UTM serves drone flights at very low level still
coordinating with global aviation and local VFR traffic.
Figure 13. Flight routes (corridor network) over smart cities and at airports
In order to manage safe flights, the owner of the city airspace (i.e. the airspace above the cities) will
need to define where and when flying will be authorized for which type of vehicles. Risk assessment
will be needed and integrated into the approval process. For this complex task the city councils will
have to build up expertise of aerial services or receive support from aviation consultants.
The modelling of elements within aviation is complex. Today, different types and standards for static
aeronautical and real-time data can be found. EUROCONTROL is promoting the SWIM (System Wide
Information Management) concept to manage overall aviation data. The SWIM concept comprises
data formats for non-real-time functions, for flight planning functions and for real-time or near real-time
functions in aviation.
4.5.3.1 Overview on existing aviation standards
Static aeronautical data is represented in DAFIF (Digital Aeronautical Flight Information File) or
Jeppesen (global aviation/navigation data) or EAD (European AIS (Aeronautical Information System)
Database). Last one is transferrable via AIXM (Aeronautical Information eXchange Model), which can
be seen as a global quasi-standard. Having setup an aeronautical infrastructure data set (for example
within the airspace above a smart city of the future) based on the (above) described data model
(AIXM proposed), the next step would be to plan flights and routing according to the needs of the end
user. This information correlates to the flight plan, which is in use today to coordinate some 30.000
flights across Europe every day. Any waypoint list defining the flight path of a future air taxi is forming
the flight intention or namely the flight plan. Today a flight plan can be automatically derived from the
drone API or navigation applications to feed the flight coordination centre of a city. (Re-)Using the
ICAO flight plan, with high precision position data, for air taxis would mean any Air Navigation Service
operation belongs to the „certified“ category. These operations and the aircraft involved therein would be regulated using traditional manned aviation approach (e.g. certification of the aircraft, approval of the operator, and license of the remote pilot). Examples of anticipated “certified” category operations are:
• Transport of people (e.g. air taxis); • International cargo operations in IFR; • Transport of cargo in urban environment above people.

D1.1 Review of new forms of mobility, freight distribution and their business models; gaps identification in KPIs and SUMPs
61
Provider (ANSP) in the world can read and understand the data. If smart cities build on this model,
that would support global exchangeability of the data plus inter-city operations.
4.5.3.2 From planning to execution
Other standards are in place for real-time data. The Flight Information eXchange Model (FIXM)
provides track data for air tracks from radar or ADS-B sorces / antennas. Building the future urban air
mobility on this standard would mean that tracking data from a vehicle can be received and read and
analysed anywhere in the world, where air traffic management is done based on global ATM
standards. Table 24 provides an overview on the above standards.
Table 24. Overview of data to be considered when considering future UAM services
Data Type Format (proposed)
Remark
Drone Aeronautical Data AIXM Data for Take-Off and Landing Sites, Emergency Landing Sites, Waypoints, Obstacles
Airspace Data AIXM Airspace information, No-fly Zones / Geo-fencing data, dynamic airspace use plan above cities
Flight Plan Data ICAO Flight Plan (FFICE)
Identification, flight route and mission information of each drone flight
Track Data of UA FIXM, Asterix Tracking data (real time) of all airborne UA
Monitoring Information Data from 03 vs. 04
Continuous automated validation of track vs. flight plan data
Communication, Navigation and Surveillance
TBD CNS details to be defined over a city in accordance with existing law and regulations
An interface between aviation models and city modelling is a gap. This seems logical as the cities of
today do not manage an aeronautical infrastructure, apart from no-flight zones over cities or helicopter
routes, which are introduced over big cities. In HARMONY, safety and security rules and technology
guidelines could be created to enable future air mobility in an urban environment.
4.5.3.3 Simulation models of urban air mobility
Literature regarding demand modelling and simulation of urban air mobility is still scarce. Using
MATSim, Rothfeld et al. (2018) discuss the modelling the integration of Vertical Take-off and Landing
(VTOL) or Personal Air Vehicles (PAV) into urban transportation systems. MATSim is maybe the only
software package that has attempted to simulate commercial flights in the agent-based simulation
approach (Grether, 2014; Grether et al., 2013). Specifically, for VTOL and PAV, vehicle and
infrastructure modelling are the most challenging areas for transport simulation models and packages.
As shown in Figure 14, using two nodes, a ground and aerial one, a UAM station is represented. The
ground access node is connected to the regular transport network, while the aerial node provides
access to the aerial network, specifically to some level of flight network (there may exist multiple
levels of flight networks).
Additionally, Uber (Uber, 2016) has developed a VTOL simulation model, called Infrastructure
Simulation, with the aim to simulate the effect of VTOL in the transport network. They have utilized
potential vertiport (vertical airports) locations in the greater Los Angeles and London areas and
compared results with actual long-distance Uber trips from September 2016 in these areas. Results
indicate significant differences between the estimated infrastructure deployment in the two cities. For
example, it was found that cities which demonstrate travel patterns across a significantly longer tail of
origin and destination locations, such as London, may face an increased infrastructure burden to
achieve trip coverage parity with other cities. Results also indicate that VTOL commute trips will

D1.1 Review of new forms of mobility, freight distribution and their business models; gaps identification in KPIs and SUMPs
62
provide greater time savings for lengthier trips. Although the report mentions that their model is solved
by means of a large-scale integer program using a third-party commercial optimization solver, no in-
detail information about the structure of the model is provided.
Figure 14. Physical and network model representation of a UAM system (Rothfeld et al., 2018)
A4.5.4 Challenges and gaps
There are several challenges for the modelling and integration of different multimodal transport and
operational models. These issues can be divided in two categories: modelling requirements and data
needed in the model.
Modelling requirements. These refer to the level of detail that needs to be considered when
modelling multimodal systems: the existing supply, costs associated models, travel patterns
and behaviour of travellers and inter-relation between existing modes (Carlier et al., 2015).
This issue is not only related to the high level of complexity of the model, but also
understanding the travel behaviour of users that are using more than one mode of transport. In
recent years, with new mobility services (e.g. carsharing, ridesharing, bikesharing) and
innovative freight services (crowdshipping, cargo bikes), it becomes more difficult to be able to
describe the amount of demand that switches over modes (Carlier et al., 2015) , passenger-
driver matching for ridesharing (Agatz et al., 2012), and supply-demand matching for freight
operations (Perboli et al., 2018).
Data requirements. Another important issue in modelling is the unavailability and difficulty of
combining existing data. The most associated issue with modelling any type of system is
related to the unavailability of data, and the time and cost efforts needed to obtain enough
data to build a realistic model. Big data in transport, such as GPS tracking data (shipments
and vehicles) and automatic traffic count, has helped considerably in the development of
transport modelling systems. However, big data in transport still lacks information regarding
the factors influencing mode and shipment choices (De Jong et al., 2016). Moreover, multiple
modes of transport leads to a complex network, where representation and integration of data
becomes a challenge (Mahrous, 2012). This is because data of the different elements of
multimodal and operational models are provided by different operators with different formats.
The challenge lies in combining these datasets to obtain new instances for urban applications
(Perboli et al., 2018).
D1.1 Review of new forms of mobility, freight distribution and their business models; gaps identification in KPIs and SUMPs
63
While there has been a considerable amount of literature on the development of models for new
mobility services, emerging freight operations and quantification of noise and energy emissions,
existing research still lacks the integration of all these factors into one operational model. Carlier et al.
(2015), Arnold et al. (2017) and Perboli et al. (2018) argue that existing research in operational
models for mobility and freight operations are affected from the aforementioned issues, in terms of
limited or estimated data, and few considered characteristics for creating realistic scenarios.
A4.6 Integrated spatial and transport planning models A4.6.1 Overview of platforms
Reliable assessment of new policies and investments for regional spatial and transport planning can
only be realized via large-scale integrated land-use and transportation simulation tools. Moeckel et al.
(2018) has already argued that integrated large-scale models for urban and regional planning improve
the reasonability of results as compared to stand-alone transport models and offer the opportunity to
analyse a variety of scenarios extracting more realistic Key Performance Indicators (KPIs). As already
described in the previous sections, several attempts have been made in the past decades to develop
and operationalize sophisticated i) land-use, ii) transport demand and iii) dynamic traffic assignment/
network loading models. Although research in these three fields has proceeded somewhat in parallel,
it is widely recognized that important interrelationships and interdependencies exist among these
modelling domains and that a means to account for linkages across the model systems in an
integrated framework is needed to accurately model urban environments (Waddell et al., 2008).
While earlier integration studies have focused on integrating land-use with traditional aggregate trip-
based 4-step demand models to calculate accessibility measures (Voigt et al., 2009; Troy et al., 2012,
Wenban-Smith and van Vuren, 2009), new research studies are being focused on integrating land-
use with more disaggregated activity-based travel demand models and dynamic traffic assignment
models. Consequently, a new wave of research has emerged focusing on the multiscale and
multidimensional integration of independent land-use, activity-based and dynamic traffic assignment
models to capture the impact of regional spatial and transport planning policies on land-use patterns,
activity-travel patterns and environmental sustainability. The key and the main challenge of multiscale
integration is to make independently developed models with different populations, spatial and
temporal resolutions speak to each other.
Waddell et al. (2010) presented the probably first true integration of microscopic land-use and activity-
based transport models for the metropolitan area of San Francisco, California. More specifically, the
authors presented a prototype of the integration between the microscopic land-use model UrbanSim
(Waddell, 2002) and the San Francisco’s activity-based travel model SF-CHAMP via the OPUS open-
source software platform (Waddell et al., 2005). While UrbanSim has been explicitly described in
Section 3.1, SF-CHAMP is based on the operational “full-day pattern” activity modelling approach as
proposed by Bowman et al. (1999) and applied earlier in Portland. The two models were loosely
coupled via the OPUS modelling interface and by aggregating data from the land-use model and feed
them to the travel model for disaggregate population activity and travel pattern generation. The
authors focused on the plausibility of the initial results and specifically on estimating and validating the
land use models. They concluded that the high-level of disaggregation of the land-use model has
actually yielded robust estimation results.
Pendyala et al. (2012) presented the design and prototype implementation of SimTravel; an
integrated model system that considers location choices in the land use domain, activity-travel
choices in the travel demand domain and individual vehicle movements on the network traffic domain.
The land-use component corresponds to an open-source microscopic land-use simulator, namely

D1.1 Review of new forms of mobility, freight distribution and their business models; gaps identification in KPIs and SUMPs
64
UrbanSim, which explicitly considers the location choices of households, people, businesses and real-
estate agents. The activity-based travel demand component is the OpenAMOS simulator, while
MALTA (Chiu and Villalobos, 2008) is the microscopic dynamic traffic assignment model. The authors
proposed a hybrid integration approach of those 3 simulators, combining a sequential integration
modelling approach between the land use and travel demand components, but a dynamic time-
dependent tight coupling approach between the travel demand and the network assignment
components. The authors presented the application of the integrated model for the southeast
Phoenix, USA metropolitan region, but were mainly focused on the travel demand and network
assignment.
Nicolai and Nagel (2013) presented MATSim4UrbanSim, an extended version of the OPUS platform
(Waddell et al., 2005), which is an integrated agent-based (microsimulation) land-use and transport
platform developed for the EC project “SustainCity”8, which has as its main objective the investigation
of sustainable policies in urban environments and the assessment of the trade-off between social,
economic and environmental objectives. As per the model’s name, the model incorporates UrbanSim
as the land-use simulator and MATSim (Multi-Agent Transport Simulation) (Horni et al., 2016) as the
transport demand and supply simulator. Due to the agent-based modelling philosophy of both
simulators, the authors exploited the models’ disaggregated nature and investigated a robust coupling
of the two at the agent level via a bi-directional information exchange. Due to the challenges that
resulted from the fact the UrbanSim and MATSim are developed in different languages (Python and
Java respectively), the authors followed a loose coupling approach by writing and reading files during
runtime execution. Finally, several accessibility measures were tested including both zone-to-zone
generalized costs (skim matrices) and agent-based accessibility indicators for home-work-home trips
with either car or public transport modes.
Ziemke et al. (2016) presented an approach for developing a microscopic integrated land-use
transport model by integrating a microscopic land-use model, namely SILO9 (Simple Integrated Land
Use Orchestrator) and the microscopic transport simulation model MATSim. From an implementation
point of view, after each simulated year in SILO, a sample of agents is created in MATSim based on
specific activity and vehicle availability constraints to simulate traffic conditions. Aggregate zone-to-
zone skim matrices are then fed back to SILO for accessibility computations. While the authors have
loosely coupled the two models, they have also pointed out required approaches for of a fully agent-
oriented integration of the models, where the land-use model queries the transport model to obtain
agent-specific information.
Finally, and to the best of our knowledge, the only fully integrated land-use and transport platform has
been proposed by Adnan et al. (2016). The authors presented SimMobility; a multi-level, fully
integrated, agent-based, activity-based land-use and transport simulation platform. SimMobility
loosely couples three simulation levels that can be used in isolation, namely Long-Term (land-use),
Mid-Term (activity-based demand and DTA model) and Short-Term (microscopic traffic simulator).
However, the authors point out that to take full advantage of the platform’s potential, it demands a
tight coupling integration. Towards testing the impact of an autonomous mobility on-demand case
study in Singapore’s central business district, the platform’s models were estimated for the base case
scenario showing reasonable computational times. However, integration results for the land-use and
transport models are not still available and the case study’s impact on land-use is still an on-going
research.
8 https://cordis.europa.eu/project/rcn/94314/reporting/en 9 http://silo.zone/
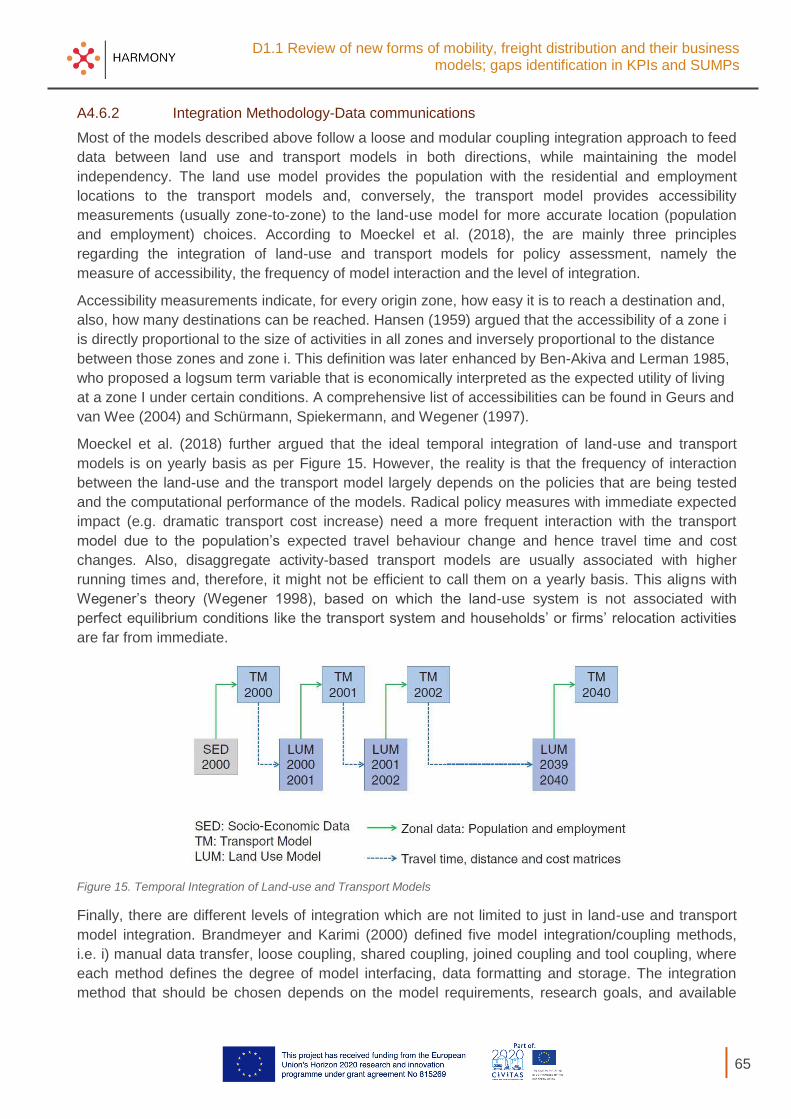
D1.1 Review of new forms of mobility, freight distribution and their business models; gaps identification in KPIs and SUMPs
65
A4.6.2 Integration Methodology-Data communications
Most of the models described above follow a loose and modular coupling integration approach to feed
data between land use and transport models in both directions, while maintaining the model
independency. The land use model provides the population with the residential and employment
locations to the transport models and, conversely, the transport model provides accessibility
measurements (usually zone-to-zone) to the land-use model for more accurate location (population
and employment) choices. According to Moeckel et al. (2018), the are mainly three principles
regarding the integration of land-use and transport models for policy assessment, namely the
measure of accessibility, the frequency of model interaction and the level of integration.
Accessibility measurements indicate, for every origin zone, how easy it is to reach a destination and,
also, how many destinations can be reached. Hansen (1959) argued that the accessibility of a zone i
is directly proportional to the size of activities in all zones and inversely proportional to the distance
between those zones and zone i. This definition was later enhanced by Ben-Akiva and Lerman 1985,
who proposed a logsum term variable that is economically interpreted as the expected utility of living
at a zone I under certain conditions. A comprehensive list of accessibilities can be found in Geurs and
van Wee (2004) and Schürmann, Spiekermann, and Wegener (1997).
Moeckel et al. (2018) further argued that the ideal temporal integration of land-use and transport
models is on yearly basis as per Figure 15. However, the reality is that the frequency of interaction
between the land-use and the transport model largely depends on the policies that are being tested
and the computational performance of the models. Radical policy measures with immediate expected
impact (e.g. dramatic transport cost increase) need a more frequent interaction with the transport
model due to the population’s expected travel behaviour change and hence travel time and cost
changes. Also, disaggregate activity-based transport models are usually associated with higher
running times and, therefore, it might not be efficient to call them on a yearly basis. This aligns with
Wegener’s theory (Wegener 1998), based on which the land-use system is not associated with
perfect equilibrium conditions like the transport system and households’ or firms’ relocation activities
are far from immediate.
Figure 15. Temporal Integration of Land-use and Transport Models
Finally, there are different levels of integration which are not limited to just in land-use and transport
model integration. Brandmeyer and Karimi (2000) defined five model integration/coupling methods,
i.e. i) manual data transfer, loose coupling, shared coupling, joined coupling and tool coupling, where
each method defines the degree of model interfacing, data formatting and storage. The integration
method that should be chosen depends on the model requirements, research goals, and available

D1.1 Review of new forms of mobility, freight distribution and their business models; gaps identification in KPIs and SUMPs
66
resources, the direction of information exchange and frequency of data flows. Shahumyan and
Moeckel (2017) further defined the model integration requirements as follows:
Ability for independent model development
Modular approach for component reusability and new component additions
Minimal or no source code changes
Capacity to link models developed in different programming languages
Ability to deal with licensing needs
Avoidance of manual data transfers
User-friendly user interface
GIS compatibility for data visualization and spatial analysis
Adequate runtime
Minimal costs and efficient implementation timing
A4.6.3 Challenges and gaps
Integrated land-use and transportation models are undoubtedly essential decision-making tools, and
they have been widely used to test and evaluate the impact of mainly large infrastructure investments
and house pricing policies on land-use patterns, network performance and travel demand. However,
existing integrated tools cannot fully and reliably give answers to questions like: Will MaaS or AVs
alleviate congested networks, reduce parking demand and increase road capacity? Will public
transport usage be affected by new and more flexible transport services? Will the increased
accessibility resulted from AVs or MaaS induce urban sprawl or spatial agglomerations? These are
just some of the questions that remain open, and evidence is needed towards informing policy and
leading to environmental, social and economic sustainability. While a substantial amount of research
has been done on the field of integrated land-use and activity-based transport demand tools, experts
on the field suggest that both the theoretical and technical foundations of those models need to be
updated and re-evaluated towards developing reliable and operational tools for policy making in the
new transportation era (Moeckel et al., 2018; Kii et al., 2016; Hawkins and Habib 2018, Acheampong
and Silva, 2016).
Considering that disaggregate and computationally intensive activity-based travel demand models
have only recently become operational and have been mainly developed and tested by US
metropolitan planning organizations (Rasouli and Timmermans 2014b), there is an increasing need to
bridge the gap between their proliferation and their integration with operational land-use models in
practice (Acheampong and Silva, 2016). In fact, the computational performance of such integrated
models has been identified as a major challenge and a discouraging factor for their potential utilization
by planners and policy makers (Moeckel et al., 2018). At the same time, the uncertainty associated
with these integrated models over time and across different model frameworks needs to further be
addressed by the research community and applications of innovative methodologies that can tackle
the challenge of disaggregate model output uncertainty and stochastic variation need to be
investigated.
Most of the models, so far, have been developed in a time where private, conventionally-fuelled
vehicles and public transportation modes are the most utilized urban means of transport. In the era of
the emergence of new mobility technologies, services and concepts, which are likely to create a
dramatic upheaval to the urban fabric, existing integrated land-use and transport models are not
wholly capable of realistically ascertaining the most likely impact of new technologies and services
like autonomous vehicles, drones and MaaS. Hawkins and Habib (2018) argue that the collection of
more reliable primary (behavioural) data through stated adaptation approaches and virtual

D1.1 Review of new forms of mobility, freight distribution and their business models; gaps identification in KPIs and SUMPs
67
experiments which present new technologies as a pathway rather than a fully formed choice
alternative can aid towards enhancing travel demand model forecasting capabilities. They further
suggest that the investigation of new model structures is needed to recognise the dynamic non-
equilibrium nature of urban systems and capture the impact of new technologies and services to the
system’s present state of equilibrium.
The promise of more flexible, efficient and personalized travel experience which is often associated
with new mobility services (on-demand taxis and shared services) and concepts (MaaS) deems the
need for accurate travel demand modelling more urgent than ever. Investing on disruptive mobility
services and regulating them as fit to each region’s needs will allows cities to extend their transport
demand management policies, which may severely impact accessibility and, consequently, location
choices and vehicle ownership. Robust methodologies for modelling and measuring accessibility, the
key concept that links land-use and transportation, are needed to adequately evaluate the effects of
future mobility on land-use and vice versa (Acheampong and Silva, 2016). At the same time, the
potential effects of increased energy prices on urban location and mobility choices of individuals and
their implications for modelling methodologies are also worth exploring.
From a purely technical standpoint, the integration of large-scale land-use and activity-based
transport models requires high quality and volume of data. Therefore, common ways to store and
share micro data should be defined. Finally, research on integration approaches between
independently developed and autonomous models is still ongoing, and more is needed to identify the
key requirements for efficient and computationally efficient integration that allows for testing spatial
and transport planning policy scenarios.
A4.7 Final considerations
In this section, we focused on delivering an extensive and comprehensive review of the state-of-the-
art in large-scale land use and transportation simulation models for both passenger and freight
mobility, which have mainly been used for policy, investment and operations evaluation. We
presented the state of the art in regional economic, demographic forecasting and land-use simulation
models, elaborating on their theoretical foundations, methodological frameworks, data requirements
and limitations. From a transport modelling perspective, we have summarized and described both
demand and supply modelling and simulation studies. First, we summarized the latest passenger and
freight transport demand simulation models with their theoretical background, focusing mainly on the
activity-based (agent-based) modelling paradigm, which has gained increasing popularity for
modelling disaggregate passenger and freight activities. Then, we further described and summarized
the traditional dynamic traffic assignment and network loading approaches for multiclass simulators,
where different vehicle types and their movements are considered, while at the same time we
presented the latest studies on modelling service operations for passenger and freight. Considering
that HARMONY’s ultimate objective is to deliver a fully operational integrated land-use and transport
simulation platform, we also presented a few attempts to integrate and operationalize independent
simulators with their corresponding requirements and challenges.
Notwithstanding the on-going progress and innovation, there are a number of areas needing further
research on i) land use, ii) behaviour modelling, iii) operations/network modelling and iv) their
integration into a single unified model suite that enables policy and scenario evaluation for new
services and technologies. Therefore, the modelling and development challenges that will be
addressed by HARMONY are as follows:

D1.1 Review of new forms of mobility, freight distribution and their business models; gaps identification in KPIs and SUMPs
68
Land-Use Modelling and Simulation: In HARMONY, we will tackle the problem of spatial
aggregation, meaning that we will develop methodologies (translators) which will enable us to
derive individuals from economic and sociodemographic aggregates. This will further allow us
to integrated land-use with activity-based models on the “agent” level. Furthermore, an issue
of great importance for input output and regional economic modelling is the detailed
employment data requirements and their availability. In HARMONY, we will attempt to acquire
that information from fusing diverse data sets from different sources.
Passenger and Freight Transport Demand Modelling and Simulation: Several challenges
are associated with behavior modelling for passenger mobility. First, the complexity of activity-
based models, their high data requirements and the lack of spatio-temporally disaggregate
individual travel data (e.g. trip diaries) render the data collection procedures and
corresponding data privacy issues a challenge. In HARMONY, we will apply state-of-the-art
smartphone-based data collection tools which in combination with demonstration of AVs and
drones will enable us to collect high quality data, accounting for limitations and guidelines
imposed by GDPR. Furthermore, a crucial issue to be addressed by HARMONY constitutes
the need to update and incorporate in existing activity-based modelling frameworks the latent
traits which will account for sociodemographic changes and technological advancements. At
the same time, HARMONY will develop a freight simulation model, which by itself is a major
challenge due to the complexity of the freight transport system as described in 3.4.4 and the
scarcity of operational models that capture freight activities. Data availability and
computational performance of the freight simulator are also potential problems that
HARMONY will attempt to resolve by utilizing advanced data collection and fusion techniques
as well as software development enhancements.
Network Modelling and New Mobility Service Operations: The need to extend existing
network models with new mobility services and new technologies, like AVs drones for both
passenger and freight mobility will be tackled in HARMONY. We will develop dedicated
software modules (controllers) which will interface with existing traffic flow simulators,
replicating and optimizing corresponding service operations and/or “controlling” fleet
movements. Furthermore, the addition of an extra network layer for urban air mobility will be
investigated with corresponding traffic control models for drones in freight transport. To the
best of our knowledge, there are currently no studies on the integration of urban air mobility in
simulation environments, except Rothfeld et al. (2018). Integration of energy, emission and
noise models into existing traffic simulation models will also be investigated for evaluation of
the ecologic footprint of new policies for service implementations with AVs and drones.
Integrated land-use, activity-based demand and traffic simulation: Finally, a crucial topic
in HARMONY is the integration of independent simulators, responsible for different functions
with different spatiotemporal resolutions. The development of a software tool that enables the
integration of different simulators into one model suite via platform-agnostic interfaces is
envisaged. Loose coupling and appropriate application programming interfaces will be
investigated for the integration of an open-source activity-based demand simulator with
existing commercial traffic flow simulators and a land-use simulator with the integrated
transport simulator. As already described, computational performance for operational large-
scale integrated models is an issue to be addressed, while at the same time research is
needed to model accessibility which constitutes the linkage between transport and land-use
models. Only a few research attempts have considered the integration of land-use and
activity-based models and HARMONY will attempt to extend the existing knowledge on the
subject.

D1.1 Review of new forms of mobility, freight distribution and their business models; gaps identification in KPIs and SUMPs
69
A5. Review of existing metropolitan areas models
A5.1 Introduction
Due to the well-known complexity of transportation systems in our cities, together with their
fundamental role in terms of environment, quality of life and economic growth, research in analysis
and prediction of traffic phenomena is gaining a growing importance. While we now have more data,
more computing power and higher recognition of the importance of understanding traffic in our cities,
the problem is still very complex as it quickly reaches high dimensionality with large networks, multiple
measurements, data sources, traffic control systems, and high and heterogeneous demand patterns.
An approach to deal with this complexity is by using traffic simulation models. In HARMONY,
simulation of transport systems and mobility plays an important role, because it can be used to study
models too complicated for analytical or numerical treatment, can be used for experimental studies,
can study detailed relations that might be lost in analytical or numerical treatment, and can produce
attractive visual demonstrations of present and future scenarios.
This chapter demonstrates the existing transport models in HARMONY pilot areas and identifies how
these models could be leveraged within the project. HARMONY has as partners six metropolitan
areas situated on six of the TEN-T corridors. The two trailblazing metropolitan areas are ROT (NL)
and OXS (UK), the two aspiring metropolitan areas are TUR (IT), and ATH (GR), and the two follower
areas are TRIK (GR), and GZM (GZM; POL). Since the Modelling suite of HARMONY platform will be
implemented for the trailblazing and aspiring areas, in this section a review of simulation models in
Trikala and GZM has been omitted.
A5.2 Rotterdam
In the context of transport simulation models in Rotterdam, there are three models that have been
developed specifically to assess passenger and freight tactical interventions in the Metropolitan
Region Rotterdam and its surrounding provinces, including Hague, Utrecht, South-Holland, North-
Holland (see Table 29Error! Reference source not found.). The base year models have been
calibrated for the period between 2014 and 2016. Two models include passenger (car, bus, metro,
bike, walk) and freight (trucks) modes, while one model is specifically designed for assignment and
modeling of freight transport, including three vehicle types: Truck, Truck with Trailer, Tractor with
Trailer. More details on the main features of the available models in Rotterdam area that will be used
in HARMONY project can be found in Table 29.
Table 25. HARMONY MS application and data availability for Rotterdam
Strategic simulator
Secondary data: Netherlands Census 2011, firm level land use and economic activity data Primary data: Survey-based firm location choice data Existing model to be linked in the HARMONY MS: TIGRIS XL (operated by SIGNIF) The HARMONY MS strategic simulator-freight modules will be applied for Rotterdam.
Tactical simulator - Freight
Secondary data: Statistics Netherlands: microdata on transport (carrier survey) Primary data: Stated preference data regarding fleet ownership and crowd-shipping Existing models: MASS-GT model of TU Delft The HARMONY MS freight demand simulator will be applied for Rotterdam.
Operational simulator
Secondary data: Traffic data of National Traffic Database (NDW) Primary data: Bluetooth data and camera observations for the Rotterdam region Existing models: microsimulation traffic network model for Rotterdam (Aimsun implementation (owned by TUD) will be extended and linked to the HARMONY MS.
Currently available modes and services in the city: bus, tram, train, metro, bicycles lanes and parking,
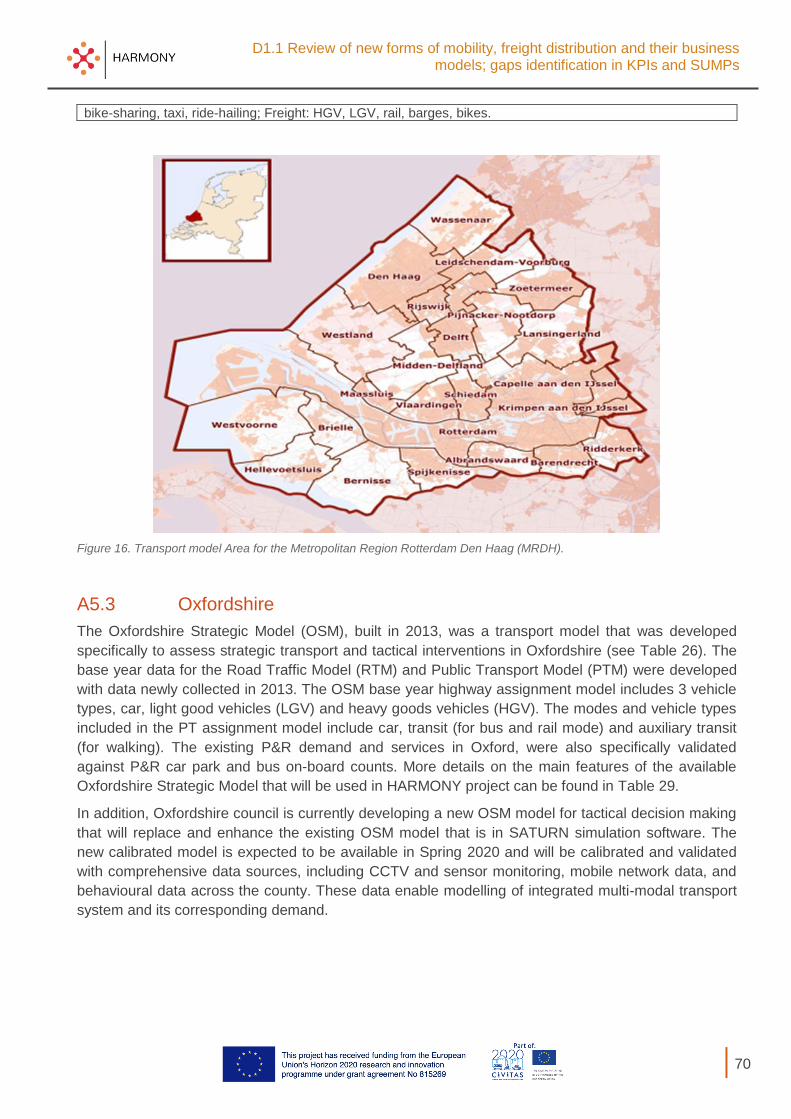
D1.1 Review of new forms of mobility, freight distribution and their business models; gaps identification in KPIs and SUMPs
70
bike-sharing, taxi, ride-hailing; Freight: HGV, LGV, rail, barges, bikes.
Figure 16. Transport model Area for the Metropolitan Region Rotterdam Den Haag (MRDH).
A5.3 Oxfordshire
The Oxfordshire Strategic Model (OSM), built in 2013, was a transport model that was developed
specifically to assess strategic transport and tactical interventions in Oxfordshire (see Table 26). The
base year data for the Road Traffic Model (RTM) and Public Transport Model (PTM) were developed
with data newly collected in 2013. The OSM base year highway assignment model includes 3 vehicle
types, car, light good vehicles (LGV) and heavy goods vehicles (HGV). The modes and vehicle types
included in the PT assignment model include car, transit (for bus and rail mode) and auxiliary transit
(for walking). The existing P&R demand and services in Oxford, were also specifically validated
against P&R car park and bus on-board counts. More details on the main features of the available
Oxfordshire Strategic Model that will be used in HARMONY project can be found in Table 29.
In addition, Oxfordshire council is currently developing a new OSM model for tactical decision making
that will replace and enhance the existing OSM model that is in SATURN simulation software. The
new calibrated model is expected to be available in Spring 2020 and will be calibrated and validated
with comprehensive data sources, including CCTV and sensor monitoring, mobile network data, and
behavioural data across the county. These data enable modelling of integrated multi-modal transport
system and its corresponding demand.

D1.1 Review of new forms of mobility, freight distribution and their business models; gaps identification in KPIs and SUMPs
71
Table 26. HARMONY MS application and data availability for Oxfordshire
Strategic simulator
Secondary data: Geo-demographic data from the Office of National Statistics (ONS), Vehicle registration data from the UK Department for Transport (DfT), Migration data from ONS; Employment data from ONS-NOMIS; Input/Output consumption data from ONS; Land cover data from Centre for Ecology and Hydrology (CEH); Properties price data from Land Registry (http://landregistry.data.gov.uk); Land use data from the UK Data Repository; Emission and Noise data from the UK Data Repository Primary data: SP data regarding car-ownership, fleet ownership, residential location choice. Existing models: TRANUS, SIMULACRA (will provide inputs to the MS) The Strategic simulator will be applied for OXS.
Tactical simulator – Passenger
Secondary data: UK National Travel Survey (NTS), Data from Journey Planner ZipAbout, Public transport ticketing data. Primary data: GPS travel patterns data; Revealed and Stated preference data for new and traditional transport modes and new mobility services. Existing models: OSM model; a multi-modal passenger and freight demand and assignment model The Tactical simulator will be applied for OXS.
Operational simulator
Secondary data: Traffic flow data from OCC UTMC & AADT; Public transport time tables (NTEM); AVL, Real time public transport occupancy data (OXS CC RTPI & UTMC); GTFS; Journey Time data (OCC UTMC). Existing models: microsimulation traffic network model (Aimsun); SATURN macroscopic traffic model, UTC/SCOOT a real time model to co-ordinate traffic flow through signalised junctions. The Aimsun microsimulation traffic network model will be extended and linked to the Operational simulator. The air-traffic controller will also be applied for OXS.
Currently available modes and services in the area: Passenger: bus, tram, taxi, P2P taxi, car-sharing, car-pooling, minibuses, coach, rail, parking; Freight: HGV, LGV, rail, motorcycles, bikes; EV charging infrastructure - will be integrated with electric AVs and drones.
Figure 17. Area of Detailed Modelling and Fully Modelled Area for Oxfordshire Strategic Model (OSM)

D1.1 Review of new forms of mobility, freight distribution and their business models; gaps identification in KPIs and SUMPs
72
A5.4 Athens
A 4-step Transportation Model of Athens metropolitan area, built in 2006, has been developed
specifically to assess transport tactical interventions in the Athens region (see Table 27). The
Transportation Model of Athens metropolitan area includes 4 vehicle types: Private Car, Public
Transport Vehicle, Trucks (only loaded externally, static matrix), and Taxi (only loaded externally,
static matrix). The modes included in the model cover passenger modes: Car, Rail, Bus, Trolley Bus,
Metro, Tram, Walk. More details on the main features of the available models in the Athens area that
will be used in HARMONY project can be found in Table 29.
Table 27. HARMONY MS application and data availability for Athens
Strategic simulator
Secondary data: Census 2011: demographic, land-use Existing models: none The Strategic simulator will be applied for Athens.
Tactical simulator – Passenger
Secondary data: Smart-card data (OASA); Raw data collected from March to May 2018 aiming to identify the various fare types and special rates utilized by passengers. Primary data: Smart-card data, 2018 public transport fares – passenger survey Existing models: 4-stage Transportation Model of OASA for the greater metropolitan area of Athens, which was developed in VISUM in 2009 The model will be updated and linked to the HARMONY MS.
Operational simulator
Secondary data: Traffic flows (Ministry of Transport); Geo-localisation data-positioning of buses and trolley buses (OASA); Telecom data (provided by the major mobile phone companies) Existing models to be linked to HARMONY MS: A hybrid model will be developed by Aimsun and linked to the HARMONY MS.
Currently available modes in the area: Passenger: Underground, buses and electric buses (trolleys), suburban rail, tram, taxi; Freight: HGV, LGV, rail, bikes.
Figure 18. Fully Modelled Area for Transportation Model of Athens metropolitan area

D1.1 Review of new forms of mobility, freight distribution and their business models; gaps identification in KPIs and SUMPs
73
A5.5 Turin
At the tactical and operational level, a transport network model of the Turin Metropolitan area, built in
2015 in VISUM PTV simulation software, covers a passenger road transport model at regional level.
The model is updated in real time with traffic counts/smartphone data, for monitoring traffic flows and
providing real-time information to road users10. The public transport service (including bus, tram,
metro and light rail) is simulated separately with a dedicated VISUM model. More details on the main
features of the available models in Turin area that will be used in HARMONY project can be found in
Table 29.
Table 28. HARMONY MS application and data availability for Turin
Strategic simulator
Secondary data: land use and economic activities from census data and statistical office Primary data: Stated preference data regarding car-ownership, residential location choice. Existing models: none The Strategic simulator will be applied for Turin.
Tactical simulator – Passenger
Secondary data: population and economic activities data from census and statistical office Primary data: Dataset from mobile telephone operator; GPS travel patterns data; Revealed and Stated preference data for new and traditional transport modes and new mobility services. Existing models: VISUM network model for dynamic traffic assignment The transport demand model component will be developed and, together with the existing VISUM model, will be linked to the HARMONY MS.
Currently available modes in the area: Passenger: bus, taxi, P2P taxi, car-sharing, car-pooling, minibuses, coach, rail, cycles; Freight: HGV, LGV, rail, bikes
Figure 19. Homogenous zones and municipalities in the metropolitan area of Turin
10 http://www.5t.torino.it/5t/it/traffico/traffico.jsp and https://www.muoversiatorino.it/it/traffico/

D1.1 Review of new forms of mobility, freight distribution and their business models; gaps identification in KPIs and SUMPs
74
A5.6 Final considerations
Transport simulation models built by HARMONY pilots are mainly designed for strategic decision
making, that is, to help decision makers to develop business cases for future major schemes, route
strategies and carry out scenario testing of the transport impacts of new development and mitigation
measures. Comparison of the main transport model features for each pilot is presented in Table 29.
After the detailed analysis of available data and transport simulation models, the following should be
noted:
All the models are designed for tactical and strategic decision making and are relatively up to
date except the model for Athens metropolitan area;
Data on road network characteristics, public transport network and services, as well as traffic
counts and traffic flows are available for the metropolitan areas;
All the models are multiclass, while multi-modality is adopted at static traffic assignment level;
Available data sources in the pilots, could be further exploited in HARMONY for updating the
models at the strategic decision making level;
There is a lack of more detailed data to build the operational models at the metropolitan level.
Detailed analysis of the operational models scope is required;
Further analysis of data in each pilot is required to ensure utilization and compatibility of the
models for integration and development of assignment models over multiple modes in a
dynamic context.

75
Table 29. Overview of transport simulation models in HARMONY project.
Transport simulation model features
Rotterdam Oxfordshire Athens Turin
Simulation Software Groeimodel 3.0 Omnitrans 8.0 Python SATURN VISUM 12.0 VISUM 15.0
Base year 2014 2016 2015 2013 2006 2015
Scope of the model area
Provinces South-Holland, North-Holland and Utrecht
Metropolitan area Rotterdam and The Hague
Province of South-Holland
Oxfordshire council area
Athens greater metropolitan area
Turin metropolitan area
Decision level tactical tactical strategic strategic and tactical
tactical tactical
Assignment static static/ quasi-
dynamic static static/ quasi-
dynamic static static/ quasi-
dynamic
Infrastructure geometry
macro meso/micro macro macro macro macro
Demand static static static static static static
Scope (lane-use, passenger, freight)
passenger, freight passenger, freight freight passenger, freight passenger passenger
Modes Car, Rail, Bus, Metro, Bike, Walk
Car, Public Transport, Bike, Walk
Truck, Truck wTrailer, Tractor wTrailer
Car, Public Transport (bus, rail), Walk
Car, Rail, Bus, Metro, Walk
Car, Bus, Metro
Vehicle type/class Car, Truck Car, Truck Car, Truck Car, LGV, HGV Car Car

D1.1 Review of new forms of mobility, freight distribution and their business models; gaps identification in KPIs and SUMPs
76
A6. Considerations on new services, models and data requirements
A6.1 Advancements needed in different dimensions
This section presents the gaps that are identified from the extensive literature review conducted in the
previous sections. These gaps are identified in terms of the following dimensions: infrastructure,
regulatory, legal, modelling and data needs.
A6.1.1 Infrastructure
The review of the new technologies for freight and passenger travel revealed a series of infrastructure
improvements that are necessary for the new technologies to be implemented. Some of these
improvements require major investment (vertiports, power supply grid, high precision navigation aids),
unprecedented interventions in the way the transport system operates nowadays (live 3D maps,
geofencing, V2I sensors, microsensors) and radical changes in the regulatory and legal frameworks
(ethics, safety and security, licensing, data management). Major investment in infrastructure,
operational and policy interventions are important gaps and challenges that cities and countries will
face when attempting to implement disruptive mobility technologies and services.
A6.1.2 Regulatory and institutional issues
New mobility services are a promising aspect of future mobility. Harvesting their power and prospect
from various technological or social advances (IoT, sharing economy), they are able to provide
innovative solutions to demand management, accessibility and the minimization of transport
externalities. However, regulatory barriers seem to hinder the development of such services, for
example the recent, rapid development of shared scooter services across Europe has been put to a
halt due to regulatory gaps and safety concerns.
Critical barriers for MaaS also include the potential regulatory, institutional and business-related
barriers (Polydoropoulou et al., 2019; Polydoropoulou et al., 2018), while also the exploration of
demand for MaaS is still pending: variety of mobility-services included in the package, pricing and
city-specific particularities are some of the variables that are expected to affect demand for MaaS
services. Regarding the new mobility services for freight, focus is given to the last mile delivery
problem, crowd-shipping, and micromobility services such as cargo-bikes have the potential to
address long disputed problems in city logistics and freight transportation. Again, safety and security
issues along with regulation are the most important identified barriers to implementing such services.
A6.1.3 Transport models
The review of state-of-the-art models revealed impressive breakthroughs and powerful tools that
make demand and supply modelling, transport system optimization and simulation more detailed,
provide different layers of information, results and KPIs and focus on integrating various layers of
decision-making and analysis. The section on modelling is detailed and the multitude of different
models, data needs and outputs, analytical tools, sub-modules and econometric models is diverse
and covers significant part of policy-maker needs. However, the review identified some significant
gaps in the existing models.
Significant advancements need to be directed towards the preparation and modification of existing or
novel transport models and software packages to account for the effect of new mobility services.

D1.1 Review of new forms of mobility, freight distribution and their business models; gaps identification in KPIs and SUMPs
77
Including different options in the demand models, for example households that have a MaaS
subscription and are not car owners or in the supply side, for example how to model and represent a
free-floating car sharing service, are important modelling issues. The way these issues are handled
by researchers and software developers will affect how realistic and successfully potential changes
are represented in the simulation models, which in turn will affect future scenario predictions and the
actual implementation of such services.
Another important point is the attempt to integrate different levels of spatial and temporal analysis,
ranging from strategic, long-term decisions to day-to-day and decisions on the fly. An ideal model
would have the capability to zoom in and out in spatial and temporal context, seamlessly shift
between sub-models and accurately, fast and safely handle the multitude of available and produced
data. On the way to building this ideal model, we should focus on achieving the highest level of
integration, while preserving autonomy of sub-models because in a lot of cases, scenario testing and
policy-making contexts there is need for specific, focuses analysis.
A6.1.4 Data needs
An additional remark on the existing, state-of-the-art models is the significant variation in data needs,
formats and outputs. This is understandable for different software packages or models, but even for
some model suites there must be manual editing of data to pivot from one module to another. This is
a crucial challenge in an era where data is abundantly available, and data mining and handling is
done with maximal precision and efficiency. Given the abundant data sources and the advanced data
needs, a transport simulation suite should be able to seamlessly and efficiently handle data, both
required input data but as well as data flows within the suite, between models and output data.
A6.1.5 Expected challenges
Overall, it is challenging to explore, predict and model the effect of innovative forms of mobility in the
transport system in a practical and efficient way. The review of land-use, activity-based demand for
passengers and freight and traffic assignment models, along with integrated model suites revealed
significant progress in incorporating novel techniques and tools, inserting additional layers of analysis,
integrating different techniques and harmonizing data. However, there is still much work to be done in
order to achieve an optimal way of harmonizing data and outputs. This is one of the main challenges
ahead of the Harmony project.

D1.1 Review of new forms of mobility, freight distribution and their business models; gaps identification in KPIs and SUMPs
78
A7. References
Acheampong, R. A., Silva, E. A. (2015). Land use–transport interaction modeling: A review of the literature and future research directions. Journal of Transport and Land Use, 8, (3), 11-38. https://doi.org/10.5198/jtlu.2015.806
Adnan, M., Pereira, F.C, Azevedo, C.M.L., Basak, K., Lovric, M., Feliu, S.R., Zhu, Y., Ferreira, J., Zegras, C., Ben-Akiva, M.E. (2016). SimMobility: A multi-scale integrated agent-based simulation platform. 95th Annual Meeting of the Transportation Research Board, January 2016, Washington D.C., U.S.A.
Agatz, N., Erera, A., Savelsbergh, M., Wang, X. (2012). Optimization for dynamic ride-sharing: A review. European Journal of Operational Research, 223(2), 295-303.
Alho, A., Bhavathrathan, B.K., Stinson, M., Gopalakrishnan, R., Le, D., Ben-Akiva, M. (2017). A multi-scale agent-based modelling framework for urban freight distribution. Transportation Research Procedia 27, 188–196.
Amazon (2019). Retrieved on 10 September 2019 from https://www.amazon.com/Amazon-Prime-Air/b?ie=UTF8&node=8037720011.
Amazon Robotics (2019). Retrieved on 23 August 2019 from https://www.youtube.com/watch?v=peaKnkNX4vc; https://www.amazonrobotics.com/#/
Anand, N., van Duin, J., Tavasszy, L. (2014). Ontology based multi‐ agent system for urban freight transportation. International Journal of Urban Sciences 18(2),133‐ 153.
Arentze, T. A., & Timmermans, H. J. P. (2004). A Learning-Based Transportation Oriented Simulation System. Transportation Research Part B: Methodological, 38(7), 613–633.
Arentze, T.A., Timmermans, H.J.P. (2009). A need-based model of multi-day, multi-person activity generation. Transportation Research Part B, 43 (2), 251-265. doi:10.1016/j.trb.2008.05.007
Arrival (2019). Retrieved on 23 August 2019 from https://arrival.com/.
Arnold, F., Cardenas, I., Sörensen, K. and Dewulf, W. (2018. 'Simulation of B2C e-commerce distribution in Antwerp using cargo bikes and delivery points. European Transport Research Review, 10 (1), 1-13. doi: 10.1007/s12544-017-0272-6.
Auld, J., Mohammadian, A.K. (2012). Activity planning processes in the Agent-based Dynamic Activity Planning and Travel Scheduling (ADAPTS) model. Transportation Research Part A 46, 1386–1403. doi:10.1016/j.tra.2012.05.017
Axhausen, K. W. (2016). The Multi-Agent Transport Simulation MATSim. The Multi-Agent Transport Simulation MATSim. https://doi.org/10.5334/baw
Azevedo, C. L., Marczuk, K., Raveau, S., Soh, H., Adnan, M., Basak, K., Loganathan, H., Deshmunkh, N., Lee, D.H., Frazzoli, E., Ben-Akiva, M. (2016). Microsimulation of Demand and Supply of Autonomous Mobility On Demand. Transportation Research Record: Journal of the Transportation Research Board. https://doi.org/10.3141/2564-03
Barra, T. de la (1989) Integrated Land Use and Transport Modelling: Decision Chains and Hierarchies, Cambridge University Press. London.
Bassolas, A., Ramasco, J. J., Herranz, R., Cantú-Ros, O. G. (2019). Mobile phone records to feed activity-based travel demand models: MATSim for studying a cordon toll policy in Barcelona. Transportation Research Part A: Policy and Practice, 121, 56–74. https://doi.org/10.1016/J.TRA.2018.12.024
Batty M (2008). Fifty Years of Urban Modelling: Macro Statics to Micro Dynamics, in S. Albeverio, D.
D1.1 Review of new forms of mobility, freight distribution and their business models; gaps identification in KPIs and SUMPs
79
Andrey, P. Giordano, and A. Vancheri (Editors) The Dynamics of Complex Urban Systems: An Interdisciplinary Approach, Physica-Verlag, Heidelberg, DE,1-20.
Batty, M. (2009). Urban Modeling, in R. Kitchin and N. Thrift (Eds) International Encyclopedia of Human Geography, 12, 51–58.
Ben-Akiva, M., Bowman, J. L. (1998). Integration of an activity-based model system and a residential location model. Urban Studies, 35 (7), 1131-1153. https://doi.org/10.1080/0042098984529
Ben-Akiva, M., Lerman, S. R. (1985). Discrete Choice Analysis. Theory and Application to Travel Demand. Cambridge: MIT Press.
Bhat, C., Guo, J., Srinivasan, S.,Sivakumar, A. (2004). Comprehensive Econometric Microsimulator for Daily Activity-Travel Patterns. Transportation Research Record: Journal of the Transportation Research Board, 1894, 57–66. https://doi.org/10.3141/1894-07
Boerkamps, J.,van Binsbergen, A. (1999). GoodTrip ‐ A new approach for modelling and evaluation of urban goods distribution. International Conference on City Logistics 1st, (pp. 175‐ 186). Cairns, Australia.
Boudway, I. (2019). Self-Driving Trucks Will Carry Mail in U.S. for the First Time. Retrieved from https://www.bloomberg.com/news/articles/2019-05-21/self-driving-trucks-will-carry-mail-in-u-s-for-the-first-time, ( Last accessed 23 August 2019).
Bovenkerk, M. (2005). SMILE+: the new and improved Dutch national freight model system. Proceedings of ETC 2005. Strasbourg, France 18-20 September -Transport policy and operations-freight and logistics-freight modelling I.
Bowman, J. L. (1995). Activity Based Travel Demand Model System with Daily Activity Schedules by. Transportation, 35(1), 1–28.Bowman, J. L., Bradley, M., Shiftan, Y., Lawton, T. K., Ben-Akiva, M. (1999). Demonstration of an activity-based model for Portland, in editor (ed.) World Transport Research: Selected Proceedings of the 8th World Conference on Transport Research, 3, 171–184.Bradley, M., Bowman, J. (2006). A summary of design features of activity-based microsimulation models for US MPOs. White Paper for the Conference on Innovations in Travel Demand Modeling.
Bradley, M., Bowman, J. L.,Griesenbeck, B. (2010). SACSIM: An applied activity-based model system with fine-level spatial and temporal resolution. Journal of Choice Modelling, 3(1), 5–31. https://doi.org/10.1016/S1755-5345(13)70027-7
Brandmeyer, J. E., Karimi, H. A. (2000). Coupling methodologies for environmental models. Environmental Modelling & Software, 15(5), 479–488. doi:Doi 10.1016/S1364-8152(00)00027-X
Brooker, A., Gonder, J., Wang, L., Wood, E., Lopp, S., Ramroth, L. (2015). FASTSim: A Model to Estimate Vehicle Efficiency, Cost, and Performance. SAE Technical Paper 2015-01-0973, 2015, doi:10.4271/2015-01-0973.
Carlier, A., Tschirhart, F., Da Silva, F., Stephan, F., Thoni, O., Munier-Kordon, A., Abid, M., Scremin, L. and Couturier, L. (2015). An overview of multimodal transport design and challenges underlined by a carsharing case study. Complex Systems Design & Management Springer, 257-268.
Carreras, A., Daura, X., Erhart, J., Ruehrup, S. (2018). Road infrastructure support levels for automated driving. 25th ITS World Congress, Copenhagen, Denmark, 17-21 September 2018.
Carsharing Association (CSA), 2019. Carsharing World Map. Accessed on 28 Aug. 2019 at: https://carsharing.org/carsharing-world-map/
Cavalcante, R.A., Roorda, M.J. (2013). Freight Market Interactions Simulation (FREMIS): An Agent-Based Modeling Framework. Procedia Computer Science 19,867 – 873.
D1.1 Review of new forms of mobility, freight distribution and their business models; gaps identification in KPIs and SUMPs
80
Chan, C.Y. (2017). Advancements, prospects, and impacts of automated driving systems. International Journal of Transportation Science and Technology, 6, 208–216.
Chang, T.-Y., Lin, H.-C., Yang, W.-T., Bao, B.-Y., Chan, C.-C. (2012). A modified Nordic prediction model of road traffic noise in a Taiwanese city with significant motorcycle traffic. Science of The Total Environment, 432, 375-381.
Chen, M. (2011). ETIS and TRANS-TOOLS v1 freight demand. Presentation at the CTS-seminar on European and national freight demand models, Stockholm.
Chen, P., Chankov, S. M. (2017) Crowdsourced delivery for last-mile distribution: An agent-based modelling and simulation approach. 2017 IEEE International Conference on Industrial Engineering and Engineering Management (IEEM). 10.1109/IEEM.2017.8290097
Chow, J.Y., Yang, C.H. and Regan, A.C. (2010). State-of-the art of freight forecast modeling: lessons learned and the road ahead. Transportation, 37(6), 1011-1030.
Clement L. (1996) Review of Existing Land-Use Transport Models, Certu, Departement Mobilite, http://lara.inist.fr/bitstream/handle/2332/964/CERTU_96_02.PDF?sequence=2
Cohen, B., Kietzmann, J. (2014). Ride On! Mobility Business Models for the Sharing Economy. Organization & Environment, 27(3), 279 –296.
Conder, S. (2000). Metroscope: The Metro Residential and Nonresidential Real Estate Models, Data Resource Center Metro, Portland, OR.
Coppola, R., Morisio, M. (2016). Connected Car: technologies, issues, future trends. In: ACM Computing Surveys, 49 (3). DOI:10.1145/2971482.
Cottrill, C., Pereira, F., Zhao, F., Dias, I., Lim, H., Ben-Akiva, M.,Zegras, P. (2013). Future Mobility Survey. Transportation Research Record: Journal of the Transportation Research Board, 2354, 59–67. https://doi.org/10.3141/2354-07
DataKustik (2018). Retrieved 6 September 2018 2017, from http://www.datakustik.com/
Davies, A. (2017). Self-Driving Trucks Are Now Delivering Refrigerators. Retrieved on 23 August 2019 from https://www.wired.com/story/embark-self-driving-truck-deliveries/.
de Bok, M., Tavasszy, L., Bal, I., Thoen, S. (2018). The incremental development path of an empirical agent-based simulation system for urban goods transport (MASS-GT). World Conference on Transport Research. Mumbai, India.
de Jong, G., Ben-Akiva, M. (2007). A micro-simulation model of shipment size and transport chain choice. Transportation Research Part B 41, 950–965.
de Jong, G., Tavasszy, L., Bates, J., Grønland, S.E., Huber, S., Kleven, O., Lange, P., Ottemöller, O., Schmorak, N. (2016). The issues in modelling freight transport at the national level. Case Studies on Transport Policy, 4(1),13-21.
de Jong, G., Vierth, I., Tavasszy, L., Ben-Akiva, M. (2013). Recent developments in national and international freight transport models within Europe. Transportation, 40(2), 347-371.
Department for Transport (Dft) (2019). The last mile – Delivering goods more sustainably. Available at: https://assets.publishing.service.gov.uk/government/uploads/system/uploads/attachment_data/file/786879/last-mile-call-for-evidence-government-response.pdf
Desmet, D., Boute, R., Vereecke, A., Sys, L. (2012). Europese distributiecentra in Vlaanderen: typologie en toekomstperspectieven. Gent: Vlerick Leuven Gent Management School, Vlaams Instituut voor Logistiek.
Diaz, J. (2019). 8 robots racing to win the delivery wars of 2019. Retrieved on 23 August 2019 from https://www.fastcompany.com/90291820/8-robots-racing-to-win-the-delivery-wars.

D1.1 Review of new forms of mobility, freight distribution and their business models; gaps identification in KPIs and SUMPs
81
DP-DHL (2019). Retrieved on 10 September 2019 from https://www.dpdhl.com/en/media-relations/press-releases/2019/dhl-launches-its-first-regular-fully-automated-and-intelligent-urban-drone-delivery-service.html
Drchal, J., Čertický, M., Jakob, M. (2019). Data-driven activity scheduler for agent-based mobility models. Transportation Research Part C: Emerging Technologies, 98, 370–390. https://doi.org/10.1016/J.TRC.2018.12.002
Duvall, T., Hannon, E., Katseff, J., Safran, B., Wallace, T. (2019). A new look at autonomous-vehicle infrastructure. McKinsey & Company. Accessed on 30 August 2019 at: https://www.mckinsey.com/industries/capital-projects-and-infrastructure/our-insights/a-new-look-at-autonomous-vehicle-infrastructure
Echenique, M.H., Flowerdew, A, D, J., Hunt, J. D., Mayo, T. R., Skidmore, I. J, and Simmonds, D. C. (1990). The MEPLAN models of Bilbao, Leeds and Dortmund, Transport Reviews, 10 (4), 309-322.
Echenique, M. H., Grinevich, V., Hargreaves, A. J., and Zachariadis, V. (2013). LUISA: A Land-Use Interaction with Social Accounting Model; Presentation and Enhanced Calibration Method. Environment and Planning B, 40 (6), 1003–1026
EUNOIA (2013). Methods and Tools for Urban Mobility Policy. Deliverable 2.1 of the EUNOIA PROJECT. Accessed on 24 Sep. 2019 at: http://www.eunoia-project.eu/publications/
European Commission (EC) (2017). Smart mobility and services: Expert group report. Luxembourg: Publications Office of the European Union, 2017.
European Commission (EC) (2018). Connected & Automated Mobility – For a competitive Europe. Accessed on 22 October 2019 at: https://ec.europa.eu/growth/tools-databases/dem/monitor/sites/default/files/DTM_Autonomous%20cars%20v1.pdf
Europe Container Terminals – ECT (2018). https://myservices.ect.nl/Terminals/rotterdamterminals/deltaterminal/Pages/default.aspx (Last accessed 23 August 2019.)
FHA (Federal Highway Administration) (2007). Quick Response Freight Manual II. Washington, DC, USA.
Fikar, C., Hirsch, P. and Gronalt, M. (2018). A decision support system to investigate dynamic last-mile distribution facilitating cargo-bikes. International Journal of Logistics Research and Applications, 21(3), 300-317.
Frejinger, E., Bierlaire, M., Ben-Akiva, M.E. (2009). Sampling of alternatives for route choice modeling. Transportation Research Part B, 43 (10), 984-994. doi:10.1016/j.trb.2009.03.001 (in press).
Friedrich, H. (2010). Simulation of logistics in food retailing for freight transportation analysis. Karlsruher Institut fur Technoligie (KIT), Karlsruhe.
Furuhata, M., Dessouky, M., Ordóñez, F., Brunet, M.E., Wang, X. and Koenig, S. (2013). Ridesharing: The state-of-the-art and future directions. Transportation Research Part B: Methodological, 57, 28-46.
Gao, F., Yue, P., Zhang, C., Wang, M. (2019). Coupling components and services for integrated environmental modelling, Environmental Modelling & Software, 118, 14-22.
Geurs, K. T., van Wee, B. (2004). Land-use/transport Interaction Models as Tools for Sustainability Impact Assessment of Transport Investments: Review and Research Perspectives. European Journal of Transport and Infrastructure Research, 4(3), 333–355.
Ghoseiri, K., Haghani, A. Hamed, M., 2010. Real-time rideshare matching problem (No. UMD-2009-04). Mid-Atlantic Universities Transportation Center.

D1.1 Review of new forms of mobility, freight distribution and their business models; gaps identification in KPIs and SUMPs
82
Givargis, S., Mahmoodi, M. (2008). Converting the UK calculation of road traffic noise (CORTN) to a model capable of calculating LAeq,1h for the Tehran’s roads. Applied Acoustics, 69 (11),1108-1113.
Gliebe J. (2009) Deriving Economic Development Benefits of Transit Projects from Integrated Land Use Transportation Models. Prepared for Federal Transit Administration by Cambridge Systematics, Inc.
Goodall, W., Dovey Fishman, T., Bornstein, J., Bonthron, B. (2017). The rise of mobility as a service – Reshaping How Urbanities Get Around. Deloitte Review 20, 112-129.
Goulias, K. G., Bhat, C. R., Pendyala, R. M., Chen, Y., Paleti, R., Konduri, K. C., Huang, G., Hu, H.H. (2012). Simulator of Activities , Greenhouse Emissions , Networks , and Travel ( SimAGENT ) in Southern California Simulator of Activities , Greenhouse Emissions , Networks , and Travel ( SimAGENT ) in Southern California. 2012 Annual Transportation Research Board Meeting, 1(91), 1–25.
Graaff, T., Zondag, B. (2012). A Population–Employment Interaction Model as Labour Module in TIGRIS XL, in Pagliara, F., de Bok, M., Simmonds, D., and Wilson, A. G. (Editors) Employment Location in Cities and Regions: Models and Applications, Springer Verlag, Berlin, DE, and TIGRIS XL Land-Use Model: Using the TIGRIS XL Model to Predict Transport And Land-Use Developments.
Grau, J. M. S., Estrada, M., Tzenos, P., Aifandopoulou, G. (2018). Agent-Based Simulation Framework for the Taxi Sector Modeling. Procedia Computer Science, 130, 294-301. https://doi.org/10.1016/j.procs.2018.04.042
Grether, D., Fürbas, S., Nagel, K. (2013). Agent-based modelling and simulation of air transport technology. Procedia Computer Science, 19, 821-828. https://doi.org/10.1016/j.procs.2013.06.109
Grether, D. (2014). Extension of a Multi-Agent Transport Simulation for Traffic Signal Control and Air Transport Systems.
Griff Aviation (2019). Retrieved on 10 September 2019 from http://griffaviation.com/
Gruber, J., Kihm, A., 2016. Reject or embrace? Messengers and electric cargo bikes. Transportation research procedia, 12, 900-910.
Gulliver, J., Morley, D., Vienneau, D., Fabbri, F., Bell, M., Goodman, P., Beevers, S., Dajnak, D., Kelly, F.J., Fecht, D. (2015). Development of an open-source road traffic noise model for exposure assessment. Environmental Modelling & Software, 74, 183-193.
Guzzella, L., Amstutz A. (1998). Quasi-Stationaren-Simulations. Matlab programs and text.
Haboucha, C.J., Ishaq, R., Shiftan, Y. (2017). User preferences regarding autonomous vehicles. Transportation Research Part C, 78, 37–49.
Hahn, R. and Metcalfe, R. (2017). The Ridesharing revolution: economic survey and synthesis. More equal by design: economic design responses to inequality, 4.
Hamilton, S.H., Fu, B., Guillaume, J., H.A., Badham, J., Elsawah, S., Gober, P., Hunt, R. J., Iwanaga, T., Jakeman, A.J., Ames, D.P. , A. Curtis, Hill, M.C. , Pierce, S.A., Zare, F. (2019). A framework for characterising and evaluating the effectiveness of environmental modelling. Environmental Modelling & Software, 118, 83-98.
Hansen, W. G. (1959). How accessibility shapes land use. Journal of the American Institute of Planners, 25, 73–76.
Hawkins, J., Habib, K.N. (2019). Integrated models of land use and transportation for the autonomous vehicle revolution. Transport Reviews, 39 (1), 66-83, DOI: 10.1080/01441647.2018.1449033

D1.1 Review of new forms of mobility, freight distribution and their business models; gaps identification in KPIs and SUMPs
83
Heikkilä, S. (2014). Mobility as a Service-A Proposal for Action for the Public Administration, Case Helsinki. MSc dissertation. Aalto University.
Hensher, D.A. (2017). Future bus transport contracts under a mobility as a service (MaaS) regime in the digital age: Are they likely to change? Transportation Research Part A 98, 86–96.
Hietanen, S. (2014). ‘Mobility as a Service’ – the New Transport Model? Eurotransport, 12 (2) ITS & Transport Management Supplement, 2-4.
Holguín‐ Veras, J., González‐ Calderón, C., Sánchez‐ Díaz, I., Jaller, M., Campbell, S. (2014). Vehicle Trip Estimation Models. In L. Tavasszy, & G. de Jong, Modeling Freight Transport (pp. 143‐ 162). London, UK: Elsevier.
Horni, A., Nagel, K., Axhausen, K.W. (2016). The multi-agent transport simulation MATSim. London: Ubiquity Press.
Howard, D., Dai, D. (2014). Public Perceptions of Self-driving Cars: The Case of Berkeley, California. 93rd Annual Meeting of the Transportation Research Board, 12-16 January 2014, Washington DC.
Hunt, J.D., Abraham, J. (2005). Design and Implementation of PECAS: A Generalised System for Allocating Economic Production, Exchange and Consumption Quantities, in Lee-Gosselin, M. and Doherty, S. (Editors) Integrated Land-Use and Transportation Models, Emerald Group Publishing Limited, Bingley, Yorkshire, UK, 253-273.
Hunt, J.D., Stefan, K.J. (2007). Tour-based microsimulation of urban commercial movements. Transportation Research Part B, 41, 981–1013.
Hunt J. D., Kriger D. S., Miller E. J. (2005). Current Operational Urban Land-use–Transport Modelling Frameworks: A Review. Transport Reviews 25, (3), 329-376.
Iacono M., Levinson D., El-Geneidy A. (2008). Models of Transportation and Land Use Change: A Guide to the Territory, Journal of Planning Literature, 22, 323-340.
Jadaan, K., Zeater, S., Abukhalil, Y. (2017). Connected Vehicles: an Innovative Transport Technology. Procedia Engineering 187, 641-648. DOI: 10.1016/j.proeng.2017.04.425
Jin, S.T., Kong, H., Wu, R. Sui, D.Z. (2018). Ridesourcing, the sharing economy, and the future of cities. Cities, 76, 96-104.
Jin, Y., Echenique, M., and Hargreaves, A. (2013). A Recursive Spatial Equilibrium Model for Planning Large-Scale Urban Change, Environment and Planning B, 40 (6), 1027–1050.
Jin, I., Orosz, G. (2014). Dynamics of connected vehicle systems with delayed acceleration feedback. Transportation Research Part C, 46, 46−64.
Jittrapirom, P., Caiati, V., Feneri, A.-M., Ebrahimigharehbaghi, S., Alonso-González, M., Narayan, J. (2017). Mobility as a Service: A Critical Review of Definitions, Assessments of Schemes, and Key Challenges. Urban Planning, 2(2), 13–25.
Johnson, C. (2017). Readiness of the road network for connected and autonomous vehicles. Royal Automobile Club Foundation for Motoring Ltd, London, United Kingdom.
Johnston, R., Gao, S. (2003). UPlan: A Versatile Urban Growth Model for Transportation Planning, Preprint No. 03-2542, Dept. of Environmental Science and Policy, University of California, Davis, CA.
Institute for Transportation and Development Policy (ITDP), 2013. The Bike-sharing Planning Guide. New York City.
Kamargianni, M., Matyas, M. (2017). The Business Ecosystem of Mobility-as-a-Service. 96th Transportation Research Board (TRB) Annual Meeting. Washington DC, 8-12 January 2017.

D1.1 Review of new forms of mobility, freight distribution and their business models; gaps identification in KPIs and SUMPs
84
Karlsson, M., Sochor, J., Strömberg, H. (2016). Developing the “Service” in Mobility as a Service: experiences from a field trial of an innovative travel brokerage. Transportation Research Procedia 14, 3265–3273.
Kephalopoulos, St., Paviotti, M., Anfosso-Lédée, F., Maercke, Dirk Van, Shilton, S., Jones, N. (2014). Advances in the development of common noise assessment methods in Europe: The CNOSSOS-EU framework for strategic environmental noise mapping. Science of The Total Environment, 482–483, 400-410.
Kiefer, C., Behrendt, F. (2016). Smart e-bike monitoring system: real-time open source and open hardware GPS assistance and sensor data for electrically-assisted bicycles. IET Intelligent Transport Systems, 10(2), 79-88.
Kii, M., Nakanishi, H., Nakamura, K., Doi, K. (2016) Transportation And Spatial Development: An Overview And A Future Direction, Transport Policy, 49, 148–158.
Kiwicampus (2019). Retrieved on 23 August 2019 from https://www.kiwicampus.com/.
Kockelman, K., Boyles, S., Stone, P., Fagnant, D., Patel, R., Levin, M.W., Sharon, G., Simoni, M., Albert, M., Fritz, H., Hutchinson, R., Bansal, P., Domnenko, G., Bujanovic, P., Kim, B., Pourrahmani, E., Agrawal, S., Li, T., Hanna, J., Nichols, A., Li, J. (2017). An Assessment of Autonomous Vehicles: Traffic Impacts and Infrastructure Needs—Final Report. Report No. FHWA/TX-17/0-6847-1. Center for Transportation Research, The University of Texas at Austin, Austin.
Koning, M. and Conway, A. (2016). The good impacts of biking for goods: Lessons from Paris city. Case studies on transport policy, 4(4),259-268.
König, D., Eckhardt, J., Aapaoja, A., Sochor, J., Karlsson, M. (2016). Deliverable 3: Business and operator models for MaaS. MAASiFiE project funded by CEDR.
König, D., Piri, E., Karlsson, M., Sochor, J., Heino, I. (2017). Technology for MaaS. MAASiFiE Deliverable Nr 5.
KPMG International (2016). Your connected car is talking. Who’s listening? Accessed on 22 Oct. 2019 at: https://assets.kpmg/content/dam/kpmg/ch/pdf/your-connected-car-is-talking-en.pdf
KPMG International (2018). Autonomous Vehicles Readiness Index: Assessing countries’ openness and preparedness for autonomous vehicles. Accessed on 27 August 2019 at: https://assets.kpmg/content/dam/kpmg/nl/pdf/2018/sector/automotive/autonomous-vehicles-readiness-index.pdf
Kulmala, R., Jääskeläinen, J. and Pakarinen, S. (2019) . The impact of automated transport on the role, operations and costs of road operators and authorities in Finland. EU-EIP Activity 4.2 Facilitating automated driving, Finland.
Lamber, F. (2017). Royal Mail unveils new electric truck made by Arrival. https://electrek.co/2017/08/23/royal-mail-new-electric-autonomous-truck-arrival/, (Last accessed 23 August 2019).
Le Vine, S., Zolfaghari, A., Polak, J. (2014). Carsharing: Evolution, Challenges and Opportunities. 22th ACEA Scientific Advisory Group Report.
Lenz, B. and Riehle, E. (2013). Bikes for urban freight? Experience in Europe. Transportation Research Record, 2379(1), 39-45.
Liedtke, G. (2009). Principles of micro-behavior commodity transport modelling. Transportation Research Part E, 45, 795–809.
Li, B., Tao, S., Dawson, R.W., Cao, J., Lam, K. (2002). A GIS based road traffic noise prediction model. Applied Acoustics, 63 (6), 679-691.

D1.1 Review of new forms of mobility, freight distribution and their business models; gaps identification in KPIs and SUMPs
85
Liedtke, G., 2006. An actor-based approach to commodity transport modelling. Baden-Baden: Nomos.
Lowry, I. S. (1964) Model of Metropolis, RM-4035-RC, The Rand Corporation Santa Monica, CA.
Lu, Y., Basak, K., Carrion, C., Loganathan, H., Adnan, M., Pereira, F. C., Saber, V. H., Ben-Akiva, M. E. (2015). SimMobility Mid-Term Simulator: A State of the Art Integrated Agent Based Demand and Supply Model. 94th Annual Meeting of the Transport Research Board, 11-15 January 2015, Washingtion D.C., U.S.A. https://doi.org/10.1016/j.ahj.2005.10.012.
Lyon, B., Hudson, N., Twycross, M., Finn, D., Porter, S., Maklary, Z., Waller, T. (2017). Automated vehicles: Do we know which road to take? Infrastructure Partnerships Australia, Sydney.
MaaSLab (2018). "The MaaS Dictionary". Accessed on 25 July 2018 from: https://www.maaslab.org/reports
Machado, C.A.S., De Salles Hue, N.P.M., Berssaneti, F.T., Quintanilha, J.A. (2018). An Overview of Shared Mobility. Sustainability, 10, 4342.
Mackett, R. L. (1991) LILT and MEPLAN – A Comparative-Analysis of Land-Use and Transport Policies for Leeds, Transport Reviews, 11 (2), 131 - 154.
Mahrous, R.F. (2012). Multimodal transportation systems: Modelling challenges. University of Twente Faculty of Geo-Information and Earth Observation (ITC).
Martinez F. (1996). MUSSA: Land Use Model for Santiago City. Transportation Research Record: Journal of the Transportation Research Board, 1552 (1), 126-134.
McFadden, D. (2000). Disaggregate behavioral travel demand’s RUM side. McFadden, Daniel, 2000(July), 17–63. https://doi.org/10.1166/jnn.2004.021.
McKinnon, A. (2016). Crowdshipping: a Communal Approach to Reducing Urban Traffic Levels. Working Paper. DOI: 10.13140/RG.2.2.20271.53925.
Mcnally, M. G. (2007). The Four Step Model. In D.A. Hensher, K.J. Button (Eds.), Handbook of Transport Modelling,2nd edition Pergamon, Oxford (pp. 35–52). https://doi.org/https://escholarship.org/uc/item/0r75311t
Meersman, H., Ehrler, V.C., Bruckmann, D., Chen, M., Francke, J., Hill, P., Jackson, C., Klauenberg, J., Kurowski, M., Seidel, S., Vierth, I. (2016). Challenges and future research needs towards international freight transport modelling. Case Studies on Transport Policy, 4(1), 3-8.
Melo, S. and Baptista, P. (2017). Evaluating the impacts of using cargo cycles on urban logistics: integrating traffic, environmental and operational boundaries. European Transport Research Review, 9(2), 1-10. doi: 10.1007/s12544-017-0246-8.
Milne, D., Watling, D. (2018). Big data and understanding change in the context of planning transport systems. Journal of Transport Geography, 76, 235-244.
Moeckel, R. (2017) Constraints in Household Relocation: Modeling Land-Use/Transport Interactions that Respect Time and Monetary Budgets, The Journal of Transport and Land Use, 10 (2), 1–18.
Moeckel, R. (2018) Integrated Transportation and Land Use Models, The National Academies Press. https://doi.org/10.17226/25194. Washington, DC.
Moeckel, R., Garcia, C. L., Moreno Chou, A. T., Bediako Okrah, M. (2018). Trends in Integrated Land-Use/Transport Modeling: An Evaluation of the State Of The Art, Journal of Transport and Land Use, 11, 1, 463-476.
Mualla, Y., Najjar, A., Daoud, A., Galland, S., Nicolle, C., Yasar, A. U. H., Shakshuki, E. (2019). Agent-based simulation of unmanned aerial vehicles in civilian applications: A systematic literature review and research directions. Future Generation Computer Systems, 100, 344-364. https://doi.org/10.1016/j.future.2019.04.051

D1.1 Review of new forms of mobility, freight distribution and their business models; gaps identification in KPIs and SUMPs
86
Müller, K., Axhausen, K.W. (2011). Population synthesis for microsimulation : State of the art, in: 90th Annual Meeting of the Transportation Research Board.
Münzel, K., Boon, W., Frenken, K., Vaskelainen, T. (2018). Carsharing business models in Germany: characteristics, success and future prospects. Information Systems and e-Business Management, 16 (2), 271-291.
Muritala, B. (2018). The infrastructure problem facing driverless cars. Data Driven Investor, Accessed on 28 August 2019 at: https://medium.com/datadriveninvestor/the-infrastructure-problem-facing-driverless-cars-5d8064ecab5a.
Nestear (2010). Note methodologıque detailee – Transport de marchandises. NESTEAR, Paris.
Newton, S. (2008). Worldnet: applying transport modelling techniques to long distance freight flows. Paper presented at the European transport conference, Noordwijkerhout, The Netherlands.
Nicolai, T.W., Nagel, K. (2015). Integration of agent-based transport and land use models. Integrated Transport and Land Use Modeling for Sustainable Cities, 333-354.
Nuro (2019). Retrieved on 23 August 2019 from https://nuro.ai/.
Ong, T. (2018). UPS will pilot these adorable electric trucks in Paris and London. Retrieved on 23 August 2019 from https://www.theverge.com/2018/5/9/17334710/ups-pilot-fleet-electric-trucks-paris-london-arrival.
Ow, L. F., Ghosh, S. (2017). Urban cities and road traffic noise: Reduction through vegetation. Applied Acoustics, 120, 15–20.
Paloheimo, H., Lettenmeier, M., Waris, H. (2016). Transport Reduction by Crowdsourced Deliveries: a Library Case in Finaland. Journal of Cleaner Production, 132, 240-251.
Pendyala, R., Kitamura, R., Kikuchi, A., Yamamoto, T., Fujii, S. (2005). Florida Activity Mobility Simulator: Overview and Preliminary Validation Results. Transportation Research Record: Journal of the Transportation Research Board, 1921(1921), 123–130. https://doi.org/10.3141/1921-14
Pendyala, R., Konduri, K.C., Chiu, Y.-C., Hickman, M., Noh, H., Waddell., P., Wang, L., You, D., Gardner, B. (2012). An Integrated Land Use--Transport Model System with Dynamic Time-Dependent Activity-Travel Microsimulation. Transportation Research Record Journal of the Transportation Research Board 2303, 19-27.
Perboli, G., Rosano, M., Saint-Guillain, M. and Rizzo, P. (2018). Simulation–optimisation framework for City Logistics: an application on multimodal last-mile delivery', IET Intelligent Transport Systems, 12(4), 262-269.
Petrik, O., Adnan, M., Basak, K., Ben-Akiva, M. (2018). Uncertainty analysis of an activity-based microsimulation model for Singapore. Future Generation Computer Systems. https://doi.org/10.1016/J.FUTURE.2018.04.078
Pfaffenbichler, P., Emberger, G., Shepherd, S. (2008). The Integrated Dynamic Land Use and Transport Model MARS. Networks and Spatial Economics, 8 (2–3), 183–200.
Phillips, S. (2019). Carsharing market and growth analysis 2019. Available online at: http://movmi.net/carsharing-market-growth-2019/
Polis (2017). Mobility as a Service: Implications for urban and regional transport. Discussion paper offering the perspective of Polis member cities and regions on Mobility as a Service, Brussels, Belgium.
Polydoropoulou, A., Pagoni, I., Tsirimpa, A. (2018). Ready for Mobility as a Service? Insights from Stakeholders and End-users. Journal of Travel Behaviour and Society (in press). https://doi.org/10.1016/j.tbs.2018.11.003
D1.1 Review of new forms of mobility, freight distribution and their business models; gaps identification in KPIs and SUMPs
87
Polydoropoulou, A., Pagoni, I., Tsirimpa, A., Roumboutsos, A., Kamargianni, M., Tsouros, I. (2019). Prototype Business Models for Mobility-as-a-Service. Journal of Transportation Research Part A: Policy and Practice (in press).
Portland Bureau of Transportation (PBOT) (2018). 2018 E-Scooter Findings Report.
Prato, C.G. (2009) Route choice modeling: past, present and future research directions. Journal of Choice Modelling, 2, 65-100.
Putman, S. H. (1996) Extending DRAM Model: Theory-Practice Nexus, Transportation Research Record: Journal of the Transportation Research Board, 1552 (1), 112–119.
Quiñones-Bolaños, E. E., Bustillo-Lecompte, C. F., Mehrvar, M. (2016). A traffic noise model for road intersections in the city of Cartagena de Indias, Colombia. Transportation Research Part D: Transport and Environment, 47, 149-161.
Ran, B. and D. Boyce. (1996). Modeling Dynamic Transportation Networks. Berlin: Springer-Verlag.
Raveau, S., Muñoz, J.C., De Grange, L. (2011). A Topological Route Choice Model for Metro Transportation Research, 45A, 138-147.
Rayle, L., Shaheen, S.A., Chan, N., Dai, D. Cervero, R. (2014). App-based, on-demand ride services: comparing taxi and ridesourcing trips and user characteristics in San Francisco (No. UCTC-FR-2014-08). Berkeley, CA: University of California Transportation Center.
Reyes García, R., Lenz, G., Haveman, S., Bonnema, M. (2019). State of the art of electric Mobility as a Service (eMaaS): an overview of ecosystems and system architectures. 32nd Electric Vehicle Symposium (EVS32) Lyon, France, May 19 - 22, 2019.
Richter, F. (2018). Bike-Sharing Clicks Into Higher Gear. Available online at: https://www.statista.com/chart/14542/bike-sharing-programs-worldwide/
Rijkswaterstaat, (2016). European Truck Platooning Challenge 2016. Retrieved on 23 August 2019 from https://www.government.nl/topics/mobility-public-transport-and-road safety/documents/leaflets/2015/10/06/leaflet-european-truck-platooning-challenge-2016.
Roorda, M.J., Cavalcante, R., McCabe, S., Kwan, H., 2010. A conceptual framework for agent-based modelling of logistics services. Transportation Research Part E: Logistics and Transportation Review, 46(1),18-31.
Rosenbaum, A. S., Koenig, B. E. (1997). Evaluation of Modeling Tools for Assessing Land Use Policies and Strategies. Prepared for the US Environmental Protection Agency.
Rothfeld, R.L., Balac, M., Ploetner, K.O., Antoniou, C. (2018). Agent-based simulation of urban air mobility, in: 2018 Modeling and Simulation Technologies Conference. doi:10.2514/6.2018-3891.
Rupprecht et al. (2019). “Guidelines for Developing and Implementing a Sustainable Urban Mobility Plan (Second Edition).” European Platform on Sustainable Urban Mobility Plans. Final draft for SUMP Conference. European Commission
Salvini, P. Miller, E. J. (2005). ILUTE: An Operational Prototype of a Comprehensive Microsimulation Model of Urban Systems. Networks and Spatial Economics, 5 (2), 217–234.
Samimi, A., Mohammadian, A., Kawamura, K. (2010). Behavioral freight movement modeling. The 12th International Conference on Travel Behaviour Research, Jaipur, Rajasthan, India.
Sarasini, S., Langeland, O. (2017). Business model innovation for car sharing and sustainable urban mobility. 8th International Sustainability Transitions Conference, 18-21 June 2017, Gothenburg, Sweden.
Sárdi, D. L., Bóna, K. (2018). Macroscopic simulation model of a multi-stage, dynamic cargo bike-
based logistics system in the supply of shopping malls in Budapest. 2018 Smart City Symposium Prague (SCSP). 10.1109/SCSP.2018.8402680

D1.1 Review of new forms of mobility, freight distribution and their business models; gaps identification in KPIs and SUMPs
88
Schaller, B. (2018). The new automobility: Lyft, Uber and the future of American cities.
Schliwa, G., Armitage, R., Aziz, S., Evans, J., Rhoades, J. (2015). Sustainable city logistics—Making cargo cycles viable for urban freight transport. Research in Transportation Business & Management, 15, 50-57.
Schock S. (2000). Projecting Land-Use Change: A Summary of Models for Assessing the Effects of Community Growth and Change on Land-Use Patterns. Office of Research and Development, United States Environmental Protection Agency.
Schröder, S., Liedtke, G.T. (2017). Towards an integrated multi-agent urban transport model of passenger and freight. Research in Transportation Economics, 64, 3-12.
Schroeder, S., Zilske, M., Liedtke, G., Nagel, K. (2012). A computational framework for a multi-agent simulation of freight transport activities. In Annual Meeting Preprint (pp. 12-4152).
Schürmann, C., Spiekermann, K., Wegener, M. (1997). Accessibility indicators. Berichte aus dem Institut für Raumplanung 39.
Shaheen, S., Chan, N., Bansal, A., Cohen, A. (2015). Shared mobility. Definitions, industry developments, and early understanding. University of California Berkeley Transportation Sustainability Research Center, Berkeley.
Shaheen, S., Chan, N. (2016). Mobility and the Sharing Economy: Potential to Overcome First-and Last-Mile Public Transit Connections.
Shahumyan, H., Moeckel, R. (2017). Integration of land use, land cover, transportation, and environmental impact models: Expanding scenario analysis with multiple modules. Environment and Planning B: Urban Analytics and City Science 44(3), 531–552. doi:10.1177/0265813516647062
Sheffi, Y. (1985). Urban Transportation Networks: Equilibrium Analysis with Mathematical Programming Methods, Prentice-Hall, Englewood Cliffs, USA.
Simmonds, D. (2019). Integrated Modelling in the UK: Practical Usability of Integrated Models, Journal of Transport and Land-Use, 12 (1), 327-334.
Simoni, M.D., Marcucci, E., Gatta, V. and Claudel, C.G. (2019). Potential last-mile impacts of crowdshipping services: a simulation-based evaluation, Transportation, 1-22. https://doi.org/10.1007/s11116-019-10028-4
Sivakumar A. (2007). Modelling Transport: A Synthesis of Transport Modelling Methodologies, Imperial College Centre for Transport Studies, London.
Smith, L., Beckman, R., Baggerly, K. (1995). TRANSIMS: Transportation analysis and simulation system. Los Alamos National Lab., NM (United States), (LA-UR-95-1641), doi:10.2172/88648.
Sobanjo, J.O. (2019). Civil Infrastructure Management Models for the Connected and Automated Vehicles Technology. Infrastructures 2019, 4(3), 49; https://doi.org/10.3390/infrastructures4030049
Society of Automotive Engineers (2014). Taxonomy and Definitions for Terms Related to On-Road Motor Vehicle Automated Driving Systems. J3016_201401, Surface vehicle information report, SAE International.
Soora, R., Timmermans, H (2014). Activity-based models of travel demand: promises, progress and prospects. International Journal of Urban Sciences 18, (1), 31-60.
Southworth, F. (1995) A Technical Review of Urban Land Use-Transportation Models as Tools for Evaluating Vehicle Travel Reduction Strategies, Report number ORNL-6881, prepared for the U.S. Department of Energy.
Sprei, F. (2018). Disrupting mobility. Energy Research & Social Science, 37, 238–242.

D1.1 Review of new forms of mobility, freight distribution and their business models; gaps identification in KPIs and SUMPs
89
Srinivasan, S., L. Ma and K. Yathindra (2008). Procedure for forecasting household characteristics for input to travel-demand models, Final Report, TRC-FDOT-64011-2008, Transportation Research Center, University of Florida.
Stocker, A., Shaheen, S. (2017). Shared Automated Vehicles: Review of Business Models. Discussion Paper No. 2017-09, Prepared for the Roundtable on Cooperative Mobility Systems and Automated Driving (6-7 December 2016), International Transport Forum.
Suthanaya, P.A. (2015). Modelling Road Traffic Noise for Collector Road (Case Study of Denpasar City). Procedia Engineering, 125, 467-473.
Tavasszy, L.A., Smeenk, B., Ruijgrok, C.J. (1998). A DSS For Modelling Logistic Chains in Freight Transport Policy Analysis. International Transactions in Operational Research 5(6), 447-459.
TNO (2008). TRANS-TOOLS, Deliverable 6: TRANS-TOOLS Final Report, WP 6. TNO Inro (The Netherlands), Delft (2008).
Transport Systems Catapult. (2016). Exploring the opportunity for Mobility as a Service in the UK. UK: Transport Systems Catapult.
Transport for London (TfL) (Eds.) (2009): Cycle freight in London: A scoping study. London. http://www.tfl.gov.uk/assets/downloads/businessandpartners/cycle-as-freight-may-2009.pdf Accessed 21 August, 2019.
Troy, A., Azaria, D., Voigt, B., Sadek, A. (2012) Integrating a traffic router and microsimulator into a land use and travel demand model, Transportation Planning and Technology, 35 (8), 737-751, DOI: 10.1080/03081060.2012.739308
Tsirimpa, A., Polydoropoulou, A. (2015). UMove: A Smart Mobile Application for Travel Data Collection. In International Conference on Travel Behaviour Research.
TuSimple (2019). Retrieved on 23 August 2019 from https://www.tusimple.com/.
Uber (2016). UBER Elevate: Fast-Forwarding to a Future of On-Demand Urban Air Transportation. Accessed on 26 September 2019 at: https://www.uber.com/elevate.pdf
Vaskelainen, T. (2014). Sustainable business models—The case of car sharing. In: Resilence—the new research frontier: Proceedings of the 20th annual international sustainable development research conference, Norwegian University of Science and Technology; International Sustainable Development Research Society.
Vera (2019). Retrieved on 23 August 2019 from https://www.volvotrucks.com/en-en/about-us/automation/vera.html.
Villalobos, J. A., Chiu, Y. C., Mirchandani, P. B. (2008). MALTA-The Spatially and Temporally Scalable Dynamic Traffic Simulation and Assignment System. ICS News 1–6.
Vincent, J. (2019). FedEx unveils autonomous delivery robot. Retrieved on 23 August 2019 from https://www.theverge.com/2019/2/27/18242834/delivery-robot-fedex-sameday-bot-autonomous-trials.
Viscelli, S. (2018). Report for the UC Berkeley center for labor research and education and working partnerships, Berkely, USA.
Vorraa, T. (2004). Cube Land: Integration Between Land Use And Transportation, in C. A. Brebbia & L. C. Wadhwa (Editors) Urban Transport X, WIT Press, Southampton, UK, 111-117, and CUBE (2019) Citilabs Headquarters, 2005 N Street, Sacramento, CA, https://www.citilabs.com/software/cube/
Waddell, P., Wang, L., Charlton, B., Olsen, A. (2010). Microsimulating parcel-level land use and activity-based travel: Development of a prototype application in San Francisco. Journal of Transport and Land Use, 3 (2), 65-84. doi: 10.5198/jtlu.v3i2.124

D1.1 Review of new forms of mobility, freight distribution and their business models; gaps identification in KPIs and SUMPs
90
Waddell, P. (2002). UrbanSim: Modeling urban development for land use, transportation, and environmental planning. Journal of the American planning association, 68 (3), 297-314.
Waddell, P., Ševcíková, H., Socha, D., Miller, E., Nagel, k. (2005). Opus: An Open Platform for Urban Simulation. Presented at the Computers in Urban Planning and Urban Management Conference, June, 2005, London, U.K.
Waddell, P. A., Liu, X., Wang, L. (2008). UrbanSim: An Evolving Planning Support System for Evolving Communities. Planning Support Systems for Cities and Regions (R. K. Brail, ed.), Lincoln Institute of Land Policy, Cambridge, Mass., 103–138.
Wardrop, J.G. (1952). Some theoretical aspects of road traffic research. Proceedings of the Institute of Civil Engineering, Part II 1, 325-378.
Wegener, M. (1994) Operational Urban Models State of the Art, Journal of the American Planning Association, 60, 1, 17-29.
Wegener, M. (1998). The IRPUD model: overview. Website of the institute of spatial planning, University of Dortmund.
Wegener , M. (2011). The IRPUD Model, Working Paper 11/01, Spiekermann & Wegener Urban and Regional Research (S&W), Lindemannstrasse 10, D-44137 Dortmund.
Wegener, M. (2012) Land-Use Transport Interaction Models, in Manfred M. Fischer, and Peter Nijkamp (Editors) Handbook of Regional Science, Springer, New York, 741-758.
Wegener, M., Fürst, F. (1999). Land-Use Transport Interaction: State of the Art-Berichte aus dem Institut für Raumplanung 46. Dortmund, Germany: Institut für Raumplanung, Universität Dortmund (1999).
Weiss, M.A., Heywood J.B., Drake E.M., Schafer A.W., AuYeung F.F. (2000). On the road in 2020 – A life-cycle analysis of new automobile technologies. Energy Laboratory Report # MIT EL 00-003 Energy Laboratory Massachusetts Institute of Technology.
Wenban-Smith, A., van Vuren, T., Macdonald, M. (2009). Using transport models in spatial planning: issues from a review of the London land-use/transport interaction (LUTI) Model. Urban & Regional Policy, Association for ETC 2009.
Westervelt, M., Huang, E., Schank, J., Borgman, N., Fuhrer, T., Peppard, C., Narula-Woods, R. (2018). UpRouted: Exploring Microtransit in the United States.
Wisetjindawat, W., Sano, K., Matsumoto, S., Raothanachonkun, P. (2006). Micro‐ simulation model for modeling freight agents interactions in urban freight movement. Transportation Research Board 86th Annual Meeting. Washington, DC, USA.
Wong, Y.Z., Hensher, D.A., Mulley, C. (2018). Emerging transport technologies and the modal efficiency framework: A case for mobility as a service (MaaS).
Voigt, B., Troy, A., Miles, B., Reiss, A. (2009). Testing integrated land use and transportation modeling framework for a Small Metropolitan Area. Transportation Research Record, 2133, 83-91.
Ye, X., Konduri, K.C., Pendyala, R.M., Sana, B., Waddell, P. (2009). Methodology to Match Distributions of Both Household and Person Attributes in Generation of Synthetic Populations. Transportation Research Board Annual Meeting 2009.
Zhang, Y. (2013). Adapting Infrastructure for Automated Driving. Center for Urban Transportation Research, University of South Florida, United States.
Zhao, F., Chung, S. (2006). A Study of Alternative Land use Forecasting Models – Final Report. For the FDOT Systems Planning Office. Technical Report BD015- 10.

D1.1 Review of new forms of mobility, freight distribution and their business models; gaps identification in KPIs and SUMPs
91
Ziemke, D., Metzler, S., Nagel, K. (2017). Modeling bicycle traffic in an agent-based transport simulation. Procedia Computer Science, 109, 923-928. https://doi.org/10.1016/j.procs.2017.05.424
Ziemke, D., Nagel, K., Moeckel, R. (2016). Towards an agent-based, integrated land-use transport modeling system. Procedia computer science 83, 958-963.
Zmud, J.P., Sener, I.N. (2017). Towards an Understanding of the Travel Behavior Impact of Autonomous Vehicles. Transportation Research Procedia 25, 2500–2519.

D1.1 Review of new forms of mobility, freight distribution and their business models; gaps identification in KPIs and SUMPs
92
SECTION B: REVIEW OF SUSTAINABLE URBAN MOBILITY PLANS, POLICY APPRAISAL METHODS AND KPIs
B1. The concept of Sustainable Urban Mobility Plans
B1.1 Introduction
Sustainable urbanization is widely acknowledged as a key global challenge for the 21st century.
Congestion, air and noise pollution, and safety are just some examples of commonly shared problems
in many European cities. Besides the direct impact of traffic, urban transport also affects the local
economy, social inclusion, and accessibility for more vulnerable user groups like children and people
with reduced mobility.
In order to tackle these challenges and ensure competitive and resource efficient urban mobility, in
2013, the European Commission introduced the so-called Urban Mobility Package. Within this
package, Sustainable Urban Mobility Plans (SUMPs) represented the central element for
addressing the challenges related to (mainly) urban areas (Rupprecht et al., 2019).
A SUMP is a strategic planning instrument for local authorities, fostering the balanced development
and integration of all transport modes while encouraging a shift towards more sustainable modes. A
SUMP aims to solve urban transport problems and contribute to reaching local and higher-level
objectives for environmental, social, and local development.
As of June 2018, a total of 1,000 SUMPs has been identified in Europe. The major contributors are
countries in which the adoption of a SUMP is mandatory by law or supported by significant incentives,
as three countries alone – Belgium (Flanders and Wallonia), France, and Spain (Catalonia) – account
for half of the adopted SUMPs in Europe. Among the 1,000 adopted SUMPs, 290 are second or third
generation plans (Durlin, 2018).
B1.2 What are SUMPs about?
SUMPs represent a set of guiding principles with the central goal of improving accessibility of urban
areas and providing high-quality and sustainable mobility to, through and within the urban area. They
constitute Europe’s de-facto urban transport planning concept and can be adapted to the specific
circumstances of the urban area under consideration. Contrarily to more traditional transport planning
practices, which tend to focus on traffic and infrastructure rather than people and seamless mobility,
SUMPs are about the needs of the cities and apply a people-centric approach. In fact, in order to
cope effectively with the complex problems that cities are facing, SUMPs puts a strong emphasis on
the need to involve citizens and stakeholders actively, and on wide cooperation across different layers
of government and with private actors.
Commonly, a SUMP can be defined as “a strategic plan designed to satisfy the mobility needs of
people and businesses in cities and their surroundings for a better quality of life. It builds on existing
planning practices and takes due consideration of integration, participation, and evaluation principles”
(Rupprecht et al., 2019).

D1.1 Review of new forms of mobility, freight distribution and their business models; gaps identification in KPIs and SUMPs
93
As this definition suggests, a SUMP does not provide a unique recommendation of what urban
planning should be like, or a one-size-fits-all approach to urban mobility planning. It is rather a set of
guiding principles that can be adapted to the specific circumstances of the urban area under
consideration.
The SUMP’s approach requires long-term vision and clear implementation of the plan through a
participatory approach that guarantees a balanced and integrated development of all transport
modes. The actual content of the plan should be the result of the planning process, i.e. the identified
needs and agreed policy priorities. Nonetheless, the SUMP concept requires that the final plan
contains both a long-term strategy and measures for short-term implementation. It needs to cover all
mobility (of people and goods), modes and services in an integrated manner and the plan must regard
the needs of the entire “functional urban area”, rather than only a single municipality within its
administrative boundaries.
In addition, SUMPs advocate fact-based planning and decision making and the assessment of current
and future performance is guaranteed through regular monitoring, review, reporting, and quality
assurance.
In summary, the concept of SUMP can be summarized with by guiding principles (Rupprecht et al.,
2019):
1. Plan for sustainable mobility for the “functional urban area”
2. Cooperate across institutional boundaries
3. Involve citizens and stakeholders
4. Assess current and future performance
5. Define a long-term vision and a clear implementation plan
6. Develop all transport modes in an integrated manner
7. Arrange for monitoring and evaluation
8. Assure quality
B1.3 How does a SUMP work?
The development of a SUMP is a multi-faced planning process that involves various steps and
activities. In particular, it consists of 4 phases (preparation and analysis, strategy development,
measure planning, implementation and monitoring) containing in total 12 main steps, which in turn are
made up of 31 activities. All four phases of the cycle start and end with a milestone. The milestones
mark the completion of a phase that is linked to a decision or an outcome needed for the next phase.
All steps and activities should be taken as part of a regular planning cycle in the sense of a
continuous improvement process of the mobility planning.
Below is a bullet point summary of the SUMP process (Rupprecht et al., 2019):
A political decision initiates the SUMP process and provides overall guidance and leadership
A detailed analysis informs scenario building and supports decision making
A common vision, objectives, indicators, and targets are widely agreed throughout the SUMP
process
Based on a long list of measures, integrated measure packages are defined that can deliver
the objectives (and meet the targets).
Measure packages are divided into actions (actionable tasks) that are further operationalized
prior to implementation
Overall measure coordination is ensured

D1.1 Review of new forms of mobility, freight distribution and their business models; gaps identification in KPIs and SUMPs
94
Systematic monitoring may lead to make adaptations in implementation
Informed conclusions from the implementation provide the ground for a future planning cycle.
Some of the different measures available for cities include: cycling facilities and infrastructures,
introduction or improvement of local public transport, removal of accessibility barriers, car and bike
sharing schemes, integration of transport modes through intermodal nodes and ticketing systems,
school or company travel plans, promotion of electric mobility through incentives and charging
infrastructures, zero emission urban freight logistics, ITS solutions for traffic and demand
management, , low emission/limited traffic zones, creation of pedestrian areas and walking paths,
parking policies, congestion charging, marketing and communication campaigns, participation at the
European Mobility Week.
Figure 20. The 12 Steps of Sustainable Urban Mobility Planning (SUMP 2.0) – A planner's overview. [October 2019]
B1.4 Principal benefits of SUMPs
There is a strong interest from planners and decision-makers in applying the SUMP concept and
initiating a paradigm shift towards sustainable urban mobility development. Among all the factors, the
fact that a SUMP can be highly beneficial for both the place and the community where it is
implemented feed such interest.

D1.1 Review of new forms of mobility, freight distribution and their business models; gaps identification in KPIs and SUMPs
95
The benefits of the SUMP approach can be diverse. That being said, these are considered the 10
principal reasons for drafting and implementing one (Rupprecht et al., 2019):
1. Improving quality of life
2. Saving costs – creating economic benefits
3. Contributing to better health and environment
4. Making mobility seamless and improving access
5. Making more effective use of limited resources
6. Winning public transport and active modes?
7. Preparing better plans
8. Fulfilling legal obligations effectively
9. Using synergies, increasing relevance
10. Moving towards a new mobility culture
It is unquestionable that implementing a SUMP brings a series of positive outcomes. However,
developing a SUMP is a complex, integrated planning process requiring intense cooperation,
knowledge exchange, and consultation between planners, politicians, institutions, local as well as
regional actors and citizens. At all levels of government, activities have been deployed to support the
concept, but several challenges currently inhibit the Europe-wide uptake of SUMPs.
One of the principal barriers that need to be overcome is the capability of making budget available
and addressing infrastructure issues in times of economic austerity. As a result, cities often face
multidimensional challenges in delivering SUMPs. At the same time, there is no one-size-fits-all
solution to increasing the number of SUMPs prepared, due to the great variety of local planning
contextual conditions in Europe. Available funding and enough resources are required both when
implementing the plan and when monitoring and evaluating it.
A strong political commitment, a clear subdivision of roles and responsibilities and the adequate
public and stakeholders’ support can be major impairments as well, as it could be a poor integration
between different policies and plans.
B1.5 EC SUMP Guidelines
B1.5.1 The SUMP Guidelines 2013 edition
The SUMP guidelines are aimed at practitioners in urban transport and mobility, as well as other
stakeholders who would be involved in the development and implementation of a SUMP. Their
purpose is to describe in detail the 4-phases, 12-steps, 32-activities process that is required in order
to prepare and implement the plan.
The first edition of the SUMP guidelines was published in 2013. Since then, it has acted as the main
European reference document for urban transport and mobility practitioners involved in the
development and implantation of SUMPs. Many cities in Europe and around the world have
developed SUMPs, while numerous European Union funded project and programmes have
contributed valuable knowledge that helped cities to develop this new generation of mobility plans.
In addition, an entire community of practice has formed around SUMPs: a wealth of good practices
are being shared by practitioners, numerous (mostly) free tools and knowhow are available on the
ELTIS platform (www.eltis.eu), a coordination platform of major stakeholders and projects has been
set-up, and annual SUMP Conferences have been held since 2014.

D1.1 Review of new forms of mobility, freight distribution and their business models; gaps identification in KPIs and SUMPs
96
Finally, having a state-of-the-art SUMP is increasingly seen as a must-have for forward-looking cities
and increasingly as a requirement to attract funding for urban transport investments.
B1.5.2 The last update of the SUMP guidelines
Over the last few years we have seen major new developments in many areas of urban mobility: due
to new technologies driverless electric vehicles may soon be on our roads, new business models
provide “Mobility as a Service”, and at the same time changing attitudes among travellers result in an
increase in shared mobility and cycling.
Whilst the guidelines continue to be used extensively, the emergence of new trends and changes in
many areas of urban mobility joined with a wealth practical SUMP experience that has been acquired
over the last few years that needed to be made available as inspiration for practitioners across
Europe, indicated that it was time to rethink and update the original version of the Guidelines.
A comprehensive update process of European SUMP guidance was started in 2018, including a
revision of the Guidelines itself, as well as the development of a range of complementary guides on
specific aspects of SUMP. The publication of the second edition of the European SUMP Guidelines
marks an important milestone in the take-up of a new planning culture in Europe. This comprehensive
revision aims to integrate the dynamic developments in many areas of urban mobility and the rich
experience of implementing the concept of SUMP since 2013 in order to form a structured knowledge
base.
The new version included the preparation of this revised version of the SUMP Guidelines, as well as
the development of a range of complementary guides on specific aspects of SUMPs. These guides
elaborate difficult planning aspects in more detail (e.g. institutional cooperation), apply Sustainable
Urban Mobility Planning to specific contexts (e.g. metropolitan regions), or provide guidance on how
to pursue important policy goals (e.g. health) or technical concepts (e.g. automation) in the planning
process.
The update has been inspired by a thorough review of existing literature, including national planning
guidance from several countries with a strong tradition of strategic mobility planning where projects
and initiatives served to develop additional knowledge on specific planning topics.

D1.1 Review of new forms of mobility, freight distribution and their business models; gaps identification in KPIs and SUMPs
97
B2. Policy appraisal in urban planning
B2.1 Policy appraisal process for SUMPs
A key part of the SUMP implementation consists in the policy appraisal, i.e. the process of identifying
the most suitable and cost effective policy measures to achieve the SUMP’s vision and objectives and
overcome the identified problems. This is an analytical process of judging the relative merits of
strategies before they are implemented, using a structured methodology (Guhnemann, 2016).
An appraisal is typically conducted during SUMP development to test scenarios and assess options to
understand whether potential measures will be effective and represent value for money, or whether
they may need to be enhanced or adapted in some way.
When a city begins elaborating a plan, it is essential to identify and analyse suitable types of policy
measures, to develop detailed specifications of policy measures and packages, and to conduct an
appraisal of the proposed measures and packages.
The process of appraisal for SUMPs consists in assessing a proposed measure or package in
advance of its implementation at design or feasibility stage. Effective appraisal involves assessing
likely performance of a measure or package against each of the city’s objectives (effectiveness),
likelihood of being approved (acceptability), and implications for the city’s budget (value for money).
Appraisal involves an ex-ante assessment, and needs to address acceptability, while evaluation
involves ex-post assessment once an accepted measure or package has been implemented. While
evaluation can use observed data, appraisal has to use predictive data from models involving either a
quantitative and qualitative approaches. In both cases, an agreed set of performance indicators will
assess the goodness and the likely effects of the policy measures (Guhnemann, 2016).
The appraisal process may involve preliminary evaluations, pre-feasibility analysis and feasibility
analysis of detailed design options. The appraisal process could lead to a number of design options
for each measure and potentially a number of packages. The Appraisal process can be used to
(Guhnemann, 2016):
Reduce a long list of possible measures and projects to a more manageable shortlist, for
example excluding costly or technically non-feasible options
Choose the best option for a particular measure
Choose between measures
Choose between packages
Identify weaknesses in any of these which could be overcome by returning to the design stage
The process of measure selection is very delicate and might be a challenge for multiple reasons.
Firstly, cities can have a very wide range of measures available to them (e.g., hard and soft) and it
can be very easy to overlook solutions which would be more effective. Secondly, many stakeholders
and politicians will have vested interest in what should be done, and these solutions are often not the
most cost-effective. Thirdly, the most cost-effective measures are often not the most easily
implemented: split responsibilities, lack of funding, and public opposition can limit what is done.
Further, a SUMP is likely to draw on several measures, but the SUMP’s performance, and
implementability will depend on how these measures are packaged and presented to the public for
understanding of their rationale and acceptability. Finally, a SUMP needs to be more than a wish-list
of measures, however, they are packaged; prior to implementation each measure needs to be defined
D1.1 Review of new forms of mobility, freight distribution and their business models; gaps identification in KPIs and SUMPs
98
in detail, assessed in terms of its likely impacts (i.e., economic, social and environmental), and
appraised in terms of potential contribution (May, 2016).
B2.2 Policy appraisal methodologies
It is fundamental that any assessment consider all objectives, and hence all performance indicators.
An appraisal framework is, at its simplest, a table in which each option forms a column and each row
an indicator. Absolute values are assigned to each option and each indicator and the differences
among them can be easily calculated. The user can check the table to identify which option, or
measure, or package, performs best against each indicator, and which performs best overall.
Examples of indicators can be seen in Chapter B3 of this section.
The simplest way to use an appraisal framework is to identify the indicators against which each option
performs better than the “do-nothing”, and then to decide which option performs best among those
being compared. However, it often happens that an option will perform well against some indicators
(such as congestion) and badly against other (such as pollution). In such cases, the user needs to
assess how much worsening in pollution can be justified by a given reduction in congestion, or vice-
versa (May, 2016).
A common way of doing this is Multi-Criteria Appraisal (MCA) which refers to an appraisal of a
scenario or measure looking at more than one SUMP target of policy section. With this method, the
user first assigns weights to each indicator, and then calculates a weighted total score across all
indicators for each option. The option with the highest score is then the best performing. It is common
to ask stakeholders to contribute to setting weights for an MCA. Simplified MCAs are often used for
sifting a long list of options to produce a more manageable shortlist (May, 2016).
However, even the best performing option may not be the most affordable, or even affordable at all.
This can be assessed using Cost Benefit Analysis (CBA) in which the weights are money values, the
weighted total is the total benefit, and it is compared with the cost of implementation and operation.
The option with the highest Net Present Value (NPV) or Benefit/Cost Ratio (BCR) is the best (May,
2016).
Uncertainty can arise in appraisal in different ways:
The future conditions (be they political, economic, or regulatory) in which the options are
tested
The timing of implementation of each measure in a package
The ability to model transport demand for some measures
The arbitrarily introduced weights used in a MCA
The implementation costs used in a CBA
One possible way of tackling such uncertainties is to use sensitivity tests. The appraisal (and in some
case the model) is re-run with a range of assumptions. If the preferred option remains best under a
number of assumptions, it can be assumed to be worth adopting. If its performance is variable, then it
is less robust, and less obviously worth pursuing. Once again, this may suggest trying to redesign it to
improve its performance (May, 2016).

D1.1 Review of new forms of mobility, freight distribution and their business models; gaps identification in KPIs and SUMPs
99
B2.2.1 Comparison of CBA and MCA
CBAs and MCAs each have individual strengths and weaknesses. By using a form of CBA, it is
possible to express a project or measure’s direct or indirect costs and benefits, allowing the benefits
and economic viability to be assessed and expressed in monetary terms. CBAs can include the
consideration of both internal and external costs and benefits.
One of the main advantages of a CBA is the relative ease of communicating its results through few
performance indicators, which can be compared across different types and sizes of measures. Also,
CBAs clearly define the measures’ economic efficiency, which is of significant importance to local
governments, especially in times of constrained budgets. Furthermore, external costs of road
transport (i.e., emissions, safety and congestion), often neglected in decision-making, are included in
the analysis (Sundberg, 2018).
Among the weaknesses of CBAs are the extensive data required: all effects must be quantified and
monetized. Although CBA is widely applied at international level and the methodology standardized,
monetization approaches are still controversial, especially concerning intangible effects or ethical
problems in assessing health or safety effects. The common dominance of travel-time savings in
CBAs is also often criticized. Also, a key weakness consists in the difficulty in including qualitative
impacts (Sundberg, 2018).
CBAs are most frequently applied to large-scale infrastructure projects. For non-infrastructure
measures, most cities lack a standardized assessment approach. The selection of measures should
be guided by value for money as well as by the effectiveness of the measures. In some instances, a
full CBA may be too costly and more simple approaches should be used, especially for smaller
measures (like for example cost-effectiveness analysis) (Sundberg, 2018).
In contrast, MCA has the key advantage of offering the possibility of including both qualitative and
quantitative impacts. This allows criteria that are difficult to quantify or monetize to also be accounted
for, especially important for local level projects or measures where many quantitative effects are
(highly) relevant. Furthermore, as MCAs do not necessarily require much data that is difficult (and
expensive) to gather, they can be cheaper to perform (Guhnemann, 2016).
Another key advantages of a MCA is that it can easily include stakeholder participation, while experts,
decision-makers and public institutions can be involved in the performance scoring and weighting of
criteria. This allows an MCA to be easily linked with SUMPs, as they adopt an holistic perspective of
the transport system addressing all modes of transport to create a more sustainable system
(Guhnemann, 2016).
In fact, a key characteristic of a SUMP is its participatory approach: involving stakeholders and
citizens in the decision-making, implementation, and evaluation of measures. On the one hand, the
participatory approach of MCAs makes decision-making more transparent and can prevent conflicts
or settle possible arguments. On the other, the subjective assessment is one of the main weaknesses
of the method, as the comparability of results is limited. Furthermore, participatory processes can be
very elaborate and time consuming.

D1.1 Review of new forms of mobility, freight distribution and their business models; gaps identification in KPIs and SUMPs
100
Table 30. Strengths and weaknesses of policy appraisal methods
CBA MCA
Strengths
Indicator based: transparent and easy to communicate
Highlights economic efficiency
All of a measure’s impact (quantitative & qualitative) can be evaluated
Promotes public participation and compromises
Applicable to soft measures
Applicable to local level projects
Weaknesses
Extensive data requirements
Monetization is difficult and controversial
Elaborate
Non-monetary effects often limited to VTTS and safety
Results often dominated by VTTS
Cannot assess soft/less tangible effects
Subjective assessment
Limited comparability of results
Little consistency
Participation process may be elaborate
B2.2.2 Simplified methods
To avoid costly full-scale CBAs in the first steps into SUMPs for starter-cities, simplified impact
assessment tools can help. For example, the Urban Nodes Assessment Tool is a crossover between
CBA and MCA. The benefit of using this easy tool is that there is no need for any other statistical input
beside the expected cost of the measure (Sundberg, 2018).
This tool is an excel template to assess the impact of transport measures on high-level policy
objectives related to SUMP.
The tool takes into account the variety of perspectives of different stakeholders involved in transport
network development. Its strength is that it combines two commonly used approaches (CBA and
MCA) to evaluate all of a measure’s impacts (both quantitative and qualitative). Furthermore, it is
applicable to hard and soft measures from local to regional level projects.
Input is an initial set of planned or ongoing measures or projects identified by stakeholders to be
relevant for the transport network development. With the help of the methodology, an optimal package
of measures based on a defined problem and based on high-policy objectives can be identified.
The methodology was originally developed and tested in the Netherlands to assess the Dutch national
transport policies according to their contribution to the improvement of the accessibility of the national
road network. Since its inception, the methodology has been developed further for the application in
the 88 European urban nodes of the TEN-T core network.
The tool has been applied in four urban pilot nodes: Helsinki, Genoa, Rotterdam, and Ljubljana. For
this purpose, local transport planners met in order to assess in advance the likely impacts of potential
projects against their contribution to high-level objectives. As a result, projects have been ranked
according to their benefits.
The tool can either be used with realistic data or with estimated figures based on expert judgement.
Fact-based data obviously provides more robust results. Especially, monetary data about costs of
transport projects are helpful to have.
D1.1 Review of new forms of mobility, freight distribution and their business models; gaps identification in KPIs and SUMPs
101
B3. Key Performance Indicators
B3.1 Introduction
Key Performance Indicators (KPIs), are generally a set of quantitative measures or statistics used to
systematically assess the progress in achieving sustainable mobility goals in urban areas. They are
being used by cities in order to evaluate the current situation, understand the natural evolution of
sustainable mobility, and to (ex-ante or ex-post) evaluate the impact of selected solutions. Their main
role is to determine the level of cities’ mobility and its impacts, which is also affected by urban
structure, economic relations, geographical location, and historical conditions, and can be a great tool
for comparisons between cities.
The common development and use of a methodically sound, practically feasible and harmonized
indicator set on sustainable urban mobility is fundamental for European urban areas in order to
analyse progress towards their goals and policy objectives, as well as to identify deficiency areas
where additional action may be required. Moreover, urban areas need a system of indicators that are
widely accepted and used in Europe, irrespective of city size and characteristics of the mobility
systems. This important challenge needs a strong direct involvement of urban areas and the provision
of technical support on the appraisal and data gathering for such indicators.
B3.2 Choosing indicators for SUMPs
Monitoring and Evaluation (M&E) activities deliver data about the progress of the planning process
and the impact of policy measures and thus are carried out before, during, and after implementation
of intervention measures. They provide information to planners and decision makers that allow a
timely identification of problems, potential successes or need for readjustment of a SUMP and its
measures.
M&E activities start with setting up a Monitoring and Evaluation Plan that describes the current and
baseline situation, planning objectives, intended activities, responsibilities and processes. A key part
of this plan for a SUMP is the definition of indicators.
The choice of indicators represents an essential step in order to achieve a cost-effective M&E process
within a SUMP. A systematic approach to indicators selection helps to identify core indicators
reflecting the SUMPs objectives as well as supporting indicators for an in-depth analysis of
development of impacts and implementation progress. This indicators selection process should
involve other institutions and stakeholders of the SUMP.
In the indicators selection process, a series of principles should be followed:
Planners should aim to use standard indicators that are already well defined and where there
is existing knowledge on how to measure and analyse them. This enables cities benchmarking
against other cities or comparison to national/international statistics.
Indicators need to be easily understandable for stakeholders and decision makers.
There needs to be a clear definition of each indicator, how data is measured, the indicator
calculated from the data and how often it will be measured.
For each indicator, a baseline value needs to be established, i.e. a starting value and
expectation of development without SUMP related interventions.
The reporting format for indicators needs to be decided.
Target values for indicators for the main objectives need to be set.

D1.1 Review of new forms of mobility, freight distribution and their business models; gaps identification in KPIs and SUMPs
102
Specific indicator needs might arise from the requirements to use a particular assessment
methodology, e.g. a cost-benefit analysis for major interventions.
The selection needs to take into account available data sources and resources for collection of
new data.
Indicators should follow a SMART (specific, measurable, achievable, relevant, time-bound)
methodology that will allow cities to perform a standardized evaluation of their mobility system.
B3.3 Indicator categories
Indicators can be divided into the following categories:
Outcome indicators: they measure the actual impacts for the SUMP objectives and reflect
resulting changes in them (e.g. delays per person km to measure economic benefits or
greenhouse gas emissions for climate impacts). It is important to identify outcome indicators
for every chosen SUMP’s objective.
Intermediate outcome indicators: they describe changes in the transport system and can be
related to the success of strategies (e.g. modal shares if the strategy is to shift to sustainable
modes). This category includes indicators for measuring the system performance of new
transport technologies e.g. for traffic management or public transport operations which are
introduced as part of the SUMP. These indicators should be used on their own but can help
explain how the transport system is operating.
Output Indicators: they measure the extent to which policy instruments have been
implemented and services improved (e.g. km of bus lanes implemented). Transport activity
and output indicators are also required to understand why certain outcomes have been
achieved and what could be done further if a situation needs improving
Input indicators: they provide information on the amount of resources required for delivering
the plan, including cost. These indicators should be included to provide transparency on the
plan implementation and allow an evaluation of the resource effectiveness.
Contextual indicators: they provide information on external developments that have an
influence on the successful implementation of SUMPs, e.g. external economic developments
or national policy developments.
Furthermore, indicators are usually grouped depending on the area of interest and objectives they are
related, e.g. safety, land-use and infrastructure, environment, regional economy, etc.
B3.4 Examples of indicators to measure sustainable mobility in urban areas
Since their first establishment in 1992 by the United Nations Conference on Environment and
Development, where countries and organizations were asked to develop indicators systems in order
to monitor the progress towards sustainable development, sustainability indicators have been
increasingly used by international organizations, national or local authorities, and other researchers
within the framework of relevant studies and research programs. In 1993, the Organization for
Economic Co-operation and Development (OECD) presented a core set of indicators for reviewing
environmental performance (OECD, 1993) and since then has contributed to the process of selecting
and constructing indicators published in numerous reports (e.g. “Indicators for the integration of
environmental concerns into transport policies” (OECD, 1999), “Towards sustainable development –
indicators to measure progress” 2000 (OECD, 2000), and others).

D1.1 Review of new forms of mobility, freight distribution and their business models; gaps identification in KPIs and SUMPs
103
Over the years, several transport related initiatives have been taken to identify representative
measures of significant trends, problems and progresses toward sustainability. In 1999, the United
States Environmental Protection Agency published a document called “Indicators of the
environmental impacts of transportation” aiming at the definition of an assessment framework for the
impacts of transport system’s operations on the environment (US EPA, 1999). Since 1999, each year,
the European Environmental Agency publishes the “Transport and environment report mechanism
(TERM)” annual report, which includes a set of sustainable mobility indicators (EEA, 2014). In 2003,
the Canadian Centre for Sustainable Transportation suggested a compact set of 14 sustainable
mobility indicators categorized into 7 framework topics (Litman, T.A., 2003), while the Victoria
Transport Policy Institute promoted to a considerable extent of research referring to the sustainable
urban mobility indicators through reports and papers (Litman, T.A., Burwell, D., 2006), (Litman, T.A.,
2007). In 2004 and 2007, the World Bank developed the systems of “Performance and impact
indicators for transport” (World Bank, 2004) and “Headline indicators for measurement of transport
results” (World Bank, 2007). Between 2001 and 2009 the World Business Council for Sustainable
Development (WBCSD) encouraged the use of indicators through its reports (WBCSD, 2001),
(WBCSD, 2004), (WBCSD, 2009). Furthermore, in 2015 the WBCSD carried out a project
“Sustainable Mobility Project 2” with the aim to develop a comprehensive set of sustainable mobility
indicators for cities spanning four dimensions of sustainable mobility: global environment, quality of
life in the city, economic success and mobility system performance. The research resulted in a set of
22 indicators, valid for cities at any stage of economic development.
Finally, building on the WBCSD experience, a project approved by European Commission’s
Directorate-General for Mobility and Transport has been launched in late 2017 to provide technical
support for the identification and the collection of a set of sustainable urban mobility indicators in
about 50 European large and small urban areas: the SUMI (Sustainable Urban Mobility Indicators)
project. Based on the analysis of the discrepancies between the WBCSD data requirements and
current practices of data collection in the EU (e.g. data sources, complexity of definitions, surveys),
during the SUMI project the set of indicators was reviewed vis-à-vis the practical applicability in the
target urban areas in Europe. As an example, the Table 31 below reports the final list of the indicators
chosen within the SUMI project.
So far, there is a jeopardized situation in Europe on this topic, since a common mandatory approach
is not defined and each country applies different rules. As an example, in Italy and Sweden there are
different sets of mandatory and recommended Key Performance Indicators to be considered when the
SUMPs are defined, while in United Kingdom the KPIs can be decided case by case; in other
countries, such as Romania, the set of mandatory indicators has not been defined yet but the cities,
together with the Ministry of Transport, are currently working on it.
In this regard, it is necessary to mention that the SUMI project is still ongoing. However, the gained
experience in collecting data might suggest the necessity to further simplify these indicators to make
them more applicable considering the existing differences among different countries and even among
different cities of the same country.

D1.1 Review of new forms of mobility, freight distribution and their business models; gaps identification in KPIs and SUMPs
104
Table 31. Key performance indicators of the SUMI project
Area / goal Component Indicator Quality of life, equality
Affordability of public transport for the poorest group
Share of the poorest quartile of the population's household budget required to hold public transport (PT) passes (unlimited monthly travel or equivalent) in the urban area of residence
Quality of life, equality
Accessibility for mobility-impaired groups
This indicator determines the accessibility to persons with reduced mobility. Such vulnerability groups include those with visual and audial impairments and those with physical restrictions, such as pregnant women, users of wheelchairs and mobility devices, the elderly, parents and caregivers using buggies, and people with temporary injuries
Environment Air pollutant emissions
Air pollutant emissions of all passenger and freight transport modes (exhaust and non-exhaust for PM2.5) in the urban area
Quality of life Noise hindrance Hindrance of population by noise generated through urban transport
Quality of life Fatalities Yearly fatalities by all transport accidents in the urban area
Quality of life Access to mobility services
Share of population with appropriate access to mobility services (public transport)
Quality of life Quality of public spaces
The perceived satisfaction of green and non-green public spaces
Economy, Quality of life
Urban functional diversity
Functional diversity refers to a mix of land-uses in an area, creating a mix of mutual interrelated activities (e.g. average presence of 10 land uses in grids of 1 km by 1 km related to daily activities other than work)
Quality of life Commuting travel time
The commuting time to and from work or an educational establishment
Economy Economic opportunity
Degree of transport accessibility to the job market and education system
Economy Net public finance Net result of government and other public authorities’ revenues and expenditures related to city transport
Environment Mobility space usage
Proportion of land use, taken by all city transport modes, including direct and indirect uses
Environment Emissions of greenhouse gases (GHG)
Well-to-wheels GHG emissions by all urban area passenger and freight transport modes
Environment, Quality of life
Congestion and delays
Delays in road traffic and in public transport during peak hours compared to off peak travel (private road traffic) and optimal public transport travel time (public transport)
Environment Energy efficiency Total energy use by urban transport per passenger km and tonne km (annual average over all modes)
Environment, Quality of life
Opportunity for active mobility
Infrastructure for active mobility, namely walking and cycling
Mobility system performance
Multimodal integration
An interchange is any place where a traveller can switch from one mode of travel to another, with a minimum/ reasonable amount of walking or waiting. The more modes available at an interchange, the higher the level of multimodal integration
Quality of life, Mobility system performance
Satisfaction with public transport
The perceived satisfaction of using public transport
Quality of life, Mobility system performance
Security Perceived risk of crime and passenger security in urban transport
Quality of life Traffic safety active modes
Fatalities of active modes users in traffic accidents in the city in relation to their exposure to traffic
Mobility system performance
Modal split For passenger: according to passenger kilometres, vehicle-km or trips For freight: according to goods vehicles-km or tonnes kilometres

D1.1 Review of new forms of mobility, freight distribution and their business models; gaps identification in KPIs and SUMPs
105
B3.5 Key performance indicators in the HARMONY project
Within the HARMONY project, the development of the modelling suite will allow the estimate of
several outputs, providing quantifiable evidence and KPIs for the metropolitan areas. The KPIs are
expected to quantify the impacts of planning scenarios related to several topics, e.g. on public space,
transport deserts and poverty, accessibility, traffic congestion, energy demand, air quality, noise etc.
for several time-horizons from the base year up to the year 2050.
The following table provides an example of the KPIs which could be estimated with the HARMONY
model suite; nevertheless, a more detailed picture of the indicators will be available once the design
of the modelling suite is completed.
Table 32. Indicative KPIs that could be estimated within HARMONY model suite
Land-use & Infrastructure
Environment Regional Economy Inclusive Communities
Change in inter/intraregional transport infrastructure capacity
Noise levels (e.g. persons exposed to high noise levels)
Change in population density
Transport affordability/poverty
Mode sharing infrastructure/public space
Carbon intensity (CO2 , NOX emissions)
% change in number of VAT registered business
Transit accessibility /desserts
Increase of risk-mitigation measures (resilience)
VMT per mode Investments attracted in EUR
Measures of well-being
The KPIs provided by the HARMONY modelling suite will cover a wide range of areas and objectives,
such as:
innovative transport technologies and business models,
competitiveness, sustainability, social cohesion, equity, and citizen well-being,
urban/rural development balancing,
environmental health and accessibility to the centre of metropolitan areas,
regional economic growth,
impacts and interactions between metropolitan regions and TEN-T corridors ,
congestion, energy, emissions of air pollutants, carbon footprint, noise land use development,
coordination between multimodal infrastructure mobility and spatial economic development,
including reduction of inequalities,
increased inter modality and higher resilience of the transport system.

D1.1 Review of new forms of mobility, freight distribution and their business models; gaps identification in KPIs and SUMPs
106
B4. References
EEA (2014). Focusing on environmental pressures for long-distance transport. TERM 2014: Transport indicators tracking progress towards environmental targets in Europe. Luxembourg: Publication Office of the European Union.
European Commission (2014). “Guide to Cost-Benefit Analysis of Investment Projects. Economic appraisal tool for Cohesion Policy 2014-2020.” Regional and Urban Policy.
Durlin T. (2018). “The status of SUMPs in EU member states” CIVITAS 2020.
Guhnemann A. (2016). “Monitoring and Evaluation. Assessing the impact of measures and evaluating mobility planning processes.” European Platform on Sustainable Urban Mobility Plans. European Commission.
Litman, T.A. (2003). Reinventing Transportation. Exploring the Paradigm Shift Needed to Reconcile Transportation and Sustainability Objectives. Victoria Transport Policy Institute.
Litman, T.A., Burwell, D. (2006). Issues in sustainable transportation. International Journal of Global Environmental Issues, 6(4), 331-347.
Litman, T.A. (2007). Developing Indicators for Comprehensive and Sustainable Transport Planning. Transportation Research Record 2017, 10-15.
Litman, T.A. (2009). Sustainable transportation indicator data quality and availability. Victoria Transport Policy Institute.
May A. (2016). “Measure Selection. Selecting the most effective packages of measures for Sustainable Urban Mobility Plans”. European Platform on Sustainable Urban Mobility Plans. European Commission
OECD (1993). OECD core set of indicators for environmental performance reviews. OECD Environment Monographs No. 83. Paris: OECD.
OECD (1999). Indicators for the Integration of Environmental Concerns into Transport Policies. Working Group on the State of the Environment.
OECD (2000). Towards Sustainable Development - Indicators to measure progress. Proceedings of the OECD Rome Conference. Paris: OECD.
Rupprecht et al. (2019). “Guidelines for Developing and Implementing a Sustainable Urban Mobility Plan (Second Edition).” European Platform on Sustainable Urban Mobility Plans. European Commission
SUMI (2019). “Harmonisation Guideline”. Technical support related to sustainable urban mobility indicators (SUMI).
Sundberg R. (2018). “Manual on the integration of measures and measure packages in a SUMP”. CIVITAS 2020.
Tafidis P., et al. (2017). “Sustainable urban mobility indicators: policy versus practice in the case of Greek cities”. Transportation Research Procedia 24 (2017) 304-312
Tundys B. (2015). “Key performance indicators as element of assessment and towards the development of sustainable mobility”. ICTS 2015
US EPA (1999). Indicators of the Environmental Impacts of Transportation - Highway, Rail, Aviation and Maritime Transport.
WBCSD (2001). Mobility 2001 – World Mobility at the End of the Twentieth Century and Its Sustainability. Sustainable Mobility Working Group.

D1.1 Review of new forms of mobility, freight distribution and their business models; gaps identification in KPIs and SUMPs
107
WBCSD (2004). Mobility 2030: Meeting the Challenges to Sustainability. The Sustainable Mobility Project, Full Report.
WBCSD (2009). Mobility for Development. Report of the mobility for Development project.
WBCSD (2015). “Methodology and indicator calculation for sustainable urban mobility” World Business Council for Sustainable Development. Sustainable Mobility Project 2.0
World Bank (2004). Performance and Impact Indicators for Transport.
World Bank (2007). Headline Indicators: Transport Results Measurement.
World Bank (2014). World Development Indicators. Washington, DC: World Bank.

D1.1 Review of new forms of mobility, freight distribution and their business models; gaps identification in KPIs and SUMPs
108
SECTION C: SUMPs AND SPATIAL AND TRANSPORT STRATEGIES OF THE HARMONY METROPOLITAN AREAS
C1. Introduction Following the overview on SUMP and appraisal methods provided in Section B, this section provides
a description of the status of spatial and transport strategies and SUMPs of the six HARMONY areas:
Rotterdam, Oxfordshire county, Turin, Athens, Trikala and Upper Silesian-Zaglebe.
The picture resulting from the analysis of the involved metropolitan areas is quite heterogeneous: in
some cases a SUMP has been developed and it is planned to be updated or integrated with action
programmes for specific aspects, in other cases it is under definition for the first time, while in some
others similar planning documents (sharing most of the basic principles) are being developed.
In the following chapters, for each case study first a description of each metropolitan area is provided,
then an overview of the status of urban planning is reported, and finally the focus is on the key
elements of the SUMP or the similar planning document (depending case by case on the
development stage).
C2. Rotterdam
C2.1. The metropolitan area
Rotterdam is located in the province of South Holland in the Netherlands, at the mouth of the Nieuve
Maas channel leading into the Rhine-Meuse-Scheldt delta at the North Sea. It is a port city, the
second-largest after Amsterdam, with an history of about 900 years. Rotterdam is the largest port in
Europe, being a major logistic and economic centre and creating direct and indirect employment for
some 385,000 people. The Rhine, Meuse and Scheldt give waterway access into the heart of
Western Europe, including the highly industrialized Ruhr. The extensive distribution system including
rail, roads, and waterways have earned Rotterdam the nicknames "Gateway to Europe" and
"Gateway to the World".
Figure 21: Land-use map of greater Rotterdam (on the left) and location of the municipality of Rotterdam (on the right)
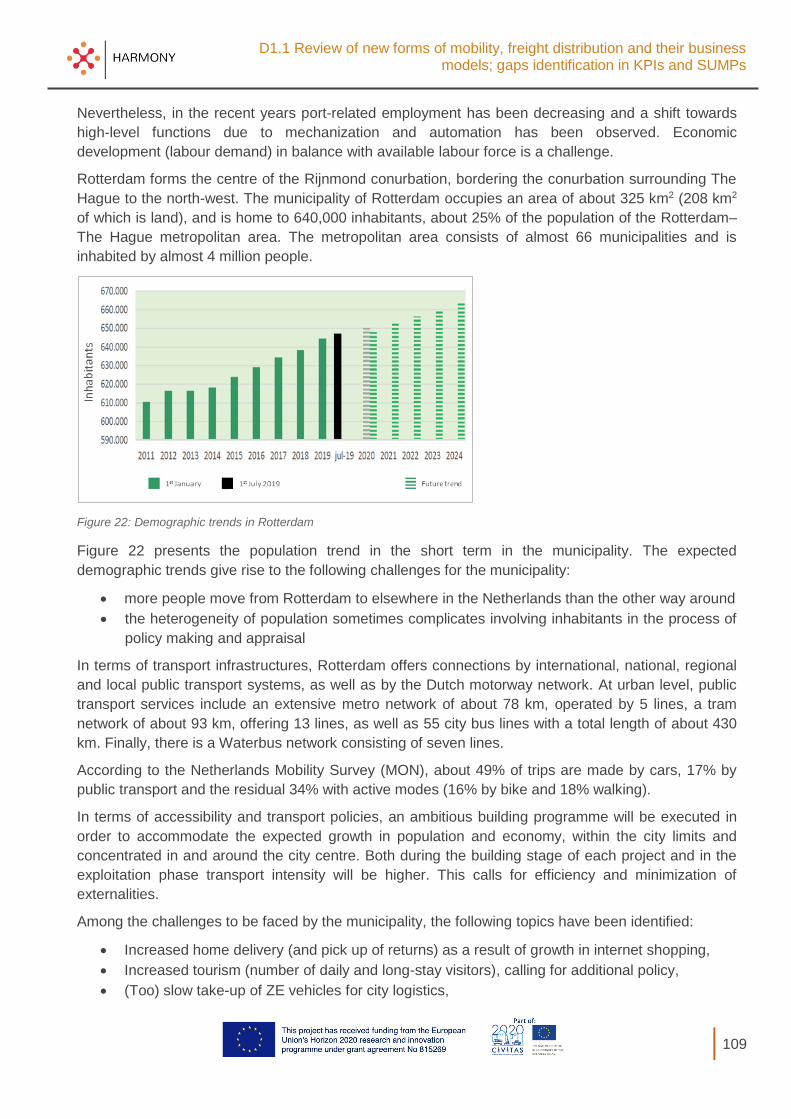
D1.1 Review of new forms of mobility, freight distribution and their business models; gaps identification in KPIs and SUMPs
109
Nevertheless, in the recent years port-related employment has been decreasing and a shift towards
high-level functions due to mechanization and automation has been observed. Economic
development (labour demand) in balance with available labour force is a challenge.
Rotterdam forms the centre of the Rijnmond conurbation, bordering the conurbation surrounding The
Hague to the north-west. The municipality of Rotterdam occupies an area of about 325 km2 (208 km2
of which is land), and is home to 640,000 inhabitants, about 25% of the population of the Rotterdam–
The Hague metropolitan area. The metropolitan area consists of almost 66 municipalities and is
inhabited by almost 4 million people.
Figure 22: Demographic trends in Rotterdam
Figure 22 presents the population trend in the short term in the municipality. The expected
demographic trends give rise to the following challenges for the municipality:
more people move from Rotterdam to elsewhere in the Netherlands than the other way around
the heterogeneity of population sometimes complicates involving inhabitants in the process of
policy making and appraisal
In terms of transport infrastructures, Rotterdam offers connections by international, national, regional
and local public transport systems, as well as by the Dutch motorway network. At urban level, public
transport services include an extensive metro network of about 78 km, operated by 5 lines, a tram
network of about 93 km, offering 13 lines, as well as 55 city bus lines with a total length of about 430
km. Finally, there is a Waterbus network consisting of seven lines.
According to the Netherlands Mobility Survey (MON), about 49% of trips are made by cars, 17% by
public transport and the residual 34% with active modes (16% by bike and 18% walking).
In terms of accessibility and transport policies, an ambitious building programme will be executed in
order to accommodate the expected growth in population and economy, within the city limits and
concentrated in and around the city centre. Both during the building stage of each project and in the
exploitation phase transport intensity will be higher. This calls for efficiency and minimization of
externalities.
Among the challenges to be faced by the municipality, the following topics have been identified:
Increased home delivery (and pick up of returns) as a result of growth in internet shopping,
Increased tourism (number of daily and long-stay visitors), calling for additional policy,
(Too) slow take-up of ZE vehicles for city logistics,
D1.1 Review of new forms of mobility, freight distribution and their business models; gaps identification in KPIs and SUMPs
110
Sustainable energy supply for the situation with ZE delivery vehicles.
C2.2. Overview of urban planning
With reference to urban planning, the general framework (Omgevingsvisie) for regulating land use,
municipal scale, complemented by provincial and national framework for higher order aspects is
currently being drafted.
At metropolitan level, the Roadmap Next Economy strategy and action programme11 has been
approved in 2016 and identifies five transition paths which are required to shape the new economy of
the metropolitan region Rotterdam-The Hague. The goals relate to smart digital economy, Smart
Energy, Circular Economy, the transition to a new economy and inclusive society.
Specifically in the field of freight transport and city logistics, a policy document has recently (July
2019) been officially established, describing the roadmap to a Zero Emission City Logistics zoned
(ZECL zone) around the city centre by 2025 (Stappenplan ZES Roadmap to ZE City Logistics12). The
development and analysis of flanking policy required to successfully implement this ZECL zone is an
important driver for the improvement of the current traffic model. The ZE zone for City Logistics in the
city centre is to be announced in early 2020 and enforced in 2025.
The cycling plan (Fietskoers13) has been approved in 2018, describing strategies and policies up to
2025. The public transport plan (OV Visie14) has been approved also in 2018.
In 2017, the SUMP at city level was approved (Stedelijk VerkeersPlan Rotterdam15). It is aligned
with regional and national policies, while more detailed action programmes for specific aspects are
being developed (cycling, pedestrians, public transport). Intermediate adaptation of the SUMP will
most certainly take place. Also the development of a working programme for various aspects, freight
transport among them, is foreseen. Development of a more sophisticated simulation tool for analysis
is part of that process, in which HARMONY results will take their place as far as automated transport
is concerned.
C2.3. Key elements of the SUMP C2.3.1. The planning process
In Rotterdam, the current SUMP has been developed starting from a dialogue with the departments of
public health and economics. Ambitions in these fields have been translated into implications for the
urban traffic system. To these, requirements and ambitions from the mobility department have been
added (e.g. traffic safety and efficiency). Of course there is a close relationship between the urban
system and the regional and national system, both in terms of economy and traffic and transport
infrastructure.
Four scenarios have been analysed and compared with respect to the degree they can accommodate
the development ambitions. A traffic modelling system has been applied to assess these degrees.
11 https://mrdh.nl/system/files/projectbestanden/engels/Roadmap%20Next%20Economy%20in%20brief.pdf 12 https://www.rotterdam.nl/wonen-leven/stappenplan-zero-emissie/Stappenplan-ZES.pdf 13 https://www.rotterdam.nl/wonen-leven/fietsstad/Fietskoers-2025.pdf 14 https://mrdh.nl/system/files/vergaderstukken_/6.2.%20bijlage%202%20Openbaar%20vervoer%20als%20drager%20van%20de%20stad_OV-visie%20Rotterdam%202040_definitieveversie%20januari%202018.03%28klein%29_0.pdf 15 www.rotterdam.nl/wonen-leven/stedelijk-verkeersplan/Stedelijk-Verkeersplan-Rotterdam-20170123.pdf
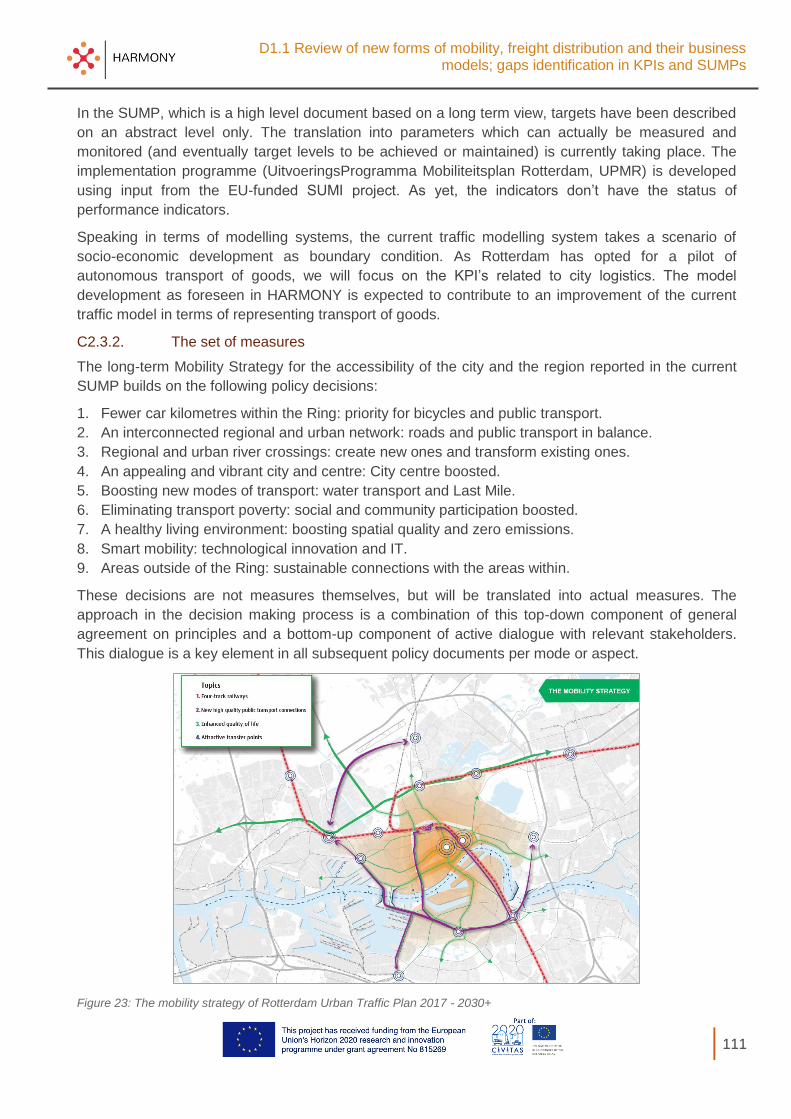
D1.1 Review of new forms of mobility, freight distribution and their business models; gaps identification in KPIs and SUMPs
111
In the SUMP, which is a high level document based on a long term view, targets have been described
on an abstract level only. The translation into parameters which can actually be measured and
monitored (and eventually target levels to be achieved or maintained) is currently taking place. The
implementation programme (UitvoeringsProgramma Mobiliteitsplan Rotterdam, UPMR) is developed
using input from the EU-funded SUMI project. As yet, the indicators don’t have the status of
performance indicators.
Speaking in terms of modelling systems, the current traffic modelling system takes a scenario of
socio-economic development as boundary condition. As Rotterdam has opted for a pilot of
autonomous transport of goods, we will focus on the KPI’s related to city logistics. The model
development as foreseen in HARMONY is expected to contribute to an improvement of the current
traffic model in terms of representing transport of goods.
C2.3.2. The set of measures
The long-term Mobility Strategy for the accessibility of the city and the region reported in the current
SUMP builds on the following policy decisions:
1. Fewer car kilometres within the Ring: priority for bicycles and public transport.
2. An interconnected regional and urban network: roads and public transport in balance.
3. Regional and urban river crossings: create new ones and transform existing ones.
4. An appealing and vibrant city and centre: City centre boosted.
5. Boosting new modes of transport: water transport and Last Mile.
6. Eliminating transport poverty: social and community participation boosted.
7. A healthy living environment: boosting spatial quality and zero emissions.
8. Smart mobility: technological innovation and IT.
9. Areas outside of the Ring: sustainable connections with the areas within.
These decisions are not measures themselves, but will be translated into actual measures. The
approach in the decision making process is a combination of this top-down component of general
agreement on principles and a bottom-up component of active dialogue with relevant stakeholders.
This dialogue is a key element in all subsequent policy documents per mode or aspect.
Figure 23: The mobility strategy of Rotterdam Urban Traffic Plan 2017 - 2030+

D1.1 Review of new forms of mobility, freight distribution and their business models; gaps identification in KPIs and SUMPs
112
C3. Oxfordshire county
C3.1. The metropolitan area
Oxfordshire is a county in South East England, covering an area of more than 2500 sq. km. It includes
parts of three Areas of Outstanding Natural Beauty. Oxfordshire is home to around 666,000 people,
an increase of over 10% in the past decade. The county is divided into five district council areas, with
a quarter of the county’s residents living in Oxford city. As well as the city of Oxford, other centres of
population are Banbury, Bicester, Kidlington and Chipping Norton to the north of Oxford; Carterton
and Witney to the west; Thame and Chinnor to the east; and Abingdon-on-Thames, Wantage, Didcot,
Wallingford and Henley-on-Thames to the south. It is home to nearly 30,000 businesses, providing
over 380,000 jobs.
It sits on the busy road and rail transport corridor between the south coast ports, the Midlands and the
north and enjoys easy links to London and West Midlands. However, it suffers a lack of connectivity to
and from the east, in particular to the high-value growth areas around Milton Keynes and Cambridge.
The county is the second more rural area at the UK’s South East, with a combination of urban (both
historic and modern), peri-urban, highways and rural locations.
Figure 24: Highway network in Oxfordshire in the morning peak in 2031 with no intervention (left) and the Oxford Green Belt (right)
Oxfordshire contains a green belt area that fully envelops the city of Oxford, and extends for some
miles to afford a protection to surrounding towns and villages from inappropriate development and
urban growth. Its border in the east extends to the Buckinghamshire county boundary, while part of its
southern border is shared with the North Wessex Downs AONB. It was first drawn up in the 1950s,
and all the county's districts contain some portion of the belt.
Oxford’s unique character as a leading university city and a historic centre sets it apart from the rest
of the county, and attracts much more travel than most towns or cities of comparable size. Tourism,
business and academia are vital to the economy and 35% of the county’s jobs are in the city. Due to
the high number of jobs and the shortage and cost of housing in the city, more people commute to
Oxford from outside the city than are working residents.

D1.1 Review of new forms of mobility, freight distribution and their business models; gaps identification in KPIs and SUMPs
113
Car ownership and usage is high outside Oxford with 87% of households owing a car, compared to
only 67% in Oxford. There is a good network of bus/rail services linking the county’s main towns with
Oxford. Despite variable quality of bicycling networks within Oxford, around 25% of the residents
cycle to work; though the split is much lesser in other parts of the county. OCC is committed to
increase the active travel and public transport use at the county.
Planning authorities have assessed a need for 100,000 new homes to support 85,000 new jobs to
2031, a scenario that will provide a major challenge to Oxfordshire’s transport system which has
resulted in the Oxfordshire Growth deal, to be delivered by 2030. Interlinked with transport is the
challenges of public health, with the county’s overall prosperity masking health inequalities in areas of
deprivation, and a rising obesity rate, especially amongst the young. The potential impact of housing
and jobs growth on the county’s transport networks, considering committed transport infrastructure,
has been forecast using a strategic transport model. The model shows many junctions over capacity
in 2031, and severe delays on many routes, especially the A34, A40, A338 and A4074.
With these challenges, the primary focus of planning in Oxfordshire has been made with three over-
arching transport goals (as mentioned in the Local Transport Plan):
1. to support jobs and housing sustainable growth and economic vitality;
2. to reduce overall emissions, enhance air quality and support transition to a neutral carbon
economy;
3. to protect and enhance quality of life (including public health, safety and well-being)
inclusively.
These are consistent with the three overarching goals highlighted at the OCC corporate plan:
“Thriving People, Thriving Communities, Thriving Economy”.
C3.2. Overview of urban planning
The Local Transport Plan (LTP)16 consists of a set of planning documents that, when collated
together, can be termed as the Sustainable Urban Mobility Plans (SUMP) for Oxfordshire. This
consists of various sections:
Policy & Overall Strategy
Strategies for specific Transport Areas
Strategies for specific Transport Corridors (includes various district-level plans)
Science Transit Strategy, with focus on new mobility services. This was the first UK transport
policy to name Connected and Autonomous Vehicles (CAV) in the UK.
Other planning documents connected to land use, energy, infrastructure, connectivity, etc. are listed
below17:
The Digital Infrastructure Strategy (in draft, planned submission in 2020) is a strategy document to
lay out the county’s programme to change emphasis on Digital Infrastructure, underpinned by a
Digital Infrastructure Partnership comprising the County, city, and district councils.
The Oxon Energy Strategy (2019) is a strategy document that details the annual delivery plan that
sets out the projects necessary to meet our carbon targets and cost objectives.
16 http://www.oxfordshire.gov.uk/connectingoxfordshire 17 https://embed.kumu.io/c983aa9d528fe0cb3485208d81c38a38#smart-visions

D1.1 Review of new forms of mobility, freight distribution and their business models; gaps identification in KPIs and SUMPs
114
The Oxfordshire Plan 2050 (in draft, planned submission in 2021) is a document setting the
framework for future decision making on big issues like development, infrastructure and place-
making. The Plan for 2050 will be aspirational and use the opportunity of growth as a positive to
improve the quality of life for everyone.
The Oxfordshire Infrastructure Strategy (OXIS, 2017) has been prepared on behalf of the
Oxfordshire Growth Board to provide a view of emerging development and infrastructure
requirements to support growth from 2016 to 2031 and beyond.
The Partnering for Prosperity - NIC Report (2017) is a planning document for the Cambridge-Milton
Keynes-Oxford arc, to establish long-term national and local infrastructure investments, along with
upgrading of public transport, integrating transport hubs and providing safe cycling infrastructure.
With respect to the SUMP, Oxfordshire is in the process of refreshing its Local Transport Plan, to
create the Local Transport and Connectivity Plan, to better reflect the growth agenda across the
county. This is currently in the consultation phase. Though the 2019 European Guidelines haven’t
been comprehensively followed, a lot of the underlying principles are the foundation of the LTP as
well. There is renewed focus on sustainable mobility, involvement with citizens and stakeholders,
defining a long-term vision and arranging for future monitoring and evaluation.
C3.3. Key elements of the SUMP C3.3.1. The planning process
The key elements in planning in Oxfordshire across all relevant domains is the focussed
compartmentalisation of different areas and goals, with a smooth interchange of ideas and information
across plans. Additionally, the planning frameworks are always linked or supplemented to national-
level strategies to enable seamless growth.
With reference to the planning process, the current iteration of the Local Transport Plan (LTP4)
focuses on challenges from 2016 to 2031. Oxfordshire is in the process of beginning consultations for
its next Local Transport Plan (LTP5), with the stakeholder consultations beginning in October 2019,
and the expected delivery date of the SUMP being in the latter half of 2020.
In smaller towns, villages and rural areas, communities use Neighbourhood Plans to set priorities for
transport in keeping with the overarching goals of the LTP. This results in planning phases that occur
within the county throughout the year. There is a Neighbourhood Planning Toolkit which provides
guidance on this process. At a generic level, these are some of the steps followed during the planning
process:
1. determine strategies for different areas
2. focus on context, transport and aims using measures based on infrastructure, sustainability
3. geo-spatial visualisation for scheme delivery
4. identify types of funding sources
5. specify monitoring of measures
Since Oxfordshire occupies a key role in England’s Economic Heartland Hub, there is a coordinated
effort to align strategy and planning goals. This alliance plays a key role in increasing economic
output of the region, with collaborative working adopting a ‘one voice’ approach, especially in the area
of strategic transport investment.

D1.1 Review of new forms of mobility, freight distribution and their business models; gaps identification in KPIs and SUMPs
115
Figure 25: Oxford Neighbourhood Planning Toolkit
There is always a constant conversation between the various sectoral plans, as the formulation of
strategies in silos isn’t convincing at the participatory sphere. The different strategy documents
attempt to perform holistic studies to get a broader understanding of the policy and its effects. There
has also been an increased focus on integration transport and land-use planning.
Along the lines of the different focus areas of the LTP, relevant groups are formed to enable
stakeholder involvement and enhanced participation. For example, the Oxfordshire Active Travel
Steering Group focuses on public transport, walking and cycling related strategies. Consultations with
vulnerable road users (VRU) has helped highlight the importance of various soft and hard traffic
measures, along with identifying attitudinal factors. In case of new mobility technologies, consultation
feedback with stakeholders is performed to determine the level of acceptability.
In terms of monitoring and evaluation, there is a multi-phase planning process with gradations based
on increasing levels of data collection and resolution. These parameters influence the level of
monitoring and evaluation done as part of planning. For example, in the case of cycle scheme
assessment and prioritisation, many studies were performed on the target corridors to develop further
proposals for rapid transit, pedestrian and cycle improvements. Apart from using manual data to
monitor and evaluate measures, there is a new interest in using automated modelling solutions to
provide quicker and more robust results. The use of agent-based models could help identify pre and
post-facto scenarios, providing easier understanding of the effects of different strategies.
The collection of data is undertaken through various means, ranging from partnerships with private
data providers to commissioning manual count studies. Private data providers supply silos of data on
different mobility aspects such as: road traffic speeds, flow of vehicles, origin-destination matrices,
journey planner data, etc. Supplemental to manual counting, the installation of sensors and loops are
used to collect data on different modes. Surveys are used to identify trips and also validate the data
provided by automatic sensors.
Oxfordshire uses many modelling tools to help support planning of transportation policies. These
include demand modelling data from tools such as SATURN. Currently, we are moving towards new
Mobility Model that will be multi-modal and agent-based. Additional tools that are used in planning are
Aimsun for simulation, Zipabout for journey planning information.

D1.1 Review of new forms of mobility, freight distribution and their business models; gaps identification in KPIs and SUMPs
116
The following barriers can be identified in the planning process. Given the different areas (geographic
and domain) that the LTP covers, some of the planning methodologies that can be used are restricted
based on the local / national frameworks. Similarly, in the areas of new technologies that do not have
real-world data and minimal literature, identifying ways of providing the complete information to the
concerned stakeholders can be challenging. On the other side, since the overarching goals of the LTP
(and other planning policies) coincide with sustainable mobility, the ability for neighbourhoods to
formulate local plans that tackle critical problems and align with the County’s goals is strengthened
and constitute one of the drivers of the planning process.
C3.3.2. The set of measures
The Local Transport Plan, through its different strategy documents, details the measures for different
modes and areas. The different planning documents also provide an underlying foundation to support
various KPIs that can be extracted from all the planning processes and measures. The measures that
are primarily focussed on are listed in the following table.
Table 33: Action lines and measures of the SUMP of the Oxfordshire county
ACTION LINE ACTION
1. Public Transport Enhanced bus network connectivity, integration and access
Reliability of public transport
Development of rapid transit routes and services
Traffic management
Smart payment
Connecting Oxfordshire and outer region
Rural area connectivity
Creation of Bus Network Hierarchy
Phases of implementation
Quality Bus Partnership
2. Rail Very limited role on investments, but can influence decisions taken by organisations responsible (Department of Transport, Network Rail, Train Operating Companies, etc.)
Potential measures, like East-West Rail, Cowley line, Electrification, Improvement of stations
3. Active & Healthy Travel
Potential measures:
Door to Door”: multi-modal travel for longer trips
electric-bike sharing creation of cycle route categories to increase cycling network
cycle training to all primary school students
Soft measures
Data aggregation for greater insight
journey planning tools
4. Managing Transport Demand
Parking-based measures
5. Key Performance Indicators
Planning methodologies provide key metrics for future strategic model assessments. Examples: • Quality of Life measure • Labour Market Profile, O/D and demographic representation
• Housing Affordability ratios • Health and Wellbeing • Walkability • Air Quality/ Noise pollution
• Accuracy: confidence integral on model predictions • Digital Connectivity • Emission reduction
• Journey times • Maximise use of sustainable transport investment • Reduction in sole-occupancy car journeys
• Increase in public transport use and healthy modes of travel • Modal split • Road Safety • Vulnerable Road Users Audit
• Reduction of accidents and incidents
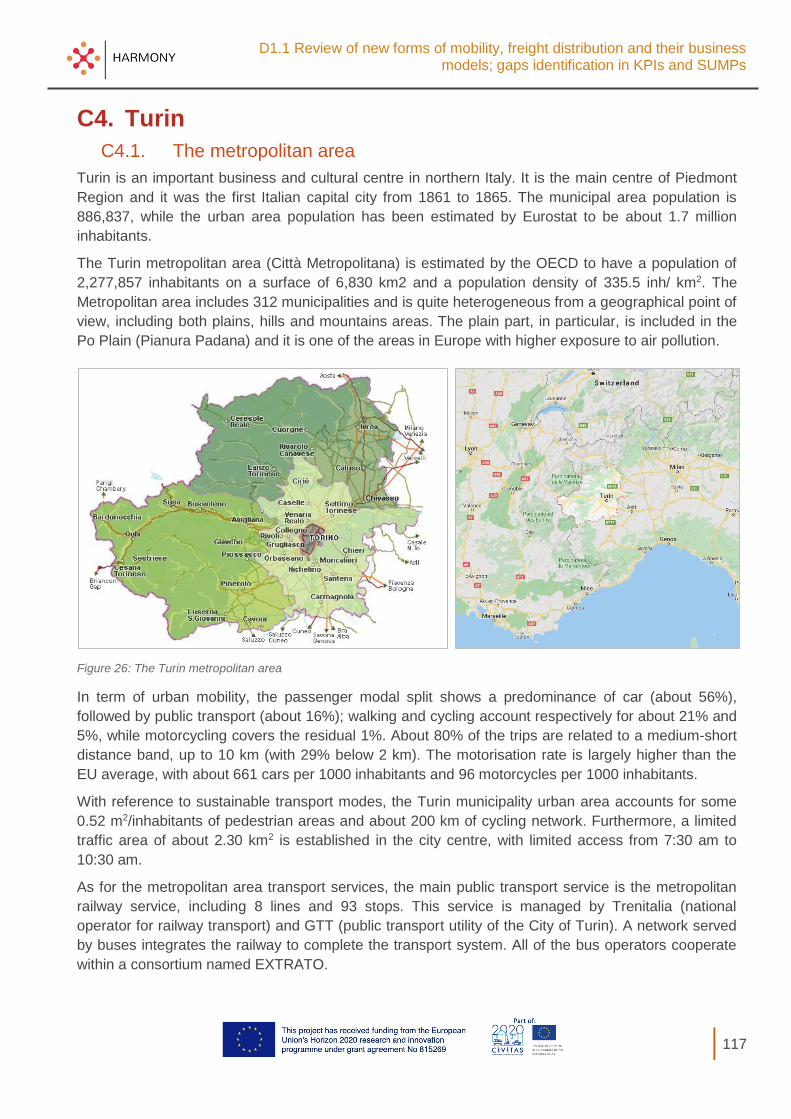
D1.1 Review of new forms of mobility, freight distribution and their business models; gaps identification in KPIs and SUMPs
117
C4. Turin
C4.1. The metropolitan area
Turin is an important business and cultural centre in northern Italy. It is the main centre of Piedmont
Region and it was the first Italian capital city from 1861 to 1865. The municipal area population is
886,837, while the urban area population has been estimated by Eurostat to be about 1.7 million
inhabitants.
The Turin metropolitan area (Città Metropolitana) is estimated by the OECD to have a population of
2,277,857 inhabitants on a surface of 6,830 km2 and a population density of 335.5 inh/ km2. The
Metropolitan area includes 312 municipalities and is quite heterogeneous from a geographical point of
view, including both plains, hills and mountains areas. The plain part, in particular, is included in the
Po Plain (Pianura Padana) and it is one of the areas in Europe with higher exposure to air pollution.
Figure 26: The Turin metropolitan area
In term of urban mobility, the passenger modal split shows a predominance of car (about 56%),
followed by public transport (about 16%); walking and cycling account respectively for about 21% and
5%, while motorcycling covers the residual 1%. About 80% of the trips are related to a medium-short
distance band, up to 10 km (with 29% below 2 km). The motorisation rate is largely higher than the
EU average, with about 661 cars per 1000 inhabitants and 96 motorcycles per 1000 inhabitants.
With reference to sustainable transport modes, the Turin municipality urban area accounts for some
0.52 m2/inhabitants of pedestrian areas and about 200 km of cycling network. Furthermore, a limited
traffic area of about 2.30 km2 is established in the city centre, with limited access from 7:30 am to
10:30 am.
As for the metropolitan area transport services, the main public transport service is the metropolitan
railway service, including 8 lines and 93 stops. This service is managed by Trenitalia (national
operator for railway transport) and GTT (public transport utility of the City of Turin). A network served
by buses integrates the railway to complete the transport system. All of the bus operators cooperate
within a consortium named EXTRATO.

D1.1 Review of new forms of mobility, freight distribution and their business models; gaps identification in KPIs and SUMPs
118
The transport system of the City of Turin is based on the following services: public transport (1 metro
line, 8 tramway lines, 90 bus lines), car sharing (3 operators, about 750 vehicles), taxi, bike sharing (2
operators, about 2000 bikes), scooter sharing (electric, about 100 scooters).
C4.2. Overview of urban planning
The City of Turin has adopted the SUMP (Sustainable Urban Mobility Plan) in 2010. The plan was
developed according to a strategic vision pursuing the coordination of all the mobility system
components, producing scenarios and updating them periodically. Turin has been the first city in Italy
to adopt a SUMP, replacing the previous planning document, i.e. the Urban Mobility Plan.
The Cycle Mobility Plan (Biciplan), which is part of the SUMP, has been approved in 2014 and aims
to increase bicycle use as a means of transport, both through technical solutions and through
promotional and cultural activities, addressed to reduce private motor vehicles use and their speed.
The SUMP has been developed in line with the 2009 European Commission "Action Plan on Urban
Mobility" (Communication to the Parliament, the Council, the European Economic and Social
Committee and the Committee of Regions, September 2009) and therefore it was conceived earlier
than the ELTIS guidelines.
According to the more recent Italian National Law dated 4 August 2017, the body in charge of drafting
the SUMP is the Metropolitan City and not the Municipality. The drafting work of the new SUMP of the
metropolitan area began in 2019 and should be concluded within 24 months. The City of Turin’s
SUMP will be incorporated and updated in the new SUMP of the Turin metropolitan area (including
about 312 municipalities).
C4.3. Key elements of the SUMP
C4.3.1. The planning process
As required by the Italian national law, the new plan needs to be developed consistently with the
renewed approach for urban mobility strategic planning, based on the document “Guidelines.
Developing and Implementing a Sustainable Urban Mobility Plan (ELTIS Guidelines)”, approved by
DG MOVE - DG for Mobility and Transport in 2014. It is consistent with the national documents
“Connettere l’Italia: fabbisogni e progetti di infrastrutture” and the National Economic and Financial
Plan for 2017 (DEF-Documento di Economia e Finanza 2017). There are four mandatory thematic
areas with their macro-goals for the plan, as listed below:
A. Effectiveness and efficiency of the mobility system
- A1. Enhance the local public transport
- A2. Modal rebalance of mobility
- A3. Congestion reduction
- A4. Improvement of the accessibility of people and goods
- A5. Improvement of the integration between transport and land use planning
- A6. Improvement of the road and urban space quality
B. Energy and environment sustainability
- B1. Reduction of the use of traditional fuels, different from alternative fuels
- B2. Improvement the air quality
- B3. Reduction of the noise pollution

D1.1 Review of new forms of mobility, freight distribution and their business models; gaps identification in KPIs and SUMPs
119
C. Road mobility safety
- C1. Reduction of road accident index
- C2. Relevant reduction of the number of road accidents with dead and injured people
- C3. Relevant reduction of the social costs deriving from road accidents
- C4. Relevant reduction of the social costs deriving from road accidents among people in need
D. Socio-economic sustainability
- D1. Improvement of the social inclusion
- D2. Improvement of the citizenship satisfaction
- D3. Increase of the employment index
- D4. Reduction of the mobility costs (related to the private vehicle use)
In terms of planning steps, the SUMP considers a one decade time period and it is updated at least
every five years. The steps needed to draft and approve the SUMP according to the national law are:
a) Definition of the inter-disciplinary and inter-institutional working group
b) Knowledge framework arrangement
c) Participatory process start
d) Definition of goals
e) Participatory creation of the plan scenario
f) Strategic environmental assessment (called VAS, Valutazione Ambientale Strategica)
g) Adoption of the Plan and consequent approval
h) Monitoring
This paragraph is focusing on the SUMP approved by the City of Turin in 2010, which referred only
the urban area of the municipality. The main goal of the current plan has been to change the urban
modal split in order to have 50% of the trips made with sustainable transport modes. The main
targets18 are listed below:
1. guarantee and improve accessibility to the area
2. guarantee and improve the people’s accessibility
3. improving the air quality and the urban environment
4. increase the public transport effectiveness
5. guarantee road and transport system efficiency and safety
6. governing mobility through innovative technologies and info mobility
7. define the governance system of the Plan
The plan was drawn up through the involvement of several local mobility players, in order to develop
coordination mechanisms among concerned authorities and departments: City of Turin Mobility
Division, 5T (in-house company of the city of Turin), Metropolitan City, Agenzia della Mobilità
Piemontese (regional mobility agency), Polytechnic of Turin.
Several stakeholders have been involved to guarantee a participatory approach, i.e. local bodies,
transport management companies and non-profit associations engaged in environmental issues.
A monitoring and evaluation plan has been defined, including a list of key performance indicators (see
also some example in Table 34).
18 http://geoportale.comune.torino.it/web/sites/default/files/mediafiles/pums_all1_linee_indirizzo_3.pdf

D1.1 Review of new forms of mobility, freight distribution and their business models; gaps identification in KPIs and SUMPs
120
The data collection has been performed by the City of Turin Infrastructure and mobility department,
while the use of modelling and other quantitative tools was not applied. With this respect, collection of
data from mobility companies has been the main barrier in the planning process.
C4.3.2. The set of measures
The Turin SUMP assumes seven action lines. For each line the plan has defined several key
measures, as listed in the following table.
Table 34: Action lines and measures of the SUMP of the Turin metropolitan area
ACTION LINE MEASURES
1. Improve the accessibility to the urban area
1.1. Enhance the public transport infrastructure
1.2. Facilitate inter-modality
1.3. Face the open issues of the road infrastructure
1.4. Encourage pedestrian and cycle mobility
1.5. Encourage pedestrian access in the historic city center
1.6. Meet new mobility demand
1.7. Guarantee mobility even to people-in-need
2. Guarantee and improve the people’s accessibility
2.1. Guarantee the accessibility to public transport vehicles
2.2. Facilitate the accessibility to public spaces
2.3. Guarantee the accessibility to disabled people
3.a. Improve the air quality 3.a.1. Reduce trips using private motor-vehicles
3.a.2 Supporting the penetration of green vehicles
3.a.3. Promote alternative sustainable mobility solutions
3.a.4. Promote pedestrian/cycle mobility
3.a.5 Optimising urban freight logistic
3.a.6. Reduce the environmental pollution due to the traffic
3.b. Improving quality of urban environment
3.b.1. Public space redevelopment
3.b.2. High standard of public space maintenance
3.b.3. Parking policies
3.b.4. Reducing noise pollution
4. Enhancing the use of public transport
4.1. Improving the effectiveness of public transport
4.2. Increasing the efficiency of public transport
4.3. Improving the security of public transport
5. Guarantee efficiency and safety of road network
5.1. Reorganizing the local viability of neighbourhoods
5.2. Reorganizing road signals
5.3. Improving road safety
6. Innovative technologies for mobility 6.1. Enlarging the telematics road traffic management network
6.2. Enlarging the telematics management of public transport
6.3. Improving mobility for vulnerable users
7. Government plan 7.1. Stakeholders participation
7.2. Communication
7.3. Monitoring

D1.1 Review of new forms of mobility, freight distribution and their business models; gaps identification in KPIs and SUMPs
121
C5. Athens
C5.1. The metropolitan area
Attika is an administrative region of Greece, that encompasses the entire metropolitan area of Athens.
Located on the eastern edge of Central Greece, Attika covers about 3,808 km2. Athens metropolitan
area consists of more than 60 municipalities and is inhabited by almost 4 million people, with the
Municipality of Athens being the most dense and compact. It is a metropolitan area with a dynamic
services sector and one of the major exporting gates of Greece.
Growth during the decade 2000-2009 in the region can be partly attributed to significant infrastructure
investments made for the 2004 Olympic Games, the influx of the Structural Funds, but also to
indigenous growth based mainly on consumption and at a lesser extent on investments triggered by
low interest rates after the accession to the Eurozone. During that period, infrastructure projects to
upgrade the transportation service level have been implemented, such as the development of the
metro network, tram network and suburban railway, the development of Attiki Odos (the major peri-
urban highway), the construction of the new Athens international airport.
Figure 27: Attica Region and the Athens Public Transport Network
The Athens Public Transport system is the largest public transport system in Greece. It consists of a
metro, a tram, an extensive bus and trolleybus network and suburban railway which provides easy
access to all major points of interest. The Athens metro is the backbone of the Athens Transport
System. It has three lines and provides direct connection of the City Center to the city's entry points
like the Airport of Athens, the Port of Piraeus and the Athens Railway Station. The Athens metro
extends from north to south and east to west, connecting the urban suburbs.
Athens' motorized transport (cars and powered two-wheeler) modal split stands at 53%, public
transport at 37%, and quite paradoxically little walking (8%) and almost no cycling (~2%). Every day
more than a million passengers travel and 2.5 million boardings are made using public transport.
D1.1 Review of new forms of mobility, freight distribution and their business models; gaps identification in KPIs and SUMPs
122
The economic recession of the last 10 years (2009-2019) has affected all factors of daily life and
transportation could not remain intact. Data shows that the crisis has effected transportation factors
considerably, for example 31% decrease in passenger volumes and 21% decrease in PT mileage
have been observed. Speeds have been reduced in all means to save money and daily trips with
public transport have been limited to the necessary.
Athens faces vital urban challenges concerning traffic congestion, traffic safety, pollution and citizen’s
health. Congestion appears in most primary and secondary roads, while illegal parking and other
public space violations are common in the central district.
In addition, Athens has significantly delayed development and implementation of a sustainable urban
mobility plan (SUMP). Encouragingly though, 2012 was the year that the 'Strategic Plan for
transportation and Sustainable Mobility in Athens' was firstly introduced as part of the Strategic plan
of Athens but it has not been implemented and in 2013 a bike sharing system in the Municipality of
Athens was strongly debated. Only 19 kms of the cycling network have been partially implemented in
the north suburbs.
In 2018, actions towards the development of SUMPS have been initiated in half of the municipalities
of the Attika region. These actions demand numerous transformations regarding the management of
public transport, the development of an extended cycling network, the systematic upgrade of public
spaces and the establishment of an integrated pedestrian network, with the most important being the
alteration in planning mentality and development of priorities.
C5.2. Overview of urban planning
Considering on-going developments at European level and of feedback obtained by recent similar
projects, the Government, Attica prefecture and OASA have undertaken several initiatives related to
spatial/land use and transport sustainability:
The main urban and regional planning laws have been recently revised (L.4269/14) in order to be
more flexible and responsive. A new Athens Master Plan (AMP) known as the Regulatory Plan of
Athens-Attica 2021 (L.4277/2014) recently updated the first one, enacted in 1985. The main
strategic objectives applied are: the promotion of the image of Athens as a Mediterranean capital with
emphasis on civilization, policies for social cohesion, reconstruction of the production structure,
restriction of unauthorized building, strengthening and redistribution of development resources,
establishment of green belts and ecological corridors, urban regeneration with recycling of land and
housing stock, vivification of centrality, strengthening of sustainable mobility, valorisation of the sea
front, and improvement of the system of spatial planning and governance (ORSA /YPEKA, 2011).
“Athens 2030,” the city’s Resilience Strategy (PRA). Released in July 2016, the PRA sets the
resilience baseline for Athens, introducing 5 discovery areas that the city had to explore more in order
to discover opportunities that would help it built its resilience. The discovery areas are: 1) Maximize
the dynamic of the Athenian neighbourhood, 2) Data driven and inclusive city, 3) Nature in the city:
Best possible use of urban resources, 4) Crisis within crisis, 5) Enhance social cohesion. One of the
main goals of the plan is to promote sustainable mobility and co-create public spaces, initiating
various schemes. Therefore, currently the municipality of Athens has started developing a strategic
plan for urban mobility. Funding for the Athens Sustainable Urban Mobility Plan is provided by the
“National Green fund.” In addition, the Urban Cycling plan is designed consistently with the Regional
Cycling plan, which is currently being implemented across several municipalities in the Attica
Region. The Region of Attica has allocated a budget of 10 million Euros for the construction of the
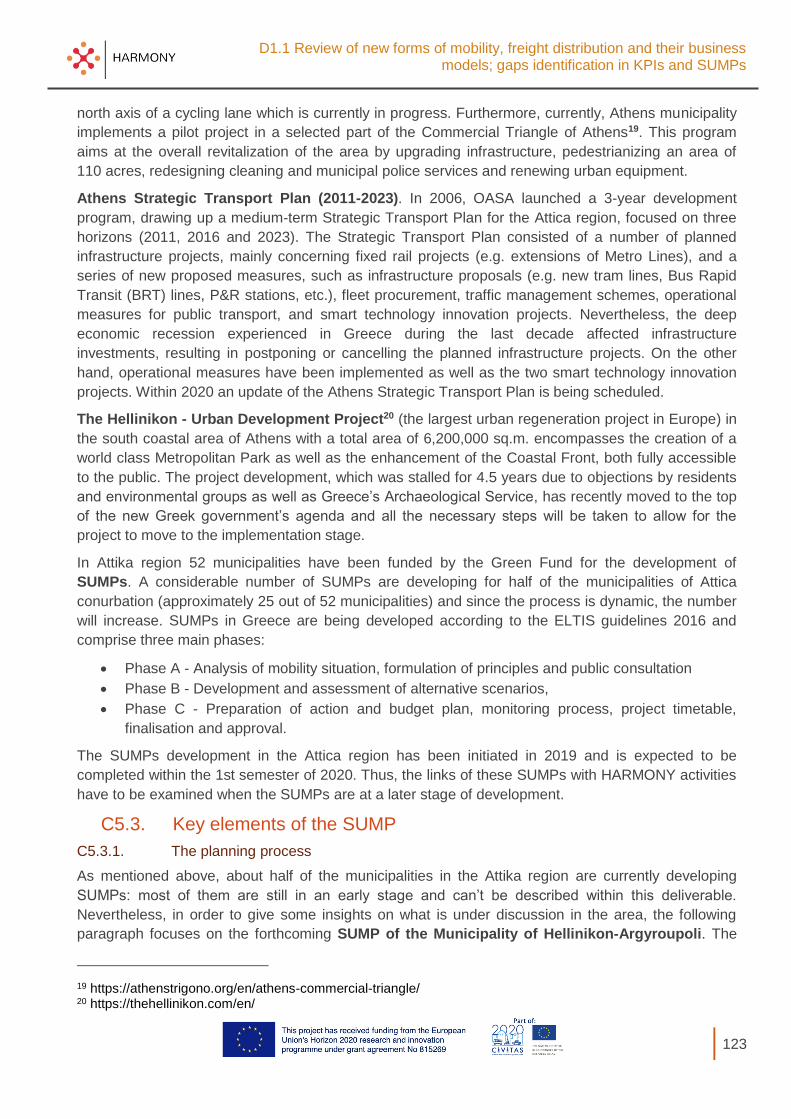
D1.1 Review of new forms of mobility, freight distribution and their business models; gaps identification in KPIs and SUMPs
123
north axis of a cycling lane which is currently in progress. Furthermore, currently, Athens municipality
implements a pilot project in a selected part of the Commercial Triangle of Athens19. This program
aims at the overall revitalization of the area by upgrading infrastructure, pedestrianizing an area of
110 acres, redesigning cleaning and municipal police services and renewing urban equipment.
Athens Strategic Transport Plan (2011-2023). In 2006, OASA launched a 3-year development
program, drawing up a medium-term Strategic Transport Plan for the Attica region, focused on three
horizons (2011, 2016 and 2023). The Strategic Transport Plan consisted of a number of planned
infrastructure projects, mainly concerning fixed rail projects (e.g. extensions of Metro Lines), and a
series of new proposed measures, such as infrastructure proposals (e.g. new tram lines, Bus Rapid
Transit (BRT) lines, P&R stations, etc.), fleet procurement, traffic management schemes, operational
measures for public transport, and smart technology innovation projects. Nevertheless, the deep
economic recession experienced in Greece during the last decade affected infrastructure
investments, resulting in postponing or cancelling the planned infrastructure projects. On the other
hand, operational measures have been implemented as well as the two smart technology innovation
projects. Within 2020 an update of the Athens Strategic Transport Plan is being scheduled.
The Hellinikon - Urban Development Project20 (the largest urban regeneration project in Europe) in
the south coastal area of Athens with a total area of 6,200,000 sq.m. encompasses the creation of a
world class Metropolitan Park as well as the enhancement of the Coastal Front, both fully accessible
to the public. The project development, which was stalled for 4.5 years due to objections by residents
and environmental groups as well as Greece’s Archaeological Service, has recently moved to the top
of the new Greek government’s agenda and all the necessary steps will be taken to allow for the
project to move to the implementation stage.
In Attika region 52 municipalities have been funded by the Green Fund for the development of
SUMPs. A considerable number of SUMPs are developing for half of the municipalities of Attica
conurbation (approximately 25 out of 52 municipalities) and since the process is dynamic, the number
will increase. SUMPs in Greece are being developed according to the ELTIS guidelines 2016 and
comprise three main phases:
Phase A - Analysis of mobility situation, formulation of principles and public consultation
Phase B - Development and assessment of alternative scenarios,
Phase C - Preparation of action and budget plan, monitoring process, project timetable,
finalisation and approval.
The SUMPs development in the Attica region has been initiated in 2019 and is expected to be
completed within the 1st semester of 2020. Thus, the links of these SUMPs with HARMONY activities
have to be examined when the SUMPs are at a later stage of development.
C5.3. Key elements of the SUMP
C5.3.1. The planning process
As mentioned above, about half of the municipalities in the Attika region are currently developing
SUMPs: most of them are still in an early stage and can’t be described within this deliverable.
Nevertheless, in order to give some insights on what is under discussion in the area, the following
paragraph focuses on the forthcoming SUMP of the Municipality of Hellinikon-Argyroupoli. The
19 https://athenstrigono.org/en/athens-commercial-triangle/ 20 https://thehellinikon.com/en/
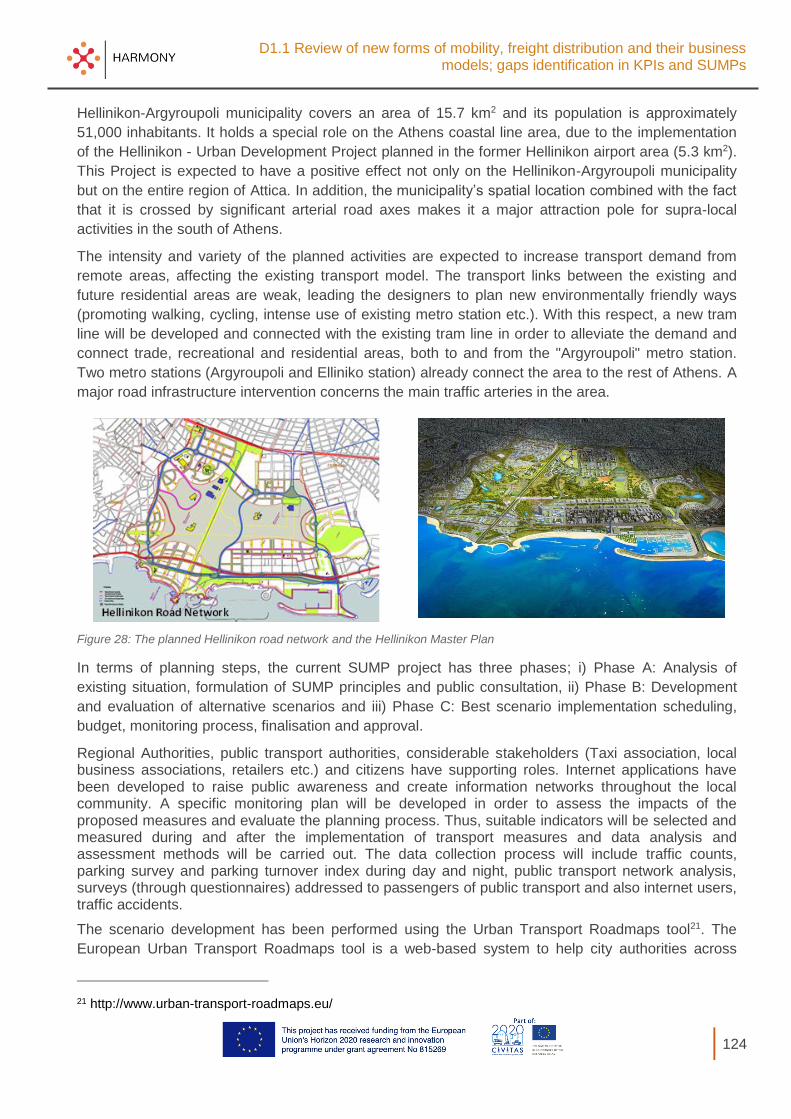
D1.1 Review of new forms of mobility, freight distribution and their business models; gaps identification in KPIs and SUMPs
124
Hellinikon-Argyroupoli municipality covers an area of 15.7 km2 and its population is approximately
51,000 inhabitants. It holds a special role on the Athens coastal line area, due to the implementation
of the Hellinikon - Urban Development Project planned in the former Hellinikon airport area (5.3 km2).
This Project is expected to have a positive effect not only on the Hellinikon-Argyroupoli municipality
but on the entire region of Attica. In addition, the municipality’s spatial location combined with the fact
that it is crossed by significant arterial road axes makes it a major attraction pole for supra-local
activities in the south of Athens.
The intensity and variety of the planned activities are expected to increase transport demand from
remote areas, affecting the existing transport model. The transport links between the existing and
future residential areas are weak, leading the designers to plan new environmentally friendly ways
(promoting walking, cycling, intense use of existing metro station etc.). With this respect, a new tram
line will be developed and connected with the existing tram line in order to alleviate the demand and
connect trade, recreational and residential areas, both to and from the "Argyroupoli" metro station.
Two metro stations (Argyroupoli and Elliniko station) already connect the area to the rest of Athens. A
major road infrastructure intervention concerns the main traffic arteries in the area.
Figure 28: The planned Hellinikon road network and the Hellinikon Master Plan
In terms of planning steps, the current SUMP project has three phases; i) Phase A: Analysis of
existing situation, formulation of SUMP principles and public consultation, ii) Phase B: Development
and evaluation of alternative scenarios and iii) Phase C: Best scenario implementation scheduling,
budget, monitoring process, finalisation and approval.
Regional Authorities, public transport authorities, considerable stakeholders (Taxi association, local business associations, retailers etc.) and citizens have supporting roles. Internet applications have been developed to raise public awareness and create information networks throughout the local community. A specific monitoring plan will be developed in order to assess the impacts of the proposed measures and evaluate the planning process. Thus, suitable indicators will be selected and measured during and after the implementation of transport measures and data analysis and assessment methods will be carried out. The data collection process will include traffic counts, parking survey and parking turnover index during day and night, public transport network analysis, surveys (through questionnaires) addressed to passengers of public transport and also internet users, traffic accidents.
The scenario development has been performed using the Urban Transport Roadmaps tool21. The
European Urban Transport Roadmaps tool is a web-based system to help city authorities across
21 http://www.urban-transport-roadmaps.eu/

D1.1 Review of new forms of mobility, freight distribution and their business models; gaps identification in KPIs and SUMPs
125
Europe to explore policies and measures and develop Sustainable Urban Mobility Plans. The tool
provides cities with the ability to identify, develop, screen and assess different transport policies and
measures. In particular, it helps cities to quickly and easily assess the likely costs and impacts of
measures that could help them improve the sustainability of their transport systems. Combinations of
different policy scenarios can be explored and the related impacts on the environment, safety,
mobility, the economy and the city’s transport system can be assessed. Three scenarios with a 15-
year horizon have been examined: do-nothing scenario, soft scenario and radical scenario.
C5.3.2. The set of measures
The proposed measures of the SUMP of the municipality of Helliniko- Argyroupoli are related to the
following transport areas: 1. Traffic Management 2. Parking Management 3. Redevelopment of at-
grade road intersections 4. Traffic Signaling system 5. Public Transport 6. Green Route Network 7.
Green spaces 8. Freight Transport.
Table 35: Selected examples of measures of the SUMP of the municipality of Helliniko- Argyroupoli
AREA MEASURE
1. Traffic Management
Implementation of traffic calming interventions on the collectors and local roads network
Introduction of new traffic lights signaling programs, enforcement of speed limits (50km/h)
2. Parking Management
Prevention of illegal parking by widening sidewalks and - where possible –bicycle lanes.
Planning measures to prevent / eliminate illegal parking - especially on sidewalks.
Implementation of a Parking Control System, using "smart systems" to serve primarily the residents and then visitors in commercial zones (i.e. maximum permitted parking time of 3 hours).
Construction and operation of additional off-street parking spaces
3. Redevelopment of road intersections
Road infrastructures projects (e.g. Undergrounding of Vouliagmeni Ave.)
Construction of roundabouts and improvement of intersections facing safety issues
4. Public Transport Redesign of Metro Line 2 regarding its extension to Varkiza
Construction of reserved bus lane on Vouliagmeni Ave. for both directions.
Operation of new Municipal Bus Lines and enhancement of the bus lines efficiency
Expansion and implementation of bus telematics system at all bus stops of the Municipality
5. Green Route Network
Installation of electric vehicle charging points in accessible public spaces
Pedestrianisation of roads, renovation of sidewalks and improving design parameters
Construction of pedestrian bridges in Vouliagmeni Ave., for safe pedestrian crossing
Development of an integrated Green Routes Network, connecting school complexes, sports facilities, the Hellinikon Development, neighbourhoods, etc.
Implementation of bicycle parking systems and storage facilities and of bicycle sharing system
6. Green spaces Restoration and utilization of green spaces. Construction of new city squares
7. Freight Transport Sustainable freight transport management. Establishment of urban freight distribution centers
The Radical Scenario includes all the soft scenario measures up to the 15-year horizon. Furthermore,
interventions are proposed in order to effectively reduce the use of private vehicles within the
municipality and to promote sustainable transport solutions. The Radical Scenario requires a change
of transport planning mentality and encourages a shift towards more sustainable modes (public
transport, cycling, walking). The main prerequisite for the SUMP is the construction of the relevant
infrastructure and the implementation of radical changes in the road network design and in urban
planning in general. The additional proposed measures of the radical scenario are:
Implementation of extended pedestrianisation scheme. Establishment of pedestrian areas
around Metro stations
One-way streets and traffic calming measures in arterial roads.
Reduce of speed limits to 30 km / h.
Conversion of the entire road network of the Municipality into a Green Road Network.
New Express Bus Line for connection to the northern suburbs.
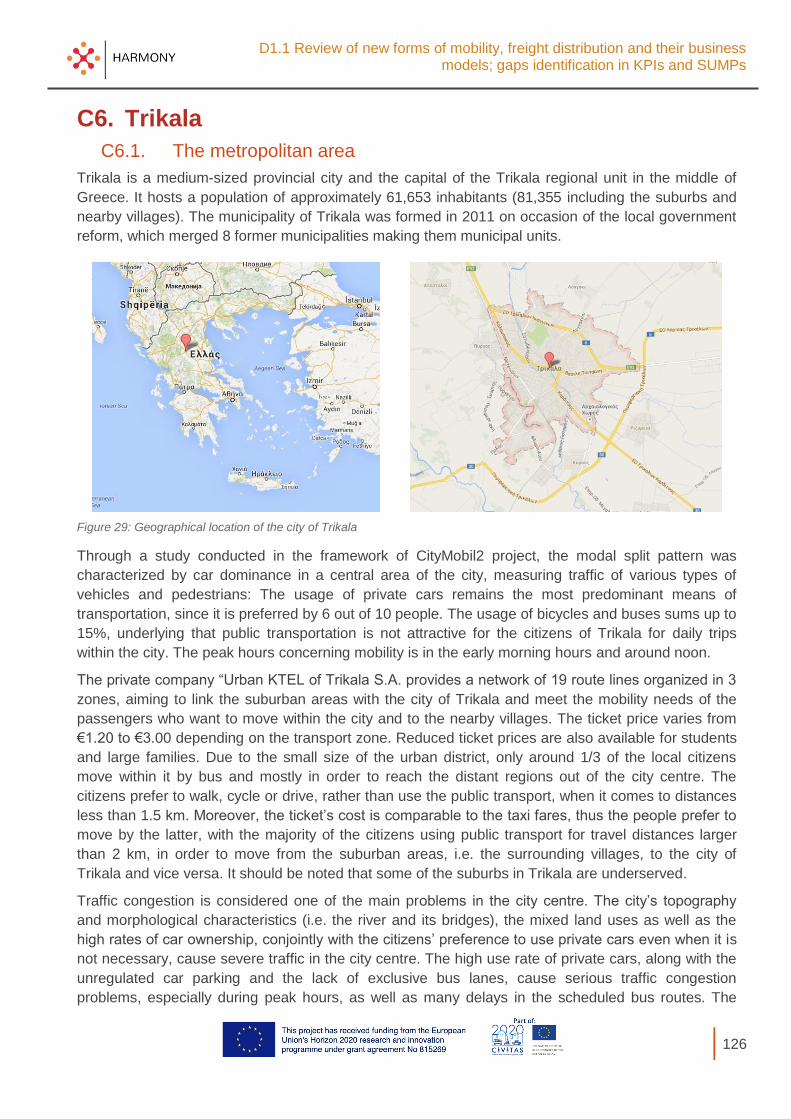
D1.1 Review of new forms of mobility, freight distribution and their business models; gaps identification in KPIs and SUMPs
126
C6. Trikala
C6.1. The metropolitan area
Trikala is a medium-sized provincial city and the capital of the Trikala regional unit in the middle of
Greece. It hosts a population of approximately 61,653 inhabitants (81,355 including the suburbs and
nearby villages). The municipality of Trikala was formed in 2011 on occasion of the local government
reform, which merged 8 former municipalities making them municipal units.
Figure 29: Geographical location of the city of Trikala
Through a study conducted in the framework of CityMobil2 project, the modal split pattern was
characterized by car dominance in a central area of the city, measuring traffic of various types of
vehicles and pedestrians: The usage of private cars remains the most predominant means of
transportation, since it is preferred by 6 out of 10 people. The usage of bicycles and buses sums up to
15%, underlying that public transportation is not attractive for the citizens of Trikala for daily trips
within the city. The peak hours concerning mobility is in the early morning hours and around noon.
The private company “Urban KTEL of Trikala S.A. provides a network of 19 route lines organized in 3
zones, aiming to link the suburban areas with the city of Trikala and meet the mobility needs of the
passengers who want to move within the city and to the nearby villages. The ticket price varies from
€1.20 to €3.00 depending on the transport zone. Reduced ticket prices are also available for students
and large families. Due to the small size of the urban district, only around 1/3 of the local citizens
move within it by bus and mostly in order to reach the distant regions out of the city centre. The
citizens prefer to walk, cycle or drive, rather than use the public transport, when it comes to distances
less than 1.5 km. Moreover, the ticket’s cost is comparable to the taxi fares, thus the people prefer to
move by the latter, with the majority of the citizens using public transport for travel distances larger
than 2 km, in order to move from the suburban areas, i.e. the surrounding villages, to the city of
Trikala and vice versa. It should be noted that some of the suburbs in Trikala are underserved.
Traffic congestion is considered one of the main problems in the city centre. The city’s topography
and morphological characteristics (i.e. the river and its bridges), the mixed land uses as well as the
high rates of car ownership, conjointly with the citizens’ preference to use private cars even when it is
not necessary, cause severe traffic in the city centre. The high use rate of private cars, along with the
unregulated car parking and the lack of exclusive bus lanes, cause serious traffic congestion
problems, especially during peak hours, as well as many delays in the scheduled bus routes. The
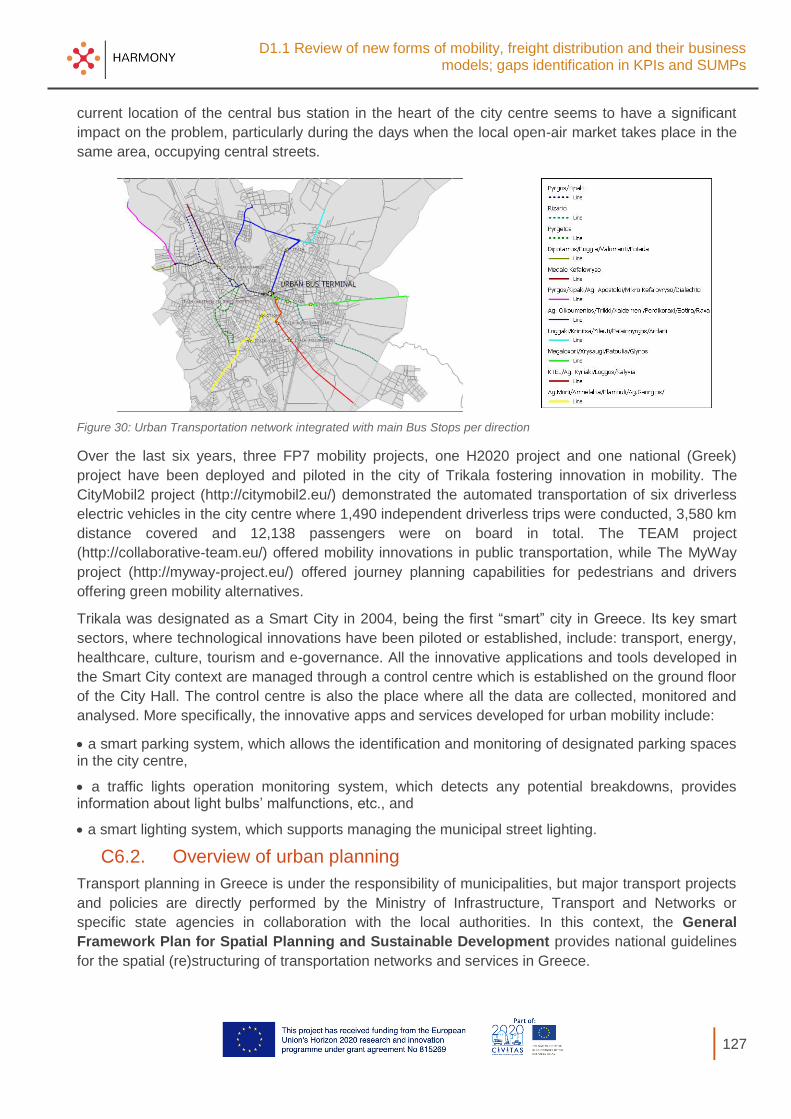
D1.1 Review of new forms of mobility, freight distribution and their business models; gaps identification in KPIs and SUMPs
127
current location of the central bus station in the heart of the city centre seems to have a significant
impact on the problem, particularly during the days when the local open-air market takes place in the
same area, occupying central streets.
Figure 30: Urban Transportation network integrated with main Bus Stops per direction
Over the last six years, three FP7 mobility projects, one H2020 project and one national (Greek)
project have been deployed and piloted in the city of Trikala fostering innovation in mobility. The
CityMobil2 project (http://citymobil2.eu/) demonstrated the automated transportation of six driverless
electric vehicles in the city centre where 1,490 independent driverless trips were conducted, 3,580 km
distance covered and 12,138 passengers were on board in total. The TEAM project
(http://collaborative-team.eu/) offered mobility innovations in public transportation, while The MyWay
project (http://myway-project.eu/) offered journey planning capabilities for pedestrians and drivers
offering green mobility alternatives.
Trikala was designated as a Smart City in 2004, being the first “smart” city in Greece. Its key smart
sectors, where technological innovations have been piloted or established, include: transport, energy,
healthcare, culture, tourism and e-governance. All the innovative applications and tools developed in
the Smart City context are managed through a control centre which is established on the ground floor
of the City Hall. The control centre is also the place where all the data are collected, monitored and
analysed. More specifically, the innovative apps and services developed for urban mobility include:
a smart parking system, which allows the identification and monitoring of designated parking spaces in the city centre,
a traffic lights operation monitoring system, which detects any potential breakdowns, provides information about light bulbs’ malfunctions, etc., and
a smart lighting system, which supports managing the municipal street lighting.
C6.2. Overview of urban planning
Transport planning in Greece is under the responsibility of municipalities, but major transport projects
and policies are directly performed by the Ministry of Infrastructure, Transport and Networks or
specific state agencies in collaboration with the local authorities. In this context, the General
Framework Plan for Spatial Planning and Sustainable Development provides national guidelines
for the spatial (re)structuring of transportation networks and services in Greece.
D1.1 Review of new forms of mobility, freight distribution and their business models; gaps identification in KPIs and SUMPs
128
At the local level, Trikala is a city under transformation and is redesigning its mobility agenda for the
next decades. It should be mentioned that City Plan of the Municipality of Trikala, revised in 2009
can be characterized as a comprehensive study of the development of the city aiming to improve the
quality of life for the benefit of the citizens. One other important policy paper in force is the ‘Strategic
planning 2014-2019’. This paper frames the strategy of the city of Trikala until 2020 and shapes the
strategic axes, measures and objectives. The vision for a smart, green and inclusive city is elaborated
with a special focus on a smart and resilient city. In addition, the city’s response to the current
challenges and future opportunities are analysed. The strategic priorities along with the capabilities of
the Municipality in different economic fields and addressing to different social groups. The principles
are the following:
Smart government/smart policies: policies must focus on local needs instead of technology
Citizen first: government and technology must meet citizen expectations
Usefulness and simplicity: ideas must result to smart solutions that are easy to use and solve
community’s problems
Engagement: design for the people with the people
Respond to urban challenges: climate change and urbanization
It should be noted that the City of Trikala was one of the first cities in Greece to confront the
challenges of sustainable mobility. Since 2013 when the Ministry of Environment & Energy started
promoting the European Mobility Week, the City of Trikala became a leader city for sustainable
mobility, especially with the pilot and innovative project “Citymobil2” and the autonomous driverless
bus, which was used as a public mean of transport for a 6 month period. In 2015, the Mobility Week of
Trikala was ranked among the 10 most successful in Europe.
The Sustainable Urban Mobility Plan is a strategic tool for evidence-based mobility planning for the
city of Trikala. It is currently under preparation for the city of Trikala: there are four deliverables in total
that will be public and will frame the SUMP of the city of Trikala. Currently three of them are being
drafted and one will be prepared by the end of 2019. The SUMP addresses the long-term strategy of
the city, taking into account that the interventions to be proposed have a time horizon of
implementation towards 2030.
C6.3. Key elements of the SUMP
C6.3.1. The planning process
The key objectives of the SUMP are: 1) to improve sustainable urban mobility; 2) to upgrade the
urban environment, 3) to upgrading the quality of life of the citizens of the Municipality and related
districts.
The proposed measures are being discussed with multiple stakeholders and with the citizens of the
city in a series of consultations. In that context, the measures will emerge from participatory
methodologies and the city’s Living Lab. A large variety of social groups will be able to express views
and experiences on some of the proposed measures. The technical team that prepares the SUMP,
the citizens and the Municipality of Trikala are in an open-dialogue process, so that specific traffic
regulations and the multitude of opinions and needs will lead to the contemporary mobility agenda in
the city of Trikala. In addition crucial renovation works in central squares, streets, across the city’s
river ‘Lithaios’ are processes that run in parallel with the SUMP. It should be noted that significant
tools of the SUMP are data collection processes such as field measurements and observations.
questionnaires and consultations with citizens, as well as stakeholder engagement processes.

D1.1 Review of new forms of mobility, freight distribution and their business models; gaps identification in KPIs and SUMPs
129
Another important stage is the participatory planning strategy and stakeholder engagement. Then,
another step is the analysis of the current situation as well as the design of future scenarios
describing opportunities and challenges. Public participation is a key tool to all steps of the process.
C6.3.2. The set of measures
Taking into consideration that the SUMP is currently under preparation, the set of measures is not yet
defined. There are proposals of measures that are under consultation process. These proposals are
divided into axes, which cover different interrelated topics and sectors, which are the following:
1. Traffic Management. In this section extensions of pavements are proposed, so that the public
space in the center of Trikala and in several residential areas is improved and extended. In
addition, road crossings and specially designed roads around schools are under examination
along with soft traffic geographical areas (areas that include cycle lanes, pedestrian tracks or
squares, etc.).
2. Accessibility. Interventions mainly for people with mobility disabilities are under discussion in
order to move to a more accessible city.
3. Public Transport. New information technologies for the citizens, the restructuring of bus-routes
and the planning of new terminals is under preparation. In addition, the necessity of using
automated vehicles for public transportation is discussed. This set of measures aims to
redesign Trikala’s public transportation system by effectively integrating the current public
transport system with sustainable, on-demand, automated and shared mobility services.
4. Urban Freight Transport. The redefinition of dedicated loading and unloading positions is
being prepared. The purpose of these specific measures is to reduce empty load running in the
city for first and last miles routes through several methods such as route optimisation, asset
sharing and digitalisation resulting in lower road congestion.
5. Promotion of non-motorized transport. In this section, the redesign of public space is
promoted, as well as the introduction of geographical areas where active mobility infrastructure
is fostered. For example, areas that include cycle lanes, pedestrian tracks or squares.
Pavement renovations, new information and guidance signs, new bike paths are promoted.
6. Parking Management. There is a need to remove parking spaces from the city centre, which is
launched through parking restriction zones, controlled parking zones, residential parking zones,
online information systems.
7. Improving the Urban Environment. Redesign of public space as well as the introduction of
new green spaces is proposed.
8. Energy management for transport. There is a need to integrate charging stations for electric
vehicles into the city as well to upgrade trash trucks.
9. Adoption of new, “smart” solutions and technologies. Intelligent Transport Systems (ITS)
are under consideration. New on-demand, automated and shared mobility services are
proposed along with new effective operating and business models that integrate public and
private mobility systems.
10. Informing and sensitizing citizens. There is a shift to participatory methodologies such as
workshops with citizens that foster sustainability, electro-mobility, active mobility taking into
account the economic, social and environmental aspects of urban transport. For the city of
Trikala, it is clear that harnessing the potential of smart mobility services for sustainable and
integrated mobility system will require providing fair access to connectivity, data and services to
all different social groups and stakeholders.

D1.1 Review of new forms of mobility, freight distribution and their business models; gaps identification in KPIs and SUMPs
130
C7. Upper Silesian-Zaglebe
C7.1. The metropolitan area
Metropolis (GZM) is populated by about 2.3 million residents. The Silesian Metropolis lies within one
of the largest urban areas in Europe, as shown in Figure 31. Its spatial structure is polycentric,
consisting of 41 municipalities of different scale, population and administrative status (Figure 32).
Katowice is the largest city of the region and its capital. The biggest 14 municipalities create the core
part of GZM (the most urbanized and densely populated area), while 27 other municipalities are
characterized by an extensive land use and less population density, partly of semi-rural type.
Figure 31: The GZM Metropolitan area
Figure 32: Population of municipalities in the GZM metropolitan area
D1.1 Review of new forms of mobility, freight distribution and their business models; gaps identification in KPIs and SUMPs
131
Public transport components include buses (in all municipalities, ca. 400 lines, 1,100 buses daily),
trams (in 13 municipalities, ca. 30 lines, 190 trams), trolley-busses (in one municipality, 6 lines, 17
trolleys), as well as trains (in 23 municipalities, 6 lines, 368 courses daily in metropolitan area) and
bicycle services (in 7 municipalities, ca. 176 bike rental stations and 1,600 bikes). Other components
for long distance mobility are the Katowice International Airport (located in Pyrzowice – ca. 30 km
from Katowice, a core city of GZM) and the inland navigation port in Gliwice (connection with
Szczecin via the Oder river).
The public transport management is structured as follows:
Buses, trolleybuses and trams are managed by ZTM (Metropolitan Transport Authority,
established in 2018), Bus services are outsourced to ca. 40 external operators,
Tram services are outsourced to the operator Silesian Trams JSC, while trolleybus services
are outsourced to the operator Trolleybuses at Tychy,
Urban railway services are managed and mainly financed by Silesia Province (Silesian
Voivodeship) government (ZTM also takes part in financing process). Railway services are
provided by two operators: Silesian Railways and Polregio
Railway infrastructure is managed by national infrastructure manager (PKP PLK S.A.),
however some elements of infrastructure are managed by other related entities.
Buses, trams and trolleybuses service 7,000 stops and carry over 83 million passengers by
year. Silesian Railways carry over 16 Million passengers by year.
There are ongoing works to develop bike infrastructure and enhance the share of bike transport. Bike
rent stations are located at several municipalities.
Main mobility problems are concentrated in the core part of GZM: the efforts are focused on
increasing passenger volume in the public transport and decreasing the amount of individuals using
their own cars (especially for short distance trips).
C7.2. Overview of urban planning
The main spatial planning documents are listed below.
The Regional spatial plan (land use plan for the voivodeship (i.e. provinces) contains general
provisions for the entire region, including general provisions on the transport infrastructure (e.g. transit
and international roads).
The Local spatial study of the conditions and directions of the land use development presents the
development directions of the entire municipality (including information on zoning, parameters of the
land development, development limitations, etc.). It is not a local law.
The Local land use plan (zoning) is prepared for particular part of the municipality (it may be
prepared for entire area of municipality, but it happens very rarely, if yes usually for a small one). It
contains detail provisions for the lend development, assigned to the functional areas which must be
consistent with the local spatial study. These provisions are binding for the technical project to get a
building permission. It is a local law.
With reference to transport planning, the following documents are the main input developed so far.
The actualization of the Strategy for development of the transport system in the Silesian
Voivodeship (2014) was launched in 2018.
D1.1 Review of new forms of mobility, freight distribution and their business models; gaps identification in KPIs and SUMPs
132
With reference to the Transport study for central sub-region of the Silesian Voivodeship22 works
are ongoing since 2015, with expected completion in 2019. Its main objective is to develop a concept
and development directions of a transport system in the sub-region, with the use of a computer traffic
model reflecting the processes taking place in the transport system in the analysed area; It is
expected to gather and analyse all the most important transport elements, contributing the sub-region
development in terms of all means of transport, road infrastructure and sustainable mobility;
The Sustainable Urban Mobility Plan (SUMP) for central sub-region of the Silesian Voivodeship
has been updated in 2018. It contains a diagnosis of the transport system of the sub-region, main
strategic objectives of the sustainable mobility and instruments to balance urban mobility and also the
system of the SUMP implementation.
C7.3. Key elements of the SUMP
C7.3.1. The planning process
The first activities for the definition of the Sustainable Urban Mobility Plan (SUMP) for GZM are
going to start in October 2019.
Nevertheless, the Sustainable Public Transport Development Plan (also Transport Plan) is available
and it is actually required by the Polish law. Its basic elements are different from the European
guidelines for SUMP and consist of:
1. Description of forecasted public transport system (as far for GZM - only buses, trams and
trolleybuses. Railways organisation is beyond GZM area of responsibility);
2. Assessment and forecasts of public transport demand;
3. Projected financing of public transport services;
4. Preferences of choice of transport means;
5. Projected mode of choice of operators (in GZM's case - GZM is not an owner of transport
means - transport services provision is commissioned to external specialised companies);
6. Desirable standard of public transport services;
7. Projected passenger information system.
The main difference between SUMPs and Polish Transport Plans is that these Transport Plans
embrace only a system of buses, trams, trains, etc., running on fixed routes, on which the public may
travel. The Transport Plans do not specify how other modes of transport, such as bikes, scooters,
rental cars etc. should run.
As mentioned above, the SUMP for Central Subregion of Silesian Viovodeship has been updated in
2018 and its preparation has been entrusted to external companies by the Subregion. The Silesian
Voivodeship was divided in 2007 into four subregions, in order to better manage the development of
the Voivodeship. i.e.: Central, North, South and West Subregions. The Central Subregion accounts
for about 2.7 million inhabitants and embraces 73 municipalities: all GZM municipalities are part of the
Central Subregion. GZM and Subregion are independent from each other, however all documents
developed for Subregion concern GZM as well and may be used by GZM.
Moreover, the Transport Strategy for Central Subregion is currently being developed and will include
also a new SUMP and a traffic model. Based on data from several surveys the traffic model has been
developed and several alternative scenarios of transport network development have been designed,
22 one of four parts of the Voivodeship - region bigger then GZM
D1.1 Review of new forms of mobility, freight distribution and their business models; gaps identification in KPIs and SUMPs
133
from "do nothing" to full version. The Transport Strategy for Central Subregion has gone through the
process of public consultations, and it is currently waiting for the final approval.
Regardless of this, GZM has made a decision to develop its own SUMP. A team has been appointed
to prepare this document, consisting of representatives of GZM and ZTM, representatives of
Subregion and leading municipalities.
C7.3.2. The set of measures
This paragraph describes the key elements which are already under discussion within the Metropolis
GZM, and could be considered as potential strategies for the development of the SUMP.
1. Zero-emission transport program. The goal is the replacement of current buses with Diesel
engines with eco-friendly zero-emission buses (currently only 9) and building a charging
infrastructure for electric and hybrid vehicles, both public and private. Actions taken by GZM are in
line with the national plans concerning alternative fuels and the development of the electro-mobility
system. The combined planned financial expenses for projects in this area stands at 776 million
Polish zlotys (about 180 million Euro).
2. Fast metropolitan railway/metro. At the end of July 2018, Metropolis GZM selected the winning
tender for development of the concept of the Metropolitan Railway. It will be prepared by experts
from the Silesian University of Technology. The document will help authorities decide whether
focusing on purchasing new trains which could supplement the already existing connections on the
most popular railway routes is the right decision, and determine the direction of further
development of the metropolitan railway network. Once it is finished, the document will explain
which model of the Metropolitan Railway would be the most suitable for the region. The experts will
analyse various options and provide recommendations as to whether the Metropolis should focus
on expansion of the traditional railway network or invest in monorail infrastructure, which usually
allows the train to use a single monorail track on a special overpass. The concept is just the
beginning of the process of rebuilding the importance of railway transport in the Metropolis.
Building of a well-functioning Metropolitan Railway system is a task which will require at least a
decade of work, huge financial outlays, and cooperation of many partners.
3. Drones – hub&lab. The project goals are to create a U-Space over the Upper Silesia-Zagłębie
Metropolis that enhances the security of operations using unmanned aerial vehicle (UAV) both in
airspace and land by building and testing, and then launching a local ICT infrastructure enabling
safe and monitored compliance with local laws and conditions, used to perform the drone mission
in stand-alone mode and out of sight (so-called BVLOS). The project started formally in September
2018 with documentation prepared for the needs of the first joint activities and the concept of
implementation agreed along with the objectives. Work began with the participation of the Polish
Development Fund as part of launching a service pilot with the use of drones (monitoring of
buildings contributing to low emissions) in the area of the Metropolis. As the part of the undertaken
activities, relationships with key stakeholders were established by identifying and analysing their
expectations and benefits from the developed U-Space solutions. Along with the Polish Air
Navigation Services Agency (PANSA), the concept of airspace organization for drone flights and
assumptions for the creation of a test area together with the concept of the local DTM system
(Drone Traffic Management) have been developed. Current main actions are:
developing the concept of social communication building positive social acceptance for
planned activities with the use of drones, and arrangements are made to launch a test area
over one of the metropolitan cities in which the DTM system is planned to be launched;

D1.1 Review of new forms of mobility, freight distribution and their business models; gaps identification in KPIs and SUMPs
134
Purchase of infrastructure and software for ADS-B for drones management of the needs of the
test area;
First pilots of services and preparedness activities for identification, incubation and
development of new services using drones;
Establishment of DroneLAB initiatives: transport, safety, environment, infrastructure, geodesy
and agriculture - each subproject develops guidelines or a standard supporting the
implementation of public procurement for defined services.
4. Functional areas design and guidelines for spatial and strategic planning. The project has
not yet taken off due to the planned changes in the Polish law concerning spatial and strategic
planning and lack of the new governmental politics for regions.
5. Recommendations for the development of modern mobility in the area of GZM. One of the
aspects covered is related to the use of intelligent traffic management system: e.g. modernised
controllers, vehicle detectors and city surveillance cameras which transmit footage in real time to
the traffic control centre to ensure that free flow is quickly restored in congested areas. This system
has already been applied in Gliwice, covering 60 junctions in the city, and will be extended to
include bike lanes: the authorities of Katowice aim to implement a similar solution.
D1.1 Review of new forms of mobility, freight distribution and their business models; gaps identification in KPIs and SUMPs
135
ANNEXES

D1.1 Review of new forms of mobility, freight distribution and their business models; gaps identification in KPIs and SUMPs
136
Annex 1 - Detailed review of regional economic models
MASST (MAcroeconomic, Sectoral, Social, Territorial model): The purpose of MASST is to create territorial scenarios under different assumptions about the main driving forces of change that will act in the future. In a scenario-building of this kind, the presence of the MASST model guarantees that the results are neutral vis-a-vis the assumptions, since they are based on the structural relationships that hold together the economic system in an objective way (estimates). Used with such a purpose, it is not a short-term forecasting tool, but a long-term quantitative foresight model. In particular, the MASST model is deeply rooted in endogenous development theories in which the competitiveness of an economic system depends on the presence of structural elements (like human capital, knowledge, labour force) and on the ability of the economic system to cumulate them over time through endogenous and self-reinforcing mechanisms while the inter-regional link is at the basis of a cumulative and self-reinforcing local growth process a la Myrdal-Kaldor-Krugman.
RHOMOLO: The theoretical structure of the model is common to other numerical general equilibrium model. The economy consists of a set of 268 regions (EU NUTS2) and one single exogenous region representing the Rest of the World. The model has a set of different economic sectors, in which a subset operates under monopolistic competition. Identical firms produce a differentiated variety, which is considered an imperfect substitute for the varieties produced within the same region and elsewhere. The rest of firms operate under perfect competition. Final goods are consumed by Households, Governments and Investors (in the form of capital goods), whilst firms consume intermediate inputs. Regional goods are produced by combining the value added (labour and capital) with domestic and imported intermediates, creating vertical linkages between firms. Trade between and within regions is costly, implying that the shipping of goods entails transport costs assumed to be of the iceberg type. The model distinguishes three different labour categories which correspond to the level of skill or education, for each labour type, the default wage setting relationship is represented by a wage curve. The RHOMOLO model share some similarities with other macroeconomic models currently adopted for policy analysis and policy evaluations existing in the economic literatures. However, the high spatial dimension comes with a great burden of data needs for small runs and long-term forecasting.
RED (Economic Base Analysis & Shift-Share): Briefly, an Economic Base Analysis (EBA) allows researchers to classify an industry within a local economy according to its import-export trade activities. An EBA places particular emphasis on the export sector of an economy because it is theorized that export activities are the engine of a local market. Throughout the literature, discussion relies on modelling techniques, dividing industries into import or export oriented, or instead classifying according to intensive time, labor, and financial requirements. Thus, the EBA allows analysts to determine which industries are “driving” the local economy.
On the other hand, the Shift-Share Analysis (SSA) allows researchers to comparatively analyze local and national trends to determine their differences across a fixed period of time. SSA is very practical in assessing the impacts of industrial restructuring on regional and local economies and can make a significant contribution to understanding industries in the region.
Critical advantages that the EBA and SSA offer are the significance of understanding the local economy, the importance of objectively organizing and analyzing, while they lack in the social aspect and rely too much into inner and too specific economic variables trends.
REMI (Econometric & Input-Output model): The model forecasts the future of a regional economy, and predicts the effects on that same economy when the user implements a change. The REMI model at its core, has the inter-industry relationships found in Input-Output (I-O) models. Changes that affect industry sectors that are highly interconnected to the rest of the economy will often have a greater economic impact than those for industries that are not closely linked to the regional economy. General equilibrium is reached when supply and demand are balanced. This tends to occur in the

D1.1 Review of new forms of mobility, freight distribution and their business models; gaps identification in KPIs and SUMPs
137
long run, as prices, production, consumption, imports, exports, and other changes occur to stabilize the economic system. The REMI model is a dynamic forecasting and policy analysis tool that can be variously referred to as an econometric model, an input-output model, or even a computable general equilibrium model.
IMPLAN (Purely I-O analysis): The IMPLAN modeling system is an interactive, computer-based modeling system capable of producing I-O accounts and I-O models for any region in the United States as small as a single county. Like most regional I-O models, the IMPLAN model is ‘stepped down’ from a set of national I-O accounts, combined with local data. Multipliers are generated for employment, output, value added, personal income, and total income. Similar to REMI, IMPLAN builds its data from top to bottom. I-O models are extremely data-intensive and IMPLAN makes extensive use of many data sources. In contrast to REMI, IMPLAN is exclusively an I-O model. It is non-survey based, and its structure typifies that of I-O models found in the regional science literature.
RIMSII (I-O Analysis & Survey method): RIMS II is based on an accounting framework called an I-O table, like REMI. Multipliers can be estimated for any region composed of one or more counties and for any industry, or group of industries, in the national I-O table. The accessibility of the main data sources for RIMS II keeps the cost of estimating regional multipliers relatively low. Empirical tests show that estimates based on relatively expensive surveys and RIMS II-based estimates are similar in magnitude. The method for estimating regional I-O multipliers can be viewed as a three-step process. In the first step, the producer portion of the national I-O table is made region-specific by using four-digit SIC location quotients. In the second step, the household column from the national I-O table is made region-specific. In the last step, the Leontief inversion approach is used to estimate multipliers. This inversion approach produces output, earnings, and employment multipliers, which can be used to trace the impacts of changes in final demand on the directly and indirectly affected industries.

D1.1 Review of new forms of mobility, freight distribution and their business models; gaps identification in KPIs and SUMPs
138
Annex 2 - LUTI Models
The Essential Logic of LUTI Models
LUTI models articulate the city system with respect to its economy and demography. The economy is
usually defined through the location of employment of different types, making a key distinction
between employment that cannot be easily forecast and is thus exogenous to the model and
employment that depends on other activities simulated by the model such as retail and commercial
employment that serves the population. Population is articulated largely where people live, by their
residential locations, while employment is defined with respect to industrial and service centre
locations. Both population and employment are often disaggregated into different types, population by
social class, age cohort, and/or income, employment by different industrial group, often following the
Standard Industrial Classification. Population and employment are tied together by aggregate models
of trip distribution, usually gravitational models but sometimes analogous variants based on discrete
choice, with these models being coarser versions of the four stage and related structures that are
used for more detailed transportation forecasting. Sometimes as in the very first model in this genus –
Lowry’s (1964) model of Pittsburgh built in the early 1960s – explicit trip-making is not invoked but
accessibility indices are used from trip distribution models in the location of population and
employment (Batty, 2009).
Six features of these simulations are worth emphasising. First, as everything is related to everything
else in cities, the location of population and employment is configured simultaneously. Second, these
models tend to simulate the urban system at a cross section in time and are thus not dynamic in the
temporal sense. A wider review including this whole range of urban models is included in Batty
(2008). Third, these models are often disaggregated by transport as are four stage and activity-based
transportation models where the focus is on private and public transport, often further disaggregated
into road, bus, rail, walk and cycle trips. Fourth, residential population can also be related to housing
types thus introducing a physical dimension to the problem and this represents a link to housing
issues such as tenure, density and so on. Links to housing market model with a distinctly more
economic focus are often developed through these mechanisms. Fifth, the physical amounts of
floorspace and other related physical volumes are sometimes used to relate economic attributes and
activities to land use types where planners and policy makers seek to control the physical
configuration of land use by zoning of various kinds. The sixth and final category involves the
development of other movement patterns, particularly freight which are often simulated by standalone
transportation models in their own right but have important implications for the development of the
economic and employment models in that they are closely linked with interindustry linkages. These
models are dealt with elsewhere in this review.
Here it is worth providing a simple block diagram of how land use and transport are related in these
models. Population and Employment are the key locational variables being simulated. They are linked
either by accessibilities or by explicit trip-making models that are structured around origins,
destination and the cost of trip-making. The outputs of these models can be linked to land use types
and housing densities and a variety of physical features are often predicted as part of their outputs.
The inputs to these models from more aggregate demographic and economic models such as
population forecasting and input-output or industrial factor models also drive the total activities that
are distributed and allocated in these models. The link to transportation models downstream of these
LUTI models, so to speak, involves factoring their predictions as control totals in some manner to

D1.1 Review of new forms of mobility, freight distribution and their business models; gaps identification in KPIs and SUMPs
139
more detailed transportation models but the links to other models are often difficult to determine and
usually depend on arbitrary and pragmatic mechanisms of translation that are developed without any
standardisation between different applications. Finally, sometimes links to land supply, housing
markets and the prediction of external employment are handled using what we call here – Land
Supply Models – which we will note in a separate section following this review of LUTI models.
Figure 33. Typical Structure for a LUTI Model
(Note that the iteration from employment to population and back ensures both equilibrium and the generation of demand for
activities)
Past and Contemporary Classifications and Reviews of LUTI Models
A broad ranging review on LUTI models has been conducted by EUNOIA, a research project funded
under the European Union's Seventh Framework Programme ICT Programme (http://eunoia-
project.eu/). In EUNOIA, 13 significant papers from 1995 to 2013 were identified. In chronological
order, we took material from Southworth’s (1995) paper for Oak Ridge National Laboratory, where he
focused on DRAM/EMPAL/ITLUP, and MEPLAN, as well as a number of other models not reviewed
here. The paper looks in detail at the core mathematical underpinnings behind the models. Clement’s
(1996) review is comprehensive, it includes information on inputs and outputs of each model, and
block diagrams. Notably, it describes in detail the travel component of the LUTI models it looked at.
Rosenbaum’s (1997) review for the US Environmental Protection Agency is “intended to help policy
makers at all levels understand how transportation and land use models may improve policy
development and implementation. “As with the Gliebe’s review below, only models used in the US
were examined. Of the 25 applications were looked at, 13 do not use a land-use model, and 8 of
those use DRAM/EMPAL. For travel demand modelling, it was found that TRANPLAN and MINUTP,
two models not evaluated in this review, were used by nearly 75% of the areas. One area had
recently started using EMME/2. The report concentrates on DRAM/EMPAL, TRANUS and MEPLAN,
the latter two being evaluated in the same section due their similarity. Calibration and configuration of
the models reviewed are noted as being time consuming, data intensive and typically requiring
experienced personnel. The review notes the cost of licenses for these models.
D1.1 Review of new forms of mobility, freight distribution and their business models; gaps identification in KPIs and SUMPs
140
Schock’s (2000) report is the longest of the comparative reviews studied. The bulk of the report is a
comprehensive (multiple-page) profile of each of the 22 models it studies, containing practical
information such as the cost of procuring the model, equipment and staff skills required, inputs
needed, output format, strengths and weaknesses, area applications and references. Wegener has
been active since his paper in 1994 in the Journal of the American Planning Association in presenting
land use models and his later version of that paper in 2004 entitled “Overview of Land-use Transport
Models” is a concise review of twenty urban models. Wegener compares the models using the
following criteria: comprehensiveness (relating to which city subsystems are modelled), model
structure (unified or composite), theoretical foundations, modelling techniques, dynamics, data
requirements, calibration-validation operationality (use in “real life” for planning) and applicability.
Wegener’s paper is very much focused on the state-of-the-art and likely future developments.
Hunt et al’s (2005) paper in Transport Reviews looked at six LUTI frameworks (ITLUP, MEPLAN,
TRANUS, MUSSA, UrbanSim and NYMTC-LUM), all of which except NYMTC-LUM are included in
this report. Microsimulation models were not included as the authors felt the field was not mature
enough at the point of conducting the review. The six included were considered to be good examples
of models in current operational use. A set of tables is used to concisely and clearly describe the key
aspects of, and differences between each model. The paper notes that all the models looked at are
complex to configure and operate. Zhao et al.’s (2006) paper focuses on land-use models, focusing
particularly on UrbanSim and detailing a sample application to an area in Florida. Sivakumar’s (2007)
paper is about three strands of development of integrated land-use transport models (LUTIs):
development of travel-demand models from 4-step to activity-based, development of LUTIs with a 4-
step transport component, and development of next-generation LUTIs, disaggregated and with an
activity-based transport component. In addition, she touches on recent developments with the
microsimulation approach. The paper does not review individual models in detail. My paper (Batty,
2008) is a history of land use models, focusing on the wholesale shift in the fundamental techniques
underpinning urban models, across a broad time-frame. It notes that many of the newer cellular
automata models, while well advanced on a theoretical basis, and serving as a discussion focus, have
yet to be applied practically by city authorities. It also mentions that, while model types have evolved,
models constructed in the “traditional” style, such as UrbanSim, continue to show considerable
promise, and practical application, today. My other review (Batty, 2009) is a simple summary of LUTI
model structures but also includes agent-based models and cellular automata (CA) models.
Iacono et al.’s (2008) paper “Models of Transportation and Land Use Change: A Guide to the
Territory” is a concise and clear description of around 20 models, categorising each according to its
fundamental type (aggregate spatial interaction, econometric, activity/agent-based microsimulation
and cellular automata models). It includes a paragraph outlining the specific features that distinguish
each model from the others in its class. Gliebe’s (2009) report responds to a panel recommendation
to “Identify state of the art integrated transportation-land use models being used in practice and
identify the strengths and weaknesses of each model for forecasting transit-induced land use changes
and economic benefits.” It first discusses the main questions that should be asked when evaluating
the models, before developing a classification for them. It looks only at models actively being used in
the US at the time of the report’s writing, which have an economic component. The classifications of
the models are based on the following considerations: Aggregate “top down” vs Disaggregate “bottom
up”, Static “single shot” vs Dynamic “year on year”, Equilibrium “single solution” vs Disequilibrium
“seed dependent”, Transportation embedded vs Transportation linked Each model is classified
according to each of the four options. Gliebe’s report looks at PECAS and UrbanSim. Wegener (2012)
continues his review updating his earlier papers and this is another concise comparative review of a
D1.1 Review of new forms of mobility, freight distribution and their business models; gaps identification in KPIs and SUMPs
141
wide range of models. The models are grouped, and each is succinctly described in a paragraph. His
paper “Land-Use Transport Interaction Models” discusses the chronological development of popular
LUTIs, from spatial-interaction location models (MEPLAN, TRANUS, PECAS) to accessibility-based
location models (IRPUD, MUSSA, DELTA, UrbanSim). He also discusses the “macro or micro” split
between aggregate models and cellular automata/agent-based ones, including a discussion of ILUTE.
Since we concluded out review in 2013, there have been several useful new reviews. In particular
Moeckel’s (2018) Integrated Transportation and Land Use Models review for the US National
Cooperative Highway Research Program, provides a good review of US applications. Moeckel divided
his review into three model types: the first is sketch-planning models that do not interface well with
transportation models and thus we excluded them here apart from UPlan. He then divided most
models into two types: microsimulation which he defines as essentially discrete choice models and
spatial input-output models which are more like the LUTI model genus. As we will see these two
groups overlap considerably and our own distinction is largely into five types of urban model:
Traditional aggregative LUTI models (spatial-input-output), discrete choice models, activity
microsimulation models, agent-based models and cellular automata. In essence what we are
reviewing here are the first type although these different types overlap considerably with one another.
In another part of this review, microsimulation and discrete choice models will be reviewed separately.
Moeckel et al. (2018) in a shorter review paper outline the range of model types noting the
ambiguities between disaggregate models, microsimulation and agent-based models that all emerge
when one takes aggregate models and begins to disaggregate their activities in groups, categories,
sectors and ultimately to the level of households and individuals that form the focus of interest. Most
models however are still largely static with a strong equilibrium focus.
Other useful reviews have been developed by Acheampong and Silva (2015), and Kii et al. (2016) but
it is worth defining the evolution of different models types so that one can get some sense of where
the field is heading before we begin to review individual LUTI models. If we sketch how these various
model types have developed through time, from the first models that were largely comparative static,
composed of aggregate activities and contained transport directly within their structure, there has
been a gradual quest to disaggregate their each activities and to begin to integrate urban dynamic
processes into their structure. Discrete choice variants of aggregative social physics style gravitational
models more or less developed in parallel more than 50 years ago and the activity approach enables
these more disaggregate forms to be embodied in methods of microsimulaion. These were first
different from a related stream much more general than urban models per se in the form of agent-
based models where the focus was on dynamics and well as location. Some aggregate models like
UrbanSim have gone down the ABM route although it arguable as to whether or not these models are
fully-fledged ABMs. Microsimulation models such as MATSIMs are agent based to an extent, but their
origins tend to be in discrete choice and more aggregate models, rather than in the construction of
agent-based models from scratch.
There are different ways of classifying LUTI models and one of these is to show how their structures
have evolved since the first models were developed in the late 1950s. Essentially as computers have
got more powerful and different spatial data has got more detailed and available, LUTI models have
got more disaggregate. Some have begun to model increments and decrements of activity and land
use change, but most are still essentially based on comparative static structures, reflecting the fact
that these models simulate the city system at a single cross-section in time. In the 1980s, a second
broad class of urban models emerged based on land development built around principles of urban
change embodied in cellular automata (CA) models, but these rarely link to transport in any explicit

D1.1 Review of new forms of mobility, freight distribution and their business models; gaps identification in KPIs and SUMPs
142
way and thus we do not review them here. More significant is the move to agent-based models
(ABMs) which to an extent are the natural focus for disaggregating aggregate activities in LUTI
models down to the point where individual households and even individuals are represented.
Associated with these ABMs is the process of microsimulation which is somewhat different in that
individuals are drawn from probability distributions which are fitted to very detailed individual data but
activity models in transport such as MATSIM (dealt with elsewhere in this review) are built around
such structures and even UrbanSim has elements of microsimulation within its structure. This
chronology was pictured in the Eunoia project review as a network of related models, many of which
but not all are reviewed here, and to provide some sense of this variety we have reproduced this in
the Figure 11Figure 11.
The focus of this review is on the models marked by Cluster 1. Clusters 2 and 3 concern
microsimulation models and cellular automata respectively, which are out of the scope of this review.
Detailed review of the LUTI Models
MEPLAN (Echenique et al., 1990): MEPLAN development started in the late 1960s by Marcial Echenique and colleagues and it took the Lowry (1964) model as a starting point. It has been extended and refined over the years through various studies such as in Reading, Cambridge and Stevenage. The transport side of the model has been developed through various studies as well for metropolitan planning agencies in Sao Paulo, Brazil and Bilbao, Spain. In the late 1970s, the basic structure of the MEPLAN integrated model was complete. Since then the model has been used widely and constantly refined and improved.
The basis of the MEPLAN modelling framework is the interaction between two parallel types of markets: one related to the land (space) and the activities that occupy it; and the other one concerning transport. The land market model is a spatially disaggregated Social Accounting Matrix (SAM) or input-output table. The Social Accounting Matrix contains the information on the relationships between various factors, namely industries, households, floorspace and land. There are five main components in the MEPLAN model namely:
LUS, the land-use model. It estimates the spatial pattern of rents, densities, location of households, firms and floorspace, and movement between zones by purpose (trip distribution stage).
FRED/DERF, the interface between land use and transport. It takes the generalised costs from the transport model and converts them into accessibility measures between zone pairs for use as inputs in the land-use model. It also takes outputs from the land-use model (peak-hour trip matrices by type) for use as inputs to the transport model (trip generation stage).
TAS, the transport model. This model divides the trip matrices into modes and capacity to represent congestion (modal split and assignment stages).
EVAL, the evaluation model. This model processes a cost-benefit analysis for a particular alternative scenario compared with a base scenario for both land-use and transport benefits.
GRAPH, the graphics option module. It allows the model results to be output in graphical form. It contains two programs, TASG and EVALG to plot results of the TAS and EVAL model respectively.
MEPLAN organises all urban activities in a multi-activity input-output framework. The land-use modules forecast the development of land, the total level of activity and their location. As the competition for floorspace increases, prices increase too until an equilibrium is reached between the supply of space available and the demand from the different types of activities. Many variables can be output from the model such as the amount of new development, rent values, figures on households, population, employment, economic sectors and so on. The model also predicts complex patterns of movements

D1.1 Review of new forms of mobility, freight distribution and their business models; gaps identification in KPIs and SUMPs
143
TRANUS (TRANsporte Uso del Suelo) (De la Barra, 1989): TRANUS (TRANsporte Uso del Suelo)
is an aggregate land-use transport model. It is developed by Modelistica, a company which also
provides support for, and consultancy based on, the model. de la Barra is the lead developer. It
combines together components from spatial microeconomics, gravity/entropy, input/output, random
utility and transport models. Notably, it models public transport use on a very detailed level – this
being a key mode of transport in Latin America where the model was first developed. The TRANUS
model has a project database file. A zoning structure is specified and a scenario is applied. The
transport component is multi-modal and can be used in standalone mode. Both passengers and
freight movements can be modelled in it, and it models public transport journeys, including multiple
transfer journeys and waiting times. It is multi-modal and can be used independently from the rest of
the model. The TRANUS software package includes a GUI, which can open a project database file
and operate and visualise the model outcomes. Scenario results can be viewed in the TRANUS GUI.
The software package also generates CSV files for both land use indicators (zone-by-zone outcomes)
and transport statistics (trips by mode), for further analysis in external applications, e.g. Excel. A
model of Swindon is included as an example in the TRANUS user guide. The town was modelled in
TRANUS in the late 1990s.
IRPUD (Wegener, 2011): IRPUD was created at the University of Dortmund in 1977 by Michael
Wegener. It is an aggregate model but has been subsequently adapted to run as a microsimulation
model (as the ILUMASS model). It is a simulation model of intraregional location and mobility
decisions in a metropolitan area. Location is specified in zones, with time in periods of one or more
years. Different transport networks connect the zones – connections can appear and disappear within
each period, as appropriate. There are four groups of data needed for IRPUD. Model parameter data
includes demographic, household, housing, technical (road space, petrol consumption etc.),
monetary, preference (attractiveness) and transport (fares, car occupancy rates etc.). Regional data
includes input/output information for the model area – regional employment industries, immigration
and emigration. Zonal data includes demographic information on the population and households, as
well as land use and rents. Finally, there are the transport networks. There are two transport networks
to be supplied, as nodes/edges – public transport and road (split into car/motorcycle and
walking/cycling modes); each network has a variety of edge types.
The model consists of four main assets – population, employment, residential buildings and non-
residential buildings. There are four actors representing these – individuals/households, workers,
housing investors and companies. There are five markets – labour, non-residential buildings,
residential housing, land/construction and transport. There are six sub-models that run, they are
interlinked – transport, ageing, public programmers, private construction, labour and housing market.
The model typically runs on a year-by-year basis.
IRPUD generates results files, graphs (of trajectories) and maps. The results include information on
zonal (predicted demographics), matrix (interzonal travel information), link (transport type edge
volumes) and raster (traffic noise and air pollution) indicators. IRPUD was first used in the eastern
Ruhr region of Germany. It has subsequently been used in various other urban regions in Europe,
such as North-Rhine Westphalia. ILUMASS is a microsimulation version of IRPUD. It was first run for
the Dortmund metropolitan area.
ITLUP (DRAM-EMPAL) (Putman, 1996): The ITLUP (Integrated Transportation and Land Use Package) framework consists of a number of sub-models, including DRAM (Disaggregate Residential Allocation Model), EMPAL (Employment Allocation Model) and travel demand. Stephen Putman

D1.1 Review of new forms of mobility, freight distribution and their business models; gaps identification in KPIs and SUMPs
144
developed the model at the University of Pennsylvania. It is a spatial interaction model based on a Lowry-type model structure, and designed to form the maximum entropy state in the system.
A key advantage of ITLUP is that it requires relatively more straightforward data inputs than some other similar frameworks, this makes it easier to configure, at the expense of some model detail. EMPAL uses input variables on employment, population, total area per zone, zone-to-zone travel cost and regional employment forecasts. DRAM uses input variables on residents, residential land, developable land (vacant land as well), zone-to-zone travel costs, employment data and regional population forecasts.
ITLUP simulates the main linkages between transportation and land-use processes. The land-use is modelled as in Lowry's duo of gravity models: a disaggregated residential allocation model and trip distribution (DRAM), and an employment allocation model (EMPAL). The models are run in succession to simulate the interactions between the processes: the land-use outputs are input to the transportation model, and the transportation forecasts are then input to the land-use model and so on. In contrast to the classical Lowry model framework, the two models DRAM and EMPAL can be calibrated and run separately. The two other principal models within ITLUP are for modal split calculation (MSPLIT) and for trip assignment (NETWORK). ITLUP also has several other sub-models to calculate intra-zonal travel times, network congestion measures and land consumption.
The ITLUP model has been used for analysing various impacts of public policies (air quality, water quality, energy consumption). ITLUP produces numerous forecast outputs and at each simulated time period, those outputs become inputs to the next time period. The model has been used internationally and in the United States, we count more than 40 calibrated examples. The model was first developed in 1971 using data for the San Francisco region and has since been extensively refined.
LILT (Leeds Integrated Land-use Transport model) (Mackett, 1991): LILT (the Leeds Integrated Land-use Transport model) is a Lowry-type spatial interaction/entropy-maximising model linked to a four-stage aggregate travel demand model. Roger Mackett developed the model in the late 1970s in Leeds where it was originally developed for the city of Leeds. For this application, the model has three modes of transport (car, public transport and walk), three socioeconomic groups for the population, and twelve industrial sectors. The primary sectors are located on the basis of the previous spatial distribution; the secondary sectors respond to change in accessibility; and the tertiary sectors are located considering the distribution of the population and taking into account the relative cost of travel.
The model is constrained by exogenous totals of population, new housing and jobs and it allocates those variables to zones taking account of existing land-use restrictions and cost of travel. The model uses accessibility factors derived from the journey-to-work component to locate housing and economic activity. The model distinguishes urban form (i.e. housing) and urban function (i.e. residential activity) so that contrasts between the two are represented. Workers are divided into different sets whether or not they have kept their residential and/or employment location; and their proportions in each of the categories are calculated on the basis of survival probabilities.
In the residential allocation sub-model, movers are attracted to zones containing people with similar socioeconomic status and car-ownership. Both the residential and the employment location sub-models are using factors that can be interpreted as measures of accessibility. The model works at zone level and is incremental (typically five years from a base year). For each forecast, the totals for the entire study area are specified and the model calculates the allocations by zone. For each simulation, the following variables have to be specified: the total population by socioeconomic group, the total number of jobs for each industrial sector, the cost of travel between all pairs of zones by mode, and the amount of newly-built and demolished housing during the previous time period.
The model is used to interpret the impacts of introducing new policies. It is done by running a scenario forecasting the ‘most likely future’ and comparing it with an alternative scenario introducing the new policy. The impacts in terms of job location, population travel patterns, car-ownership changes are calculated. In addition to land-use variables, the model also predicts trip patterns by mode and purpose. The model has also been applied to Dortmund and also Tokyo.

D1.1 Review of new forms of mobility, freight distribution and their business models; gaps identification in KPIs and SUMPs
145
MUSSA (Modelo del Uso del Suelo de Santiago) (Martinez, 1996): MUSSA (Modelo del Uso del Suelo de Santiago) is a five-stage land-use transport equilibrium model designed to forecast the expected location of agents, residents, and firms, in urban areas. It was developed by Martinez. The model is structured around the paradigm of static market equilibrium. The model allocates land and dwellings to the highest bidder by auctions and market equilibrium is attained by the condition that all agents are located, thereby balancing supply against demand.
The model is based on probabilities of location, bid rent and supply equations. The auctioning process produces rents for each real estate in the market and defines levels of satisfaction to allocate agents at equilibrium. Households and firms are clustered into categories, while land is divided into zones and dwellings into types; the number of discrete units is defined by the user. There are no constraints on the number of zones, dwellings types, households and firm clusters. At a parcel level, allocations are represented as a combinatorial optimization problem.
The model has been used in Santiago City and has been applied in several areas in US and Asia. The model has been commercially available in Windows-based software since 2002 and currently it is distributed by Citilabs Inc. under the name of CubeLand as part of the Cube software products. The software license belongs to the Chilean Government.
DELTA (Simmonds, 2019): The DELTA package was developed by the David Simmonds Consultancy Ltd (DSC) in Cambridge, UK, which specialises in research, analysis and forecasting studies applied to urban, regional and transport planning. DELTA is suitable for use as an add-on to any strategic transport model and this allows a great flexibility for new land-use transport interaction (LUTI) model development. In addition, DELTA is a dynamic model that focuses on changes over time. It is also an incremental model working in one-year steps. DELTA is based on recognisable processes of change that are, to a certain degree, linked to each other within one time period, but important feedback effects (both positive and negative) apply over time, both within DELTA and through interaction with transport.
DELTA is in the lineage of the MEPLAN models from which it is essentially a spinoff. The base data consists of information from published sources at a zonal level and for a specific ‘base’ year (i.e. household and population figures, travel-to-work data, employment figures, residential and commercial floorspace, rents). The demographic and economic scenarios are taken as given at the national level, but are reproduced by modelling processes of demographic and economic changes. They match official projections. The planning policy inputs typically involve information on the recent past if available, information on current developments and information on policies affecting future development.
The transport model is not part of DELTA. The transport model takes the location of activities by zones for a specific year and forecasts the travel between these zones by transport modes. It estimates the travel costs and times between each pair of zones and summarises those costs into a single variable describing how difficult it is to travel between any pair of zones. The economic model forecasts by area the growth or decline of the different sectors of the economy and is influenced by the generalised costs; the consumer demand for goods and services; and by the rents. The urban model forecasts the location of households and jobs by zone within each area. These locations are influenced by the availability of floorspace that is in turn restricted by planning policies.
The accessibility of a zone also influences the locations of households and jobs. The migration model forecasts the pattern of migration of households between the different areas. There are complex possibilities for feedback between the four components described above. Various sub-models exist to deal with different information such as, amongst others, the transition and growth sub-model dealing with household/population change and employment growth factors, the location model, the employment status and commuting sub-model, the car-ownership sub-model, the development sub-model, the area quality sub-model and the investment and production/trade sub-models.
DELTA forecasts the urban and regional impacts of new transport infrastructure schemes or new planning developments over a period of 30 or more years. The model predicts various disaggregated
D1.1 Review of new forms of mobility, freight distribution and their business models; gaps identification in KPIs and SUMPs
146
data on household, population, employment, rents and floorspace. Many additional variables can be output from the model depending on the scenario being implemented and its definition.
The London Land-Use Transport Interaction Model (LonLUTI) is an example application of the DELTA package for the Greater South-East region. LonLUTI has been commissioned from Transport for London (TfL) to David Simmonds Consultancy (DSC) in 2007 with the main focus of assessing the economic and social regeneration impacts of the proposed Thames Gateway Bridge (TGB), but also to be applicable to other proposals in the region. The land-use model, called LonLUM, is linked to the LTS four-stage transport model that runs every five years. The latest version of LonLUTI runs to 2041. The model has been applied (and is currently used) to test numerous scenarios of new transport infrastructures for the London region and provides valuable insights for decision- making. A ‘Peer Group’ composed of a mix of academic and consultancy experts was appointed by TfL in 2008 to examine the model and provide an independent view on the ability of LonLUTI to meet London’s requirements.
The first prototype of DELTA was completed in 1996 for Edinburgh, Scotland. Since then, the DELTA package has been applied to many regions in Great Britain. In addition, it has been used in Auckland, New Zealand; in Delft, The Netherlands; and is currently being developed by a group of researchers at the University of Seoul, Korea. For more information on DELTA see http://www.davidsimmonds.com/.
MARS (Pfaffenbichler et al., 2008): MARS (Metropolitan Activity Relocation Simulator) is an aggregate non-equilibrium land use transport interaction (LUTI) model. The model should not be confused with a psychological model of individual behaviour which has the same name. The model accepts input in the form of Excel files of origin/destination matrices. Configuration is via a user interface. Multiple modes of transport, trip purposes, time periods and household types can be modelled. MARS is fast to run – typically less than one minute for a 30-year simulation. This allows iterative configuration and validation of the model by repeatedly altering parameters and rerunning it. The model does not include the assignment stage often seen in LUTI models, instead it “uses aggregate speedflow relationships for each origin-destination movement”. MARS is implemented in Vensim which is a programming environment developed by System Dynamics. The environment also provides an interface for the configuration options.
The model software package includes a “flight simulator” which is a graphical user interface that allows the output altering cause-effect relations. Results can be seen within the simulator itself, or output as diagrams and tables for external analysis. MARS was originally implemented in Leeds, United Kingdom, by the Institute for Transport Studies (ITS). MARS has also been used with historic data from Vienna. The model has been adapted for Hanoi.
UrbanSim (Waddell, 2002): UrbanSim was first developed by Paul Waddell and his research team at the University of Washington from 1996 (now at the U California Berkeley). UrbanSim quickly became of interest in academic environments for many reasons. It is an open-source package and is freely available so anyone can use it and modify its code. In addition UrbanSim is a highly disaggregate model based on a microsimulation design. It works at different levels, a zonal level and/or a grid cell level; and recently a parcel-based level has been added. It permits a much finer approach to urban modelling than most other integrated models. The population is simulated at a level of individual households; and the employment at the level of individual jobs or buildings.
UrbanSim is notable as the “only model that we are aware of that attempts to build integrated activity-based microsimulation models of land-use and transport”. UrbanSim models have been adapted to different data structures and geographic units of analysis. Each of these models has its own data requirements. Depending on the geographic units of analysis, UrbanSim provides a set of data integration tools to read input files, diagnose problems in them, and apply decision rules to synthesize missing or erroneous data in order to construct the models data store. Although documenting a complete set of data requirements for UrbanSim is a difficult task, this section will attempt to identify main data requirements on employment, households and transportation networks that are of general use.

D1.1 Review of new forms of mobility, freight distribution and their business models; gaps identification in KPIs and SUMPs
147
Each household is represented as an individual object, with primary characteristics such as household income, size, age of head, presence of children, and number of workers. Additional key information can be added such as annual household control totals and annual relocation rates. Employment is represented as individual records for each job and its employment sector. Additional key information can be added such as annual employment control totals and annual relocation rates for jobs. Geographic units maintain accounting of real estate and occupants, linking households to housing units, and jobs to job work-places. Additional information can be added such as development types, development events, development constraints and target vacancies. Transportation analysis zones are spatial entities. This data is usually updated with the results of an external travel model run. Additional information is travel data (composite utility of going from one location to another given the available travel modes for a specific household type). Buildings of all kinds are represented separately and linked to the geographic unit used for location choice.
UrbanSim is described as an urban simulation system, consisting in a software architecture for implementing models and a family of models implemented and interacting within this environment. Model components reflect the key choices of households, businesses, developers and policy makers, and their interactions within the real estate market. The accessibility model is responsible for maintaining accessibility values for occupants within each traffic analysis zone, including accessibility by residents and employees to shopping and other amenities, to employment, and to the central business district. The demographic transition model simulates births and deaths in the population of households. Household births are added to a list that will be located later by the household location choice model. Household deaths are selected at random and removed from the housing stock, and vacancies are created. The economic transition model is responsible for modelling employment creation and loss; and is analogous in form to the demographic transition model. The household mobility model simulates households deciding whether to move. This model is implemented as a cross-classification rate-based model, with a probability of moving determined by age and income category of each household. The employment mobility model determines which jobs will move from their current locations. The employment location choice model is responsible for determining a location for each job that has no location. The model is based on a Multinomial Logit Model structure to generate location choice probabilities across a random sampling of location alternatives. Probabilities are used with Monte Carlo Sampling to make a determination for each job regarding which of the available locations they will choose. The Household Location Choice Model chooses a location for each household that has no current location using a similar approach to the employment location choice model. The Real Estate Development Model simulates developer choices about what kind of construction to undertake and where, including both new development and redevelopment of existing structures. The Land Price Model simulates land prices as the characteristics of locations change over time. It uses a hedonic regression structure, which is a multiple regression, estimated using Ordinary Least Squares (OLS) normally with the price specified as a log of price. UrbanSim can gather, aggregate, and export data of specific simulation years to a set of external files for subsequent analysis and graphical display. Outputs are created at the geographic unit level, and also summarised for the region as a whole. The data is written in a standard format for ease of loading into ArcView, Excel, or other common desktop tools.
Salt Lake City in Utah is an UrbanSim project that was commissioned to evaluate the implementation of the integrated UrbanSim land use model with the Wasatch Front Regional Council (WFRC) four-step travel model. The study area, The Greater Wasatch Front Area, has important physical constraints that limit the supply of developable land to accommodate the projected growth of the region's population and employment. The implementation of such model was urgent to better estimate the impacts of several transportation schemes that have been proposed to respond to the increased capacity and travel demand. A Peer Review Panel, consisting of experts in land use and transportation modelling, was created in 2003 to evaluate the LUTI model developed and make recommendations on its use for operational projects. For this evaluation, a series of sensitivity tests was undertaken. Each of the sensitivity tests were run using the LUTI model to a forecast year of 2030, with the land use model UrbanSim running every year (from 1997 as the base year) and the

D1.1 Review of new forms of mobility, freight distribution and their business models; gaps identification in KPIs and SUMPs
148
transport model running every three or five years. The results for each of the scenarios were compared to a corresponding reference case and the land use impacts were estimated. Developing such an operational integrated model is a tedious task but the outcome of this project has been successful and has demonstrated the importance of LUTI models in decision making processes. This example is an early development of UrbanSim and since then it has been refined and uses a much more modular approach via the Open Platform for Urban Simulation (OPUS) platform.
UrbanSim models have been developed in many places worldwide with the operational ones mostly currently used in North America. As UrbanSim brings an important interest amongst researchers, many prototypes have been developed in universities. Since December 2012, Synthicity (http://www.synthicity.com/) coordinates the development of UrbanSim and provides consultancy services to support its applications. The first application of UrbanSim, implemented in Java, was a prototype model for the Eugene-Springfield (Oregon) area. Other applications have been developed for various U.S. cities such as, amongst others, Detroit (Michigan; Salt Lake City (Utah); San Francisco (California), and Seattle (Washington). UrbanSim has also been applied in Europe with prototypes being implemented for Paris (France), Brussels (Belgium) and Lyon (France).
PECAS (Hunt and Abraham, 2005): PECAS (Production, Exchange and Commodity Allocation System) was developed in 1999 and used initially for Oregon, and Alberta (Canada) by the University of Calgary. It is a land use transport model (LUTI) and has been used as a statewide model, not just concentrating on urban areas like most others. It can be considered to be based on the concepts behind MEPLAN and TRANUS. The model is an aggregate model and has two modules – activity allocation and space development. Transport supply can be modelled with input from a pre-existing travel demand module, separate from PECAS.
The main table breaks out commodities by consumers/producers. It is split into three sections – make, import/export and use. The activity allocation uses this data. Goods exchanges are managed by a second table – transportation supply. Land and space are considered non-transportable goods so are shown separately. There is also a land development table showing land available for each business/consumer type, and space consumption patterns. Discrete areas are zoned for the model. In the case of the Alberta model, three link-based transport networks are used (highway, railway, pipeline) – the latter due to oil/gas transport associated with parts of the region.
There are two kinds of production activity, known as “make” relationships in the model – commodity production by industry, established by the input/output tables in the configuration, and labour supplied by households, from employment data. There are five kinds of consumption activity, known as “use” relationships – industrial use of goods/services, household use of good/services, labour use by industry, floorspace use by industry and floorspace use by households. In addition there are imports/exports from outwith the region.
The model is calibrated by initially estimating in isolation, and then specifying, two sets of parameters. The first set “S1” is static, the second set “S2” is varied by the model itself during repeated runs, to move towards a best fit with the targets. A third stage re-evaluates some of the “S2” parameters – these are re-designated “S3” and the model is re-run. It is acknowledged that model calibration is “challenging”, and a Bayesian approach is typically taken. Subsets of the model can also be run. Results (economic measures and items locations) are output to a spatial database. As well as specific locations, the outputs include economic performance measures, including summary results across the region being modelled. The model was initially developed and run for the province of Alberta – including both urban and rural areas. The model is continuing to be refined and the S2 and S3 parameters calibrated. It has been used in Ohio and Oregon (statewide) and Calgary and Edmonton (urban area) as well as the basis of design for a model of the Los Angeles Region.
The PECAS software is open-source code, licensed under the Apache 2.0 Licence. The "demonstration model", based on Baltimore, is freely available on request from HBA Spectro Incorporated. This is a full running model containing the software (including source code), along with example inputs and an open-source assignment procedure so that a separate transport demand model is not required to run the system through time.
D1.1 Review of new forms of mobility, freight distribution and their business models; gaps identification in KPIs and SUMPs
149
METROSCOPE (Conder, 2000): MetroScope is a set of decision support tools to model changes in measures of economic, demographic, land use and transportation activity within the Portland metropolitan area. It is comprised of four models and a set of GIS (geographic information system) tools. The economic model predicts employment by type of industry and the number of households by demographic category.
The travel model predicts travel activity levels by mode (bus, rail, car, walk or bike) and road segment, and it estimates travel times between transportation analysis zones (TAZ) by time of day. It also produces a measure of the cost perceived by travellers in getting from any one TAZ to any other. The residential real estate location model predicts the locations of households. The non-residential real estate location model predicts the locations of employment. Both real estate models measure the amount of land consumed by development, the amount of built space produced and prices of land and built space by zone in each time period. MetroScope is based on a set of equations reflecting a fairly straightforward neoclassical demand and supply structure with a requirement that we find a price for each location and real estate type that matches demand and supply.In MetroScope (as in most such models) all the demand and supply equations in addition to whatever other variables are included also include the price variable by location and real estate type. Demand responds negatively to an increase in price and supply responds positively to an increase in price. Consequently, supply and demand do not automatically match one another. The model must adjust prices iteratively for supply and demand to match for all locations and real estate types and the market to clear. In MetroScope statistical fitting of equations constitutes about 20 – 25% of the work. Establishing the equation structure, calibration to base year initial conditions and insuring the model iterates to a stable, consistent equilibrium in each forecast period constitute most of the MetroScope development effort.The GIS database and tools contain land and development data and maintain the spatial relationships between data elements. They also map data between different zone systems. Quite detailed documentation includes a model overview, purpose, schematic, interactions between models and the land data, strengths and weaknesses of MetroScope and appendices: A. Land data used by MetroScope; B. How Metro determines vacant land; C. How land data are processed in MetroScope; D. Residential model equations and parameter estimates; E. Nonresidential model equations and parameter estimates; F. Portland-Vancouver metropolitan area regional economic model.
CUBE (Vorraa, 2004): Cube is a family of software products for transportation planning. In particular, Cube Voyager provides a library of functions for the modelling and analysis of passenger transport systems: roadways, public transit, pedestrians and bicycles. Cube Voyager is designed for the forecasting of personal travel using a modular and script-based structure allowing the incorporation of standard four step models, discrete choice and activity-based approaches. To start, Cube needs a set of inputs associated with travel demand and transport system data. Information on the travel demand data consists of zonal data, record data, and Origin Destination (O-D) matrices. Transport system data consists of road nodes and links, public transport stops and lines with their timetables. Cube contains four alternative calculations for the demand modelling:
The standard four stage traffic model. Trip generation using regression, cross-classification and trip rate. Trip distribution uses gravity models or FRATAR method. Mode choice using specific and nested logit models. Traffic assignment using any of the following methods: all or nothing, capacity restraint, intersection based capacity restraint, stochastic/ probabilistic, incremental, equilibrium or dynamic.
Modified four-step with feedback. Such modifications include car ownership models, combined mode and destination choice and iterative feedback for model equilibrium.
Activity-based demand using travel tours.
Combined equilibrium models.
Default outputs in the form of matrices and reports are used to compare and contrast highway and public transit networks and their variables; present estimations of travel flows, delays and queues in urban locations; present times, costs, distances by mode and component within others. Cube is reported to have been used in San Francisco (United States), Atlanta (United States), Salt Lake City

D1.1 Review of new forms of mobility, freight distribution and their business models; gaps identification in KPIs and SUMPs
150
(United States), Dublin (Ireland), Bolzano (Italy), Stuttgart (Germany), Seville (Spain) and Madrid (Spain).
As a suite of software modules Cube Voyager is complemented with the following modules: Cube Base for transportation GIS, model development, and scenario development; Cube Avenue for test different operational responses, compare policies, and examine emergency evacuation plans; Cube Dynasim provides a multimodal microsimulation system; Cube Land contains a library of programs for forecasting land use; and Cube Cargo for forecasting regional and long-distance commodity flow and truck demand.
ILUTE (Salvini and Miller, 2005): The Integrated Land Use, Transportation, Environment (ILUTE) modelling system was developed at the University of Toronto in Canada by Eric Miller in 1997. It is a microsimulation-based model. Temporal data (e.g. house price fluctuations) is supplied into the model by text files. Population data can be synthesised directly within the model from a simple specified population, or by zone from census demographic data. Money values (allowing for inflation) can also be input. ILUTE uses travel time data supplied by the EMME/2 model. Currently ILUTE does not calculate travel times directly.
The model’s population can be described by three types of agents – Persons, Households (a group of Persons living in a single place) and Decision Making Units (DMU) which have one or more people in a household who make decisions, such as where and when to move. All households are made up of one or more of three types of DMUs – Spousal families, single-parent families and single adults. The model is very fine grained and associates various variables with each DMU, such as stress (for example, an agent with high stress, may be more likely to move house to be closer to work) and wealth accumulation.
The model’s economic activity can be described similar with three kinds of agents – Firms, Establishments (the part of each firm in a single location) and Jobs, which are located in Establishments. A regional I/O model is used to drive the economic activity in the model. The transport network is used in the model to manage the exchange of goods and services between firms and the population (or other firms). Each household or establishment has a Building, which is in a zone (this manages the data input into the model, as this is not normally disaggregated sufficiently to individual buildings.) Agents switch between passive and active states. When an agent is active and interacting with market, it also evaluates nearby alternatives. A transaction also does not necessarily take place if the buyer/seller do not agree prices, and the buyer will remember their failed transactions when carrying out further ones.
There are four kinds of processes which take place during model operation – demographic, triggering, search and market bid/accept interactions. ILUTE can output its results to a 3D software package called Houdini. An operational prototype has been tested with the Greater Toronto Area.
TIGRIS XL (Graaff and Zondag, 2012): TIGRIS XL was developed from 2002 to 2005 during the course of several sequential projects for The Transport Research Centre in the Netherlands. Significance (part of RAND Europe at the time) and Bureau Louter are the main agencies of the model development. TIGRIS XL is a LUTI model using the National Transport Model (LMS) of the Netherlands. It is a dynamic and incremental model (simulating in time steps of one year) that allows analysing how the system evolves over time. As general equilibrium is not possible in this type of land use modelling approach, partial equilibrium conditions are used (e.g. to match the supply and demand on the housing market within a year). The model works at two spatial scale levels: the municipality level and the LMS sub-zones (1,308 sub-zones for the Netherlands)
TIGRIS XL is composed of five modules addressing demography and spatial markets. The demographic module deals with births, deaths, ageing of the population and changes in household composition at a local level, but also processes the distribution of migration flows. The land-market and real-estate market module processes land-use, building and floorspace changes. The simulation can be based on a regulated land-use planning system using exogenous inputs on development sites, or in a non-regulated market calculating endogenously the size and location of development sites.

D1.1 Review of new forms of mobility, freight distribution and their business models; gaps identification in KPIs and SUMPs
151
The housing market module simulates annual household moves – the choice to move or stay, and the choice of location following a move. The choices depend on various variables such as household composition, prices, local area facilities and accessibility between the old and new location. The parameters for the location choice function have been estimated from a large housing market survey of more than 100,000 households in the Netherlands. The labour market module processes the employment changes by economic sectors and the workforce changes at both regional and zonal levels. Historical dataset from 1986 onwards has been used to estimate parameters on employment. The transport module estimates transport demand and accessibility changes and is integrated to the LMS model as mentioned previously. The LMS model is based on micro-economic utility theory allowing the derivation of utility-based accessibility measures.
The model has a three-layer structure that consists in land, objects (e.g. dwellings) and activities (e.g. people, jobs) and can forecast different government policy impacts according to the settings implemented (free-market or regulated development). TIGRIS XL model is used to evaluate the spatial economic impacts of transport and spatial planning policies. It has been originally developed for the Netherlands, but its modular structure allows the model to be implemented in any other urban regions. It has been applied to various studies in the Netherlands, and was also used in the UK in the development of a Generic Urban Model (GUM).
UPlan (Johnston and Gao, 2003): UPlan is a GIS-based framework for land-use/transport modelling. By using GIS data directly, the model can be run at a very fine-grained resolution – the resolution of individual buildings defined in the GIS rather than area zones often used by other models. The ArcView GIS is used to drive the model. Careful calibration of a UPlan model is required. Inputs are vector GIS datafiles (e.g. shapefiles) and grid-based rasters with fields of values.
All computations in UPlan are defined as GIS operations rather than processing of tabular data. UPlan is primarily useful for modelling “new footprint” development, rather than land-use alterations to existing developed land. A mask is used to remove undevelopable land, either because of physical features (e.g. lakes) or urban areas that are already built on. Attraction and discouragement grids (surfaces) are overlaid. An application of UPlan to the Delaware Valley Regional Planning is available from the project’s webpage, along with a user manual. ArcGIS 9.3 or 10 is required.
ReVISIONS (Jin et al., 2013): ReVISIONS (Regional Visions of Integrated Sustainable Infrastructure Optimised for Neighbourhoods) was an EPSRC-funded project led by the Martin Centre at University of Cambridge (UK). The project started in March 2008 and finished at the end of 2012. The aim was to provide expertise for both public sector and private firms in the field of regional and local development planning. During the course of this project, an integrated land use and transport model has been developed for the UK. The land use model is based on the MEPLAN package and extends its modelling capabilities to infrastructure measures such as energy, water, waste and transport.
The model is designed to predict land-use and spatial interaction patterns across the UK with the ability to disaggregate the modelled outputs to a specific region and to link regional planning to neighbourhood design for strategic assessment purposes. At a regional level, scenarios can be run to assess for example the growth in population or new transport infrastructure impacts; and at a local level to describe urban forms and assess changes for several infrastructure measures such as energy, waste, water, etc.
One characteristic of the model developed during the ReVISIONS project is the use of generic tiles of one hectare each to represent and describe variables such as density of plots, building stocks, domestic energy demand etc. The model is based on an advanced Social Accounting Matrix, an extension of the Input-Output Tables. The model solutions for employment location, residential location and transport demand are worked out at a spatial equilibrium subject to land use and transport constraints. There are complex interactions and feedback effects between the various sub-models.
The current version of the model has a base year of 2001 and is forecasting results to 2031. Forecasts to 2051 are also available, but with less details. The model outputs many forecast variables
D1.1 Review of new forms of mobility, freight distribution and their business models; gaps identification in KPIs and SUMPs
152
depending on the type of scenario that has been implemented. The following list is an example of available forecast outputs.
land use modelling (employment and household location, GVA, costs of living and production);
transport (travel time and costs, energy consumption and emissions);
tiles (buildings, floorspace, land areas, occupancies);
buildings (energy demands);
energy conversion (costs and emissions);
water (water demands and supply technologies costs, CO2 emissions, and potential of decentralised measures to reduce water stress);
waste (waste arising, energy and nutrients recovery, materials recycling and global and UK GHG emissions).
The current model has mostly been applied to the Greater South East region of England during its development, but could be applied to any region. Local scenarios for Chelmsford and Cambridge have been implemented to assess the impacts of various policies. ReVISIONS is a specific use of the MEPLAN rather than a standalone model. ReVISIONS is the precursor to LUISA developed by the same group.
LUISA (Echenique et al., 2013): LUISA is a land-use interaction within a social accounting framework. Random utility modelling has been established as one of the main paradigms for the implementation of land-use transportation spatial interaction (LUTI) models. A detailed formal description of a LUTI model adheres to the random utility paradigm through the explicit distinction between utility and cost across all processes that represent the behaviour of agents. The model is rooted in a social accounting matrix, with the workforce and households accounts being disaggregated by socioeconomic type. Similarly, the land account is broken down by domestic and nondomestic land-use types. As such the model is the latest in a line of models from MEPLAN to TRANUS, DELTA, PECAS and so on.
The model is developed around two processes. Firstly, the generation of demand for inputs required by established production; when appropriate the implicit production functions are assumed to depend on costs of inputs, which give rise to price-elastic demands. And, secondly, the spatial assignment of input demand to locations of their production; here sequences of decisions are used to distribute demand both spatially and aspatially, and to propagate costs and utilities of production and consumption that emerge from imbalances between supply and demand. The implementation of this generic model is discussed in relation to the case of the UK.
The model has been developed for testing the sustainability of integrated economic, spatial development policies, and output information for estimating urban form and the potential for decentralised technologies. The inputs include area-wide socioeconomic forecasts and the allocation policy of urban land. The outputs include the spatial allocation of activities and prices of labour, goods and services, land, and floorspace. They are combined with the land inputs to estimate the changes in the density of urban form and activities. These outputs can then be used to estimate the demands for infrastructure services and the potential for decentralised infrastructure supply. We focus primarily on the calibration process and its methodological implications, including a method of refining the calibration and demonstrate how this improves the spatial representation of the utility of land. (This is taken from the abstract of the published paper above). The model is currently being used to examine scenarios in the Cambridge region and has been used at scale to look at regional planning scenarios for the UK space economy in the UK 2070 Commission.
SILO (Moeckel, 2017): SILO is a simple yet powerful land-use model that is fully integrated with a travel demand model. This allows representing the full land-use/transportation feedback cycle. It is a microscopic model, enabling the integration with both aggregate (or four-step) and disaggregate (or activity-based) travel demand models. SILO is written in Java and open-source. SILO is perhaps the most recent LUTI model that verges on being an ABM and microsimulation model. In fact, it is a land-use model that is designed as a discrete choice microsimulation model. Discrete choice in this context

D1.1 Review of new forms of mobility, freight distribution and their business models; gaps identification in KPIs and SUMPs
153
means that decisions (such as a decision of a household to move to a new dwelling) are modelled explicitly based on the benefit or utility at the current dwelling location and expected utilities at alternative dwelling locations.
Being a microsimulation model, every household and person is simulated individually. SILO models household relocation, non-spatial demographic changes (such as birth, aging, marriage or having children), developers' decisions to build new residential buildings and change of dwellings over time (including renovation, deterioration and demolition). It is calibrated to closely match observed land use changes from 2000 to 2010 (so-called backcasting), to reasonable model population changes in the future to the year 2040.
SILO is built as a middle-weight tool. It is fully integrated with a travel demand model, and therefore, more complex than sketch-planning tools (such as UPlan). On the other hand, it is built to function with less rigorous data collection and estimation requirements than traditional large-scale land-use models (such as PECAS or UrbanSim), making SILO simpler to implement.
SILO is an open-source software and was initially developed with funding by Parsons Brinckerhoff. The prototype application was implemented for the Metropolitan Area of Minneapolis/St. Paul, Minnesota. Next, NCSG implemented an improved version for the State of Maryland. Currently, an updated version is implemented for the Munich Metropolitan Area in Germany by the research group Modeling Spatial Mobility at TUM. SILO provides a GUI (Graphical User Interface) to facilitate model applications. A visualization tool allows easy analysis of model results.

D1.1 Review of new forms of mobility, freight distribution and their business models; gaps identification in KPIs and SUMPs
154
Annex 3 - Detailed review of service controllers for passengers operations optimization
Table 36: Service controllers for passengers operations optimization
Authors Service Type Operational problem/study
focus
Methodological approach Case study; Demand and
Network settings Linares et al. (2016)
Shared taxis/vans
Centralised time-dependent fleet dispatching and routing
Variant of pick-up and delivery problem with time windows; time-dependent shortest paths; Dynamic insertion heuristics Aimsun23 microscopic simulator
Barcelona Central Business District, Spain; stochastic demand (car demand); calibrated network model for CBD
Mora et al. (2016)
Shared taxis and vans
Centralised real-time multiple passenger assignment and vehicle routing
4-step algorithmic process; pair-wise request-vehicle shareability graph graph of feasible trips and vehicles that can serve them optimal vehicle assignment to trips - integer linear problem relocation of idle vehicles.
New York, USA; historical taxi demand data converted in requests; static average network travel times
Martinez et al. (2015)
Shared taxis Centralised real-time vehicle dispatching
Rule-based constrained optimization Agent-based model
Lisbon, Portugal; taxi demand extracted from Lisbon-wide survey in 2004; static network travel times extracted from Aimsun microsimulator
Boyaci et al. (2017)
One-way electric vehicle station-based carsharing with reservations
Vehicle and Personnel relocation; maximisation of served requests; minimization of relocation cost
Combinatorial optimization and simulation framework in following sequence; station clustering algorithm – k-medoid algorithm operations optimization -multi-objective mixed integer linear program personnel flow minimization simulation model to check feasibility and consider charging requirements
Framework implemented in Nice, France for VENAP Auto Bleue; stochastic randomized data; static network travel times
Alfian et al. (2017)
Reservation-based one-way station-based carsharing
Vehicle Relocation 3 relocation strategies tested an event-based simulation environment: No relocation Relocation at the end of the day Forecasting relocation in the beginning of the day-Multilayer Perceptron (neural network model)
Case study for Seoul, South Korea; stochastic demand based on data from carsharing company (Han Car)
Ghosh et al. (2017)
Station-based bike-sharing
Dynamic repositioning and routing problem to reduce lost demand
Mixed Integer Linear program formulation to capture the tradeoffs between the maximization of serviced demand and the minimization of routing cost; dual decomposition mechanism to create and solve sequentially two sub-problems bike repositioning problem and a vehicle routing problem; abstraction mechanism to cluster the base stations and reduce the size of the problem and computational time.
Simulation case study for Washington DC, USA; stochastic demand data from Capital Bikeshare company and static travel network travel times
23 https://www.aimsun.com/

D1.1 Review of new forms of mobility, freight distribution and their business models; gaps identification in KPIs and SUMPs
155
Authors Service Type Operational problem/study
focus
Methodological approach Case study; Demand and
Network settings Dubernet and Axhausen (2014)
Station-based Bikesharing
Bike redistribution evaluation
Agent-based simulator MATSim (Horni et al., 2016) extended with bike-sharing system components as agents. 2 cases tested; 1. No redistribution, 2. Ideal redistribution Multimodal context
Simulation study for Zurich Urban Area, Switzerland; demand models calibrated with data collected for Zurich in 2010; highly disaggregate network model for Zurich Urban Area
Horl et al. (2018)
Autonomous taxi service
Vehicle dispatching and rebalancing algorithms
MATSim agent-based simulator extension with a designated controller; two dispatching strategies: 1. Load-Balancing heuristic proposed by Bischoff and Maciejewski (2016), 2. Global Euclidean Bipartite Matching (Hungarian algorithm); two relocation strategies:1. feedforward strategy proposed by Pavone et al., 2011 and a novel derivation of it.
Case study for Zurich, Switzerland; car and public transport demand data happening in Zurich are extracted from survey; virtual network
Hyland and Mahmassani (2018)
Shared-use on-demand autonomous taxi service
Vehicle Assignment and Routing redistribution
Combination of mathematical programming approach with agent-based simulation; 6 assignment strategies:1. first-come-first-served to the longest idle AVs, 2. FCFS to the nearest idle AV, 3. only unassigned travellers and idle AVs are considered for assignment, 4. both unassigned and assigned travellers as well as idle and en-route pick-up vehicles are considered, 5) both unassigned and assigned travellers as well as idle and en-route drop-off vehicles are considered and 6) all travellers and all AVs are considered
Case study with taxi demand data from Chicago, Illinois and assumption of a Manhattan grid network
Fagnant and Kockelman 2018
Shared on-demand autonomous taxis with ridesharing options
Ridesharing, fleet size and operators’ profitability
Agent-based simulation of 4 primary modules: 1.an SAV location and trip assignment module, 2.an SAV fleet generation module, 3.an SAV movement module and 4.an SAV relocation module; backward-modified Dijkstra algorithm to both dispatch and route SAVS to pick-up and drop-off travellers; Heuristic relocation approach based on based on block-based network representation; Golden Section Search optimization procedure for fleet optimization
Case study for Austin,Texas; synthetic population of one-way trips fed to the MATsim simulation software to generate existing travel conditions for a full week-day and extract average travel speeds; stochastic demand based on travel pattern data from Austin
Azevedo et al. (2016)
Station-based autonomous taxi service
Station locations, vehicle assignment policies and relocation polices of the service
Agent-based simulator SimMobility extended with AMOD controller; Fleet size problem formulated as set covering problem; Assignment strategies: 1. Greedy assignment, nearest vehicle to request assigned, 2. Minimum weight Bipartite Matching algorithm (Hungarian algorithm) Relocation: mathematical problem to minimize relocation cost based on anticipated demand
Car-restricted zone case study in Singapore; HITS data used and car trips in CBD converted to AMOD trips; network calibrated based on taxi GPS traces collected from Singapore

D1.1 Review of new forms of mobility, freight distribution and their business models; gaps identification in KPIs and SUMPs
156
Authors Service Type Operational problem/study
focus
Methodological approach Case study; Demand and
Network settings Shen et al. (2018)
Integrated public transport services with autonomous vehicles on demand ridesharing services Replacements of low demand bus routes with the ridesharing AV service for first and last-mile
Fleet sizing, ridesharing, vehicle dispatching and relocation
Agent-based simulation model development; Dedicated controllers (agents) for both AV and bus operations; Rule-based approach;
Singapore case study; stochastic demand based on LTA (public transport authority) demand data for the repurposed bus routes; static network conditions data
Basu et al. (2018)
Integrated public transport services with autonomous vehicles on demand single and ridesharing services (AMoD) AMoD service used as both door-to-door and first-/last-mile to train
Integrated demand and supply simulation of AMOD services restricted to ABD area
Agent-based simulation platform SimMobility; Iterative demand and supply simulation approach for output convergence; Controller agents emulates AMOD operations like matching and dynamic fleet sizing
Virtual city network with demand patterns and resembling the ones from Singapore
Atasoy et al. (2015)
Flexible Mobility on-Demand (FMoD); Integration of taxi, shared taxi and fixed route demand-responsive transit services
Vehicle scheduling and routing, assortment optimization and mode choices; pricing
2-stage optimization problem 1.Feasible product generation with capacity and scheduling constraints 2.Profit and consumer surplus maximization mathematical program for optimized menu generation with multinomial logit model
Case study for Hino. Japan; stochastic demand data with static travel times

D1.1 Review of new forms of mobility, freight distribution and their business models; gaps identification in KPIs and SUMPs
157
@Harmony_H2020
#harmony-h2020
For further information please visit www.harmony-h2020.eu