energy, mobility & freight transport
TRANSCRIPT
SA National Energy Development Institute GREEN TRANSPORT
Carel Snyman [email protected]
Energy, Mobility &
Freight Transport

SANEDI: Green Transport
Developing energy solutions in Transport
considering:
– the energy used and
– the technologies applied
to do work - moving people and freight
“Green” is lean and clean
(energy efficiency and reducing energy emissions)
move away from paying forex for imported energy and
develop local energy supply
stimulating local industrial development job creation


Transport energy consumption:
Mode MJ/Passenger.km MJ/Ton.km
Walking 0,2 3
Cycling 0,16 1,5
eBike 0,06 0,4
City Car 0,5-2,0 1,4
Diesel Bus 4,07
Trolley Bus 1,87
Tram 0,3
Rail 0,2-1,7
Plane 1,4-2,3 1,8

Trends:


Direct
Transport
Mining
Commerce
Industry
BP SHELL CALTEX ENGEN
E
S
K
O
M
CRUDE
OIL
C O A L
PRODUCTION
LOSSES
CONSUMPTION
LOSSES
Agriculture
Domestic
USEFUL
ENERGY
S
A
S
O
L
South Africa’s energy balance

South Africa’s energy demand
Economic Sector 2010 2050
Industry 37 34
Mining 8 4
Agriculture 3 3
Commerce 7 7
Residential 11 8
Transport 34 44
DoE

Transport energy use & impact
52 36
10 2
Petrol
Diesel
Jet Fuel
Electricity

Well to Wheel GHG emissions in gCO2eq./km

CNG
Electricity


Where does Energy come from?

P
e
r
s
p
e
c
t
i
v
e
TW.yrs

How much energy/hectare/year?
Photosynthesis: 2% of 20’000GJ/ha and cultivation period 400GJ/ha/yr
Processing:
50-135GJ BioFuels/ha/yr
(BioEtOH, BioDiesel, BTL)
Distribution & Combustion: 35% (Fuel to Wheel)
18-47GJ/ha/
year
PV Cell to grid: 10% efficient
3’600GJ/ha/yr
Inverter {dc ac} 90% efficient
3’050GJ available for car battery
From battery to wheel: 60%
efficient
1’800GJ/ha/year
Solar beats Biomass 40-100 times!

21 500
22 500
60 000
67 000
325 000
0 100000 200000 300000 400000
BioDiesel
BioEthanol
BioMass to Liquid
BioGas (corn)
Electric (PV)
Kilometres per Hectare
Kilometres per Hectare
EV - 16kW/100km SI – 7,4 L/100km CI – 6,5 L/100km


Potential of solar energy


The Car
Top speed 170km/h
0-100 in 8 seconds
Range of 600km
Petrol 8L/100km
Mass: 2’000kg
40kgCO2/100km
Limit = 60km/h
Need only 150km
Need only 14s
400kg can do


2
4 Wrong energy & wrong technology for mobility work
15%

Speed Time to travel
km/h 30km Time Saving: 60 30
80 23 7min
100 18 5min
120 15 3min
Aerodynamic DRAG and energy consumption

Freight rail

Lowest rolling resistance:

Energy efficiency: Truck vs Rail
Rail is 3,5 x efficient

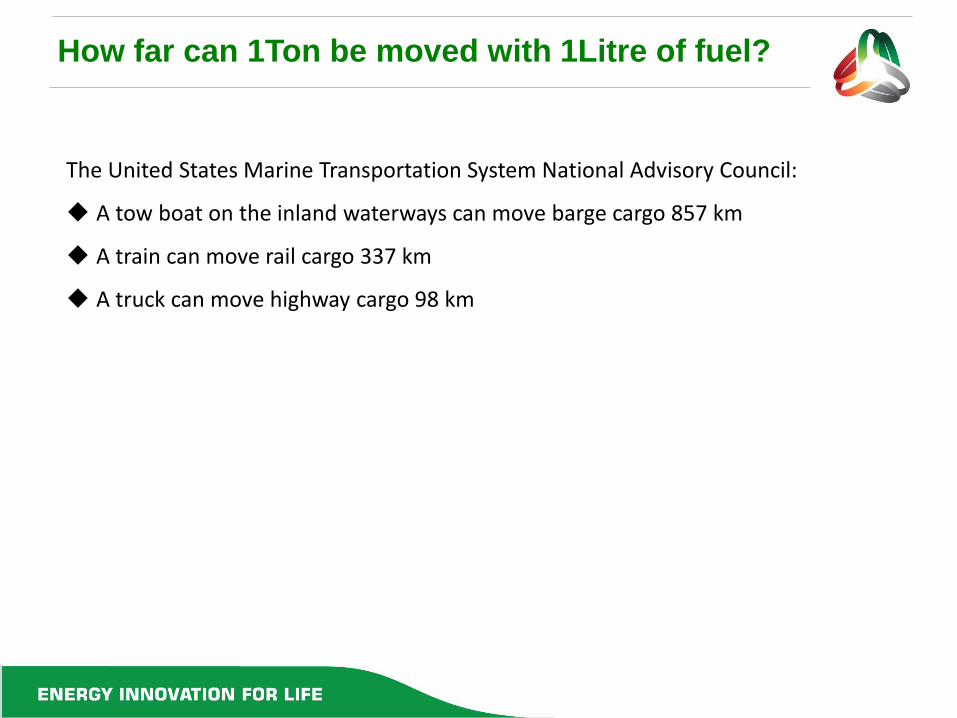
How far can 1Ton be moved with 1Litre of fuel?
The United States Marine Transportation System National Advisory Council:
A tow boat on the inland waterways can move barge cargo 857 km
A train can move rail cargo 337 km
A truck can move highway cargo 98 km

Measures of transportation work
Work = People x kilometres = P.km
P.km/MJoule - Efficiency
P.km/CO2 - Carbon Emissions
P.km/Rand - Cost (Forex)
P.km/Hour - Time
P.km/m2 - Space

Road: Modes & energy performance
Mode Energy Number % Load
Capacity Unit
/100km MJ/P.km MJ/T.km
gCO2/P.km gCO2/T.km
Car Petrol 4'455'038 57% 1.4 9.0 2.19 153.77
Diesel 184'407 2% 1.4 7.0 1.90 119.60
SUV Petrol 442'621 6% 1.4 14.0 3.40 239.20
Diesel 279'222 4% 1.4 11.0 2.99 187.94
LCV Petrol 1'103'608 14% 0.5 13.0 8.84 621.92
Diesel 700'265 9% 0.5 10.0 7.60 478.40
MCV Petrol 5'991 0.1% 2.5 33.0 4.49 315.74
Diesel 131'425 2% 2.5 25.7 3.90 245.58
HCV Diesel 198'134 3% 15 38.0 0.96 60.60
MBTaxi Petrol 260'577 3% 14 15.0 0.36 25.63
Diesel 13'976 0.2% 14 11.7 0.32 19.93
Bus Diesel 30'033 0.4% 25 33.0 0.50 31.57

Road: Modes & Energy Impacts
Mode Energy Number % Vkm/ year
MP.km MTkm
Mlitre GJ % GJ MTon CO2
Car Petrol 4'455'038 57% 24'000 149'689 9'623 327 35% 23.02
Diesel 184'407 2% 24'000 6'196 310 12 1% 0.74
SUV Petrol 442'621 6% 24'000 14'872 1'487 51 5% 3.56
Diesel 279'222 4% 24'000 9'382 737 28 3% 1.76
LCV Petrol 1'103'608 14% 25'000 13'795 3'587 122 13% 8.58
Diesel 700'265 9% 25'000 8'753 1'751 67 7% 4.19
MCV Petrol 5'991 0.1% 45'000 674 89 3 0.3% 0.21
Diesel 131'425 2% 25'000 8'214 843 32 3% 2.02
HCV Diesel 198'134 3% 70'500 209'527 5'308 202 22% 12.70
MBTaxi Petrol 260'577 3% 50'000 182'404 1'954 66 7% 4.67
Diesel 13'976 0.2% 50'000 9'783 82 3 0.3% 0.20
Bus Diesel 30'033 0.4% 40'000 30'033 396 15 2% 0.95

Rail transport costs breakdown


Mercedes Benz

• Mobility tool
• It has wheels
• Boat or plane
• Electric motor
• Controller
• Battery or
• Fuel cell
• No CO2!
What is an Electric Vehicle?

Monday Tuesday Wednesday Thursday Friday Saturday Sunday
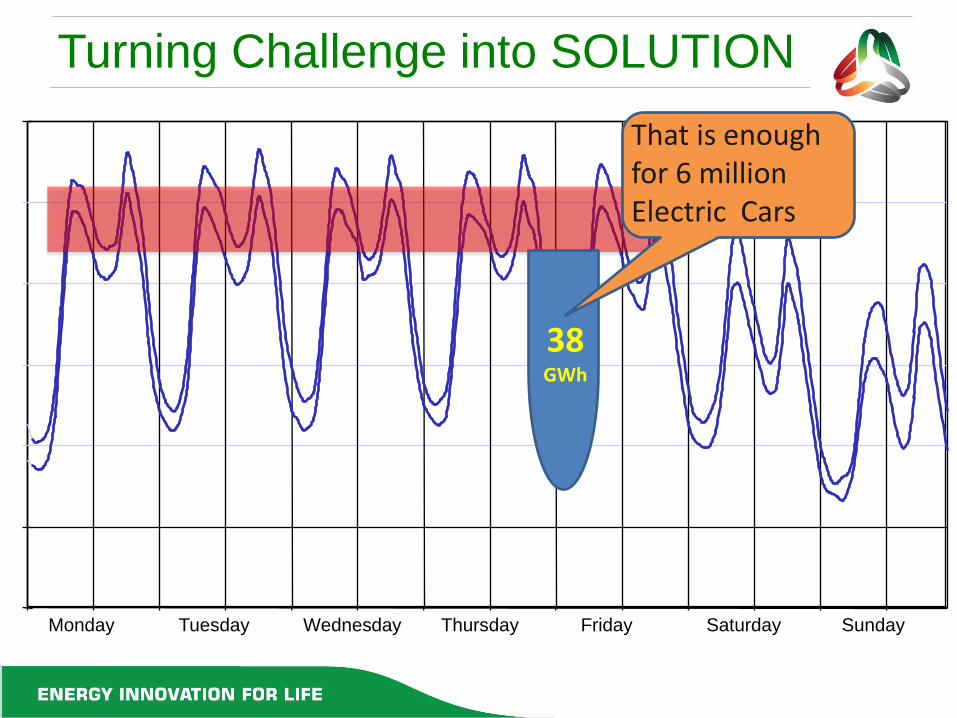
The electricity supply challenge:
Monday Tuesday Wednesday Thursday Friday Saturday Sunday
38 GWh
That is enough for 6 million Electric Cars
Turning Challenge into SOLUTION

City Commuter
Smart Grid

City Car in Motion
Mobility (Shared Use)
City Car at Rest
Energy Storage Device (Renewable Friendly)
80 Cars
500 Cars
City Car to Typical Car Parking Ratio = 6.25 : 1

Urban Commutes
Electric Rail 255
Trolleybus 123
Diesel bus 33
Light motorcycle 25
Smart For 2 cdi 20
Prius 20
eCommuter 60
Individual
Public
Transport!
Performance: Person.km/Energy Unit

Cost, Energy and Pollution
For
100km: Petrol
Car
Price/Unit R 14,00
Units 10 litres
Energy 320 MJ
Cost R 140,00
Electric Car
Normal
R 1,33
15 kWh
54 MJ
R 20,00
GWP
25kg 0 0
7-50kg 39kg 19kg 45kg 39kg 13kg
60c
R3,00
Off-peak &
Small Car
5 kWh
27 MJ

Home & eCommuter
For Every Day Appliance Wh/d MJ/d Cost
Kitchen 8'577 31 R 8,58
Rest 7'720 28 R 7,72
Outside 2'780 10 R 2,78
Total 19kWh 69 R 25
Use of petrol or electricity
MJ/d Cost
pCar 9L/100km
7,2 L 80km/day
205 R 100 R14/L
eCar 15kWh/100km
12 kWh 80km/day
43 R 16 R1,33/kWh
eCom 5kWh/100km
4 kWh 80km/day
14 R 5 R1,33/kWh

How does it work?

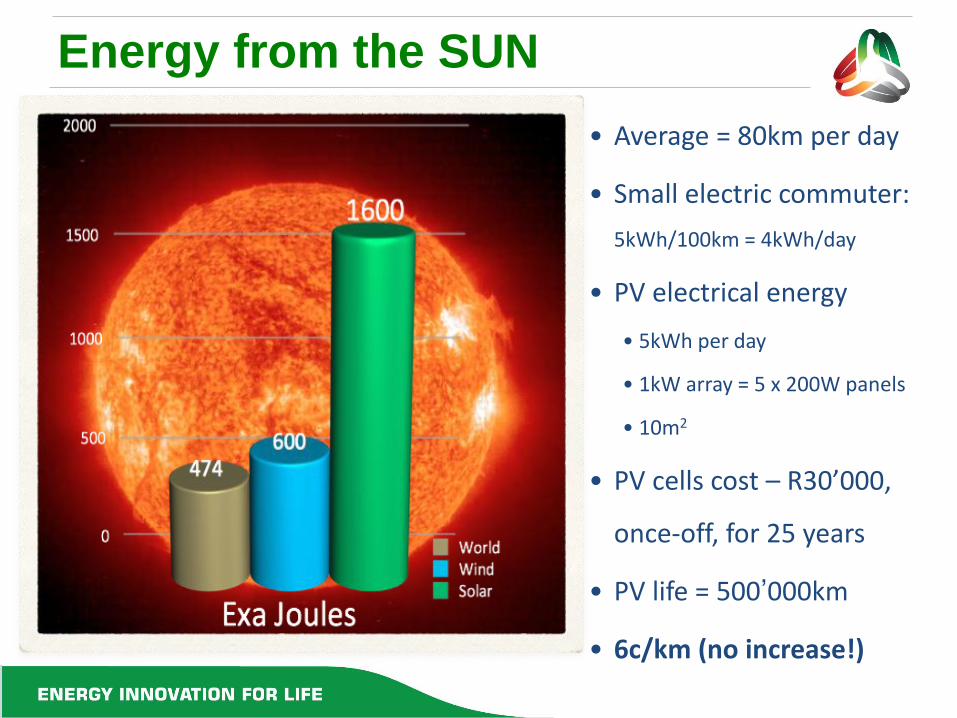
• Average = 80km per day
• Small electric commuter:
5kWh/100km = 4kWh/day
• PV electrical energy
• 5kWh per day
• 1kW array = 5 x 200W panels
• 10m2
• PV cells cost – R30’000,
once-off, for 25 years
• PV life = 500’000km
• 6c/km (no increase!)
Energy from the SUN

SA Solar Challenge 2012
4,457 km
10 Days
Toughest solar challenge in the world
15 Local SA Teams building cars
10 International Teams (Tokai, Nuna, Etc.)

Adelaide Australia – “Tindo” after the Aboriginal word for "sun”
World's first 100% solar-recharged electric transit bus
Seats 27
35kW electric motor
262kWh ZEBRA sodium nickel chloride batteries
11,480kg vehicle, top speed of 75km/hr and an estimated operation range
between fast charges is 200km
Solar powered electric bus
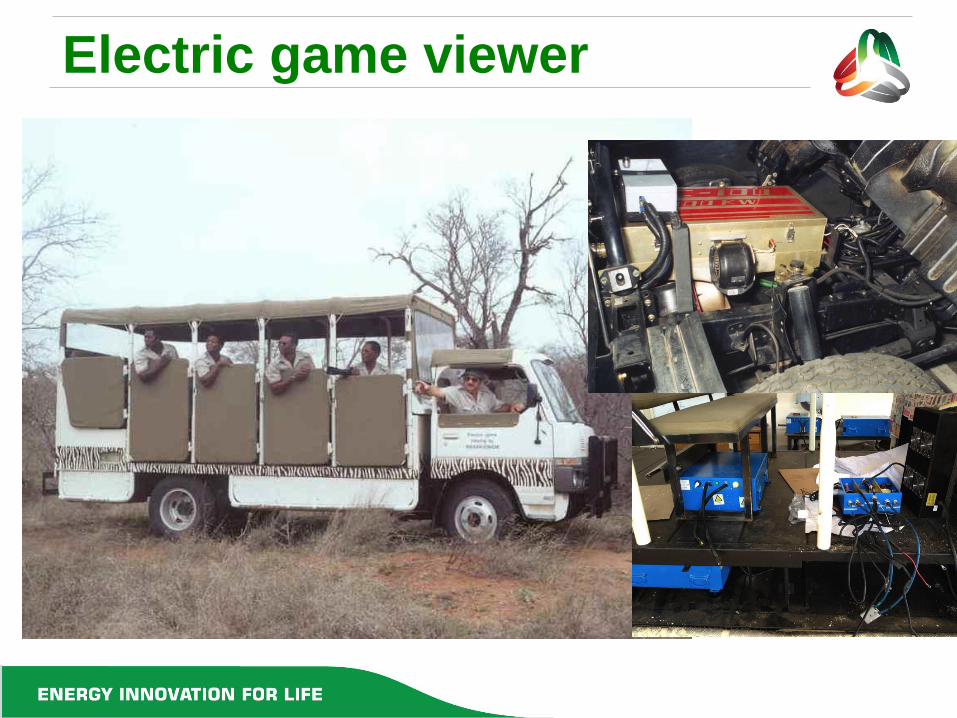
Electric game viewer


electric 30 Ton rock hauler


Technology of Haul Truck (500mt)

Diesel electric locomotive

AC electric locomotive

Futran System


Thank you for your attention!
Any questions?
Carel Snyman +27 11 083 4305