san francisco bay area freight mobility study - … · march 2014 final san francisco bay area...
TRANSCRIPT

March 2014
San Francisco Bay Area Freight Mobility Study
prepared for
California Department of Transportation
prepared by
Cambridge Systematics, Inc.
final report


San Francisco Bay Area Freight Mobility Study
Final Report
prepared for
California Department of Transportation
prepared by
Cambridge Systematics, Inc.
March 2014

California Department of Transportation
Acknowledgments
Funding for this project was provided by the California Department of Transportation, Division of Transportation Planning, State Planning and Research Program. The contents of this report reflect the views of the authors who are responsible for the facts and accuracy of the data presented herein. The contents do not necessarily reflect the official views or policies of the State of California or the Federal Highway Administration (FHWA). This report does not constitute a standard, specification, or regulation.
Project Team: Joe Aguilar, Caltrans Carolyn Clevenger, MTC Todd LaCasse, Caltrans Joanne McDermott, Caltrans Debbie Nozuka, Caltrans Barry Padilla, Caltrans Lee Taubeneck, Caltrans Stephen Yokoi, Caltrans
Consultant Team: Cambridge Systematics, Inc. Michael Fischer Yi Lin Pei Sophie Hartshorn Chiranjivi Bhamidipati Nathan Hutson
© 2014 California Department of Transportation (Caltrans). All rights reserved.


San Francisco Bay Area Freight Mobility Study
California Department of Transportation i
Table of Contents
Acronyms ....................................................................................................................... vii
Executive Summary .................................................................................................. ES-1 ES.1 The Role of Goods Movement in the Bay Area ............................... ES-1 ES.2 Commodities Shipped in the Bay Area ............................................ ES-8 ES.3 The Goods Movement System ........................................................ ES-13 ES.4 Functions of the Goods Movement System, Growth Drivers,
and Key Trends ................................................................................. ES-15 ES.5 Modal Traffic Implications .............................................................. ES-22 ES.6 System Needs and Strategies ........................................................... ES-25 ES.7 Community and Environmental Impacts and Mitigation
Strategies ............................................................................................ ES-33 ES.8 Performance Measures ..................................................................... ES-37 ES.9 Recommended Future Studies ........................................................ ES-38 ES.10 Conclusions ........................................................................................ ES-41
1.0 Introduction ......................................................................................................... 1-1
2.0 Goods Movement and the Bay Area ............................................................... 2-1 2.1 Overview of Bay Area Population, Demographics, and
Economy .................................................................................................. 2-2 2.2 Economic Importance of Goods Movement ....................................... 2-4 2.3 Gross Regional Product (GRP)/Value-Added ................................... 2-9 2.4 Contributions to the Regional Economy from Transportation
Spending and the Role of Goods Movement Service Providers.... 2-11 2.5 Goods Movement Demand ................................................................. 2-12
3.0 The Goods Movement System ......................................................................... 3-1 3.1 Truck Highway System ......................................................................... 3-1 3.2 Freight Rail System ................................................................................ 3-3 3.3 Deepwater Seaports ............................................................................... 3-6 3.4 Cargo Airports ........................................................................................ 3-9
4.0 Functions of the Goods Movement System ................................................... 4-1 4.1 Global Gateways .................................................................................... 4-1 4.2 Interregional Corridors ......................................................................... 4-6

Table of Contents, continued
ii California Department of Transportation
4.3 Intraregional Core System .................................................................... 4-9 4.4 Urban Goods Movement System ....................................................... 4-10 4.5 Last-Mile Connectors ........................................................................... 4-12 4.6 Domestic Air Cargo Systems .............................................................. 4-13 4.7 Overall Growth Forecasts ................................................................... 4-13
5.0 Modal Traffic Implications ............................................................................... 5-1 5.1 Highway .................................................................................................. 5-1 5.2 Rail ............................................................................................................ 5-3 5.3 Maritime .................................................................................................. 5-6 5.4 Air Cargo ................................................................................................. 5-8
6.0 System Needs and Strategies ............................................................................ 6-1 6.1 Global Gateways .................................................................................... 6-1 6.2 Interregional Corridors ......................................................................... 6-7 6.3 Intraregional Core System Issues and Needs ................................... 6-15 6.4 Urban Goods Movement Issues and Needs ..................................... 6-17 6.5 Last-Mile Connector Issues and Needs ............................................. 6-21
7.0 Community and Environmental Impacts and Mitigation Strategies ........ 7-1 7.1 Community and Environmental Impacts ........................................... 7-1 7.2 Mitigation Strategies .............................................................................. 7-4
8.0 Performance Measurement ............................................................................... 8-1
9.0 Recommended Future Studies ......................................................................... 9-1 9.1 Data and Modeling Capabilities .......................................................... 9-1 9.2 Global Gateway Needs Analysis ......................................................... 9-4 9.3 Interregional Corridor Analysis ........................................................... 9-5 9.4 Industry Supply Chain Studies ............................................................ 9-5 9.5 Urban Goods Movement Toolbox and Guidance for Priority
Development Areas (PDA) ................................................................... 9-7 9.6 Freight System Resiliency Study .......................................................... 9-7 9.7 Freight Intelligent Transportation Systems (ITS) and
Technology Applications ...................................................................... 9-8 9.8 Additional Study of Freight and the Environment ........................... 9-9
10.0 Conclusion ......................................................................................................... 10-1
A. Appendix ............................................................................................................. A-1

San Francisco Bay Area Freight Mobility Study
California Department of Transportation iii
List of Tables
Table ES.1 Bay Area Population, Employment, and Housing Projections, 2010 to 2040 ........................................................................................ ES-2
Table 2.1 Bay Area Population, Employment, and Housing Projections, 2010 to 2040 ........................................................................................... 2-3
Table 2.2 Manufacturing-Sector Employment Shares in the Bay Area, 2011 ......................................................................................................... 2-7
Table 2.3 Total Value-Added Generated in Bay Area Economy from Direct Contributions Goods Movement-Dependent Industries (Including Indirect and Induced Value Added in Goods Movement-Dependent and Non-Goods Movement-Dependent Industries), 2011 ................................................................................... 2-10
Table 5.1 Containerized Imports and Exports at the Port of Oakland, 2012 ......................................................................................................... 5-8
Table 7.1 ARB Diesel Air Toxic Control Measures for Heavy-Duty Vehicles, Equipment, and Ships ......................................................... 7-5
Table 7.2 Emission Changes for Port of Oakland, 2005 to 2012 ...................... 7-9
Table 8.1 Recommended List of Short-Term Freight Performance Measures for Bay Area ......................................................................... 8-5
Table A.1 Projects for Bay Area Goods Movement and Functional Needs Identification (in the Order of Mode and Improvement Type) ............................................................................ A-1


San Francisco Bay Area Freight Mobility Study
California Department of Transportation v
List of Figures
Figure ES.1 Average Wages .................................................................................. ES-3
Figure ES.2 Output in Goods Movement-Dependent Industries in the Bay Area, 2011 ........................................................................................... ES-5
Figure ES.3 Employment in Goods Movement-Dependent Industries in the Bay Area, Millions of Employees, 2011 .................................... ES-6
Figure ES.4 Bay Area Freight Flow Volumes by Commodities, 2011 ............. ES-9
Figure ES.5 Bay Area Freight Flow Values by Commodities, 2011 ............... ES-10
Figure ES.6 Bay Area Freight Flow Volumes by Trade Type, 2011 and 2040 .................................................................................................... ES-11
Figure ES.7 Bay Area Freight Flow Values by Trade Type, 2011 and 2040 .. ES-12
Figure ES.8 San Francisco Bay Area Multimodal Freight System ................. ES-14
Figure ES.9 Daily Heavy Truck Volumes on Bay Area Highways, 2011 and 2040 ............................................................................................ ES-23
Figure 2.1 Average Wages ..................................................................................... 2-3
Figure 2.2 Output in Goods Movement-Dependent Industries in the Bay Area, 2011 .............................................................................................. 2-5
Figure 2.3 Employment in Goods Movement-Dependent Industries in the Bay Area, Millions of Employees, 2011 ....................................... 2-6
Figure 2.4 Bay Area Freight Flow Volumes by Commodities, 2011 .............. 2-13
Figure 2.5 Bay Area Freight Flow Values by Commodities, 2011 .................. 2-14
Figure 2.6 Bay Area Freight Flow Volumes by Movement Type, 2011 ......... 2-15
Figure 2.7 Bay Area Freight Flow Values by Movement Type, 2011 ............. 2-16
Figure 2.8 Bay Area Freight Flow Volumes by Trade Type, 2011 .................. 2-17
Figure 2.9 Bay Area Freight Flow Values by Trade Type, 2011 ..................... 2-17
Figure 3.1 San Francisco Bay Area Multimodal Freight System ...................... 3-2
Figure 3.2 Rail Systems Infrastructure in Bay Area ........................................... 3-5
Figure 4.1 Altamont and Central Corridors in Bay Area .................................. 4-7
Figure 4.2 Bay Area Freight Flow Volumes by Movement Type, 2011 and 2040 ............................................................................................... 4-14

List of Figures, continued
vi California Department of Transportation
Figure 4.3 Bay Area Freight Flow Values by Movement Type, 2011 and 2040 ....................................................................................................... 4-15
Figure 4.4 Bay Area Freight Flow Volumes by Trade Type, 2011 and 2040 ....................................................................................................... 4-16
Figure 4.5 Bay Area Freight Flow Values by Trade Type, 2011 and 2014 ..... 4-16
Figure 5.1 Daily Heavy Truck Volumes on Bay Area Highways, 2011 and 2040 ................................................................................................. 5-2
Figure 5.2 Daily Train Volumes in the Bay Area, 2007 and 2012 ..................... 5-5
Figure 6.1 Average Daily Total Truck Delays in the Bay Area ......................... 6-9
Figure 8.1 Primary Areas of Concern to Freight Stakeholders ......................... 8-4

San Francisco Bay Area Freight Mobility Study
California Department of Transportation vii
Acronyms
AADT Average Annual Daily Traffic
AAR Association of American Railroads
AB Assembly Bill
ABAG Association of Bay Area Governments
ACE Altamont Corridor Express
Alameda CTC Alameda County Transportation Commission
ARM Adaptive Ramp Metering
ATM Active Traffic Management
BACT Best Available Control Technology
BAAQMD Bay Area Air Quality Management District
BART Bay Area Rapid Transit District
BCDC San Francisco Bay Conservation and Development Commission
BCO Beneficial Cargo Owner
BNSF BNSF Railway
BTS Bureau of Transportation Statistics
BUG Back-up Generator
CAGR Compound Annual Growth Rate
Caltrans California Department of Transportation
CAP Clean Air Plan
CARB California Air Resource Board
CCSCE Center for Continuing Study of the California Economy
CCTV Closed-Circuit Television
CFAC California Freight Advisory Committee
CFNR California Northern Railroad
CNG Compressed Natural Gas
CO2 Carbon Dioxide
CSMP Corridor System Management Plan
CTC California Transportation Commission
San Francisco Bay Area Freight Mobility Study
viii California Department of Transportation
CVC California Vehicle Code
DMS Dynamic Message Sign
EDD Employment Development Department
EIR Environmental Impact Report
EIS Environmental Impact Statement
EJ Environmental Justice
EPA Environmental Protection Agency (used in this report to refer to the U.S. Environmental Protection Agency)
FAA Federal Aviation Administration
FAF Freight Analysis Framework
FAF3 Freight Analysis Framework Version 3
FARS Fatality Analysis Reporting System
FedEx Federal Express
FHWA Federal Highway Administration
FRA Federal Railroad Administration
FRATIS Freight Advanced Traveler Information System
GHG Greenhouse Gas
GIS Geographic Information System
GLIS Guilds Lake Industrial Sanctuary
GPS Global Positioning System
GRP Gross Regional Product
HOT High-Occupancy Toll
HOV High-Occupancy Vehicle
hp horsepower
ICM Integrated Corridor Mobility
IOO Independent Owner-Operator
IPI Inland Point Intermodal
ITS Intelligent Transportation Systems
ITSP Interregional Transportation Strategic Plan
LMC Licensed Motor Carrier
LNG Liquefied Natural Gas
LSP Logistics Service Provider

San Francisco Bay Area Freight Mobility Study
California Department of Transportation ix
MAP-21 Moving Ahead for Progress in the 21st Century
MAQIP Maritime Air Quality Improvement Plan
MDO Marine Diesel Oil
MGO Marine Gas Oil
MIZOD Maritime Industrial Zoning Overlay District
MOVES Motor Vehicle Emission Simulator
MPO Metropolitan Planning Organization
MSM Mobile Source Measure
MTC Metropolitan Transportation Commission
MVMT Million Vehicle Miles Traveled
MY Model Year
NCFRP National Cooperative Freight Research Program
NHS National Highway System
NN National Network
NOx Nitrogen Oxides
NWP Northern Pacific Railroad
NVRR Napa Valley Railroad
O&D Origin-Destination
OAB Oakland Army Base
OAK Oakland International Airport
OGRE Oakland Gateway Rail Enterprise
OHIT Outer Harbor Intermodal Terminal
OIG Oakland International Gateway
OTR Oakland Terminal Railway
PDA Priority Development Area
PeMS Performance Measurement System
PM Particulate Matter
PPMT Point Potrero Marine Terminal
R&D Research and Development
ROG Reactive Organic Gases
RPRC Richmond Pacific Railroad Corporation
RTPA Regional Transportation Planning Agency

San Francisco Bay Area Freight Mobility Study
x California Department of Transportation
SAM Social Accounting Matrices
SCAG Southern California Association of Governments
SCS Sustainable Communities Strategy
SFBAFMS San Francisco Bay Area Freight Mobility Study
SFBR San Francisco Bay Railroad
SFO San Francisco International Airport
SJC Mineta San Jose International Airport
SMART Sonoma-Marin Area Rail Transit (also used to refer to an advanced traveler information program in the East Bay, the SMART Corridor program, led by Alameda CTC)
SR State Route
STAA Surface Transportation Assistance Act
STB Surface Transportation Board
TA Terminal Access
TCIF Trade Corridors Improvement Fund
TCM Transportation Control Measure
TEU Twenty-Foot Equivalent Unit
TIGER Transportation Investment Generating Economic Recovery
TOD Transit-Oriented Development
TMC Traffic Management Center
TREDIS Transportation Economic Development Impact System
UP Union Pacific Railroad
UPS United Parcel Service
U.S. United States
VMT Vehicle Miles Traveled
VOC Volatile Organic Compound

San Francisco Bay Area Freight Mobility Study
California Department of Transportation ES-1
Executive Summary
ES.1 THE ROLE OF GOODS MOVEMENT IN THE BAY AREA
Goods movement – the types of goods moved, the transportation modes used, the origin-destination patterns, and the level of demand – is a function of the level and characteristics of economic activity in a region. The San Francisco Bay Area (Bay Area) goods movement system supports global supply chains and regional industries that trade in international, domestic, and local markets. These industries require efficient and high quality goods movement services to remain competitive. Inefficiency in the goods movement system can result in higher costs of goods for Bay Area consumers and businesses and can put the region in a competitive disadvantage. In order to better understand goods movement (also defined as freight mobility in federal surface transportation legislation, Moving Ahead for Progress in the 21st Century (MAP-21) in the Bay Area, this report begins with a discussion of the population and economic characteristics of the region that drive goods movement demand and explains the role of goods movement in the regional economy.
Overview of Bay Area Population, Demographics, and Economy The nine-county Bay Area region (Alameda, Contra Costa, Marin, Napa, San Francisco, San Mateo, Santa Clara, Solano, and Sonoma Counties) was home to over 7.1 million people in 2010 and provided jobs for almost 3.4 million people who live in the Bay Area and neighboring counties.1 As such, the Bay Area boasts one of the largest economies in the United States. The Bay Area ranks 19th in the world when compared to national economies, with a Gross Regional Product (GRP)2 of $539 billion in 2011.3
Over the past 20 years, the region has experienced modest growth in population and employment that is expected to continue through 2040 (see Table ES.1). According to the Bay Area Council Economic Institute, population has grown from just over 6 million in 1990 to about 7.2 million in 2011, which is a modest
1 Plan Bay Area, 2010 estimates developed by the Association of Bay Area Governments
(ABAG), 2013. 2 GRP is one of the key measures of the economy and is defined as the market value of
all final goods and services within a region in a given period of time. 3 ABAG, 2013.

San Francisco Bay Area Freight Mobility Study
ES-2 California Department of Transportation
0.78 percent per year growth and slower than the national average of 1.07 percent.4 According to forecasts by the Association of Bay Area Governments (ABAG), the Bay Area will add 2.1 million residents between 2010 and 2040, and will remain California’s second largest population and economic center (see Table ES.1).5
Table ES.1 Bay Area Population, Employment, and Housing Projections, 2010 to 2040
Category 2010 2040 Growth
2010-2040 Percent Change
2010-2040
Population 7,150,740 9,299,150 2,148,410 +30%
Jobs 3,385,300 4,505,220 1,119,920 +33%
Households 2,608,020 3,308,110 700,090 +27%
Housing Units 2,785,950 3,445,950a 660,000 +24%
a 2010 and 2040 values include seasonal housing units.
Source: ABAG, 2013.
The Bay Area also has high per capita income. Figure ES.1 shows that average wages in the Bay Area have been consistently higher than those of other regions of California and the United States (U.S.), during the last two decades. Higher income generally leads to higher levels of consumption, higher retail sales, and increased levels of local urban goods movement.
4 Bay Area Council Economic Institute, The Bay Area, A Regional Economic Assessment,
October 2012. 5 ABAG, 2013.

San Francisco Bay Area Freight Mobility Study
California Department of Transportation ES-3
Figure ES.1 Average Wages
Source: The Bay Area, A Regional Economic Assessment, October 2012. Data from Bureau of Economics;
calculations by Bay Area Council Economic Institute.
The Bay Area economy has always been known for innovation, particularly in the high technology sector. The economy is continuing to shift away from manufacturing towards the service sector, especially professional, technical, and information services. This will impact goods movement demand leading to a higher level of small package movements and less emphasis on long-haul outbound movements of manufactured products. Another key driver of goods movement in the Bay Area is the strength of the local tourism and travel industry. Between 1990 and 2011, the accommodation and food services industry and the arts, entertainment, and recreation industry increased their combined share of Bay Area employment from 9.4 percent to 11.7 percent. Providing food and supplies to these industries is an important goods movement function.
Despite the shifts in the Bay Area economy to greater concentration in professional and technical services and travel and tourism, the industrial makeup of the economy remains diverse and this contributes to goods movement demand from a variety of different sectors.
Economic Importance of Goods Movement Industries that generate the largest share of goods movement demand and spending are often referred to as goods movement-dependent industries. As shown in Figures ES.2 and ES.3, goods movement-dependent industries in the

San Francisco Bay Area Freight Mobility Study
ES-4 California Department of Transportation
Bay Area account for $490.3 billion in total output6, 7 (51 percent of total regional output); and provide about 1.1 million jobs (32 percent of total regional employment). Manufacturing represents the largest share of output and employment among the goods movement dependent industries in the Bay Area. According to the Federal Highway Administration’s (FHWA) Freight Analysis Framework (FAF) data, the region’s leading outbound commodity in terms of value was electronic and other electrical equipment and components manufactured by some key industry sectors in the Bay Area. Other manufacturing industries that contribute substantially to the region’s economic output and generate significant goods movement demand include petroleum products and chemicals, electronic and medical instruments and supplies (including biotech products), and food and beverage products (including the wine and spirits industry). These industries generally produce high-value products with specialized, high-quality freight transportation needs. Many of these industries are also major exporters to Asia through the Port of Oakland’s maritime port and San Francisco International Airport.
6 Output measures the value of all goods and services delivered in the economy,
including intermediate consumption (inputs). Total output from goods movement-dependent industries provides a good indicator of the total value of products transported in the goods movement system and, as such, is the best indicator of growth in demand over time.
7 Output and employment in the computer and electronics industry in the Bay Area is reported as part of the manufacturing sector even though most of the production activity that generates demand for goods movement occurs in overseas locations. Even if output and employment in this sector is not included in manufacturing, goods movement-dependent industries still account for 31 percent of total regional output.

San Francisco Bay Area Freight Mobility Study
California Department of Transportation ES-5
Figure ES.2 Output in Goods Movement-Dependent Industries in the Bay Area, 2011 Billions of Dollars
Source: IMPLAN 2011 and Cambridge Systematics analysis.
Non-goodsMovementDependent,480.8, 49%
Agricultureand NaturalResources,
5.8, 1%
Construction,27.6, 6%
Transportationand Utilities,
29.4, 6%
Manufacturing,365.9 , 75%
Wholesale Trade, 28.2, 6%Retail Trade,
33.3, 7%
GoodsMovementDepedent,490.3, 51%

San Francisco Bay Area Freight Mobility Study
ES-6 California Department of Transportation
Figure ES.3 Employment in Goods Movement-Dependent Industries in the Bay Area, Millions of Employees, 2011
Source: ABAG (Plan Bay Area 2013), Center for Continuing Study of the California Economy (CCSCE), and Cambridge
Systematics Analysis.
Non-GoodsMovementDependent
2.3, 68%
Agriculture and Natural Resources
0.025, 2%
Construction0.042, 13%
Manufacturing 0.336, 32%
Transportation& Utilities0.099, 9%
Wholesale0.124, 12%
Retail0.336, 32%
GoodsMovementDependent
1.1, 32%
Non-GoodsMovementDependent
2.3, 68%
Agriculture and Natural Resources
0.025, 2%
Construction0.042, 13%
Manufacturing 0.336, 32%
Transportation& Utilities0.099, 9%
Wholesale0.124, 12%
Retail0.336, 32%
GoodsMovementDependent
1.1, 32%

San Francisco Bay Area Freight Mobility Study
California Department of Transportation ES-7
After manufacturing, the next largest goods movement-dependent industries, in terms of output, in the Bay Area are retail trade, wholesale trade, and construction. Growth in these industries is driven by growth in the region’s consumer base and rising incomes and consumption levels.
Contributions to the Regional Economy from Transportation Spending and the Role of Goods Movement Service Providers In 2011, goods movement-dependent industries spent $20.3 billion on transportation.8 This is equivalent to 2.1 percent of total regional output and represents 64 percent of all spending on transportation services in the region.
Freight transportation spending creates demand for employees in a wide range of occupations that are important to job diversity in the Bay Area. Goods movement service providers (trucking, rail, maritime, and air cargo industries) and their supporting service industries and equipment manufacturers provided approximately 79,300 jobs in 2011 in the Bay Area.9 Bay Area goods movement jobs account for 14 percent of the jobs in occupational categories for which 90 percent or more of the workers do not require a college or advanced degree.10
Goods Movement Demand Goods movement in the Bay Area serves three different trade markets:
• International trade – By several measures, the San Francisco Bay Area is one of the most important international trade gateways in the U.S. In 2011, the San Francisco Customs District (which includes all of the region’s seaports and airports, as well as those of Monterey County, Sacramento County, Fresno County, and Reno) was the second most important trade gateway in California, the third most important gateway on the West Coast of the U.S., and the 10th largest international trade gateway in the U.S. (in terms of value of two-way trade). In addition to many high value products produced in the Bay Area, the region’s international trade gateways are critical to exporters of
8 Based on calculations by Cambridge Systematics using the Transportation Satellite
Accounts developed by the U.S. Bureau of Transportation Statistics, the U.S. Bureau of Economic Analysis, and the U.S. Department of Commerce, 2011.
9 Calculations by Cambridge Systematics using employment by industry data from the IMPLAN economic input-output model developed by the Minnesota Implan Group. IMPLAN uses data on industry employment and output obtained from U.S. Economic Census and U.S. Bureau of Economic Analysis and makes adjustments at the county level to account for data that is not disclosed by the federal sources due to confidentiality constraints.
10 Cambridge Systematics estimates based on employment by occupation data from the California Employment Development Department.

San Francisco Bay Area Freight Mobility Study
ES-8 California Department of Transportation
high value agricultural products in the North Bay, San Joaquin Valley and Central Coast.
• Domestic trade – The Bay Area is a major consumption center that relies on trade links to population-serving industries across the country. The region relies on its links to the northern San Joaquin Valley for much of the warehouse and distribution infrastructure. The Bay Area also has an evolving high-technology development/manufacturing sector and is a major producer of refined petroleum products that are traded throughout the western U.S.
• Urban goods movement – As a major population and commercial center that is also one of the world’s leading travel and tourism centers, the Bay Area relies heavily on local urban goods movement to provide basic consumer products, food, packages, and parcels to residents and businesses (including the travel and tourism industry). Extremely dense and compact urban areas make last-mile deliveries in large trucks a widespread challenge.
ES.2 COMMODITIES SHIPPED IN THE BAY AREA In 2011, the top commodities by tonnage moved include waste and scrap, coal and petroleum products, n.e.c.11, crude petroleum, and gasoline, as shown in Figure ES.4. In terms of value (Figure ES.5), top commodities include electronics, machinery, and motorized vehicles.
11 Coal not elsewhere classified (n.e.c.), shown in Figure ES.4, also includes petroleum
products. In the Bay Area, this is mostly refined petroleum products and byproducts (such as petroleum coke).

San Francisco Bay Area Freight Mobility Study
California Department of Transportation ES-9
Figure ES.4 Bay Area Freight Flow Volumes by Commodities, 2011 Millions of Tons
Source: Freight Analysis Framework 3.
Waste/Scrap,74, 17%
Coal-n.e.c.,44, 10%
Crude Petroleum, 42, 10%
Gasoline,37, 9%Nonmetal
Min. Prods., 31, 7%
Gravel,28, 6%Other Foodstuffs,
21, 5%
Fuel Oils,19, 4%
Other Ag Prods., 16, 4%
Natural Sands,13, 3%
Cereal Grains,9, 2%
Nonmetallic Minerals,
9, 2%
Mixed Freight,9, 2%
Alcoholic Beverages,
7, 2%
Motorized Vehicles,
6, 1%Other,
72, 16%
Total = 436

San Francisco Bay Area Freight Mobility Study
ES-10 California Department of Transportation
Figure ES.5 Bay Area Freight Flow Values by Commodities, 2011 Billions of Dollars
Source: Freight Analysis Framework 3.
In 2011, intraregional commodity flows (i.e., flows that have both an origin and a destination within the region) represented the largest share of total freight movements. These short-haul freight shipments often include movements among closely allied manufacturing clusters and locally produced and consumed products that are moved to and from the region’s seaports and airports. Inbound commodities to the Bay Area accounted for 28 percent by weight of total nonthrough flows, including supplies for local industries, consumer goods distributed from Central Valley warehouses, and products shipped into the region’s ports and airports for export. About 18 percent of goods are transported outbound from the region. This is a combination of goods produced by local manufacturers and products moving through the region’s international gateways but destined for locations in other parts of the State or country.
In the future, freight moving on the Bay Area freight system is expected to grow moderately, at a compound annual growth rate (CAGR) of 2.2 percent overall. Inbound freight flows will grow at a slightly higher rate than all other flows – at 2.4 percent per year. This reflects a continuing shift of the Bay Area economy away from manufacturing and towards service industries and population
Electronics, $110
Machinery, $82
Motorized Vehicles,
$43
Precision Instruments, $38
Mixed Freight, $31Gasoline, $28Other Foodstuffs,
$23
Textiles/Leather, $23
Pharmaceuticals, $20
Crude Petroleum, $19
Misc. Mfg. Prods., $18
Alcoholic Beverages, $17
Fuel Oils, $17
Other Ag Prods., $17
Coal-n.e.c., $17
Other, $125
Total = $628

San Francisco Bay Area Freight Mobility Study
California Department of Transportation ES-11
serving commodity movements. The value of freight will grow faster than will tonnage as the regional economy continues to shift to high-value manufacturing and to consumption by an increasingly affluent population.
Freight flows in the Bay Area also consist of significant shares of imports and exports (international trade). In 2011, exports represented 6.8 percent of total freight movement in the Bay Area in terms of tonnage and 10.7 percent in terms of value; and imports represented 10.7 percent in terms of tonnage and 20.4 percent in terms of value. Between 2011 and 2040, the region will continue its growth as an international trade gateway with imports and exports growing at a faster rate, in terms of both tonnage and value, than domestic trade and with exports growing faster than imports (Figures ES.6 and ES.7).
Figure ES.6 Bay Area Freight Flow Volumes by Trade Type, 2011 and 2040 Millions of Tons
Source: Freight Analysis Framework 3.
-
100
200
300
400
500
600
700
Domestic Only Imports Exports
359
47 30
611
99 100
Millio
ns o
f Ton
s
20112040
1.9% CAGR
2.6% CAGR 4.3% CAGR

San Francisco Bay Area Freight Mobility Study
ES-12 California Department of Transportation
Figure ES.7 Bay Area Freight Flow Values by Trade Type, 2011 and 2040 Billions of Dollars
Source: Freight Analysis Framework 3.
-
200
400
600
800
1,000
1,200
Domestic Only Imports Exports
433
128 67
1,052
426 307
Billio
ns o
f Dol
lars
20112040
3.1% CAGR
4.2% CAGR 5.4% CAGR

San Francisco Bay Area Freight Mobility Study
California Department of Transportation ES-13
ES.3 THE GOODS MOVEMENT SYSTEM The goods movement system in the Bay Area (see Figure ES.8) consists of private and public sector modal elements that in many cases are also used for the movement of passengers. The core of the goods movement system consists of major truck routes12 (Interstate (I)-880, I-580, I-80, United States (U.S.) 101, I-238, and I-680); Class I13 rail main lines (operated by the Union Pacific Railroad (UP) and the BNSF Railway (BNSF)); the principal international water trade gateway at the Port of Oakland; the principal international air cargo gateway at San Francisco International Airport (SFO); the principal domestic air cargo gateway at Oakland International Airport (OAK); near-dock intermodal rail terminals; rail classification yards; and rail auto terminals.
This core system is complemented by various other truck routes, short line railroads14 (Northwestern Pacific Railroad, California Northern Railroad, Napa Valley Railroad, Oakland Gateway Rail Enterprise, Richmond Pacific Railroad Corporation, and San Francisco Bay Railroad), small niche marine ports (Port of Richmond, Port of Benicia, Port of San Francisco, and Port of Redwood City), and the Mineta San Jose International airport (SJC).
12 The definition of major and minor truck routes used in this report are those proposed
by the California Freight Advisory Committee (CFAC) as of September 20, 2013, based on different levels of average annual daily truck traffic volumes. A major truck route is defined as having truck (3 or more axles) average annual daily traffic (AADT) of more than 3,000. Using this definition, it is possible that only a portion of a route will be classified as a major truck route. An example is U.S. 101 which has over 3,000 AADT of 3 or more axle trucks on most segments but does not have this high level of truck traffic through the City of San Francisco. Needs, deficiencies and strategies are included for major truck routes and other truck routes in this study.
13 As defined by the federal Surface Transportation Board (STB), in 2011 a Class I railroad is a line haul railroad with annual operating revenue of $433.2 million or more. Class I railroads are the nation’s largest rail carriers and provide primarily long-haul freight rail services.
14 Class III railroads (rail carriers with $34.7 million or less in annual operating revenues) are often referred to as short line railroads. These railroads are either short haul railroads that often serve particular industries and interchange traffic with the Class I railroads or they are switching and terminal railroads that provide specialized services to the Class I railroads, usually at intermodal terminals or major interchange locations.

San Francisco Bay Area Freight Mobility Study
ES-14 California Department of Transportation
Figure ES.8 San Francisco Bay Area Multimodal Freight System
Source: Caltrans Truck Counts, 2011; Cambridge Systematics analysis.
San Francisco Bay Area Freight Mobility Study
California Department of Transportation ES-15
ES.4 FUNCTIONS OF THE GOODS MOVEMENT SYSTEM, GROWTH DRIVERS, AND KEY TRENDS
Different modal physical infrastructure can be combined to serve a particular goods movement function. The functional elements of the Bay Area goods movement system and key trends that are driving demand are described in the following sections.
It is important to note that while the goods movement functions are distinct, particular road, rail, marine, and air facilities may fulfill more than one function. For example, I-880 in the East Bay is part of the interregional corridor that includes I-238 and I-580 but it also serves as part of the intraregional core system moving traffic between origins and destinations exclusively within the East Bay.
Global Gateways The global gateways comprise the region’s international trade infrastructure consisting of the major maritime facilities and international airports.
Growth Drivers and Trends • With international trade growing at a faster rate than domestic trade, the Port
of Oakland should see continued growth. However, the Port of Oakland faces some serious potential competitive threats, as well as opportunities. Most of the ports on the U.S. West Coast (Port of Long Beach and Port of Los Angeles in Southern California and Port of Tacoma and Port of Seattle in Puget Sound) are investing to take advantage of growing Pacific Rim trade and the Port of Oakland has lost market share in recent years. These other ports also face challenges with community opposition to growth, environmental impacts, and local congestion problems. If the Port of Oakland is able to improve operational efficiency, take advantage of unique market opportunities, and improve inland transportation options (particularly rail), it should be able to at least maintain market share relative to other U.S. West Coast ports. The Port of Oakland also faces potential diversion of cargo to the East and Gulf Coasts via the expanded Panama Canal and to expanding ports in Mexico and Canada. The Port of Oakland’s competitive position as compared to these other ports will depend on relative cost and reliability which will in turn depend on the cost of ocean carriage via the Panama Canal, access to reasonably priced connecting services from Canada and Mexico to the interior U.S., and the pricing policies of Western railroads that provide connections between the Port of Oakland and Midwestern and East Coast markets.
• In recent decades, the Port of Oakland has been the only major container port in California where exports consistently exceed imports, providing a unique international trade gateway capability as compared to the Ports of Los

San Francisco Bay Area Freight Mobility Study
ES-16 California Department of Transportation
Angeles and Long Beach. Linkages to the Northern California export economy will continue to be an important demand factor at the Port of Oakland. In particular, expanding agricultural export activity from the Central Valley is an important growth driver for the Port of Oakland. This growth will put stresses on the I-880, I-238 and I-580 corridors. The Port of Oakland is also investing in expanded facilities to take advantage of the forecasted growth of export bulk products, such as waste, scrap, and recycled products and mineral ores, demand for which is expanding in developing economies throughout the Pacific Rim. The Port of Oakland will also continue to be a gateway for imports (largely consumer goods from Asia). Growth rates for imports will depend to some degree on expansion of rail facilities and development of nearby container transloading warehouses. Transloading refers to the process in which a logistics service provider (LSP)15 transfers the contents of smaller import containers directly into 53-foot domestic truck or rail containers in a warehouse near a gateway port for onward movement to a U.S. inland point. The growth of transloading creates an economic opportunity for the regions in which transloading occurs because these facilities often employ workers for additional value-added warehousing services. As transloading has increased in attractiveness for large importers, ports with an infrastructure of transload warehouses have attracted this business. For example, at the Ports of Los Angeles and Long Beach, more than 30 percent of loaded import containers are estimated to be transloaded. There is little known about the amount of transloading that occurs in Oakland. One disadvantage the Port may have in attracting transload business is that the Class I railroads generally load domestic containers at their intermodal terminals in the Central Valley, which is far enough away from the Port that it may not be an attractive option for transloading to rail. Changes in railroad operating practices and the development of nearby transload warehouses could help make the Port of Oakland more attractive for this type of business.
• The Ports of Richmond and Benicia will see slowing in the rate of growth of automobile imports and crude and petroleum product imports and exports. The slowing in forecasted growth of petroleum product imports and exports will likely result from anticipated long-term improvements in vehicle energy efficiency and shifts to nonpetroleum fuels. Ports handling bulk exports, particularly of waste and scrap, but also construction-related products, petroleum coke and related products, could see substantial growth if they have the facilities to handle this growth.
15 A logistics service provider is generally a third party (i.e., neither a shipper nor a
receiver), who provides a range of logistics services to shippers and receivers. These service may include transportation or transportation brokerage, warehousing, or other value-added services (such as bar coding, ironing of clothing, labeling).

San Francisco Bay Area Freight Mobility Study
California Department of Transportation ES-17
• The movement of computer and electronics production facilities to off-shore locations, the reduction of cargo space in passenger aircraft post-9/11, and the drop in air cargo volumes during the recession all contributed to reduced cargo volumes at the region’s airports. Current projections show that domestic air cargo will resume at a modest, yet sustained, growth as the economy recovers and e-commerce and express delivery services continue their expanding role in the consumer and service economy of the Bay Area. International air cargo will grow at a faster pace.
Interregional Corridors The interregional corridors include those elements of the system that are used to link the region to the rest of the United States. There are two primary multimodal interregional trade corridors in Northern California that connect with the Bay Area identified in the 2008 Metropolitan Transportation Commission (MTC) Goods Movement Strategy: 1) the Central Corridor and 2) the Altamont Corridor.16 I-80 forms the highway core of the Central Corridor, which connects the Bay Area to Sacramento and northern tier states. The Central Corridor also includes Union Pacific (UP) rail connections along the Martinez Subdivision17 and BNSF Railway connections, where it has trackage rights on the Martinez Subdivision continuing on to the Stockton Subdivision18 and connections further south to the BNSF TRANSCON line.19 The major truck routes of I-880/I-238/I-580 form the highway core of the Altamont corridor. UP also has rail connections via the Oakland Subdivision20 along the Altamont Corridor, although these are not used as intensively for freight rail transport. In addition, the M-580 Marine Highway21 between the Ports of Oakland, Stockton and West Sacramento also serves as an interregional corridor providing alternatives to shipping particular bulk goods by highway or rail.
16 Metropolitan Transportation Commission (MTC), Bay Area Goods Movement Strategy,
2008. 17 UP Martinez Subdivision is UP’s mainline track running from Richmond north to
Roseville. 18 BNSF’ Stockton Subdivision is BNSF’s mainline track that links the Bay Area to the
Central Valley via Stockton and then running south to Fresno. 19 BNSF’s TRANSCON line is BNSF’s transcontinental mainline. 20 UP’s Oakland Subdivision is UP’s mainline track running south from Oakland
through San Leandro, Hayward, Union City, and Fremont, and then heading east over the Altamont Pass.
21 The M-580 Marine Highway is a short-sea shipping lane (designated by the U.S. Maritime Administration) that recently opened a barge service linking the Ports of Stockton and Oakland.

San Francisco Bay Area Freight Mobility Study
ES-18 California Department of Transportation
U.S. 101 also provides interregional connections, particularly connecting agricultural shippers on the Central Coast with markets and export facilities in the Bay Area, as well as providing connections between the Bay Area and the North Coast of California. U.S. 101 has been designated as a Focus Route in Caltrans’ Interregional Transportation Strategic Plan (ITSP) Update published in October 2013. Focus Routes are the highest priority for completion to minimum facility standards (usually expressway of freeway standards) in order to serve interregional trips and provide access to statewide gateways.
The integration of the Bay Area economy and that of neighboring regions in Northern California (including the agricultural regions of the Central Coast and the Central Valley) is creating new emphasis on interregional goods movement corridors that link the various regions that comprise the Northern California mega-region. One such interregional corridor is the State Route (SR) 152 corridor. While not a major goods movement corridor today, SR 152 could become an important interregional corridor in the future. SR 152, like U.S. 101, has been designated a Focus Route. Completing improvements to SR 152 to meet the ITSP concept standards is one of the recommended strategies for Bay Area interregional corridors.
Growth Drivers and Trends • Interregional freight movements represent a higher and faster growing share
of total value than intraregional movements in the Bay Area. Trucks will continue to service the majority of demand for interregional freight movement, but international intermodal rail cargo is expected to experience high levels of growth associated with imports arriving at and then leaving the Port of Oakland by rail for destinations in the interior U.S.
• The continued relocation of distribution facilities outside of the Bay Area to regions such as the San Joaquin Valley and the flow of products from these distribution facilities to the Bay Area by truck will continue to put greater pressure on already congested and limited interregional corridors.
• In addition to containerized cargo at the Port of Oakland, one of the biggest categories of imports to the Bay Area is automobiles which are then shipped by rail to other parts of the U.S. These imports will continue to grow, driven by population growth and demand. Waste/scrap will also grow rapidly and will be driven by export demand. Domestic rail share of petroleum product shipments along interregional corridors is also expected to grow as crude supplies for the region’s refineries shifts to the Bakken Fields in North Dakota and Canada.
Intraregional Core System As mentioned previously, a substantial amount of the goods moving in the Bay Area have both an origin and destination within the region and are referred to as intraregional flows. The intraregional core system serves the Bay Area regions

San Francisco Bay Area Freight Mobility Study
California Department of Transportation ES-19
with the highest concentration of population corresponding to the highest share of demand. The system also provides primary access to the major goods movement facilities along the Bay, including seaports, airports, rail yards, and warehouse/industrial districts to serve goods moving between these facilities and their Bay Area customers. This is a particularly important role for intraregional corridors such as I-880 and U.S. 101. The intraregional core system includes portions of I-880 as well as I-680, SR 152, SR 4, SR 92, and SR 37, and U.S. 101. The Transbay bridges (Richmond-San Rafael Bridge, San Francisco-Oakland Bay Bridge, Dumbarton Bridge, and San Mateo-Hayward Bridge) also are part of the intraregional core system. Because this system serves intraregional movement which is dominated by truck movements, it is composed exclusively of highways and major arterials.
Each of the highways in the intraregional core system serves particular flows within the Bay Area that link the cities and counties within the region based on intraregional economic links. For example, SR 4 provides connections between the oil refineries and other industrial producers along the Contra Costa County Northern Waterfront with the rest of the intraregional network and customers in the Bay Area. In addition, a number of these highways also provide important connections to the interregional corridors. For example, I-880 connects to I-238/I-580 providing access between these interregional corridors and OAK and the Port of Oakland. I-880 also provides access to the interregional network for industrial areas along the I-880 corridor. U.S. 101 is a corridor for distribution of products to the major population centers in Santa Clara, San Mateo, San Francisco, Marin and Sonoma Counties, but through connections with SR 37, I-680, and I-580, it is also part of an intraregional network that connects to the interregional system for agricultural producers in the North Bay. SR 152 also connects with U.S. 101 to provide a similar intraregional connection to the interregional network for Central Coast agricultural producers.
The preceding discussion of U.S. 101 and SR 152 points out the frequent overlap between the intraregional system and the interregional corridors. While interregional corridors such as U.S. 101, SR 152, I-80 and I-580 are main conduits for connecting the region to the rest of the State and country, they also serve intraregional travel.
Growth Drivers and Key Trends • Despite the slower rate of growth relative to interregional and international
trade, intraregional trade will still contribute to higher total truck volumes on the intraregional corridors. Since all of the intraregional corridors are also major commuter routes, the region will continue to see conflicts between trucks and automobiles.
• Some of the highest tonnage commodities moved by truck on intraregional corridors are heavy bulk commodities, which contribute to pavement deterioration issues.

San Francisco Bay Area Freight Mobility Study
ES-20 California Department of Transportation
• Integrated supply chains where manufacturers and suppliers, generally in advanced manufacturing and high-tech sectors, exist in close proximity, will drive demand on intraregional corridors as will local distribution of consumer and construction-related products supporting the Bay Area’s large population. Continued production of precision instruments and machinery will create demand for the intraregional movement of components and partially finished products among producers and suppliers, primarily by truck. These supply chains require high reliability, and the effects of nonrecurrent congestion on intraregional corridors may create supply chain performance problems.
Urban Goods Movement System The urban goods movement system refers to networks of county and city streets that are needed to move freight to its final destination. The urban goods movement system, particularly major arterial truck routes, provides important connections to industrial centers that require access by large tractor-trailer combinations and must be designed to accommodate these movements. Urban goods movement also involves high volumes of package and parcel pickup and deliveries. Because the urban goods movement system consists primarily of arterial corridors owned and operated by cities and counties, and the truck routes are designated and managed by these local governments, there has been no comprehensive characterization of this system. A major concern is discontinuities at jurisdictional boundaries – where a truck route ends at a city boundary when through connectivity is needed. Urban freight delivery routes are often too tight and narrow for the largest commercial trucks, lack parking for loading and unloading, and have limited public space.
Growth Drivers and Key Trends • Growth in the Bay Area consumer base will continue to create demands on
the urban goods movement system. In addition, increasing density of development patterns will likely increase conflicts between trucks and other users along the major arterial corridors. Street design, signalization and signage, and Intelligent Transportation Systems (ITS) strategies (such as adaptive signaling, traveler information, and signal priority systems for trucking) will need to consider the interaction of trucks with other street users.
• Increases in e-commerce are changing the characteristics of urban goods movement, especially in residential neighborhoods that are seeing an increase in parcel delivery. The increase in the use of parcel carriers is also likely to increase demand at air cargo centers which play a critical role in the delivery network for carriers such as Federal Express (FedEx) and United Parcel Service (UPS).
San Francisco Bay Area Freight Mobility Study
California Department of Transportation ES-21
Last-Mile Connectors Last-mile connectors refer to the direct access streets, rail spurs, and rail branch lines that provide the critical connections between major freight facilities (global gateways, domestic rail terminals, warehouse/industrial centers and industrial parks) and the interregional and intraregional systems. In the case of roadways, the last-mile connectors are a subset of the urban goods movement system.
As part of the designation of the National Highway System (NHS), FHWA has also worked with the states to designate an intermodal connector system. However, this system has not been reviewed recently and does not include all of the significant last-mile connectors in the Bay Area. At this time, there has not been a comprehensive analysis of last-mile connectors in the Bay Area to develop an agreed upon system of these facilities nor is there a targeted funding source for maintaining this system. Developing a designated last-mile connector system and doing a comprehensive analysis of last-mile connector needs is a recommended next step in planning for this critical function in the Bay Area goods movement system.
Growth Drivers and Key Trends • Demand can quickly overwhelm supply for last-mile connectors when new
capacity is brought on-line. For example, the addition of new marine or air cargo terminal capacity results in more intensive utilization of existing terminals, due to seasonal peaks. This can tax last-mile connectors.
• It is anticipated that there will soon be an effort to review and refine the National Highway System intermodal connector system and to update it with new information about last-mile connectivity needs. Since last-mile connectors are generally city streets or industrial rail spurs, they may be the least well-maintained element of the goods movement system and often lack funding in regional and State goods movement plans.
Domestic Air Cargo Systems The region’s domestic air cargo has been declining or flat in recent years. Thus, the future needs of the system have attracted less attention when compared to other freight system elements that have seen faster growth. However, trends, such as the increase in high-value goods and potential re-shoring of high-technology manufacturing, where the manufacturing activities are moved closer to or within the U.S., suggest there may be a modest resurgence of domestic air cargo as the economy recovers from the recent recession of 2007-2009. The potential for a return of high technology manufacturing to the U.S. from Asia or expansion of high technology manufacturing in Mexico in preference to Asia could occur as a result of abundant low cost energy supplies in the U.S., the continued development of highly productive advanced manufacturing processes in the U.S., and the high cost of transportation from Asia to the U.S. All of these factors would tend to mitigate some of the low cost production advantages that

San Francisco Bay Area Freight Mobility Study
ES-22 California Department of Transportation
manufacturers have achieved in Asia over the last 20 years. If these trends lead to growth in U.S. or Mexican high tech manufacturing, the result will be an increase in demand for domestic air car cargo movements for distribution within the U.S.
Growth Drivers and Key Trends • In the Bay Area, value of goods is increasing faster than tonnage, suggesting
a shift to higher value products overall. Since air cargo is the most expensive (but also the fastest) long distance transport mode, it is often used for high value products that have high sensitivity to travel times. This trend in the economy could lead to resurgent demand for air cargo services.
ES.5 MODAL TRAFFIC IMPLICATIONS Highway According to Freight Analysis Framework (FAF) data, trucking carries the largest share of total trade by tonnage in the Bay Area (67 percent). Commodity flows by truck in the Bay Area are expected to grow significantly, from 290 million tons in 2011 to 565 million tons in 2040, a nearly 100 percent increase. While intraregional flows made up 58 percent of domestic truck movements by weight in 2011 (167 million tons), there are also significant truck movements between the Bay Area and other regions within and outside of California, pointing to the importance of interregional highway corridors in the Bay Area. The percentage of truck traffic involving heavy trucks with four or more axles is also anticipated to increase as shippers try to maximize the efficiency of their supply chains. Figure ES.9 shows current and projected heavy truck traffic on the major truck routes.

San Francisco Bay Area Freight Mobility Study
California Department of Transportation ES-23
Figure ES.9 Daily Heavy Truck Volumes on Bay Area Highways, 2011 and 2040 Thousands of Trucks
Source: Caltrans Truck Counts, 2011; MTC’s Regional Transportation Model for 2010 and 2040; Cambridge Systematics
analysis.

San Francisco Bay Area Freight Mobility Study
ES-24 California Department of Transportation
Rail According to the 2013 California State Rail Plan, freight train volumes are the highest on the UP Martinez Subdivision, especially between Richmond and Oakland, as this is the segment that carries traffic into/away from the Port of Oakland and it is used by both Class I railroads even though the track is owned by UP. The freight train volumes are more moderate on the remaining lines. In 2025, overall freight rail demand is anticipated to grow, exacerbating existing issues and conflicts. Train volumes will increase further on the UP Martinez Subdivision (in large part due to growth in international intermodal cargo at the Port of Oakland), making it the largest bottleneck on the freight rail system in the Bay Area. In addition to carrying freight rail traffic for both Class I railroads in the segments leading to the Port of Oakland, portions of the Martinez Subdivision also carry intercity rail passenger trains – both the Capitol Corridor and the San Joaquin.
Maritime Growth in maritime trade will have significant impacts on inland modal traffic carrying imported products away from the ports (to inland locations) and bringing exports to the ports (from inland locations). In 2011, marine imports made up about 33 million tons, or 59 percent of total maritime foreign trade, with 41 percent being exports. Pipeline was a dominant mode for carrying imported oil from port terminals to the region’s refineries. Truck was also a dominant mode carrying imports from the seaports to inland locations. Between 2011 and 2040, growth in inland mode for imports will be greatest for truck and intermodal rail, which reflects the high level of growth anticipated for containerized import cargoes.
On the export side, truck and rail intermodal containers make up the vast majority of shipments to the ports, carrying about 9.6 million and 9.5 million tons of cargo in 2011, respectively. Overseas demand for waste/scrap will be one of the fastest growing export commodities in the future and will create growth in inland traffic for truck and rail (both intermodal and carload) modes. By 2040, waste and scrap volumes are expected to grow to nearly four times the current volume. Other export commodities that will grow at a fast rate include metallic ores, basic chemicals, and agricultural commodities. These commodities will move to the ports by rail or by truck depending on their inland origin (for example, Bay Area and Central Valley shippers will move exports to the ports by truck whereas exporters from outside of California will be more reliant on rail).
For the Port of Oakland alone, import and export volumes have grown in tandem, and this trend is expected to continue. With the exception of 2006, the Port of Oakland has generally been a net exporting port. Contributing to the export growth is the agricultural and prepared food commodities that are produced in the San Joaquin Valley and the Central Coast regions of California.

San Francisco Bay Area Freight Mobility Study
California Department of Transportation ES-25
Air Cargo The forecasts of air cargo demand are for moderate growth at OAK and SFO, and limited growth at SJC.22 Air cargo volumes at OAK are forecast to increase from 501,813 metric tons in 2012 to 778,900 metric tons by 2040, with a CAGR of 1.6 percent. Air cargo volumes at SFO are forecast to increase from 380,790 metric tons in 2012 to 971,900 metric tons by 2040, with a CAGR of 3.4 percent. This high level of growth at SFO will be driven largely by growth in high value international trade. Due to competition from SFO and OAK, there seems to be limited growth potential for SJC in the future.
ES.6 SYSTEM NEEDS AND STRATEGIES Global Gateways
Needs and Deficiencies Maritime Ports
In order to grow its import business, the Port of Oakland (Port) needs to expand intermodal terminal capacity and improve rail services. If it is successful with growing the import business and the demand for exports grows as expected, the improvements that are being undertaken at the former Oakland Army Base (OAB) will be critical in order to have sufficient terminal and rail capacity to meet demand beyond 2030. The Port also needs continued dredging of its harbors in order to meet the channel depth requirement of the newer, larger container ships, which are typically 50 feet. In addition to improvements that support the Port’s import business, the Port needs to continue improvements to container and bulk terminals to meet future export market demands.
The Port of San Francisco is committed to expanding markets for bulk commodities and heavy construction project cargo but will need to make rail access improvements to facilitate this growth. Both the Port of Redwood City and the Port of Richmond may need to expand bulk cargo terminal capacity in order to take advantage of projected growth in these markets over the next 25 years.
International Air Cargo
The deficiencies of the region’s air cargo system are tied to a lack of expansion potential and a legacy runway configuration that is not optimal for boosting total throughput. The effective capacity of SFO is further limited by the frequency of
22 California Air Cargo Groundside Needs Study, prepared for Caltrans by SystemMetrics
Group, 2013.

San Francisco Bay Area Freight Mobility Study
ES-26 California Department of Transportation
inclement weather, principally fog, that leads to periodic delays and flight cancelations.
The lack of balance in international air cargo between OAK and SFO may create future deficiencies, particularly because access to SFO for East Bay shippers is limited by Transbay connections. In past years, OAK attempted to attract TransPacific air carriers, but was not successful as existing international cargo carriers at SFO were unwilling to move.23 One reason this may be the case is that many international carriers rely on the connectivity to domestic markets provided by complementary domestic carriers and SFO provides more options for this connectivity through cargo carried in the belly of passenger airlines that provide greater geographic coverage than do carriers at OAK. On the other hand, as a major cargo airport, OAK has fewer operational challenges than SFO due in part to more favorable weather conditions.
Strategies for Global Gateways • Expansion/modernization of transload facilities, distribution centers, and
warehouses near the Port of Oakland – Development of strategies to retain existing warehouse and distribution centers near the Port of Oakland for that portion of imports ultimately destined for Bay Area markets would help reduce truck vehicle miles traveled (VMT), particularly on I-880, I-238, and I-580. Further, having more local warehousing space geared for transloading could make the Port of Oakland a more attractive import port, and could provide job diversification opportunities for the Bay Area.
The reclamation of the Oakland Army Base will provide additional warehouses adjacent to the Port. It is also recommended that an updated study be done to understand the feasibility of developing other Bay Area ports and/or modernizing existing warehouse and transload facilities near the port, such as those along I-880.
• Container terminal and intermodal rail terminal development and modernization – Through the Outer Harbor Intermodal Terminal (OHIT) project, a new intermodal terminal will provide direct rail access and improved and modernized cargo-handling capabilities at the Port of Oakland. In addition, modernization of existing terminals is another important type of strategy to improve cargo-handling capabilities.
• Bulk and auto terminal expansion and modernization – In addition to container terminals, bulk and auto terminals need expansion and modernization to meet future growth at Bay Area ports. There are several planned projects at the Port of Oakland, the Port of Redwood City, and the Port of San Francisco that will address this.
23 Air Cargo Mode Choice and Demand Study, prepared for Caltrans by TranSystems, 2013.

San Francisco Bay Area Freight Mobility Study
California Department of Transportation ES-27
• Deepwater channel maintenance and dredging – In addition to the Port of Oakland dredging needs described previously, maintenance dredging of the Baldwin Ship Channel (which extends from the Golden Gate, through the Carquinez Straits, to approximately the Pittsburg/Antioch boundary) is needed to ensure that ports along the Carquinez Straits and San Joaquin River in Contra Costa and Solano Counties (including Port of Oakland, the Port of Richmond and several oil terminals) can remain viable for exporting bulk commodities, such as petroleum coke, waste and scrap, and other energy and chemical products. There are also plans for channel deepening at the Port of Redwood City.
• Expansion/modernization of air cargo handling infrastructure – Most of the region’s airports have sufficient cargo capacity and support facilities to meet projected demand. Nonetheless, efforts should be taken at SJC and SFO to maintain existing cargo-handling capability.
• Strategies to ensure sufficient air cargo throughput – Inclement weather at SFO can disrupt the supply chain for the shipment of important cargo. As such, it would be useful to evaluate strategies to ensure sufficient international air cargo throughput, including strategies to increase international cargo at OAK, especially during these weather conditions.
• Improve Port of Oakland truck efficiency through Freight Advanced Traveler Information System (FRATIS) – FRATIS is a technology solution to improve turn times (the amount of time it takes for a truck to move through the terminal gate, pick up or drop off cargo, and to exit the terminal) and terminal efficiencies through improved traveler information for truckers and marine terminal operators. This system can significantly reduce waiting times for truck drayage drivers and improve the overall efficiency and throughput of the terminals. The FRATIS technology can also be expanded to include other ITS applications that would improve port efficiencies without the need for costly infrastructure expansion.
Interregional Corridors
Needs and Deficiencies Central Corridor (I-80, UP Central Corridor, and BNSF Route to Stockton Subdivision)
The Central Corridor is expected to see significant growth in international intermodal rail traffic24 on the Martinez Subdivision and increased passenger rail conflicts with expanded services on the Capitol Corridor and the Amtrak San Joaquin service. Addressing these issues is critical for continued growth of the 24 International intermodal rail traffic is rail traffic coming to or from the Port of
Oakland in containers.

San Francisco Bay Area Freight Mobility Study
ES-28 California Department of Transportation
Port of Oakland’s import business. In addition, a new area of need has emerged related to growth in movement of crude oil by rail from Bakken fields and North Dakota into the region’s oil refineries along the northern Contra Costa waterfront. This has created a new source of growth in rail traffic on the Martinez Subdivision25, and is also impacting the lesser used UP Tracy and BNSF Stockton Subdivisions26. In addition to the capacity issues raised by the anticipated growth in rail traffic, there is a need to continue to assess safety concerns and impacts on roadway-rail grade crossings.
For the foreseeable future, interregional highway trips on I-80 are not expected to increase significantly as many carriers prefer use of the I-580 to I-5 interregional connection. There are heavy congestion on the portion of I-80 through Alameda and Contra Costa Counties, but this section serves largely intraregional traffic and its needs and deficiencies are presented in the discussion of the intraregional core system.
Altamont Corridor (I-580 and UP Oakland Subdivision)
The Altamont Corridor carries the greatest volume of interregional truck traffic. Currently, I-580 has the areas of highest truck delay in the region which is expected to worsen in the future. At present, even with the Altamont Corridor Express (ACE) passenger service, the UP Oakland Subdivision27 is a relatively low-volume rail corridor, but rail traffic could grow and service conflicts arise if it is used as a reliever route for the Martinez Subdivision. There is also potential for using this route as a short-haul rail connection between the Central Valley and the Port of Oakland. The 2013 California State Rail Plan has identified bottlenecks between Elmhurst and Newark in Alameda County on the UP mainline where the Oakland Subdivision connects with the Coast Subdivision28.
25 A railroad subdivision is a segment of track usually corresponding to a crew district
(the area within which a single crew will operate without a crew change). UP Martinez Subdivision is UP’s mainline track running from Richmond north to Roseville.
26 BNSF’ Stockton Subdivision is BNSF’s mainline track that links the Bay Area to the Central Valley via Stockton and then running south to Fresno.
27 UP’s Oakland Subdivision is UP’s mainline track running south from Oakland through San Leandro, Hayward, Union City, and Fremont, and then heading east over the Altamont Pass.
28 UP’s Coast Subdivision is a parallel rail line to the Oakland subdivision running from Elmhurst to Diridon through Newark and Santa Clara.
San Francisco Bay Area Freight Mobility Study
California Department of Transportation ES-29
Strategies for Interregional Corridors Many interregional corridor projects also benefit the intraregional core network.
• Preservation of highway infrastructure – Deterioration of highways and bridges due to future growth in heavy-truck volumes will create a growing need for highway maintenance and preservation. Given that the highest volumes of heavy-truck traffic are found on the I-580 interregional corridor, this is an area of particular concern for long-term maintenance and preservation.
• Relieve freight rail bottlenecks – Strategies to help relieve rail bottlenecks can include rail track additions and improvements, signal improvements, raising tunnel clearance, adding additional rail connections to create alternative route choices and distribute traffic, and positive train control. A number of projects have been identified including several track and signal improvements on the UP Martinez and Oakland Subdivisions and BNSF Stockton Subdivision.
• Improvement and separation of at-grade roadway-rail crossings – Strategies to improve safety and reduce delays at these locations can range from grade separations, consolidations of crossings, and improved signalization along all routes, especially those with the highest risk for accidents and delay.
• Continue development of Marine Highway and additional rail connections – Providing modal alternatives can relieve some of the pressure on congested highway corridors. The portion of the M-580 Marine Highway already in operation is a regular barge service for containerized cargo, providing increased connectivity between the Port of Oakland and the Port of Stockton. Projects such as the Marine Highway and short-haul rail services can create important system redundancy and resiliency, along with diverting truck traffic off of especially congested interregional corridors. Continuing reevaluation of these alternative modal services should be conducted.
• Freeway delay reduction strategies – Infrastructure strategies to reduce delays include capacity expansion and improvement, interchange reconfiguration, and operations and safety improvements. Projects such as truck-only lanes, auxiliary lanes, lane widening and new alignments, interchange upgrades and reconfigurations, and local operational improvements are included in the planned projects presented in the appendix.
• Intelligent Transportation System (ITS) strategies to improve interregional corridor freight system efficiency – Intelligent Transportation Systems are applications of advanced information and communications technology to

San Francisco Bay Area Freight Mobility Study
ES-30 California Department of Transportation
surface transportation to achieve improved safety and mobility. 29In addition to infrastructure improvements, ITS strategies should be adopted to get the most out of the overall transportation system to reduce delay, reduce nonrecurring congestion, and improve overall operations of the corridors. There are currently several projects planned that will implement Integrated Corridor Mobility (ICM) strategies along I-80, including Adaptive Ramp Metering (ARM) and Active Traffic Management (ATM).
• Improvement of existing interregional highways that are not currently used extensively for truck traffic – SR 152 is a prime example of a corridor that has potential to offer increased interregional benefits to agricultural traffic traversing the Bay Area between the Central Coast and the Central Valley. It could also provide an alternative route for distributing traffic from warehouses in the Central Valley to South Bay population centers. However, to meet this objective, improvements will need to be made to make this a safe and efficient route for trucks. Caltrans’ Interregional Transportation Strategic Plan (ITSP) recommends that the various MPOs and RTPAs along the corridor should study a range of alternatives to completing the necessary improvements to make SR 152 a major interregional corridor. Similarly, U.S. 101 is likely to increase in importance as an interregional corridor connecting with the Central Coast. The improvement program identified in the ITSP for this corridor should also be fully implemented.
Intraregional Core System
Needs and Deficiencies The Central Core Roads (I-880, I-80 in Alameda and Contra Costa Counties, and Portions of U.S. 101 on the Peninsula)
Several intraregional routes experience high levels of truck delay because they are also heavily used commuter routes. I-880 has several operational bottlenecks that have been identified in this report that further limit capacity. Truck safety issues have been identified on I-880 in segments between I-980 and I-80 in the north and between SR 92 and I-238 in the south.
I-80 also has significant truck delays in the segments in the East Bay that provide access to Northern Alameda County and West Contra Costa County. These are among the worst traffic bottlenecks in the region and also affect trucks, particularly those moving to and from the Bay Bridge.
U.S. 101 has much lower truck volumes than does I-880; however, there are a number of bottlenecks along U.S. 101 that have relatively high levels of truck delay. Truck volumes on U.S. 101 are generally highest in Santa Clara County, 29 Intelligent Transportation Systems (ITS) Standards Program Strategic Plan, 2011-2014,
Joint ITS Program Office, U.S. Department of Transportation, April 2011.

San Francisco Bay Area Freight Mobility Study
California Department of Transportation ES-31
and collision rates are higher than statewide average on segments between McKee Road and SR 87, and between I-280 and McKee Road.
I-680, SR 4, SR 92, SR 37, and Others
For the Second Tier System, I-680 has comparable truck volumes to I-880 south of I-580. These routes share the demand for truck traffic moving to and from the South Bay and Fremont. Other routes have needs that are tied to the specific industries they serve.
Strategies for Intraregional Core System • Strategies to promote overall freeway travel conditions – Freeway
improvement strategies include auxiliary lane additions to address operational issues; widening and interchange improvements and truck climbing lanes.
• Strategies to improve Transbay connections – The impact that congestion on the Transbay bridges has on goods movement, particularly for air cargo (which is often using expedited delivery services) needs to be better understood. Potential strategies to address the need for improved connectivity could include using alternative modal services such as ferries for Transbay goods movement.
Urban Goods Movement Needs and Issues
Needs and Deficiencies The needs and deficiencies in the urban goods movement system are caused by: 1) the lack of comprehensive arterial corridor system planning across jurisdictions, and 2) future land use trends. The major arterial truck routes are primarily city and county streets and roads that cross jurisdictional boundaries and are not usually managed as a system. This can result in discontinuity in regional arterial truck corridors; inconsistent size and weight restrictions or time-of-day controls; lack of signal coordination considering the acceleration and deceleration characteristics of heavy trucks; and inconsistency of street design features, particularly in regard to geometrics and accommodation of multiple modes of travel (auto, truck, transit, bicycle, and pedestrian) within a highly constrained right-of-way. Because most regional studies tend to focus on the major freight hubs and the State Highway System (SHS), there is less discussion of the needs of arterial corridors.
A second cause of deficiencies and needs in the urban goods movement system is primarily related to future land use trends. Current land use and real estate market trends are pushing many goods movement-dependent industries to locations on the periphery of the region or out of the region altogether. For many businesses, there will still be a need to access the central core areas, and these emerging development patterns will create a need for trucks to travel longer distances. Truck drivers typically try to avoid traveling during peak periods.

San Francisco Bay Area Freight Mobility Study
ES-32 California Department of Transportation
However, if trucks have to move from locations outside of the region back to markets in the central Bay Area, it will become increasingly difficult for trucks to avoid peak period travel and this will further exacerbate peak period congestion, increase truck-related pollution, and increase the costs of goods movement in the Bay Area.
Strategies for Urban Goods Movement • Improvement and separation of at-grade highway-rail crossings. At-grade
crossing improvements are needed to reduce impacts on communities along the urban goods movement network. Many of the locations that need grade separations are in shared-use corridors with both freight and passenger movements.
• Truck parking infrastructure development and expansion. Lack of truck parking for pickup/delivery activities has been an ongoing problem in the Bay Area. A comprehensive study addressing major industrial centers in the region should be conducted.
• Strategies to improve travel conditions on arterial corridors. Projects including selective arterial widening, extension of truck routes to improve connectivity, and arterial safety improvements are all projects that will improve the overall travel conditions on urban goods movement roadways.
• Arterial Smart Corridors. Smart Corridors offer technological upgrades, such as transit or truck signal priority, closed-circuit television cameras (CCTV), and arterial Dynamic Message Signs (DMS) at major decision points. These added improvements provide the same level of situational awareness found on the region’s freeways. Currently in the Bay Area, there is an East Bay SMART corridors program in place, which consists of two major arterial corridors – the San Pablo Avenue (SR 123) and the Hesperian/International/East 14th Boulevard corridors30 (partially SR 185) – primarily aimed at improving bus operations and/or freeway operations. If arterial Smart Corridors are created on local truck routes, it would also be possible to examine ways to adjust signal timing to account for turning movements of heavy trucks, or to experiment with truck signal priority in industrial areas.
• Development of comprehensive arterial truck corridor system plans. Much as there has been a move to develop Corridor System Management Plans (CSMP) primarily for the State’s freeway system, it would be beneficial for Caltrans and MTC to work with the county congestion management agencies, transportation commissions, and the cities in the region to develop comprehensive arterial corridor system plans for the major arterial truck corridors in the region. These plans should consider the need to maintain
30 http://www.accma.ca.gov/pages/HomeSMARTCorrProg.aspx.

San Francisco Bay Area Freight Mobility Study
California Department of Transportation ES-33
continuity in truck routes and restrictions, should address truck operations and management, and should provide guidance for Complete Streets implementation that includes consideration of truck movements, along with other travel modes.
Last-Mile Connectors
Needs and Deficiencies Last-mile connector needs and deficiencies include lack of capacity to keep up with growth in the freight hubs served by last-mile connectors, maintenance needs of what are often city streets handling heavy trucks, rail connector operational problems, geometric deficiencies, and conflicts between trucks and trains with auto, transit, bicycle, and pedestrian traffic.
Strategies for Last-Mile Connectors • Improvement of rail connectors – Constraints on rail cargo movements to
ports and industries are due to insufficient capacity and operational challenges on last-mile connectors. One prominent example is the Outer Harbor Intermodal Terminal (OHIT) Rail Access Project at the Port of Oakland. Currently, delays in rail access due to operational conflicts at the Port impact both UP and BNSF operations when entering the Port. Another example of a rail connector project is the Quint Street Lead Port Rail Access Project that will relocate and improve a one-mile spur connecting the Caltrain mainline track to the Port of San Francisco railyard near Illinois Street.
• Improvement of roadway access to freight facilities – This includes improved access to airports, intermodal rail facilities, and ports, as well as other freight activity centers. There are several projects including access improvements at OAK, improvements to the Oakland Army Base, and several interchange improvement, reconstruction and general roadway projects to access major industrial development around the region.
ES.7 COMMUNITY AND ENVIRONMENTAL IMPACTS AND MITIGATION STRATEGIES
In addition to the needs and deficiencies of the freight system that are directly related to infrastructure and operational needs, there are also environmental and community impacts resulting from freight movement in the Bay Area that need to be addressed with targeted strategies.

San Francisco Bay Area Freight Mobility Study
ES-34 California Department of Transportation
Community and Environmental Impacts
Air Quality Diesel Particulate Matter
In the Bay Area, particulate matter of 2.5 microns or less (PM2.5) is the pollutant of most concern as it poses 85 percent of the cancer risk from air pollutants.31 Motor vehicle exhaust is largely responsible for PM2.5 and can create health risks. In the future, with current regulations, PM2.5 from on- and off-road motor vehicles is expected to decline until 2020 due to aggressive regulations on diesel engines. After most of the current fleet has been replaced and adopted the cleaner engines, emissions are expected to experience relatively slow growth as growth in VMT overtakes improvement in engine emissions32.
Nitrogen Oxides and Ozone
As compared to the rest of California’s nonattainment areas, the Bay Area has relatively less severe problems with ozone. In the future, nitrogen oxide (NOx) (a precursor to ozone) emissions of on-road vehicles are expected to decline due to fleet turnover resulting in cleaner vehicles and more stringent emission regulations for trucks33.
Greenhouse Gases (GHG)
GHG emissions can lead to climate change impacts, such as sea level rise and extreme weather events, which will affect significant portions of the freight infrastructure. In 2007, 95.8 million metric tons of carbon dioxide (CO2)-equivalent GHGs was emitted by all sources in the Bay Area, of which 36.4 percent came from the transportation sector and 76.2 percent of the transportation-sector emissions were attributable to freight.34
Air Quality and Environmental Justice Issues
There are communities in the Bay Area that are disproportionately impacted by air quality issues. These are typically socially and economically disadvantaged communities located near major freight hubs, freight corridors, and industrial enclaves (such as the West Oakland neighborhood next to the Port of Oakland).
31 Bay Area Air Quality management District (BAAQMD) Toxic Air Contaminants
Annual Report, 2011. 32http://www.baaqmd.gov/~/media/Files/Planning%20and%20Research/Plans/PM%
20Planning/ParticulatesMatter_Nov%207.ashx. 33http://www.baaqmd.gov/~/media/Files/Planning%20and%20Research/Plans/PM%
20Planning/ParticulatesMatter_Nov%207.ashx. 34 http://www.baaqmd.gov/~/media/Files/Planning%20and%20Research/
Emission%20Inventory/regionalinventory2007_2_10.ashx.

San Francisco Bay Area Freight Mobility Study
California Department of Transportation ES-35
Independent Owner-Operator (IOO) Issue at the Port of Oakland
In recent years, the California Air Resources Board (CARB) has promulgated new emission standards for drayage trucks serving California’s seaports. Complying with new regulations poses financial challenges for the IOO segment of the trucking industry because the IOOs often lack access to the capital necessary to pay for new trucks. In the past, the State, the Bay Area Air Quality Management District (BAAQMD), and the Port of Oakland have had programs to help IOOs finance conversion to cleaner trucks. However, the next round of emission reductions will require expensive conversions, and there currently is no additional monetary assistance to help pay for the new technologies. How this will be resolved in a manner which protects communities from adverse health impacts of truck emissions while addressing the economic impacts on IOOs has not yet been determined.
Impacts from Proximity to Freight Facilities Apart from air quality, freight movement often creates impacts on communities in proximity to freight facilities. These can include light pollution from activities, such as nighttime freight operations; noise pollution from truck braking and horn blowing by trains; vibrations from heavy trucks and rail; and ecosystem pollution (water, soil, wetlands) from accidents involving the movement of hazardous materials. In the Bay Area, the communities in the East Bay along the I-880 and I-80 corridors are likely to experience the largest impacts from freight activities, especially since there is a high degree of residential development that is directly adjacent to the corridor. In addition to environmental issues, several communities in the Bay Area are dealing with truck encroachment in neighborhoods often related to the following causes: 1) lack of adequate parking and service facilities, 2) lack of signage for truck routes, 3) lack of adequate access to service facilities and freight facilities via legally designated routes, and 4) lack of enforcement and regulation of truck activity. Terminal operations, terminal delay, and hours of service regulations also have effects on this illegal parking issue.
Mitigation Strategies
Air Quality • Continued implementation of major regulatory standards and adopted
regional control measures to reduce truck emissions – While there are many regulations that affect emissions from trucks, the one that will have the greatest impact is CARB’s On-Road Heavy-Duty Diesel Vehicles (In-Use) Regulation, which applies to trucks already on the road. By 2023, nearly all trucks and buses will need to have 2010 model-year engines or equivalent. There are a number of other new regulations that will have an impact on freight emissions.

San Francisco Bay Area Freight Mobility Study
ES-36 California Department of Transportation
The BAAQMD has also adopted several mobile source and transportation control measures as part of the 2010 Clean Air Plan that will help address the need to reduce emissions from freight sources, including incentives to accelerate replacement of heavy-duty on-road diesel engines and installation of low NOx engine retrofits; and incentives for installation of other low emission goods movement equipment.
• Continue implementation of the Maritime Air Quality Improvement Plan (MAQIP) – The Port of Oakland, in partnership with BAAQMD and other stakeholders, developed the MAQIP to reduce diesel PM emissions from maritime activities and stationary point sources.35 As part of this plan, the Port committed to a goal of reducing diesel PM from seaport sources by 85 percent between 2005 and 2020, with interim goals set for 2012. To achieve this goal, the Port is pursuing strategies involving source controls, operational changes, and assistance with regulatory compliance for affected port-related businesses. Based on the 2012 Inventory36, the Port of Oakland already has achieved a 70 percent reduction in PM2.5 and is on track to fully achieve its air quality targets by 2020.
• Address funding/financing needs of IOOs at the Port of Oakland for engine conversions to meet new regulatory standards – While various partner agencies were able to make funding available to the IOOs for the first round of engine retrofits associated with CARB’ drayage truck emission rules, these funds have been exhausted. New sources of assistance are needed.
• Explore opportunities for freight rail electrification – Options for electrifying freight rail infrastructure were reviewed in 2007 as part of the Bay Area Regional Rail Plan. At that time, it was determined that the economic and logistical hurdles to freight rail electrification are significant. Recent studies in Southern California suggest that while technology for rail electrification continues to advance, there is still development needed before a practical system that meets the freight needs of the Western U.S. can be implemented. Nonetheless, the region would benefit from continued technology research and development (R&D) programs at the State and federal levels to assess freight rail electrification options for the future.
• Improve emission performance of diesel-powered locomotives – By 2025, the U.S. Environmental Protection Agency (EPA) estimates that 34 percent of the nationwide Class I line-haul fleet will be using Tier 4-compliant locomotives, the most stringent emission standards adopted by EPA. Nevertheless, switcher locomotives, which operate in proximity to rail yards
35 Bay Area Air Quality Management District, Understanding Particulate Matter –
Protecting Public Health in the San Francisco Bay Area, November 2012. 36 http://www.portofoakland.com/pdf/environment/maqip_emissions_results.pdf.

San Francisco Bay Area Freight Mobility Study
California Department of Transportation ES-37
and thereby impact urban air quality, tend to be older and more polluting than line-haul locomotives. One strategy is to encourage rail operators to purchase new locomotives for switching activity rather than relying on retired line-haul locomotives.
• Work with fleet operators and fuel suppliers to assist with implementation of alternative fuel options for trucking – In recent years, there has been renewed interest in the use of low-emission, alternative fuels. In particular, the new sources of low-cost natural gas in the U.S. have made this a very competitively priced option for trucking fleets. A number of private companies have begun to develop a natural gas fueling infrastructure throughout the U.S. Regional and State agencies could aid this process by helping to assemble the data necessary to conduct fuel market assessments, and provide these data on potential site locations.
Land Use Strategies • Preserve industrial land – Several U.S. cities have taken steps to preserve
industrial land. The State and region can look to these cases to provide guidance to cities as they update their general plans, for instance, the cleaning up of brownfields.
ES.8 PERFORMANCE MEASURES Beyond recommending and implementing strategies, the public sector should establish a way to measure progress. Performance measures are increasingly used throughout the country to assess conditions of the freight system and to evaluate progress towards improvement goals. The implementation of these measures, however, is often stymied in part by the shared public and private sector roles in the freight system, which limits the ability of either side to have full knowledge and understanding of the data available to assess performance. A number of efforts are underway at the federal and State levels to develop approaches to freight performance measurement in cooperation with the private sector to make sure that data are available with the proper confidentiality protections, and that performance measures address the goals of both public and private entities.
The California Freight Advisory Committee (CFAC) is helping to advise Caltrans on the development of State freight performance measures consistent with Moving Ahead for Progress in the 21st Century (MAP-21), the federal funding and reauthorization bill for federal surface transportation spending (Public Law 112-141, 2012). In November 2013, the CFAC reviewed draft performance measures tied to six goals. While the goals have been solidified, the specific performance measures are still under review. The six categories of goals that were developed as part of this process are:

San Francisco Bay Area Freight Mobility Study
ES-38 California Department of Transportation
1. Economic,
2. Congestion,
3. Safety and security,
4. System infrastructure and preservation,
5. Innovative technology and practices, and
6. Environmental stewardship.
This study recommends a set of potential freight performance measures that would be applicable to the Bay Area. These measures are selected to ensure their near-term implementability, evaluated from the availability of data, ease of reporting, and resource requirements. Only a handful of measures are being studied to avoid the lack of focus when too many measures are introduced.
ES.9 RECOMMENDED FUTURE STUDIES Much work has been done in the Bay Area to determine the critical role of goods movement in the regional economy, to understand current and future system performance and needs, to develop strategies to improve freight system performance, and to concurrently mitigate impacts on communities and the environment. Additional work will be needed to refine these strategies and to turn them into actionable projects and policies. This study recommends the following areas for future study.
Data and Modeling Capabilities The San Francisco Bay Area has limited freight flow data and modeling capability with which to evaluate project impacts and identify future deficiencies in the freight system. The following are recommended future studies and data development efforts that would address this issue:
• Develop county-level commodity flow data and analysis on major interregional corridors;
• Incrementally develop regional truck model improvements starting with the development of a port model, followed by development of an interregional corridor model, and concluding with development of a new truck trip generation and distribution model; and
• Develop an at-grade rail crossing delay model for use in prioritizing grade separation needs and projects.

San Francisco Bay Area Freight Mobility Study
California Department of Transportation ES-39
Global Gateway Needs Analysis Two trends were identified related to the region’s global gateways that would benefit from follow-up studies:
• A study to better understand transloading activity and warehousing needs related to the Port of Oakland and to better understand patterns of Port inland flows; and
• A study to better understand how commodity growth trends are likely to impact the needs of the region’s small ports.
Interregional Corridor Analysis One of the most critical freight issues identified in the San Francisco Bay Area Freight Mobility Study (SFBAFMS) is the limited interregional connections for freight movement. A more comprehensive analysis of future growth on the region’s primary interregional corridors, in cooperation with neighboring regions, is recommended to determine potential strategies (such as expanding existing corridors, alternative modal services, truck-only lanes) for addressing growth.
Industry Supply Chain Studies A follow-up analysis is needed focusing on the same industries that were studied in this report to get a more in-depth sense of how industry supply chains are changing, what the growth prospects for these industries are in the Bay Area, and how transportation needs are changing. Regionally significant industries with expected changes in supply chain patterns include containerized imports of consumer goods, petroleum refining, precision instrument manufacturing and biomedical equipment manufacturing.
Urban Goods Movement Toolbox and Guidance for Priority Development Areas (PDA) As the Bay Area economy continues to shift away from manufacturing and is increasingly a “knowledge-based” economy, goods movement will increasingly be focused on supplying local knowledge-based businesses and consumers. This urban goods movement activity will occur on local streets and arterials in increasingly dense, mixed-use developments. The approach that the region is taking to PDAs37 and Complete Streets expresses this vision of the Bay Area’s future urban form. It is important that the region develop approaches that cities
37 Priority Development Areas (PDA) represent areas local Bay Area jurisdictions have
identified as part of the Sustainable Communities Strategy in Plan Bay Area for new and/or intensified development.

San Francisco Bay Area Freight Mobility Study
ES-40 California Department of Transportation
can use in various PDA types to accommodate goods movement, as needed. This could include providing guidance in some of the following areas:
• Developing land use guidelines that reduce conflicts between goods movement and other uses;
• Examining truck routes to ensure route continuity across jurisdictional lines;
• Developing guidelines for truck routes and potential approaches to create a hierarchy of truck routes when there are other modal users in the same right-of-way;
• Dissemination of information that can better facilitate truck navigation;
• Examining needs for heavy-haul and overdimensional trucks and hazardous waste transport from both a regional and local perspective and ensuring that routes address safety concerns, pavement maintenance issues, and neighborhood impacts and ensuring continuity of routes across jurisdictions; and
• Developing a regional inventory of truck parking and needs at key concentrations of goods movement activity throughout the region and developing strategies to manage truck parking, particularly on local streets around warehouses, manufacturing areas, and other truck-oriented land uses.
Freight System Resiliency Study The region needs to examine the degree to which it would be vulnerable to natural and manmade disasters, how much redundancy exists in the system to be able to continue to provide critical supplies to industry and to support populations, and how long it would take to bring the most critical freight infrastructure back on line. An example of a study to understand the effect of sea level rise was recently done that looked at the effect of sea level rise on the shorelines of San Francisco.38 The study concluded that under various potential sea level rise scenarios, large industrial areas along the Bay would be at risk of flood damage. With a 16-inch sea level rise, approximately 72 percent of each of SFO and OAK is at risk with potential to disrupt approximately one million metric tons of cargo. In addition, highway segments and rail lines would also be at risk. The report provides a framework for selecting adaptation strategies to address these risks.
38 Living with Rising Bay: Vulnerability and Adaptation in San Francisco Bay and on its
Shoreline, October 6, 2011, San Francisco Bay Conservation and Development Commission, http://www.bcdc.ca.gov/BPA/LivingWithRisingBay.pdf.

San Francisco Bay Area Freight Mobility Study
California Department of Transportation ES-41
Freight ITS and Technology Applications A number of technology applications have been suggested in this final report, including the FRATIS39 concept around ports and intermodal hubs, Smart Corridors, and virtual container yards at the Port of Oakland. Connected vehicles are another area of technology that could be applied to improve freight operations in the Bay Area. Connected vehicles provide communications links between on-board vehicle information systems and roadside systems to provide drivers with information or to control the operations of the vehicles (e.g., maintain safe vehicle spacing). A more comprehensive freight technology plan that incorporates the best applications of the technologies described above to regional freight needs would benefit the Bay Area.
Additional Study of Freight and the Environment The highest priorities for future study are:
• Development of new funding/financing resources for converting drayage trucks to cleaner running engines as required by current regulations;
• Technical assessment of the potential for zero/near zero emissions freight investments in the region;
• Preparing market and site selection data for alternative fuels infrastructure; and
• Continued examination of climate change adaptation strategies for vulnerable freight resources.
ES.10 CONCLUSIONS Over the next 25 years, the economy of the Bay Area will continue its transformation in ways that will change the nature of goods movement demand. The region will continue to be a major international trade gateway, primarily through the Port of Oakland and San Francisco International Airport. The Port of Oakland will continue to see relative balance between exports and imports. Success in growing the import business at the Port will require continued improvement in the frequency and reliability of rail services so that the Port can serve a larger market area. Potential rail bottlenecks, especially on the Martinez Subdivision where both freight and passenger rail growth is anticipated, will need to be addressed, as will the impacts of delays and safety concerns at at-grade crossings. Expansion of marine terminal capacity and addition of new transload warehouses, such as those planned at the former Oakland Army Base, 39 Freight Advanced Traveler Information System (FRATIS) is a web-based software
system that provides terminal operators with a “prenotification” of trucks arriving at the Port for a specific load.

San Francisco Bay Area Freight Mobility Study
ES-42 California Department of Transportation
can make the Port of Oakland a more attractive import port while capturing the economic benefits of the growth for Bay Area residents. Expansion of export cargoes, particularly agricultural products from the Central Valley, along with the growth in distribution of imports from inland warehouses, will continue to strain capacity on I-580, the region’s busiest interregional highway corridor. With anticipated growth in domestic interregional commodity flows, along with the growth in export traffic and import distribution, a variety of approaches will be needed to address east-west connectivity on interregional corridors. This may include expansion of existing routes, the use of ITS technologies to more effectively manage existing capacity, and the development of alternative modes, such as short-haul intermodal shuttles and inland barge services (such as the M-580 service that was recently initiated between the Port of Oakland and the Port of Stockton).
The region’s airports are expected to experience significant international cargo growth and modest domestic cargo growth. Existing capacity is likely to be sufficient for the foreseeable future although over the long term, finding ways to more effectively address Transbay access to the airports or more evenly balance international cargo services between SFO and OAK could help achieve greater overall efficiency in the region’s air cargo system.
Given the rising incomes of Bay Area residents and regional land use patterns that will continue to emphasize higher density residential and commercial development, the region will need to address potential conflicts in the urban goods movement system and along last-mile connectors. Caltrans and MTC can assist the region’s cities that will be addressing these issues by developing guidelines for incorporating truck management in Complete Streets40 planning, by developing comprehensive arterial system management, and by helping with the implementation of Smart Corridor Systems that incorporate a wide range of ITS technologies to provide information to truckers/motorists and to help
40 Complete Streets is a concept in which the needs of all users of a street are considered
and facilitated by the street design features and treatments. The definition of what users should be considered may vary depending on the context and consideration of trucks is not consistent in Complete Streets policies and implementation around the country. For example, Caltrans Deputy Directive DD-64-R1, which establishes the Department’s Complete Streets policy, defines Complete Streets as “a transportation facility that is planned, designed, operated, and maintained to provide safe mobility for all users, including bicyclists, pedestrians, transit riders, and motorists appropriate to the function and context of the facility.” However, in the Department’s Final Complete Streets Implementation Action Plan (February 1, 2010), it further defines Complete Streets as “a transportation facility that is planned, designed, operated, and maintained to provide safe mobility for all users, including bicyclists, pedestrians, transit vehicles, truckers, and motorists, appropriate to the function and context of the facility” (italics added).
San Francisco Bay Area Freight Mobility Study
California Department of Transportation ES-43
manage traffic movements to improve mobility without the need to build new roadway capacity.
The Bay Area has made significant progress in addressing air quality and environmental justice issues that have arisen in connection with goods movement activity near neighborhoods. A pressing near-term need is to find ways to continue assisting drayage truck drivers to make the transition to lower emission trucks. Other neighborhood issues, such as addressing the lack of truck parking and inconsistent truck routes, may also require regional solutions.
While other regions of California have often received greater attention at the State and national levels, the Bay Area is poised to play a leadership role in freight mobility and goods movement. Bay Area innovation can help advance goods movement planning with the focus on the following issues and opportunities:
• Planning for the export economy, particularly for high value products (such as advanced manufacturing, specialty agricultural and food products, and wine) and for the growing bulk products market (particularly waste and scrap exports);
• Planning goods movement in a mega-regional economy that emphasizes the strong economic linkages among the Bay Area, the Sacramento region, the San Joaquin Valley, and the Central Coast region;
• Planning for farm-to-market goods movement needs that links the Bay Area with other Northern California and Central Valley regions; and
• Planning for goods movement in a modern urban metropolitan center that addresses the role of goods movement in Complete Streets, develops approaches to comprehensive arterial system planning, and that applies innovative technology approaches to managing urban truck movements.


San Francisco Bay Area Freight Mobility Study
California Department of Transportation 1-1
1.0 Introduction
This report presents a description and analysis of goods movement in the San Francisco Bay Area (Bay Area). It outlines the importance of goods movement, identifies issues and needs of the goods movement system, and suggests strategies for ensuring that goods movement can continue to contribute to the region’s mobility, economic, and environmental sustainability goals. The report is the final product of the San Francisco Bay Area Freight Mobility Study (SFBAFMS), which was initiated to contribute to an update of MTC’s 2004 Regional Goods Movement Study for the San Francisco Bay Area, provide input about the Bay Area freight system needs to the 2014 California Freight Mobility Plan, and to lay a foundation for future freight planning and policy in the Bay Area for the California Department of Transportation (Caltrans), the Metropolitan Transportation Commission (MTC), the Alameda County Transportation Commission, and other local agencies who are partners in implementing freight transportation plans and policies. The report is organized as follows:
• Section 2.0, Goods Movement and the Bay Area – This section discusses why goods movement is important in the Bay Area, how goods movement is linked to the regional economy, and how the economic linkages create demand on the regional goods movement system.
• Section 3.0, The Goods Movement System – This section provides a comprehensive overview of the highway, rail, maritime, and air cargo infrastructure that make up the goods movement system in the Bay Area.
• Section 4.0, Functions of the Goods Movement System – This section discusses the goods movement system in terms of functions (global gateway, interregional corridors, intraregional core system, urban goods movement system, last-mile connectors, and domestic air cargo system); and describes how the elements of the multimodal transportation system support these functions. For each function, an overview, key demand drivers, and trends are also discussed.
• Section 5.0, Modal Traffic Implications – This section looks at the modal system demand and modal traffic that are derived from supporting the goods movement functions.
• Section 6.0, System Needs and Strategies – This section discusses the issues and needs of the Bay Area goods movement system in terms of its functional elements and for each function, it also provides strategies that can address the issues and needs. Strategies include programs, policies, and a list of potential investments (projects).
San Francisco Bay Area Freight Mobility Study
1-2 California Department of Transportation
• Section 7.0, Community and Environmental Impacts and Mitigation Strategies – This section summarizes community and environmental impacts that arise as a result of goods movement activities and suggests mitigation strategies to reduce the impacts.
• Section 8.0, Performance Measurement – This section provides a framework, as well as recommended performance measures, for the Bay Area to determine the status of the system and to track progress towards an improved goods movement system.
• Section 9.0, Recommended Future Studies – This section provides further guidance on next steps the Bay Area should undertake to improve its goods movement system.
• Section 10.0, Conclusion.

San Francisco Bay Area Freight Mobility Study
California Department of Transportation 2-1
2.0 Goods Movement and the Bay Area
Freight mobility is what economists refer to as a derived demand – the demand for goods movement is an outgrowth of overall economic activity. The types of goods that are moved, the transportation modes that are used, the origin-destination patterns, and the level of overall demand are all tied to the characteristics of the regional economy and its relationship to the international, national, and state economy. The Bay Area freight mobility system supports global supply chains and regional industries that trade in international, domestic, and local markets.
Key industries in the Bay Area that rely on goods movement include manufacturing (hi-tech electronics, biotech and medical instruments, petroleum, wine), construction, and wholesale and retail trade. Through provision of services, such as warehousing and distribution, rail and air cargo transportation, local and long-haul truck deliveries, among many other activities, the goods movement system supports the region’s industries and consumer base. Industries that generate the largest share of goods movement activity and that account for the most spending on freight transportation contribute significantly to the Bay Area economy, in terms of output41, gross regional product (GRP)42, and employment. These industries require an efficient and high quality freight system to remain competitive. An inefficient system can result in higher costs for Bay Area consumers and businesses and can put the region in a comparative disadvantage. This section explores the economic importance of freight mobility in the Bay Area, the contribution to the economy from transportation spending and the role of goods movement service providers. In addition, to better understand goods movement in the Bay Area, this report begins with a discussion of the population and economic characteristics of the region that drive 41 Output measures the value of all goods and services delivered in the economy,
including intermediate consumption (inputs). Total output from goods movement-dependent industries provides a good indicator of the total value of products transported in the goods movement system and, as such, is the best indicator of growth in demand over time.
42 GRP is one of the key measures of the economy and is defined as the market value of all final goods and services within a region in a given period of time. Value added is similar to GRP for a particular industry, but does not include the cost of intermediate consumption. As there are few published sources of data that provide information on GRP broken out by industry, in this report we provide information on the total value-added as a proxy for GRP.

San Francisco Bay Area Freight Mobility Study
2-2 California Department of Transportation
goods movement demand and explains the role of goods movement in the regional economy.
2.1 OVERVIEW OF BAY AREA POPULATION, DEMOGRAPHICS, AND ECONOMY The nine-county Bay Area region (Alameda, Contra Costa, Marin, Napa, San Francisco, San Mateo, Santa Clara, and Sonoma Counties) was home to over 7.1 million people in 2010 and provided jobs for almost 3.4 million people who live in the Bay Area and neighboring counties.43 As such, the Bay Area boasts one of the largest economies in the United States. The Bay Area ranks 19th in the world when compared to national economies, with a Gross Regional Product (GRP) of $539 billion in 2011.44
Over the past 20 years, the region has experienced modest growth in population and employment that is expected to continue through 2040 (see Table 2.1). According to the Bay Area Council Economic Institute, population has grown from just over 6 million in 1990 to about 7.2 million in 2011, which is a modest 0.78 percent per year growth and slower than the national average of 1.07 percent.45 According to forecasts by the Association of Bay Area Governments (ABAG), the Bay Area will add 2.1 million residents between 2010 and 2040, and will remain California’s second largest population and economic center (see Table 2.1).46
43 Plan Bay Area 2040, Association of Bay Area Governments (ABAG) and Metropolitan
Transportation Commission (MTC), 2013. 44 ABAG and MTC, 2013. 45 Bay Area Council Economic Institute, The Bay Area, A Regional Economic Assessment,
October 2012. 46 ABAG and MTC, 2013.

San Francisco Bay Area Freight Mobility Study
California Department of Transportation 2-3
Table 2.1 Bay Area Population, Employment, and Housing Projections, 2010 to 2040
Category 2010 2040 Growth
2010-2040 Percent Change
2010-2040
Population 7,150,740 9,299,150 2,148,410 +30%
Jobs 3,385,300 4,505,220 1,119,920 +33%
Households 2,608,020 3,308,110 700,090 +27%
Housing Units 2,785,950 3,445,950a 660,000 +24%
a 2010 and 2040 values include seasonal housing units.
Source: ABAG, 2013.
The Bay Area also has high per capita income. Figure 2.1 shows that average wages in the Bay Area have been consistently higher than those of other regions of California and the U.S. during the last two decades. Higher income generally leads to higher levels of consumption, higher retail sales, and increased levels of local urban goods movement.
Figure 2.1 Average Wages
Source: The Bay Area, A Regional Economic Assessment, October 2012. Data from Bureau of Economics;
calculations by Bay Area Council Economic Institute.
The Bay Area economy has always been known for its innovation, particularly in the high-technology sector. The economy is continuing to shift away from manufacturing towards the service sector, especially professional, technical, and information services, and this will impact goods movement demand leading to a higher level of small package movements and less emphasis on long-haul movements of manufactured products. Another key driver of goods movement in the Bay Area is the strength of the local tourism and travel industry. Between
San Francisco Bay Area Freight Mobility Study
2-4 California Department of Transportation
1990 and 2011, the accommodation and food services industry and the arts, entertainment, and recreation industry increased their combined share of Bay Area employment from 9.4 percent to 11.7 percent.
Despite the shifts in the Bay Area economy to greater concentration in professional and technical services and travel and tourism, the industrial makeup of the economy remains diverse and this contributes to goods movement demand from a variety of different sectors. Having an economy that is made up of a diverse set of industries also has the advantage of being less likely to be impacted during times of downward market trends of a single industry or industry cluster. The importance of goods movement to the regional economy is discussed in the following section.
2.2 ECONOMIC IMPORTANCE OF GOODS MOVEMENT This report refers to industries that generate the largest share of goods movement demand and spending on freight transportation services as goods movement-dependent industries. While other economic sectors, such as the service sector47, also require goods movement, what really drives goods movement demand is activity in sectors such as manufacturing, construction, wholesale and retail trade, transportation and warehousing, and agriculture and resource-based industries.
These goods movement-dependent industries contribute to the economy as shown in Figures 2.2 and 2.3. Goods movement-dependent industries account for $490.3 billion in total output (51 percent of total regional output); and provide about 1.1 million jobs or 32 percent of total regional employment.48 The explanation for the large difference between their share of industrial output and their share of employment is related to the role in the regional economy of high-
47 The service sector includes information, finance and insurance, real estate and rental
and leasing, professional, scientific and technical services, management services, educational services, health care and social assistance, arts, entertainment and recreation, accommodation and food services, and other services including government.
48 Output data (and value added data) in this report come from IMPLAN. IMPLAN is an economic modeling tool which has compiled a variety of economic output data from different public data sources as part of its core data set and reports these data for counties and with highly disaggregate industry sector detail. Since it is one of the few data sources that provide this level of geographic and sector detail for industry output, it is often used in this report to provide insight into industrial makeup of the region. For employment, ABAG data from Plan Bay Area were used. Since ABAG reports manufacturing and wholesale as one sector, Cambridge Systematics used the employment data ratio for the two sectors from the Center for Continuing Study of the California Economy (CCSCE) to separate them out.

San Francisco Bay Area Freight Mobility Study
California Department of Transportation 2-5
value products that are not labor intensive in their production processes. While the contribution of these industries to regional output is somewhat skewed by the contribution of computer and electronics manufacturing, which conducts most of its production activities off-shore, even taking this into account, goods movement-dependent industries still account for a large share of regional output and employment. Given changes in the regional economy over the last decade and the implications this has for goods movement demand, it is useful to take a closer look at regional manufacturing to better understand its contribution to the economy.
Figure 2.2 Output in Goods Movement-Dependent Industries in the Bay Area, 2011 Billions of Dollars
Source: IMPLAN 2011 and Cambridge Systematics analysis.
Non-goodsMovementDependent,480.8, 49%
Agricultureand NaturalResources,
5.8, 1%
Construction,27.6, 6%
Transportationand Utilities,
29.4, 6%
Manufacturing,365.9 , 75%
Wholesale Trade, 28.2, 6%Retail Trade,
33.3, 7%
GoodsMovementDepedent,490.3, 51%

San Francisco Bay Area Freight Mobility Study
2-6 California Department of Transportation
Figure 2.3 Employment in Goods Movement-Dependent Industries in the Bay Area, Millions of Employees, 2011
Source: ABAG (Plan Bay Area 2013), Center for Continuing Study of the California Economy (CCSCE), and Cambridge
Systematics Analysis. Table 2.2 provides a more detailed look at manufacturing output and employment in the Bay Area. This table shows that computer and related equipment represent almost one-half of all manufacturing output in the Bay Area. While most of this equipment is actually produced and shipped from locations outside of the Bay Area, there are still some specialized computer-related products manufactured in the Bay Area. According to the Federal Highway Administration’s (FHWA) Freight Analysis Framework (FAF) data, the region’s leading outbound commodity category in terms of value is electronic and other electrical equipment and components. Even if it is assumed that most of the output of the computer and related equipment industry in the Bay Area is engineering and design-related activities and none of this output is manufactured product requiring goods movement services, the remainder of the goods movement-dependent industries would still account for almost one-third of the region’s industrial output.
Non-GoodsMovementDependent
2.3, 68%
Agriculture and Natural Resources
0.025, 2%
Construction0.042, 13%
Manufacturing 0.336, 32%
Transportation& Utilities0.099, 9%
Wholesale0.124, 12%
Retail0.336, 32%
GoodsMovementDependent
1.1, 32%

San Francisco Bay Area Freight Mobility Study
California Department of Transportation 2-7
Table 2.2 Manufacturing-Sector Employment Shares in the Bay Area, 2011
Employment Output
Computer and Related Equipment Products 29.6% 47.2%
Electronic Instrument Products 13.8% 5.1%
Food, Beverage, and Tobacco Products 13.0% 5.4%
Metal Products 8.0% 2.1%
Chemical Products 6.8% 6.6%
Machinery 5.4% 2.2%
Wood and Paper Products 4.8% 0.9%
Medical Equipment and Supplies 4.5% 1.3%
Motor Vehicle Products 3.8% 2.3%
Plastics and Rubber Products 3.1% 0.8%
Petroleum and Coal Products 2.5% 25.4%
Textile Products 1.8% 0.2%
Other Miscellaneous Manufactured Products 1.5% 0.3%
Furniture and Related Products 1.4% 0.2%
Total 100.0% 100.0%
Source: IMPLAN: Economic Impact Analysis 2011 and Cambridge Systematics analysis.
Other manufacturing industries that contribute substantially to the region’s economic output include petroleum products and chemicals, electronic and medical instruments and supplies (including biotech products), and food and beverage products (including the output of the region’s wine and spirits industry). These industries generally produce high-value products with specialized, high-quality freight transportation needs, helping to explain the importance of high-cost, high-reliability, and high-speed goods movement modes (such as air cargo and trucking) in the Bay Area goods movement system. Many of these products are also major exports to Asia through the Port of Oakland’s maritime port.
Leading employers among the manufacturing industries include the electronic and medical instruments and supplies industries, the food and beverage industry, and the metal products and machinery manufacturing industries. It should be noted that the Bay Area’s manufacturing sector is experiencing a shift towards advanced manufacturing processes that replaces the older labor-driven manufacturing processes with highly efficient, computer-assisted production processes. Thus, even if the employment in these industries declines or stays stagnant, they can and will continue to experience growth in demand. Thus, growth in output from advanced manufacturing industries will create growth in demand for efficient goods movement services, and trends in output from these

San Francisco Bay Area Freight Mobility Study
2-8 California Department of Transportation
industries is a better predictor of goods movement demand trends than are trends in employment in these industries.
The next largest goods movement-dependent industries, in terms of output in the Bay Area, are retail trade, wholesale trade, and construction, which account for 3.4 percent, 2.9 percent, and 2.8 percent of regional output, respectively. Growth in these industries is driven by growth in the region’s consumer base and rising incomes and consumption levels. Most of the retail and wholesale trade goods consumed in the region are produced outside of the region, either in overseas locations or other parts of the U.S. Trade in these goods creates significant demand for container shipments by ocean and intermodal rail along with trucking from regional distribution centers (which are located primarily in the San Joaquin Valley) and local pickup and delivery services to stores, commercial and service businesses, and residences. As will be discussed later, nonmetallic mineral products (primarily concrete) and stone and gravel used for construction of buildings and roads are among the top commodities (measured in terms of tonnage) moved in the Bay Area, and also indicate the importance of the construction sector in the regional economy.
The transportation industries account for a relatively small share of total regional output, in part, because of the relatively high value of manufactured products, the growth in professional and technical services as a share of the overall Bay Area economy, and consumption of high-value retail products. However, the services that these industries provide are critical to the business processes of the goods movement-dependent industries.
Over the last 20 years, there have been significant changes in the Bay Area economy that are reflected in employment trends for Bay Area goods movement-dependent industries. In the 1980s and 1990s, a major force behind growth in the region was the development and manufacturing of computer hardware driven by the growing demand for personal computer systems. This created substantial demand for high-cost goods movement services (air cargo and trucking), to support this manufacturing activity. As these industries grew and changed their product mix, much of the manufacturing activities moved off-shore, with engineering, design, and other technical activities remaining and expanding in the Bay Area. At the same time, there was significant expansion of software development and information services companies in the Bay Area, leading to rapid growth in professional, scientific, and technical services employment, but reducing the amount of computer hardware and parts that needed to be moved by the regional goods movement system. If this trend towards reduced computer manufacturing in the Bay Area continues in the future, it will reduce the rate of growth in demand for air cargo services, trucking, and warehousing, particularly in the Silicon Valley.
Another trend that impacted goods movement industries in the Bay Area was the movement of older, traditional manufacturing activities and warehousing and distribution jobs out of the Bay Area. This was primarily due to high costs of land and labor in the Bay Area, along with California’s higher regulatory
San Francisco Bay Area Freight Mobility Study
California Department of Transportation 2-9
compliance costs as compared to other parts of the U.S. and overseas locations. Thus, much of the Bay Area’s traditional manufacturing base has relocated to Mexico and other lower cost producer countries. In the case of the loss of warehousing and distribution activities, the availability of cheaper land, lower labor costs, and better access to the interstate highway system from locations in the San Joaquin Valley were all contributing factors.
Employment levels in transportation and utilities stayed relatively flat, and did not drop significantly during the period 1990 to 2010 (especially taking into account overall employment declines during the 2008-2009 recession) when compared to declines in other industries, most notably manufacturing and wholesale trade. This is related to continuing growth in both passenger airline activity and air cargo (until the beginning of the off-shoring trends in computer manufacturing and effects associated with security measures taken after September 11, 2001); Pacific Rim trade through the Port of Oakland; and supporting rail and trucking. While some of these growth trends have moderated, on the whole, they are likely to continue into the future.
2.3 GROSS REGIONAL PRODUCT (GRP)/VALUE-ADDED Another way of looking at the economic contribution of goods movement-dependent industries in the Bay Area economy is their direct, indirect, and induced contributions to GRP or value-added. Direct value-added is a measure of the output of industries producing products for end-users; whereas, indirect value-added measures the downstream effects of inputs needed to support the direct production activities. Induced value-added is the economic activity generated by consumer spending that derives from wages paid by industries as they provide direct and indirect value-added. Another way of thinking about the combination of indirect and induced value-added is the economic multiplier effect of direct demand from goods movement-dependent industries. These direct, indirect and induced impacts are calculated using the IMPLAN economic modeling software, using 2011 baseline data. 49
In terms of GRP, or value-added, the direct, indirect, and induced economic impacts of goods movement industries are shown in Table 2.3. The total 49 IMPLAN allows the user to estimate the economic indirect and induced economic
impacts of a change in the direct demand or employment in an industry. Regional input-output models calculate multiplier effects that show how a change in one sector of the economy creates changes in other sectors of the economy including supplier industries, households, and government. For example, if a corporation builds a factory, it will employ construction workers and their suppliers as well as those who work in the factory. Indirectly, the new factory will stimulate employment in laundries, restaurants, and service industries in the factory’s vicinity.

San Francisco Bay Area Freight Mobility Study
2-10 California Department of Transportation
economic contribution of these industries is $360 billion, of which about $200 billion are direct impacts, $92 billion are indirect impacts, and $68 billion are induced impacts. These impacts represent about 18.5 percent of the total value-added of the State of California. Key contributors to GRP include manufacturing and services, as well as wholesale trade industries. It is important to point out that direct economic activity in the goods movement-dependent industries also generates indirect and induced economic activity in non-goods movement-dependent industries (e.g., the government and services sectors) through the multiplier effect.
Table 2.3 Total Value-Added Generated in Bay Area Economy from Direct Contributions Goods Movement-Dependent Industries (Including Indirect and Induced Value Added in Goods Movement-Dependent and Non-Goods Movement-Dependent Industries), 2011 Millions of Dollars
Bay Area Direct Indirect Induced Total Percent
Total
Agriculture, farm, and forestry $1,873 $937 $148 $2,958 1%
Air transportation $2,586 $237 $360 $3,183 1%
Construction $17,426 $1,858 $649 $19,933 6%
Government (federal, state, and local) $– $784 $671 $1,455 0%
Manufacturing $116,153 $20,844 $2,454 $139,451 39%
Mining $1,217 $1,170 $44 $2,430 1%
Other transportation $5,337 $2,107 $618 $8,062 2%
Rail transportation $208 $162 $24 $394 0%
Retail trade $25,673 $1,172 $8,082 $34,927 10%
Services $– $50,444 $50,809 $101,253 28%
Truck transportation $1,545 $837 $237 $2,619 1%
Utilities $4,931 $1,247 $770 $6,948 2%
Warehousing and storage $513 $440 $61 $1,015 0%
Water transportation $602 $87 $59 $748 0%
Wholesale trade $21,605 $10,080 $3,069 $34,754 10%
Total $199,669 $92,406 $68,054 $360,129 100%
Source: IMPLAN 2011, Cambridge Systematics analysis.
Note: listed percentages may not add to 100% due to rounding.

San Francisco Bay Area Freight Mobility Study
California Department of Transportation 2-11
2.4 CONTRIBUTIONS TO THE REGIONAL ECONOMY FROM TRANSPORTATION SPENDING AND THE ROLE OF GOODS MOVEMENT SERVICE PROVIDERS In 2011, goods movement-dependent industries spent $20.3 billion on transportation, 52 percent of which was outsourced, while the remaining 48 percent was in-house spending.50 This is equivalent to 2.1 percent of total regional output and represents 64 percent of all spending on transportation services in the region. In 2011, manufacturing industries in the Bay Area spent $9.4 billion on transportation, the highest of any industry group. Of this $9.4 billion, approximately 79 percent ($7.4 billion) is spent on outsourced transportation, and 21 percent ($2 billion) is spent on in-house transportation, which is in contrast with most other industries, where the majority of transportation spending is in-house.
Transportation spending on goods movement creates demand for employees in a wide range of occupations that are important to job diversity in the Bay Area. Goods movement service providers (trucking, rail, maritime, and air cargo industries) and their supporting service industries and equipment manufacturers provide approximately 79,300 jobs in the Bay Area, with the largest share in trucking and transportation support activities.51
Goods movement occupations in the Bay Area were identified using data from California’s Employment Development Department (EDD). Most of the local employees in these occupational categories work for goods movement service providers, but others work for goods movement-dependent industries (e.g., truck drivers and warehouse workers who work for manufacturers and retail and wholesale trade companies that have private fleets and private warehouses). In the Bay Area, these goods movement jobs account for 14 percent of the jobs in occupational categories for which more than 90 percent or more of workers do not have a college or advanced degree.
50 Based on calculations by Cambridge Systematics using the Transportation Satellite
Accounts developed by the U.S. Bureau of Transportation Statistics, the U.S. Bureau of Economic Analysis, and the U.S. Department of Commerce, 2011.
51 Calculations by Cambridge Systematics using employment by industry data from the IMPLAN economic input-output.

San Francisco Bay Area Freight Mobility Study
2-12 California Department of Transportation
2.5 GOODS MOVEMENT DEMAND The regional industries mentioned above, as well as global supply chains, generate demand on the goods movement system. To better understand this, goods movements can be viewed as serving three different kinds of markets:
1. International trade – By several measures, the San Francisco Bay Area is one of the most important international gateways in the U.S. In 2011, the San Francisco Customs District (which includes all of the region’s seaports and airports, as well as those of Monterey, Sacramento, and Fresno counties, and Reno, Nevada) reported two-way trade valued at $119.1 billion moving through its international gateways. This makes the San Francisco Customs District the second most important trade gateway in California, the third most important gateway on the West Coast of the U.S., and the 10th largest international trade gateway in the U.S.
2. Domestic trade – As California’s second largest population center and the fourth largest population for a metropolitan region in the U.S., the Bay Area is a major consumption center that relies on trade links to population-serving industries across the country. The region relies on its links to the northern San Joaquin Valley for much of the warehouse and distribution infrastructure that supports this trade in consumer products, and links between these regions are critical to the health of both economies. The Bay Area also has an evolving high-technology development/manufacturing sector and is a major producer of refined petroleum products that are traded throughout the nation and the western U.S.
3. Urban goods movement – As a major population center that is also one of the world’s leading travel and tourism hubs, the San Francisco Bay Area relies heavily on local urban goods movement completely within the region to provide basic consumer products, food, packages, and parcels to residents and businesses.
Goods Movement Demand by Commodities In 2011, the top commodities by tonnage moved in the Bay Area included waste and scrap, coal and petroleum products, n.e.c.52 (mainly petroleum products), crude petroleum, and gasoline, as shown in Figure 2.4. In terms of value (Figure 2.5), top commodities moved represented a significantly different picture, as electronics, machinery, and motorized vehicles dominate, since they are much more valuable on a per-unit weight basis.
52 Coal not elsewhere classified (n.e.c.) also includes petroleum products. In the Bay
Area, the products in this category are mostly refined petroleum products and byproducts (such as petroleum coke).

San Francisco Bay Area Freight Mobility Study
California Department of Transportation 2-13
Figure 2.4 Bay Area Freight Flow Volumes by Commodities, 2011 Millions of Tons
Source: Freight Analysis Framework 3, FHWA, 2011. The FHWA’s Freight Analysis Framework 3 data is a
commodity flow database widely used by various state and regional planning agencies because it is a freely available source that is frequently updated with current data by the FHWA. It also contains freight movement information by all modes, trade types, movements (except through), and for years up to 2040.
Waste/Scrap,74, 17%
Coal-n.e.c.,44, 10%
Crude Petroleum,42, 10%
Gasoline,37, 9%
Nonmetal Min. Prods.,
31, 7%
Gravel,28, 6%
Other Foodstuffs,21, 5%
Fuel Oils,19, 4%
Other Ag Prods.,16, 4%
Natural Sands, 13, 3%
Cereal Grains,9, 2%
Nonmetallic Minerals,
9, 2%
Mixed Freight,9, 2%
Alcoholic Beverages,
7, 2%
Motorized Vehicles,
6, 1%Other,
72, 16%
Total = 436

San Francisco Bay Area Freight Mobility Study
2-14 California Department of Transportation
Figure 2.5 Bay Area Freight Flow Values by Commodities, 2011 Billions of Dollars
Source: Freight Analysis Framework 3, FHWA, 2011.
Goods Movement Demand by Movement Type In terms of movement types, in 2011, the predominant demand by weight in the Bay Area was intraregional commodity flows (i.e., flows that have both an origin and a destination within the region), as seen in Figure 2.6 (235 million tons, or 54 percent of total tonnage). These short-haul freight movements include movements among closely allied manufacturing clusters, which form local supply chains – including consumer goods moving from local warehouse and distribution facilities to retailers and wholesalers, heavy construction materials that are produced and consumed locally, and waste and scrap materials moving to transfer facilities and recycling industries. Intraregional freight flows also include locally produced products that are moved to the region’s seaports and airports for export, or from the region’s seaports and airports to local consumers and industries. Inbound commodities to the Bay Area accounted for 28 percent (123 million tons) by weight of total nonthrough flows, indicating that the region is a net consumer of goods that are shipped into the region from other parts of California and from other parts of the country. The inbound flows include supplies for local industries, consumer goods distributed from Central Valley
Electronics, $110
Machinery, $82
Motorized Vehicles,
$43
Precision Instruments, $38
Mixed Freight, $31Gasoline, $28Other Foodstuffs,
$23
Textiles/Leather, $23
Pharmaceuticals, $20
Crude Petroleum, $19
Misc. Mfg. Prods., $18
Alcoholic Beverages, $17
Fuel Oils, $17
OtherAg Prods., $17
Coal-n.e.c., $17Other, $125
Total = $628
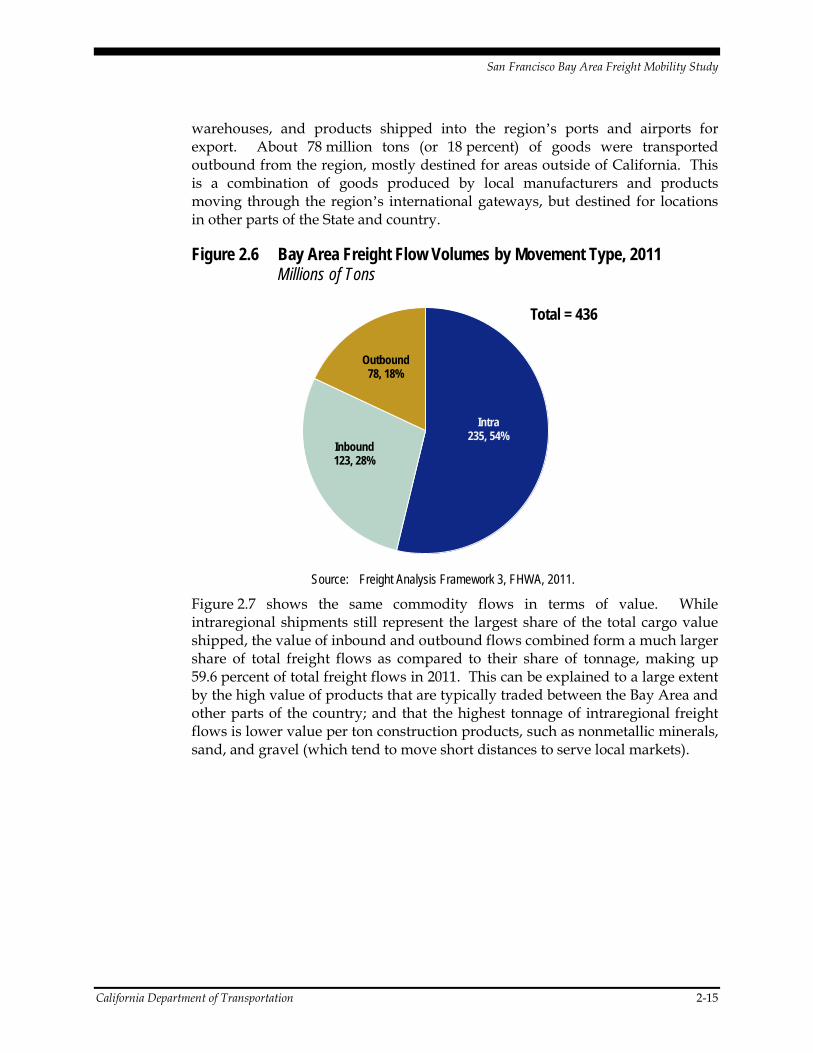
San Francisco Bay Area Freight Mobility Study
California Department of Transportation 2-15
warehouses, and products shipped into the region’s ports and airports for export. About 78 million tons (or 18 percent) of goods were transported outbound from the region, mostly destined for areas outside of California. This is a combination of goods produced by local manufacturers and products moving through the region’s international gateways, but destined for locations in other parts of the State and country.
Figure 2.6 Bay Area Freight Flow Volumes by Movement Type, 2011 Millions of Tons
Source: Freight Analysis Framework 3, FHWA, 2011.
Figure 2.7 shows the same commodity flows in terms of value. While intraregional shipments still represent the largest share of the total cargo value shipped, the value of inbound and outbound flows combined form a much larger share of total freight flows as compared to their share of tonnage, making up 59.6 percent of total freight flows in 2011. This can be explained to a large extent by the high value of products that are typically traded between the Bay Area and other parts of the country; and that the highest tonnage of intraregional freight flows is lower value per ton construction products, such as nonmetallic minerals, sand, and gravel (which tend to move short distances to serve local markets).
Intra235, 54%
Inbound123, 28%
Outbound78, 18%
Total = 436

San Francisco Bay Area Freight Mobility Study
2-16 California Department of Transportation
Figure 2.7 Bay Area Freight Flow Values by Movement Type, 2011 Billions of Dollars
Source: Freight Analysis Framework 3, FHWA, 2011.
Goods Movement Demand by Trade Type In terms of trade type, as a primary international trade gateway, freight flows in the Bay Area consist of significant shares of imports and exports. As shown in Figures 2.8 and 2.9, in 2011, exports represented 7 percent of total freight movement in the Bay Area in terms of tonnage and 11 percent in terms of value; and imports represented 11 percent of total freight movement in the Bay Area in terms of tonnage and 20 percent in terms of value.
Intra$254, 41%
Inbound$203, 32%
Outbound$172, 27%
Total = $628

San Francisco Bay Area Freight Mobility Study
California Department of Transportation 2-17
Figure 2.8 Bay Area Freight Flow Volumes by Trade Type, 2011 Millions of Tons
Source: Freight Analysis Framework 3, FHWA, 2011.
Figure 2.9 Bay Area Freight Flow Values by Trade Type, 2011 Billions of Dollars
Source: Freight Analysis Framework 3, FHWA, 2011.
Domestic Only
359, 82%
Imports47, 11%
Exports30, 7%
Total = 436
Domestic Only
$433, 69%
Imports,$128, 20%
Exports,$67, 11%
Total = $628


San Francisco Bay Area Freight Mobility Study
California Department of Transportation 3-1
3.0 The Goods Movement System
The demand on the goods movement system is supported by a complex series of interconnected infrastructure components. While the system is often described in terms of its modal components, it must function as an integrated whole with efficient intermodal connections. For instance, shippers and receivers of goods look at the end-to-end performance of the regional goods movement system to determine how well it meets their needs. This includes consideration of costs to use the system, the throughput and velocity of goods moving through the system, and the reliability of the system.
The goods movement system in the Bay Area (see Figure 3.1) consists of private and public sector modal elements that in many cases are also used for the movement of passengers. The core of the goods movement system consists of major truck routes, Class I rail main lines (operated by the Union Pacific Railroad (UP) and the BNSF Railway (BNSF)), the principal international water trade gateway at the Port of Oakland, the principal international air cargo gateway at the San Francisco International Airport (SFO), the principal domestic air cargo gateway at Oakland International Airport (OAK), and near-dock intermodal rail facilities.
This core system is complemented by various other truck routes, short line railroads, other marine and inland ports, and the Mineta San Jose International Airport (SJC). Each of the modal components is discussed in detail in the sections that follow.
3.1 TRUCK HIGHWAY SYSTEM The Bay Area roadway network consists of about 21,310 miles of public roads, which is about 12.4 percent of the total miles of public roads in California. Interstate highways, a U.S. highway, and other state highways in the Bay Area together make up about 1,430 miles, which is about 9.5 percent of the miles for the corresponding categories of highways in California. The rest of the public roads are maintained by cities, counties, and other agencies.53
53 Highway Performance Monitoring System, 2011 California Public Road Data, Table 5,
2011 Mileage of Maintained Public Roads in Each County by Type of Jurisdiction.

San Francisco Bay Area Freight Mobility Study
3-2 California Department of Transportation
Figure 3.1 San Francisco Bay Area Multimodal Freight System
Source: Caltrans Truck Counts, 2011; Cambridge Systematics analysis.
San Francisco Bay Area Freight Mobility Study
California Department of Transportation 3-3
Commercial vehicle operations are allowed on only a portion of the available public roads. Caltrans has identified a highway network on which trucks compliant with the Federal Surface Transportation Assistance Act (STAA) of 198254 and/or California legal trucks55 are allowed. Some of the state highways have special restrictions, such as allowed weight, allowed commodities (e.g., prohibitions for hazardous materials), and/or time of the day during which operation is allowed. California legal trucks may also use local “truck routes” as approved and signed by local governments.
The truck highway system is classified in this report as “major truck routes” or “other truck routes” based on truck volumes (as shown in Figure 3.1). Major truck routes (highways) were identified using the California Freight Advisory Committee’s (CFAC) proposed definition56: A major truck route is a route/highway segment that has bidirectional average annual daily traffic (AADT) for trucks with three or more axles (truck AADT with 3+ axles) greater than 3,000 trucks. Using this definition, it is possible that only a portion of a route will be classified as a major truck route. An example is U.S. 101, which has more than 3,000 truck AADTs with 3+ axles on most segments, but does not have this high level of truck traffic through the City of San Francisco. The major truck routes mainly consist of segments of Interstate (I)-80, I-880, I-580, I-680, U.S. 101, I-238, I-205, SR 92, SR 152, and SR 4. Short segments of I-280, I-980, SR 237, and SR 37 are also included. Other truck routes consist of the remaining portions of the state highways and the local truck routes. Needs, deficiencies, and strategies are included for both major truck routes and other truck routes in this study.
3.2 FREIGHT RAIL SYSTEM The freight rail system in the Bay Area (Figure 3.2) consists of privately and publicly owned rail lines that are operated by Class I railroads57 and short line
54 The Federal STAA regulates the allowable width and length of commercial motor
vehicles; however, there is no Federal vehicle height requirement. The weight and length limits are applicable to a designated “National Network” (NN) of highways, as authorized by the STAA and specified by 23 U.S. Code of Federal Regulations 658. In addition, based on Assembly Bill (AB) 866 of 1983, Caltrans evaluated the State’s highways and designated certain state routes as “Terminal Access” (TA) highways that have geometric standards high enough to accommodate STAA trucks.
55 The California Vehicle Code (CVC) Sections 35400 on length regulation, Sections 35100 to 35111 on width regulation, Section 35250 on height regulation, and Sections 35550 to 35558 on weight regulation together defines a California legal truck. These are applicable to all state highways.
56 Current proposal of CFAC as of September 20, 2013. 57 According to the Surface Transportation Board (STB), a Class I railroad is a railroad
with annual operating revenue of $250 million or more (in 1991 dollars). Class I
Footnote continued

San Francisco Bay Area Freight Mobility Study
3-4 California Department of Transportation
railroads58; and rail classification yards (or rail yards),59 including intermodal terminals, rail classification yards (for carload traffic), and automobile yards. A significant portion of the tracks that the freight trains use is also shared with passenger rail services.
railroads are regulated by the STB and subject to the Uniform System of Accounts. Source: http://www.stb.dot.gov/stb/faqs.html (last retrieved on October 25, 2013.
58 Short line railroad or Class III railroad, according to the STB, is a railroad with an annual operating revenue of less than $20 million (in 1991 dollars). In addition, the Association of American Railroads also defines short line railroads as one of the following: 1) local railroads are line-haul railroads operating less than 350 miles of rail line; or 2) switching and terminal railroads are either jointly owned by two railroads for the purpose of transferring cars between railroads or operate solely within a facility or group of facilities. Source: http://www.aslrra.org/about_aslrra/faqs/ (last retrieved on October 25, 2013).
59 A rail classification yard is an assortment of tracks, at which traditional railroad activities occur, such as assembling trains and sorting and redistribution of railcars and cargo. Railcars in yards are moved by gravity or by specially designed yard locomotives called switchers. Source: Caltrans Office of System, Freight and Rail Planning, Glossary for freight planning, July 2012.
Rail yards can be classified based on the type of trains handled as: 1) intermodal terminals – for containers or truck trailers on flat cars or specialized intermodal cars; 2) rail classification yards for carload traffic – for grain, coal, and similar bulk commodities moving in unit trains, or general merchandise commodities moved in box cars and tank cars; and 3) automobile yards – for assembled automobiles, vans, and trucks moving in multilevel cars.

San Francisco Bay Area Freight Mobility Study
California Department of Transportation 3-5
Figure 3.2 Rail Systems Infrastructure in Bay Area
Source: Caltrans, 2013; Cambridge Systematics analysis.
Note: Intermodal Facilities are rail yards that can handle intermodal containers and allow for transfer of these containers from truck to rail and vice versa.
UP and BNSF are Class I railroads operating in the Bay Area that provide connectivity to most of North America. There are also several short line railroads

San Francisco Bay Area Freight Mobility Study
3-6 California Department of Transportation
operating in different parts of the region, among which Northwestern Pacific Railroad (NWP), California Northern Railroad (CFNR), and Napa Valley Railroad (NVRR) are local railroads that provide short line-haul and exchange cars with the Class I railroads. Oakland Gateway Rail Enterprise (OGRE)60, Richmond Pacific Railroad Corporation (RPRC), and San Francisco Bay Railroad (SFBR), are switching and terminal railroads that operate at or near the Ports of Oakland, Richmond, and San Francisco, respectively.
Freight rail customers in the Bay Area access the freight rail system through the intermodal terminals of UP’s Railport–Oakland and BNSF’s Oakland International Gateway (OIG). In addition, there are also several other rail yards that serve specific commodities, including the BNSF automobile classification yard for carload traffic at Richmond, UP’s automobile classification yard for carload traffic at Milpitas, automobile yards at the Port of Richmond (Point Potrero Marine Terminal), and the Port of Benicia (AMPORTS Benicia Terminal). There are also several short branch lines (also called spurs), and siding tracks to the mainline61 that act as rail yards.
Freight railroads share tracks with several passenger rail services, including Amtrak Capital Corridor, Amtrak Coast Starlight, Amtrak Zephyr and Amtrak San Joaquin, Altamont Corridor Express, Caltrain, and SMART.
3.3 DEEPWATER SEAPORTS The Bay Area has several deepwater ports, as well as bulk62 and break bulk63 terminals, with channel depths varying between 30 and 50 feet. The Port of
60 In Alameda County, there had historically been only one short line railroad, the
Oakland Terminal Railway (OTR), which is a switching and terminal railroad jointly owned by UP and BNSF and operates near the Port of Oakland. The OTR is being dissolved and a new short line, the Oakland Gateway Rail Enterprise (OGRE) will be offering service to the industries formerly served by the OTR. OGRE is a joint venture comprised of West Oakland Pacific Railroad, LLC (WOPR); California Capital & Investment Group, Inc. (CCIG); and Ports America Group, Inc. In addition to serving customers formerly served by the OTR, OGRE is seeking to expand the rail-served customer base on the City portion of the Oakland Army Base and will be providing switching services to the Port’s new OAB railyard.
61 A siding track is a track adjacent to a main or secondary track. It can be used either to handle trains meeting or passing a train; alternately to carry out rail yard activities.
62 Bulk cargo is loose cargo that is unbound as loaded or mechanically conveyed without count and in an unpackaged form, and may be dry bulk or liquid bulk. Examples of bulk cargo include coal, grains, ore, cement, and petroleum products. Source: Caltrans Office of System, Freight, and Rail Planning, Glossary for freight planning, July 2012.

San Francisco Bay Area Freight Mobility Study
California Department of Transportation 3-7
Oakland is the largest port in the region handling 99 percent of the containerized goods moving through Northern California and some break bulk cargo. The Port has a channel depth of 50 feet (dredged annually), and it differs from the State’s other two large container ports (the Ports of Los Angeles and Long Beach) because it handles a greater share of exports as compared to imports. The Port currently has 8 container terminals, 18 deepwater berths, and 36 container cranes, 30 of which are Post-Panamax64 size.65 The Port is served by I-880 and I-80; the two Class I railroads; and 10 miles of short line track, warehouses, and two nearby intermodal terminals. The Port also has a break bulk terminal, Burma Road Terminal, Berth 7, which is located in the Outer Harbor waterway and ships and receives break bulk general cargo.66
The region is also served by a number of smaller ports (shown in Figure 3.1), which include the following:
• The Port of Richmond – A deepwater seaport (channel depth of 38 feet), it is California’s third largest port in terms of annual tonnage, handling more than 19 million short tons of cargo. Currently, the Port ranks at the top in liquid bulk and automobile tonnage among the ports in the San Francisco Bay. The main exports include scrap metal, coke, coal, aggregate, zinc, and lead; and the main imports include petroleum, bauxite, magnetite, vegetable oils, and vehicles. The Port is owned by the City of Richmond and is governed by the State Tidelands Trust.67 I-580 passes through the port area, which connects with I-80 and U.S. 101. The Port of Richmond is also served
63 Breakbulk cargo is noncontainerized, general cargo of nonuniform sizes, often
transported on pallets or in boxes, sacks, drums, or bags. These cargoes require labor-intensive loading and unloading processes. Examples of breakbulk cargo include iron, machinery, coffee beans, logs, and woodpulp. Source: Caltrans Office of System and, Freight and Rail Planning, Glossary for freight planning, July 2012.
64 Post-Panamax is the size of a ship that is more than 13 containers, but less than 18 containers wide. A Post-Panamax crane can service a ship of this size. Source: Port of Oakland, 2013-2014 Adopted Operating and Capital Budgets, Part G: Glossary. Available at: www.portofoakland.com/about/investors.aspx (last accessed on January 3, 2014).
65 http://www.portofoakland.com/maritime/operations.aspx (last retrieved on January 3, 2014).
66 World Port Source: http://www.worldportsource.com/ports/commerce/USA_CA_Port_of_Oakland_231.php (last retrieved on October 15, 2013).
67 Caltrans District 4 Fact Sheet on Port of Richmond, available at: http://www.dot.ca.gov/hq/tpp/offices/ogm/fact_sheets_index.html (last retrieved on October 15, 2013).

San Francisco Bay Area Freight Mobility Study
3-8 California Department of Transportation
by UP and BNSF.68 In 2010, due to a $40 million Honda Port of Entry Project, a new rail yard was added to Point Potrero Marine Terminal (PPMT) to enable imported autos to be loaded directly onto rail cars, with the goal of reducing individual auto shuttle trips on local streets in the City of Richmond.
• The Port of Benicia – A deepwater seaport (channel depth of 38 feet) with inland transportation access via I-680 and I-80. UP provides on-terminal rail. The Benicia Industrial Park lies to the northeast of the residential areas of the City and includes the Valero oil refinery. The main exports are Valero’s petroleum coke and the main imports are automobiles. The Port of Benicia is privately owned and operated by APS West Coast, Inc. AMPORTS, a leader in the vehicle-processing industry, operates the terminal facilities at Benicia. CODA Automotive, Inc. began assembly of all-electric cars on March 13, 2012, creating 50 new jobs at the AMPORT facility.69
• The Port of San Francisco – A deepwater port with a channel depth of 38 to 40 feet, it has the largest floating dry-dock dedicated to ship repair on the West Coast of the Americas. The Port is owned by the City of San Francisco and governed by a port Commission. The main exports include tallow and vegetable oil; and the main imports include steel products, boats/yachts, wind turbines, aggregate, and sand. I-80 and U.S. 101 are the nearest highways, and on-dock rail service is available to Pier 80.70
• The Port of Redwood City – A deepwater port with mean low water depth of 30 feet. It is located in San Mateo County in South San Francisco Bay between the Dumbarton Bridge and the San Mateo – Hayward Bridge. The Port is owned by Redwood City and is self-supporting. It handles mostly dry-bulk, neo-bulk, and liquid-bulk cargoes. Land uses mainly consist of handling, processing, storage, and transportation of imported construction materials, scrap metal exports, construction debris for recycling, and chemicals. The Port is served by U.S. 101 and UP.71
68 http://www.ci.richmond.ca.us/index.aspx?NID=323 (last retrieved on October 15,
2013). 69 Caltrans District 4 Fact Sheet on Port of Benicia, available at:
http://www.dot.ca.gov/hq/tpp/offices/ogm/fact_sheets_index.html (last retrieved on October 15, 2013).
70 Caltrans District 4 Fact Sheet on Port of San Francisco, available at: http://www.dot.ca.gov/hq/tpp/offices/ogm/fact_sheets_index.html (last retrieved on October 15, 2013).
71 Caltrans District 4 Fact Sheet on Port of Redwood City, available at: http://www.dot.ca.gov/hq/tpp/offices/ogm/fact_sheets_index.html (last retrieved on October 15, 2013).

San Francisco Bay Area Freight Mobility Study
California Department of Transportation 3-9
In addition to these ports, liquid bulk terminals include the Chevron terminal in Richmond, Shore Marine Oil Terminal (Shelby) at Carquinez, Valero marine oil terminal at Benicia, and Shell and Tesoro marine oil terminals at Martinez.
3.4 CARGO AIRPORTS The Bay Area is served by a principal international air cargo gateway at San Francisco International Airport and a principal domestic air cargo gateway at Oakland International Airport. Air cargo is also handled at Mineta San Jose International Airport. (See Figure 3.1)
SFO is an international air cargo trade gateway located at the north edge of San Mateo County on the west side of the Bay. The Airport has four runways, and the longest runway is 11,870 feet long. Cargo service is available from 56 airlines, including seven cargo-only airlines. SFO’s 11 cargo facilities provide over 1,026,000 square feet of warehouse and office space, including newly added cargo facilities. In 2012, SFO captured 55 percent of the Bay Area air cargo market, including about 95 percent of the international market. Approximately 74 percent of cargo at SFO is carried on passenger aircraft (also known as belly cargo because it is carried in the “belly” of the passenger aircraft). Over 60 percent of that total is international cargo.72 United Airlines is the largest carrier of international merchandise imports and the second largest carrier of exports. SFO is a major trade hub with Pacific Rim countries like South Korea, Japan, and Taiwan. U.S. 101 serves the airport and connects to I-280 via I-380 and to the East Bay via SR 92.73
Oakland International Airport (OAK) is a domestic air cargo gateway located on the east side of San Francisco Bay in Alameda County. The airport is owned and operated by the Port of Oakland. The airport has four runways, and the longest runway is 10,001 feet long. The largest carrier, Federal Express (FedEx), occupies 250,000 square feet of sorting, distribution, and warehouse space at OAK. U.S. Customs and Border Protection officials are located on-site. The Oakland Foreign Trade Zone, located 1.5 miles away, consists of 500,000 square feet of buildings with direct highway access. In 2012, OAK handled about 41 percent of Bay Area air cargo.74 The FedEx regional hub processes up to 100,000 pounds (280,000 packages) of freight each day and has its own import clearance center. Primary air freight destinations for air cargo shipped from OAK are domestic with high frequency along the U.S. West Coast and transcontinental to cargo
72 Caltrans, California Air Cargo Groundside Needs Study, July 2013. 73 Caltrans District 4 Fact Sheet on San Francisco International Airport, available at:
http://www.dot.ca.gov/hq/tpp/offices/ogm/fact_sheets_index.html (last retrieved on October 15, 2013).
74 Caltrans, California Air Cargo Groundside Needs Study, July 2013.

San Francisco Bay Area Freight Mobility Study
3-10 California Department of Transportation
hubs – Memphis (FedEx) and Louisville (United Parcel Service (UPS)), and international service to Asia/Pacific. I-880 serves the Airport. 75
The Mineta San Jose International Airport (SJC) is located northwest of downtown San Jose at the southern tip of the San Francisco Bay in Santa Clara County. The airport has three runways, and the longest runway is 11,000 feet long. In 2012, SJC handled about 4 percent of Bay Area air cargo.76 The City of San Jose owns and operates SJC, which provides service on two runways. There are seven freight-only and three cargo or freight carriers at SJC. The 2011 Airport Master Plan amendment identifies all-cargo as occupying 300,000 square feet at SJC and belly-cargo taking up 85,000 square feet. U.S. Customs and Border Protection officials are located on-site. The General Purpose Foreign Trade Zone is located approximately seven miles south of SJC in San Jose’s Monterey Corridor Industrial area. Cargo operations are handled by FedEx and UPS. U.S. 101 and I-880 serve the airport.77
75 Caltrans District 4 Fact Sheet on Oakland International Airport, available at:
http://www.dot.ca.gov/hq/tpp/offices/ogm/fact_sheets_index.html (last retrieved on October 15, 2013).
76 Caltrans, California Air Cargo Groundside Needs Study, July 2013. 77 Caltrans District 4 Fact Sheet on Mineta San Jose International Airport, available at:
http://www.dot.ca.gov/hq/tpp/offices/ogm/fact_sheets_index.html (last retrieved on October 15, 2013).
San Francisco Bay Area Freight Mobility Study
California Department of Transportation 4-1
4.0 Functions of the Goods Movement System
Different modal physical infrastructure can be combined to serve a particular goods movement function. By presenting the goods movement system in terms of functions, the discussion of needs is more consistent with the way users think of the system, and also provides a focus on intermodal connections and the way the modes are linked together to meet the needs of industry supply chains. This section describes each of the six functions of the Bay Area goods movement system, key trends, and demand drivers. This section also looks at the modal traffic implications of the functions.
It is important to note that while the goods movement functions are distinct, particular road, rail, marine, and air facilities may fulfill more than one function. For example, I-880 in the East Bay is part of the interregional corridor that includes I-238 and I-580 but it also serves as part of the intraregional core system moving traffic between origins and destinations exclusively within the East Bay.
4.1 GLOBAL GATEWAYS The global gateways that make up the Bay Area’s freight transportation system consist of the major maritime facilities and international airports that handle freight, as well as passenger cargo. This functional category refers to the region’s international trade infrastructure. It does not include all assets that are used to handle international trade; rather it covers those entry and exit points that are essential to moving high volumes of trade into and out of the region. The modal elements that make up the global gateways function include the region’s maritime ports along with their associated inland connections, as well as the international airports that handle both belly freight (i.e., freight that is moved in the belly of passenger aircraft) and dedicated freight aircraft.
Growth Drivers and Key Trends A number of demographic and economic factors impact the range of growth projections for Bay Area gateways through the year 2040. Local population and economic growth are the most obvious factors for niche ports, including the Port of San Francisco and the Port of Redwood City, whose markets are primarily regional. With international trade growing at a faster rate than domestic trade, the Port of Oakland should see continued growth. Furthermore, with recent and projected investments in its rail connections, the Port of Oakland is a viable gateway alternative for shippers located around the country, and will continue to

San Francisco Bay Area Freight Mobility Study
4-2 California Department of Transportation
compete directly with the other West Coast gateways, including Prince Rupert (British Columbia), Seattle and Tacoma, and Los Angeles and Long Beach.
While there is potential for significant growth at the Port of Oakland, there are also some serious potential competitive threats. All of the ports on the U.S. West Coast are investing to take advantage of growing Pacific Rim trade and the Port of Oakland has lost market share in recent years. These other ports also face challenges with community opposition to growth, environmental impacts, and local congestion problems. If the Port of Oakland is able to improve operational efficiency, take advantage of unique market opportunities, and improve inland transportation options (particularly rail), it should be able to at least maintain market share relative to other U.S. West Coast ports. The Port of Oakland also faces potential diversion of cargo to the East and Gulf Coasts via the expanded Panama Canal and diversion to expanding ports in Mexico and Canada. The Port of Oakland’s competitive position as compared to these other ports will depend on relative cost and reliability which will in turn depend on the cost of ocean carriage via the Panama Canal, access to competitively priced connecting services from Canada and Mexico to the interior U.S., and the pricing policies of Western railroads that provide connections between the Port of Oakland and Midwestern and East Coast markets.
Future export growth is anticipated at the Port of Oakland and this will include a mix of agricultural products, wine, and high-technology instrumentation. Most of these products are produced locally or in the Central Valley, and as such they will not require major expansion of rail facilities. However, growth in exports from the Central Valley will put stresses on the I-580 corridor as most products will move from growing areas and processing facilities via truck to the Port. Also, there is expected to be significant growth in exports of scrap and waste products. The Port is looking to provide opportunities for growth in bulk products, consistent with growth in waste/scrap and agricultural products.
On the import side, the Port of Oakland can continue to be a gateway for products ultimately destined for Northern California and parts of Nevada and Utah. But its ability to grow beyond these markets will depend to some degree on expansion of rail facilities and access to modern transloading78 facilities for importers. At present, much of the Port’s imports are distributed by truck in containers to warehouse and distribution centers in the San Joaquin Valley via I-880/I-580/I-205. As will be discussed later, opportunities to shift some of both the import and export traffic to short-haul rail services and barge services operating in the Carquinez Straits and the San Joaquin/Sacramento River Delta (connecting to the Port of Stockton) hold promise as a way of relieving the truck traffic impacts on the I-880/I-580/I-205 corridor. 78 Transloading of international cargo involves the direct transfer of the contents of a
marine container into a domestic 53-foot rail or truck container (or trailer) by a logistics service provider (LSP) at a transload facility.

San Francisco Bay Area Freight Mobility Study
California Department of Transportation 4-3
The smaller ports in the region will be subject to a different set of growth factors that will impact the adequacy of their facilities. Some of the larger of these ports, such as Richmond and Benicia, will see slowing in the rate of growth of petroleum and petroleum product imports and exports. Automobile imports are also projected to grow at relatively slower rates as compared to their historic rates of growth. On the other hand, all of the ports that handle bulk exports, particularly of waste and scrap, but also of construction-related products, and petroleum coke and related products could see substantial growth if they have the needed capacity to handle this growth.
In the 1990s, air cargo in the region was led by high-technology domestic parcel traffic based on a just-in-time paradigm that had resulted in robust growth. With the shift of Silicon Valley from production of computer hardware to software design and computer-related services, the need for domestic air parcels declined, leading to a flat line of demand for much of the 2000s that turned sharply negative during the recession. Current projections show that domestic air cargo will resume at a modest, yet sustained, growth; and that international air cargo will grow at a faster pace. For the region’s air cargo gateways, the rate of growth will be aided by the shift to higher value goods that tend to reflect a broader shift in the regional economy to higher value production and consumption. In 2008, the San Francisco Customs District’s79 air cargo was valued at $174 per kilogram (equivalent to 2 pounds 3.2740 ounces), which was about 80 percent higher per kilogram than that of Los Angeles.80
In addition, right sourcing/near-shoring will also likely change demand to some degree. As labor rates have risen recently in China, more and more beneficial cargo owners (BCO)81 are locating alternate sources of supply for production inputs and finished goods in a variety of countries including Mexico. These “near-shoring82, right-shoring83 or reshoring84“ trends are being driven by the BCOs’ desire to lower production and transportation costs by bringing sourcing 79 A customs district is a district in which merchandise clears customs for entry into
consumption channels, bonded warehouses or Foreign Trade Zones. 80 Air Cargo Mode Choice and Demand Study, 2010,
http://www.dot.ca.gov/hq/tpp/offices/ogm/key_reports_files/Air_Cargo_Mode_Choice_&_Demand_Study_080210.pdf#zoom=65.
81 A BCO refers to an importer that takes control of their cargo at the point of entry and does not utilize a third-party source or freight forwarder.
82 Near-shoring is the transfer of businesses to companies in a nearby country, often sharing a border with your own country.
83 Right-shoring is the placement of a business’ components and processes in localities and countries that provide the best combination of cost and efficiency.
84 Reshoring is the practice of bringing outsourced personnel and services back to the location from which they were originally offshored.

San Francisco Bay Area Freight Mobility Study
4-4 California Department of Transportation
and/or production closer to primary consumer markets, diversify supply sources to mitigate the risk of business interruption, decrease transit times, enhance rapid replenishment capabilities, and improve customer satisfaction. In addition, the expansion of domestic energy production in the U.S. is driving down energy costs, which may factor into site selection decisions for the more energy intensive manufacturing sectors. Moreover, the Chinese middle class is growing and consuming a greater share of the consumer goods that were previously exported; and this factor, along with lower labor costs outside of China, accounts for the shift in export capacity to other nations.
The Port of Oakland and the three airports in the region – SFO, OAK, and SJC -- currently handle imports from Asia and the Indian Subcontinent, and thus are not necessarily at risk of losing market share if import sourcing shifts to other Asian countries such as Vietnam and Indonesia. However, as sourcing shifts to North America and Latin America, volumes will likely decline to some degree because air cargo previously moving from sources in Asia would shift to land or air cargo movements directly to U.S. inland destinations rather than moving through a California gateway.
Another important trend that could affect the competitiveness of the Port of Oakland is the use of transloading as a logistics strategy by major importers. Over the past decade, big box retailers and large importers of fast moving consumer goods, in particular, have adopted transloading as a supply chain strategy. Transloading refers to the process in which a logistics service provider transfers the contents of an import container directly into a 53-foot domestic truck or rail container in a warehouse near a gateway port for onward movement to a U.S. inland point.
The primary benefit that transloading offers to a BCO is the reduced cost of inland transport, since the contents of three 40-foot marine containers can be transloaded into two 53-foot domestic containers. Other potential benefits of transloading include:
• The BCO can delay decisions about where cargo is ultimately destined in its distribution network to more closely match customer demands and reduce inventory holding and postponement. If cargo is moved inland intact in the same container in which it was shipped from Asia, the decision as to what is in the container and where it is being shipped needs to be made when the cargo is loaded at origin. Transloading enables the BCO to delay product allocation until a few days in advance of the container’s arrival at the U.S. gateway port, and use up-to-date sales data to make more informed routing decisions.
• Historically, there has been an imbalance between the volume of imports and exports in the TransPacific trade lane, with most U.S. ports handling more imports than exports. The Port of Oakland is an exception, largely because of the volume of agricultural products grown in and exported from the San Joaquin Valley. Moreover, import cargo commands higher ocean rates than

San Francisco Bay Area Freight Mobility Study
California Department of Transportation 4-5
export cargo, so ocean carriers are keen to get empty containers back to Asia as quickly as possible to capture more import cargo, reduce the amount of equipment needed in their systems, and to reduce the costs of repositioning empty containers within the U.S. Ocean carriers typically offer low rates for port-to-port shipments compared to port-to-door rates to U.S. inland destinations. In addition, BCOs that can return empties to the port of entry on the West Coast in a short period of time often receive reduced rates in their contracts with the ocean carriers. This encourages BCOs to route shipments to the West Coast on a port-to-port bill of landing as opposed to a port-to-door rate structure, and unload containers quickly and return them to the ocean carrier’s container yard at the Port. By transloading cargo from an international container to a larger domestic container, the BCO can return the empty international container very quickly and take advantage of these reduced rates.
The growth of transloading creates an economic opportunity for the regions in which it occurs because transloading often involves a range of value added services and this creates employment opportunities at the transload warehouses. Historically, goods imported through the Port of Oakland were often shipped to transload facilities in the San Joaquin Valley due to absence of such facilities in the Bay Area. The Port and the City of Oakland have been working with private entities to develop the Oakland Global Trade and Logistics Center within the former Oakland Army Base, which is planned to include a new intermodal rail terminal, bulk marine terminal, 30 acres of truck parking and service areas, 2 million square feet of new warehousing space, and a new recycling center. It is likely that, in the future, BCOs in this sector will increasingly choose to transload cargo in these near-port facilities for onward movement to stores and customers beyond the Rocky Mountain states. However, because few ocean carriers make the Port of Oakland their first port of call and intermodal services offered by the Class I railroads is limited at the Port of Oakland, the Bay Area will continue to play a secondary role relative to the Los Angeles-Long Beach area, which captures the lion’s share of transloading in the U.S.
In addition to the economic opportunities that transloading can create, transloading trends could affect the Port of Oakland and its inland access routes in two primary ways. First, if there are insufficient transloading facilities close to the Port, transloading will likely continue occurring in San Joaquin Valley warehouses, creating more truck traffic along the I-580/I-205 corridor and I-880. Second, if BCOs and logistics service providers (LSP)85 continue to expand the use of transloading as a logistics strategy, it will be critical for the Port of
85 A logistics service provider is generally a third party (i.e., neither a shipper nor a
receiver), who provides a range of logistics services to shippers and receivers. These services may include transportation or transportation brokerage, warehousing, or other value-added services (such as bar coding, ironing of clothing, labeling).
San Francisco Bay Area Freight Mobility Study
4-6 California Department of Transportation
Oakland and its partners to expand transloading facilities in order to effectively compete with other West Coast ports. A risk associated with expanding transloading warehouse capacity, however, is that BCOs may increasingly decide to move their cargoes from Asia to eastern markets via the Panama Canal.
4.2 INTERREGIONAL CORRIDORS A number of highway routes and parallel rail routes are classified as interregional corridors because their primary, though not exclusive, function is to move freight between the Bay Area and regional economic centers in other parts of California and the U.S. As Figure 4.1 shows, there are two primary multimodal interregional trade corridors in the Bay Area: 1) the Central Corridor and 2) the Altamont Corridor.86
I-80 forms the highway core of the Central Corridor, which connects the Bay Area to Sacramento and northern tier states across the U.S. It should be noted that I-80 also performs functions as an intraregional corridor primarily for the segments in Alameda and Contra Costa Counties along with the San Francisco-Oakland Bay Bridge. The Central Corridor also includes UP rail connections along the Martinez Subdivision87 and BNSF connections, where it has trackage rights on the Martinez Subdivision continuing on to the Stockton Subdivision88, and connections further south to the BNSF’s TRANSCON line, which links to the rest of the nation.
The major truck routes of I-880/I-238/I-580 form the highway core of the Altamont corridor. UP also has rail connections via the Oakland Subdivision89 along the Altamont Corridor, although these are not used intensively for freight rail transport. In addition, the M-580 Marine Highway between Ports of Oakland, Stockton, and West Sacramento also serves as an interregional corridor providing alternatives to shipping particular bulk goods by highways or rail.
86 Metropolitan Transportation Commission, Bay Area Goods Movement Strategy, 2008. 87 UP Martinez Subdivision is UP’s mainline track running from Richmond north to
Roseville. 88 BNSF Stockton Subdivision is BNSF’s mainline track that links the Bay Area to the
Central Valley via Stockton and running south to Fresno. 89 UP Oakland Subdivision is UP’s mainline track running south from Oakland through
San Leandro, Hayward, Union City, and Fremont and then heading east over the Altamont Pass.

San Francisco Bay Area Freight Mobility Study
California Department of Transportation 4-7
Figure 4.1 Altamont and Central Corridors in Bay Area
Source: Cambridge Systematics analysis, based on definitions of the corridors provided by MTC.

San Francisco Bay Area Freight Mobility Study
4-8 California Department of Transportation
In addition to the two main interregional corridors already described, the Bay Area includes two lower volume interregional corridors with potential for growth in the future – U.S. 101 and SR 152. While primarily an intraregional corridor on the Peninsula, U.S. 101 also provides interregional connections, particularly connecting agricultural shippers on the Central Coast with markets and export facilities in the Bay Area, as well as providing connections between the Bay Area and the north coast of California.
The integration of the Bay Area economy and that of neighboring regions in Northern California (including the agricultural regions of the Central Coast and the Central Valley) is creating new emphasis on interregional goods movement corridors that link the various regions that comprise the Northern California mega-region. One such interregional corridor is the SR 152 corridor. While not a major goods movement corridor today, SR 152 could become an important interregional corridor in the future. SR 152 has been designated as a Focus Route in Caltrans’ Interregional Transportation Strategic Plan (ITSP). Focus Routes are the highest priority for completion to minimum standards (usually expressway or freeway standards) in order to serve interregional trips and provide access to statewide gateways. Completing improvements to SR 152 and U.S. 101 (which is also a Focus Route) to meet ITSP concept standards is one of the recommended strategies for Bay Area interregional corridors.
Growth Drivers and Key Trends Interregional corridors are especially important because interregional freight movements represent a higher share of total value of commodity movements in the Bay Area than intraregional movement. Interregional movements are growing faster than intraregional flows, both by tonnage and value. The products moving to and from the Bay Area tend to be high-value products. Trucks will continue to service the majority of demand for interregional freight movement, but international intermodal rail cargo is expected to experience high levels of growth associated with imports leaving the Port of Oakland by rail for destinations in the interior U.S. The ability to handle increasing volumes of imported intermodal cargo could be an important factor in the Port of Oakland’s ability to meet its growth potential. Outbound rail traffic to the rest of the country will overtake inbound traffic by 2040 in the Bay Area, and this is driven almost entirely by growth in port-related intermodal traffic moving from the Port of Oakland to the interior U.S.
The continued relocation of distribution facilities outside of the Bay Area to regions such as the San Joaquin Valley, and the flow of products from these distribution facilities to the Bay Area by truck will continue to put greater pressure on already congested and limited interregional corridors. In the case of imported products destined for Bay Area consumers, distribution from San Joaquin Valley distribution centers means that there is both a truck move to the distribution centers from the Port of Oakland, as well as a second truck move back into the region for distribution.

San Francisco Bay Area Freight Mobility Study
California Department of Transportation 4-9
Overall, inbound movements, both in terms of tonnage and value, are growing faster than either intraregional or outbound freight flows. This reflects the continued shift of the Bay Area’s economy away from manufacturing with consumer products being shipped from manufacturers in other parts of the country and from overseas. The growing lack of balance in truck volumes could be partially addressed by creating more options for interregional trucking by developing more warehousing and distribution, including the repurposing of brownfield sites, within the Bay Area.
According to FHWA’s FAF3 commodity flow data, aside from international intermodal cargo (imports) moving from the Port of Oakland to the interior U.S., one of the biggest interregional rail cargoes is automobiles, and this will continue to grow, driven by population growth. Some of the automobiles moving by rail are imports to Bay Area ports from Asia that are then moved by rail to the rest of the U.S. whereas other automobiles are moved from production locations in the U.S. by rail to the Bay Area for final distribution. Waste/scrap cargo will also grow rapidly – driven by export demand. The domestic rail share of petroleum product shipments along interregional corridors is also expected to grow as crude supplies for the region’s refineries shift to Canada and the Bakken Fields of North Dakota. However, overall growth in these petroleum products for the region is projected to be more modest than it has been historically.
4.3 INTRAREGIONAL CORE SYSTEM As mentioned previously, a substantial amount of the goods moving in the Bay Area have both an origin and destination within the region and are referred to as intraregional flows. The intraregional core system is a collection of highways that serves the Bay Area subregions with the highest concentration of population corresponding to the highest share of demand. The system also provides primary access to the major goods movement facilities along the San Francisco Bay, including seaports, airports, rail yards, and warehouse/industrial districts to serve goods moving between these facilities and their Bay Area customers. This is a particularly important role for intraregional corridors such as I-880 and U.S. 101. A lot of intraregional movements occur on the interregional corridors as well. The intraregional core system includes portions of I-880, U.S. 101, SR 152, and I-80 as well as I-680, SR 4, SR 92, and SR 37. The Transbay bridges (Richmond-San Rafael Bridge, San Francisco-Oakland Bay Bridge, Dumbarton Bridge, and San Mateo-Hayward Bridge) also are part of the intraregional core system. Because this system serves intraregional movement, which is dominated by truck movements, it is composed exclusively of highways.
Each of the highways in the intraregional core system serve particular flows within the Bay Area that link the cities and counties within the region based on intraregional economic links. For example, SR 4 provides connections between the oil refineries and other industrial producers along the Contra Costa County Northern Waterfront with the rest of the intraregional network and customers in

San Francisco Bay Area Freight Mobility Study
4-10 California Department of Transportation
the Bay Area. In addition, a number of these highways also provide important connections to the interregional corridors. For example, I-880 connects to I-238/I-580 providing access between these interregional corridors and OAK and the Port of Oakland. I-880 also provides access to the interregional network for industrial areas along the I-880 corridor. U.S. 101 is a corridor for distribution of products to the major population centers in Santa Clara, San Mateo, San Francisco, and Marin Counties, but through connections with SR 37/I-680/I-580, U.S. 101 is also part of an intraregional network that connects to the interregional system for agricultural producers in the North Bay. SR 152 also connects with U.S. 101 to provide a similar connection to the interregional network for Central Coast agricultural producers.
The preceding discussion of U.S. 101 and SR 152 points out the frequent overlap between the intraregional core system and the interregional corridors. While interregional corridors, such as I-80 and I-580, U.S. 101, and SR 152 are main conduits for connecting the region to the rest of the country, they also serve intraregional purposes of travel.
Growth Drivers and Key Trends FAF data shows that intraregional flows still represent more than 50 percent of total flows in terms of tonnage, but this category of freight is growing at a slower rate than interregional flows. Despite the slower rate of growth, intraregional trade will still contribute to higher total truck traffic on the intraregional corridors. As such, the region will continue to see conflicts between trucks and automobiles. Some of the highest tonnage commodities are moved by truck on intraregional corridors and are expected to see high levels of growth between 2011 and 2040 include waste/scrap, nonmetallic mineral products, and sand. These heavy bulk commodities move on most of the major intraregional corridors and will create pavement deterioration issues. Other commodities that move primarily on intraregional corridors include petroleum products and gasoline. However, these commodities are expected to experience slower relative growth. When looked at in terms of value, there are a number of commodities that will drive growth in intraregional shipments. These tend to be in integrated supply chains where manufacturers and suppliers, generally in high-tech sectors, exist in close proximity. Even though there has been a decline in computer manufacturing in the Bay Area, continued production of precision instruments and machinery will ensure the continued intraregional movement of components and partially finished products among producers and suppliers in these industries and will move primarily by truck.
4.4 URBAN GOODS MOVEMENT SYSTEM The urban goods movement system refers to networks of city streets that are needed to move freight to its final destination. The urban goods movement system links to the intraregional core system. The urban goods movement

San Francisco Bay Area Freight Mobility Study
California Department of Transportation 4-11
system primarily serves residential and commercial areas and provides connections to retail outlets and office buildings. Urban goods movement is conducted almost entirely by trucks, a high proportion of which are small- and medium-sized, generally single-unit trucks with two or three axles. Tractor trailers are also responsible for moving a share of intra-urban cargo, especially for distribution of food to neighborhood grocery chains and for stocking retail outlets. Urban goods movement also involves high volumes of package and parcel pickup and deliveries that support the large service sector in the Bay Area, beyond the freight transportation demand created by the traditional goods movement-dependent economic sectors.
The urban goods movement system is one of the functional elements of the Bay Area goods movement system that is least understood. Because the urban goods movement system consists primarily of arterial corridors owned and operated by cities and counties, and the truck routes are designated and managed by these local governments, there has been no comprehensive characterization of this system. A major concern for this system is discontinuities at jurisdictional boundaries – where a truck route ends at a city boundary but trucks need to continue moving into the next city - and the lack of regional or even countywide plans to manage the major urban goods movement arterial corridors.
Growth Drivers and Key Trends Growth in the Bay Area consumer base will continue to create demands on the urban goods movement system. In addition, increasing densification of development patterns, particularly along transit routes and further encouraged by the State’s Sustainable Communities Strategy, will likely increase conflicts between trucks and other users along the major arterial corridors of the urban goods movement system. Much attention has been given in recent years to developing “Complete Streets” guidance for how best to integrate auto, transit, bicycle, and pedestrian uses in constrained urban rights-of-way, but consideration of truck uses in the same corridors has often been missing. Street design guidance, signalization and signage, signal coordination, and intelligent transportation systems (ITS) strategies will need to consider the interaction of trucks with other street users in future local planning in order to ensure efficient operation of the urban goods movement system.
Increases in e-commerce sales are changing the characteristics of urban goods movement, especially in residential neighborhoods that are seeing an increase in parcel delivery. Consumers are increasingly purchasing via the Internet as opposed to visiting brick and mortar retail stores. Sellers ship these orders in the form of small packages via one of the integrators – UPS and FedEx – by expedited airfreight or ground, depending upon the delivery timeframe desired by the consumer and level of shipping costs the consumer is willing to pay. Sellers are fulfilling these e-commerce orders from their own distribution centers or stores, or though the distribution centers of resellers like Amazon.com. This results in a decrease in package size and an increase in the volume of small
San Francisco Bay Area Freight Mobility Study
4-12 California Department of Transportation
packages moving through the integrator network. For the Bay Area, the increase in Internet sales can mean an exacerbation of urban delivery issues like inadequate delivery van parking spaces and limited time windows for deliveries in concentrated urban centers.
4.5 LAST-MILE CONNECTORS Last-mile connectors refer to the direct access streets, rail spurs and rail branch lines that provide the critical connections between major freight facilities (global gateways, domestic rail terminals, warehouse/industrial centers and industrial parks) and the interregional and intraregional systems. In the case of roadways, the last-mile connectors are a subset of the urban goods movement system.
The relative importance of different last-mile connectors can change with demand. Local freight generators can designate their own last-mile access connectors that address individual needs. It is important to understand last-mile connectors not as a static system, but rather as a changing set of assets that will have different degrees of importance to different parties. The major last-mile connectors within the Bay Area carry a disproportionate share of total freight. Even minor delays impacting last-mile connectors can become problematic.
As part of the designation of the National Highway System, FHWA has also worked with the states to designate an intermodal connector system. However, this system has not been reviewed recently and does not include all of the significant last-mile connectors in the Bay Area. Caltrans and the California Freight Advisory Committee (CFAC) has submitted comments to FHWA regarding the recently proposed National Priority Freight Network (NPFN) that was required by Moving Ahead for Progress in the 21st Century Act (MAP-21) pointing out that the it is important to include last-mile connectors in the national system. At this time, there has not been a comprehensive review and analysis of last-mile connectors in the Bay Area to develop an agreed upon system of these facilities nor is there a targeted funding source for maintaining this system. Developing a designated last-mile connector system and doing a comprehensive analysis of last-mile connector needs is a recommended next step in planning for this critical function in the Bay Area goods movement system.
Growth Drivers and Key Trends Demand can quickly overwhelm supply for last-mile connectors when new capacity is brought on-line. For example, the addition of new marine or air cargo terminal capacity results in more intensive utilization of existing terminals, due to seasonal peaks. This can tax last-mile connectors.
When the federal government worked with states during designation of the National Highway System (NHS), there were a series of NHS intermodal connectors that were designated; and under the provisions of the MAP-21, these connectors are eligible for increased federal share of funding. However, there

San Francisco Bay Area Freight Mobility Study
California Department of Transportation 4-13
has been little effort to review and refine the NHS intermodal connector system over time and to update it with new information about last-mile connectivity needs. Since last-mile connectors are generally city streets, industrial rail spurs, intermodal facilities, and warehouse/industrial lands, they may be the least well-maintained element of the goods movement system. As demand on global gateways, interregional corridors, and intraregional core networks increases, this is a sign that there will be impacts on the last-mile connectors that serve each of the major facilities that are connected to the major gateways and corridors in the region.
4.6 DOMESTIC AIR CARGO SYSTEMS Bay Area domestic air cargo growth has been negative for several years. For this reason, the future needs of the system have attracted less attention when compared to other freight system elements that have seen faster growth. This lack of attention runs the risk of neglecting improvements that could be made in the handling of domestic air cargo that could eventually lead to growth in domestic as well as international tonnage.
Growth Drivers and Key Trends The drivers for domestic air cargo are related to the growth in commodity types that can support the comparatively high cost of air parcel delivery per kilogram. In the Bay Area, value of goods is increasing faster than tonnage, suggesting a shift to higher value products overall. This will create greater need for air cargo shipments.
The potential for a return of high technology manufacturing to the U.S. from Asia or expansion of high technology manufacturing in Mexico in preference to Asia could occur as a result of abundant low cost energy supplies in the U.S., the continued development of highly productive advanced manufacturing processes in the U.S., and the high cost of transportation from Asia to the U.S. All of these factors would tend to mitigate some of the low cost production advantages that manufacturers have achieved in Asia over the last 20 years. If these trends lead to growth in U.S. or Mexican high tech manufacturing, the result will be an increase in demand for domestic air cargo movements for distribution within the U.S.
Because the domestic air cargo system overlaps with the international air cargo system and represents a unique type of interregional corridor. Needs and strategies for this system are presented in the discussions of global gateways and interregional corridors in subsequent sections of this report.
4.7 OVERALL GROWTH FORECASTS The drivers of demand growth described in this section of the report have been considered in development of national forecasts of future freight volumes and

San Francisco Bay Area Freight Mobility Study
4-14 California Department of Transportation
these are the basis of demand forecasts in this report. Using Freight Analysis Framework 3 data, growth rates of freight flows in the Bay Area have been quantified. In 2040, freight moving on the Bay Area freight system is expected to grow moderately, at a compound annual growth rate (CAGR) of 2.2 percent overall. Inbound freight flows will grow at a slightly faster rate than all other flows – at 2.4 percent (Figure 4.2). This reflects a continuing shift of the Bay Area economy away from manufacturing and towards service industries and population serving commodity movements. In addition, from a value perspective, the growth rates are much higher for all movement types (Figure 4.3). Intraregional movement will grow at a CAGR of 3.4 percent, inbound movement will grow at a CAGR of 3.9 percent, and outbound movements will grow at a CAGR of 3.7 percent annually. The higher growth rates in terms of value as compared to tonnage reflect a continuing shift to high-value manufacturing and consumption from an increasingly affluent population in the Bay Area.
Figure 4.2 Bay Area Freight Flow Volumes by Movement Type, 2011 and 2040 Millions of Tons
Source: Freight Analysis Framework 3, FHWA, 2011.
-
50
100
150
200
250
300
350
400
450
Intra Inbound Outbound
235
123 78
420
246
145
Millio
ns o
f Ton
s
20112040
2.0% CAGR
2.4% CAGR
2.2% CAGR

San Francisco Bay Area Freight Mobility Study
California Department of Transportation 4-15
Figure 4.3 Bay Area Freight Flow Values by Movement Type, 2011 and 2040 Billions of Dollars
Source: Freight Analysis Framework 3, FHWA, 2011.
By 2040, exports and imports will grow noticeably as the region continues its growth as an international gateway. Specifically, between 2011 and 2040 export CAGR is projected to be 4.3 percent by tonnage and 5.4 percent by value. This expected growth in exports indicates the growing importance of links between the Port of Oakland and the San Joaquin Valley, where much of the relatively higher weight agricultural export traffic originates. Other regionally produced export commodities, such as wine and medical supplies and instrumentation, are also expected to continue their growth. On the other hand, imports will grow at a slower rate at a CAGR of 2.6 percent by tonnage (Figure 4.4) and 4.2 percent by value (Figure 4.5), as growth in imported crude oil (the largest import commodity) is expected to slow through a combination of growth in domestic supplies and improvements in energy efficiency and shifts to alternative fuels (slowing the rate of demand growth). To some extent, the slower growth in imports relative to exports, which include a significant share of consumer products imported from Asia, also reflects the more limited inland region served by the Port of Oakland as compared to the Southern California ports, and the slower forecast for growth in Northern California population as compared with Southern California. Improvements in rail services at the Port of Oakland could expand the Port’s hinterland, which could affect growth in both imports and exports as an alternative to both the Southern California ports and the Pacific Northwest ports.
-
100
200
300
400
500
600
700
Intra Inbound Outbound
254 203 172
674 614
497
Billio
ns o
f Dol
las20112040
3.4% CAGR
3.7% CAGR
3.9% CAGR
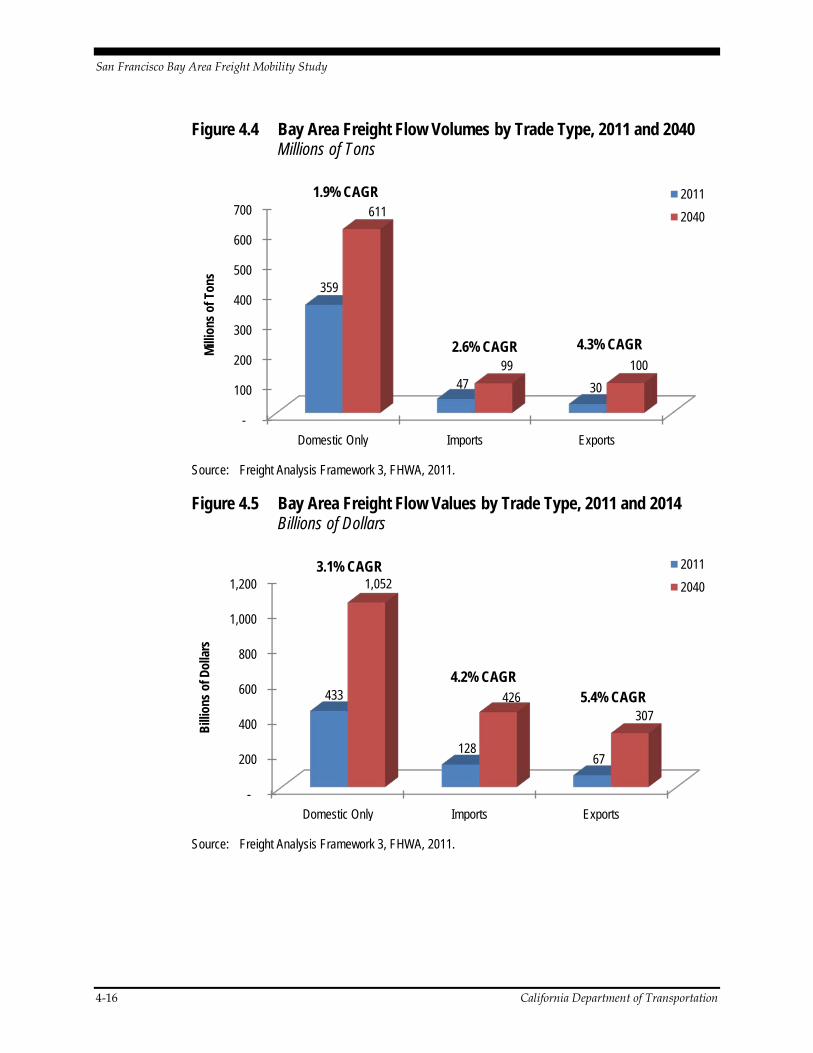
San Francisco Bay Area Freight Mobility Study
4-16 California Department of Transportation
Figure 4.4 Bay Area Freight Flow Volumes by Trade Type, 2011 and 2040 Millions of Tons
Source: Freight Analysis Framework 3, FHWA, 2011.
Figure 4.5 Bay Area Freight Flow Values by Trade Type, 2011 and 2014 Billions of Dollars
Source: Freight Analysis Framework 3, FHWA, 2011.
-
100
200
300
400
500
600
700
Domestic Only Imports Exports
359
47 30
611
99 100
Millio
ns o
f Ton
s20112040
1.9% CAGR
2.6% CAGR 4.3% CAGR
-
200
400
600
800
1,000
1,200
Domestic Only Imports Exports
433
128 67
1,052
426 307
Billio
ns o
f Dol
lars
20112040
3.1% CAGR
4.2% CAGR 5.4% CAGR

San Francisco Bay Area Freight Mobility Study
California Department of Transportation 5-1
5.0 Modal Traffic Implications The growth drivers just described for each functional component of the goods movement system will create increased traffic on the goods movement system in the future. In this section, the modal traffic implications are discussed to show how the infrastructure will be impacted.
5.1 HIGHWAY According to FHWA’s Freight Analysis Framework (FAF), trucking carries the largest share of total freight flows by tonnage in the Bay Area at 67 percent. Commodity flows by truck in the Bay Area are expected to grow significantly, from 290 million tons in 2011 to 565 million tons in 2040, a nearly 100-percent increase. Driving this growth are several key commodities, including waste/scrap, construction products (non-metallic minerals, stone and gravel, and sand), refined petroleum products, and food products. Many of these are commodities associated with the large consumer base in the Bay Area, while the large volume of refined petroleum products is associated with the large refining sector present in Contra Costa and Solano Counties.
While intraregional flows made up 46 percent of truck movements by weight in 2011 (167 million tons), there are also significant truck movements between the Bay Area and other regions within and outside of California, pointing to the importance of interregional highway corridors in the Bay Area. About 8.0 million tons of freight are trucked from the Bay Area to the Los Angeles region, and about 13.2 million tons are trucked in the reverse direction, indicating a net inbound movement of goods from Los Angeles. Together with goods to/from San Diego, these goods will primarily follow the I-5, I-580, I-880 corridors to enter/exit the Bay Area. In addition, there are also considerable truck flows between the Bay Area and the Sacramento region (5.8 million tons outbound, 17.7 million tons inbound), and the rest of California (18.9 million tons outbound, and 29.6 million tons outbound). Interregional connections between the Bay Area and the San Joaquin Valley will continue to be important as will connections to I-5 via I-580/I-205 as the primary connection to the Interstate system outside of California.
In terms of traffic, I-880 and I-580 have the highest overall truck traffic volumes in the region in 2011 (Figure 5.1). I-580 is the primary interregional truck corridor, with I-880 serving both interregional and intraregional traffic. In addition to providing access to the Port of Oakland and Oakland International Airport, I-880 is also one of the core intraregional highways moving goods within the region to major population centers in the East Bay. Between 2011 and 2040, truck traffic will grow fastest at locations including I-580 near Livermore (CAGR 4.0 percent), SR 4 at Port Chicago Highway (CAGR 1.69 percent), and U.S. 101 near San Mateo (CAGR 1.27 percent).

San Francisco Bay Area Freight Mobility Study
5-2 California Department of Transportation
Figure 5.1 Daily Heavy Truck Volumes on Bay Area Highways, 2011 and 2040 Thousands of Trucks
Source: Caltrans Truck Counts, 2011; MTC’s Regional Transportation Model for 2010 and 2040.

San Francisco Bay Area Freight Mobility Study
California Department of Transportation 5-3
Heavy trucks with four or more axles have a greater impact on highway congestion, and create unique operational challenges and more damage and wear on pavement. Interstates with the highest heavy-truck percentages include I-80 and I-580, which are associated with their roles as major interregional corridors. In 2040, the percent of heavy trucks as a share of total trucks will grow significantly, as the supply chain moves towards increased consolidation. This will have significant consequences on roadway infrastructure and operations.
5.2 RAIL Demand for freight rail service is often described in terms of two different types of traffic: carload traffic and intermodal traffic. In this context, “carload” rail shipments are transported in railroad-specific vehicles, such as covered or open hopper cars, box cars (refrigerated or not), pressurized or unpressurized tank cars, flat cars, or rail cars built specially to transport lumber, rolled steel, or automobiles. “Intermodal” rail shipments generally refer to shipping containers, which can be single- or double-stacked on railcars, stacked in a container ship, or placed on a truck trailer chassis. In the Bay Area, demand for carload rail services is generally driven by domestic trade in bulk, liquid bulk, and auto traffic; whereas, demand for intermodal services is a mix of inbound and outbound consumer products and international intermodal products shipped through the Port of Oakland.
Data from the U.S. Surface Transportation Board’s Carload Waybill Sample database is used as a source for describing intermodal and carload rail commodity flows. The forecasts presented in this report are consistent with those that were used in the 2013 California State Rail Plan.90 The two commodities that comprise the largest share of rail carload traffic are motorized vehicles and petroleum products, not elsewhere classified (e.g., petroleum products other than gasoline and fuel oils). Motorized vehicles move both into and out of the Bay Area by rail to serve domestic and international markets. The petroleum products are shipped from the region’s large oil refineries along the Carquinez Straits and Suisun Bay. In addition, Bakken oil from Canada and North Dakota has the potential to be a new primary source of crude for Bay Area refiners. Recent developments in the business models of Bay Area refineries indicate that movement of Bakken oil will be by rail tank cars and this mode of transport is becoming more popular with the refiners; however, it is important that the product is classified correctly and shipped in a robust tank car. This will
90 The California State Rail Plan future train volumes were estimated using 2007 Rail
Waybill data, the Freight Analysis Framework Version 3.0 (FAF3) commodity flows database, Transportation Economic Development Impact System (TREDIS) economic forecasts, and the Association of American Railroads (AAR) National Freight Rail Infrastructure Capacity and Investment Study (2007).

San Francisco Bay Area Freight Mobility Study
5-4 California Department of Transportation
likely lead to growth in rail traffic on the inbound side from Canada and North Dakota to the refineries in the Bay Area.
In the future, intermodal container volumes will drive growth in rail traffic, increasing at a CAGR of 3.5 percent to 2040. The highest level of growth is expected from international intermodal cargo coming from the Port of Oakland. Some motorized vehicles are carried on intermodal rail and this will also experience significant growth in volume.
The majority of rail shipments in the Bay Area, as measured in terms of tonnage, are between the Bay Area and other parts of the country, indicating the preference for using rail to serve long-haul markets, where it is most economical. According to Waybill Data, in 2007, the outbound movement of cargo on rail from the Bay Area to other states was 5.7 million tons, while the equivalent inbound movement was 11.1 million tons. By 2040, outbound shipments from the Bay Area to other parts of the country are expected to exceed inbound shipments. This is due to the much higher anticipated growth rates in international cargo shipped by rail from the Port of Oakland to other parts of the U.S.
In terms of train volumes, Figure 5.2 indicates current daily train volumes on the regional freight rail lines. Freight train volumes are the highest on the UP Martinez Subdivision, especially between Richmond and Oakland, as this is the portion that carries traffic into/away from the Port of Oakland. The freight train volumes are more moderate on the remaining lines. In 2025, overall freight rail demand is anticipated to grow, thereby, exacerbating existing issues and conflicts. Train volumes will increase further on the UP Martinez Subdivision, making it the largest bottleneck on the freight rail system in the Bay Area.

San Francisco Bay Area Freight Mobility Study
California Department of Transportation 5-5
Figure 5.2 Daily Train Volumes in the Bay Area, 2007 and 2012
Source: California State Rail Plan, 2013; Cambridge Systematics.
Note: The freight train volumes shown in this exhibit are year 2007 daily estimates. Passenger volumes are from August 2012.

San Francisco Bay Area Freight Mobility Study
5-6 California Department of Transportation
5.3 MARITIME Growth in maritime trade will have significant impacts on inland modal traffic carrying imported products away from the ports (to inland locations) and bringing exports to the ports (from inland locations). In 2011, marine imports made up about 33 million tons, or 59 percent of total maritime foreign trade, with the rest being exports. The largest share of inland movements was made by pipeline from marine oil terminals to the region’s refineries. Trucking was also a dominant mode carrying imports from the seaports to inland locations. In 2040, import growth carried from ports via pipeline will be limited as crude supplies shift to domestic and Canadian sources. In addition, imports of crude petroleum will grow at a much slower rate than most other import commodities coming through Bay Area ports. Growth in inland modes carrying imports from the ports to final destinations will be greatest for truck and intermodal rail, which reflects the high level of growth anticipated for containerized import cargoes. There will also be a high level of growth in nonmetallic minerals imports through marine ports. These imports include a variety of fertilizer inputs destined for the agricultural centers in the San Joaquin Valley.
On the export side, truck and intermodal rail (containers and also referred to as “multiple modes” in the FAF database)91 make up the vast majority of shipments to the Ports, carrying about 9.6 million and 9.5 million tons of cargo in 2011, respectively. These exports include waste/scrap (31 percent) and petroleum products, not elsewhere classified (15 percent), the top two export commodities from the Bay Area by weight. As mentioned before, overseas demand for waste/scrap will be one of the fastest growing export commodities in the future and will create growth in inland traffic for truck and rail (both intermodal and carload) modes. By 2040, waste and scrap volumes are expected to grow to nearly four times their current volume. Other export commodities that will grow at a fast rate include metallic ores, basic chemicals, and other agricultural commodities. These commodities will move to the ports by rail or by truck depending on their inland origin (for example, Bay Area and Central Valley shippers will move exports to the ports by truck whereas exporters from outside of California will be more reliant on rail).
For the Port of Oakland alone, import and export volumes have grown in tandem, and this trend is expected to continue. From 1990 to 2012, full import 91 The FAF3 and the Commodity Flow Survey use Multiple Modes and Mail rather than
intermodal to represent commodities that move by more than one mode. Intermodal typically refers to containerized cargo that moves between ship and surface modes or between truck and rail, and repeated efforts to identify which cargoes are containerized in the Commodity Flow Survey have proved unsuccessful. Shipments reported as Multiple Modes can include anything from containerized cargo to coal moving from mine to railhead by truck and rail to harbor. (Source: Freight Analysis Framework 3 User Guide.)

San Francisco Bay Area Freight Mobility Study
California Department of Transportation 5-7
containers grew from 254,000 twenty-foot equivalent units (TEU)92 to 792,000 TEUs, a 212-percent increase. The volume of loaded export containers increased from 600,000 TEUs to 986,000 TEUs in the same time period, indicating a slower growth rate. With the exception of 2006, the Port of Oakland has generally been a net exporting port. The growth of the port container traffic also mirrors economic cycles, with high growth rates experienced in 1994, 2003, 2005, and 2010. To add perspective, the Port of Los Angeles handled about 4 million TEUs of full import containers, and 2 million TEUs of full export containers in 201293; the Port of Long Beach handled about 3 million TEUs of full import containers, and 1.5 million TEUs of full export containers in the same time period94. Thus, unlike these Southern California ports that handle roughly twice as much container imports as compared to exports, the Port of Oakland handles more exports as compared to imports.
Contributing to the export growth at the Port of Oakland is the agricultural and prepared food commodities that are produced in the San Joaquin Valley and Central Coast regions of California. In fact, fruit and nuts are the largest commodity group by value exported through the Port of Oakland, at $2.6 billion, or 18.3 percent of total exports in 2012 (Table 5.1). Fruits and nuts export values have nearly doubled from 2008 to 2012, reaching a high of $2.9 billion in 2011.95 Meats and wine/spirits made up 16.2 percent and 5.5 percent of total commodities exported by value. It should be noted that, in addition to the containerized trade shown in Table 5.1, the Port of Oakland also handles bulk and liquid bulk imports and exports (such as pulp and waste paper and iron and steel scrap).
Imports at the Port of Oakland are a mix of supplies to critical industries (e.g., machinery, plastics) and consumer products that are consumed in California and other states in the mostly in the Mountain West. As shown in Table 5.1, in 2012, top import commodities to the Port of Oakland by value included machinery ($3.8 billion, or 15.1 percent); electronics ($3.5 billion, or 14 percent); and apparel ($2.7 billion, or 10.6 percent). As mentioned previously, some of these products move from the Port to warehouse and distribution facilities in the San Joaquin Valley, with a significant fraction returning to the Bay Area for ultimate consumption. One of the fastest growing import commodities by value is coffee,
92 The twenty-foot equivalent unit (TEU) is an inexact unit of cargo capacity often used
to describe the capacity of container ships and container terminals. It is based on the volume of a 20-foot-long (6.1 m) intermodal container, a standard-sized metal box which can be easily transferred between different modes of transportation, such as ships, trains and trucks.
93 http://www.portoflosangeles.org/Stats/stats_2012.html. 94 http://www.polb.com/economics/stats/yearly_teus.asp. 95 http://www.portofoakland.com/pdf/maritime/maritimeHandbook.pdf.

San Francisco Bay Area Freight Mobility Study
5-8 California Department of Transportation
tea, and spices. The value of this commodity group grew from $447 million in 2008 to $1.0 billion in 2011, before declining to $960 million in 2012.96
Table 5.1 Containerized Imports and Exports at the Port of Oakland, 2012 Millions of Dollars
Top Exports
by Commodity Value Containerized
Value Top Imports
by Commodity Value Containerized
Value
1 Fruits and Nuts $2,581 1 Machinery $3,782
2 Meats $2,300 2 Electronics $3,495
3 Machinery $801 3 Apparels $2,657
4 Wine and Spirits $778 4 Wine and Spirits $1,539
5 Rare Earth Minerals $548 5 Furniture and Bedding $1,487
6 Medical Instruments $514 6 Coffee, Tea, Spices $960
7 Vehicles $412 7 Plastics $886
8 Cereals $378 8 Toys/Sports Equipment $847
9 Dairy Products $373 9 Vehicles $842
10 Foodstuffs $334 10 Medical Instruments $585
11 Inorganic Chemicals $329 11 Iron and Steel $550
12 Electronics $300 12 Rubber Products $525
13 Organic Chemicals $293 13 Footwear $459
14 Cotton $287 14 Wood Products/Charcoal $417
15 Sugar and Confectionery $277 15 Paper and Paperboard $319
All Others $3,736 All Others $5,685
Total $14,241 Total $25,035
Source: 2012 to 2013 Maritime Handbook, Port of Oakland.
5.4 AIR CARGO The 2013 California Air Cargo Groundside Needs Study conducted an in-depth analysis of the current and future cargo supply and demand for the Bay Area airports. The forecasts of air cargo demand are for moderate growth at OAK and SFO, and limited growth at SJC.97
OAK is the largest air cargo airport in the Bay Area in terms of air cargo volumes, and supports operations of both UPS and FedEx. In 2011, total cargo 96 http://www.portofoakland.com/pdf/maritime/maritimeHandbook.pdf. 97 California Air Cargo Groundside Needs Study, 2013.

San Francisco Bay Area Freight Mobility Study
California Department of Transportation 5-9
tonnage at OAK was about the same as it was in 1995, and about 65 percent of the peak year in 2000. Although the reduced volumes alone would indicate substantial available capacity for the next decade, the Airport has earmarked the North Field for long-term growth. Air cargo volumes at OAK are forecast to increase from 501,813 metric tons in 2012 to 778,900 metric tons by 2040, with a CAGR of 1.6 percent. Despite a decline in volume from 2003 to 2008, the cargo volumes seem to have stabilized and are expected to rise in the future.
The cargo volumes at SFO have declined since 2003, dropping from 573,525 metric tons in 2003 to 380,790 metric tons in 2012, representing an average decline of 4.4 percent per year. Air cargo volumes at SFO are forecast to increase from 380,790 metric tons in 2012 to 971,900 metric tons by 2040, with a CAGR of 3.4 percent. This high level of growth at SFO will be driven largely by growth in high value international trade.
SJC has seen its cargo volumes fall dramatically over the last decade. Although capacity may not be an issue, due to competition from SFO and OAK, there seems to be limited growth potential for SJC in the future.


San Francisco Bay Area Freight Mobility Study
California Department of Transportation 6-1
6.0 System Needs and Strategies
The changing freight demand characteristics and freight traffic generated on the goods movement system creates various needs and issues that will be the focus of public and private sector infrastructure plans and policies. In this section, the needs of the freight system are described in terms of the major functions of the goods movement system. In addition, for each function the strategies for meeting these needs are also discussed. The focus of many of the strategies is on planned and programmed investments to improve the system and address identified needs.
A complete list of planned and programmed projects relevant to goods movement system needs is presented in Appendix A. In the appendix, the planned and programmed projects are classified based on the goods movement functions that the projects address.98 In the discussion of strategies that follows, several of the projects are highlighted for each strategy as examples of the types of investments that are needed to implement the strategies. In these cases, a project identification number is also provided so that readers can identify the project in the appendix and find additional information describing the projects. Needs and strategies related to domestic air cargo are generally the same as those of international air cargo and are therefore described in the section on global gateways.
6.1 GLOBAL GATEWAYS Needs and Deficiencies
Maritime Ports The Port of Oakland faces potential constraints tied to land availability and deficiencies in cargo handling equipment. The reclamation of the Oakland Army Base (OAB) is intended to allow the Port to expand its terminal capacity, grow its transloading capability, expand intermodal terminal capacity through the development of the Outer Harbor Intermodal Terminal (OHIT), and thereby attract more imports, balancing the Port’s historically export-led orientation.99 If
98 A number of the projects address needs of more than one goods movement function
and this is indicated as appropriate in the appendix. 99 “Oakland Breaks Ground on New Logistics Center,” November 5, 2013,
http://www.joc.com/port-news/us-ports/port-oakland/oakland-breaks-ground-new-logistics-center_20131105.html.

San Francisco Bay Area Freight Mobility Study
6-2 California Department of Transportation
the Port of Oakland is to have sufficient terminal capacity and cargo handling infrastructure to meet potential demand through 2040 the OAB project and its associated rail improvements will be needed.
The Port also needs to have continued dredging of its harbors in order to meet the channel depth requirements of post-Panamax container ships. With the trend towards larger container ships in the TransPacific fleet, vessels will have deeper draft requirements, particularly for vessels making their first call on the West Coast (when vessels are fully loaded). Channel depths of at least 45 to 50 feet will be more typical of these first ports-of-call. The combination of deepwater, expanded intermodal terminal capacity and improved rail access, and expanded terminal facilities and transloading warehousing creates a gateway facility that is more attractive as a first port-of call and this is a critical element of the Port of Oakland’s strategy to increase its competitiveness with West Coast ports, as well as with East Coast ports (which will become increasingly competitive for Asian Pacific trade via the all-water routes through the widened Panama Canal). The rail system improvements needed to support Port of Oakland growth are discussed further in the section of this report describing needs of interregional corridors and last-mile connectors.
In addition to the Port’s needs to support its import business, the Port of Oakland continues to look at improvements to its export capacity. In part, these improvements are related to container terminal improvements, but also include improvements to bulk terminals to take advantage of certain agricultural export markets, mineral exports, and growth in the non-containerized portion of the waste and scrap exports.
The Port of San Francisco experiences constraints on landside access that have made drayage of containerized consumer goods from the port uneconomic and politically unacceptable.100 Nevertheless, the Port has committed to rejuvenate its industrial profile as an import center for bulk/neo-bulk industrial functions.101 The Port of San Francisco is seeking to improve its rail-handling capability to accommodate future cargo growth, including automobiles. Currently, there is inadequate rail infrastructure serving the Port for such cargo, including low rail tunnel clearance on the UP Peninsula line just south of its cargo terminals. The Port has also become a major transfer site for construction waste from the many large construction projects in the City of San Francisco. This waste is also hauled by rail, so the rail access improvements that are planned will also help the movement of this cargo type. 100 “SF Bay Area Containerized Cargo Outlook,” prepared by the Tioga Group for the San
Francisco Bay Conservation and Development Commission, July 2009, http://www.bcdc.ca.gov/proposed_reg/07-31-2009_containercargo.pdf.
101 Port of San Francisco Strategic Plan, http://www.sfport.com/ftp/uploadedfiles/about_us/divisions/finance_admin/PortStrategicPlan.pdf.
San Francisco Bay Area Freight Mobility Study
California Department of Transportation 6-3
The Port of Redwood City has seen growth as a niche port for bulk commodities, such as construction materials including aggregate. Projected growth in these materials over the next 25 years will place strain on existing facilities unless bulk terminal capacity is increased.
Finally, the Port of Richmond encompasses five city-owned terminals and ten privately owned terminals for handling bulk liquids, dry bulk materials, metals, vehicles, and break-bulk cargoes serving an important niche for both liquid bulk and roll on/roll off cargo in the region.102 Expansion of bulk terminals may be needed to take advantage of growth in these commodities.
International Air Cargo The deficiencies of the region’s air cargo system are tied to both market conditions, and infrastructure challenges, specifically, a lack of expansion potential and a legacy runway configuration that is not optimal for boosting total throughput. The effective capacity of SFO is further limited by the frequency of inclement weather, principally fog, that leads to periodic delays and flight cancellations. In 2012, SFO ranked 28th out of 29 major airports for on-time departures and arrivals.103, 104
The lack of balance in international air cargo between OAK and SFO can be seen as a potential future deficiency in the system as well, particularly because access to SFO for East Bay shippers is limited by Transbay connections. In past years, OAK attempted to attract TransPacific air carriers, but was not successful.105 One reason this may have been the case is that many international carriers rely on the connectivity to domestic markets provided by complementary domestic carriers and SFO provides more options for this connectivity through cargo carried in the belly of passenger airlines that provide greater geographic coverage than do carriers at OAK. On the other hand, as a major cargo airport, OAK has fewer operational challenges than SFO due in part to more favorable weather
102 “Port of Richmond Port Facilities”
http://www.ci.richmond.ca.us/index.aspx?NID=324. 103 Table 6, Ranking of Major Airport On-Time Departure Performance Year-to-Date
through December 2012, http://www.rita.dot.gov/bts/subject_areas/airline_information/airline_ontime_tables/2012_12/table_06.
104 Table 4, Ranking of Major Airport On-Time Arrival Performance Year-to-Date through December 2012, http://www.rita.dot.gov/bts/subject_areas/airline_information/airline_ontime_tables/2012_12/table_04.
105 Air Cargo Mode Choice and Demand Study, 2010, http://www.dot.ca.gov/hq/tpp/offices/ogm/key_reports_files/Air_Cargo_Mode_Choice_&_Demand_Study_080210.pdf#zoom=65.

San Francisco Bay Area Freight Mobility Study
6-4 California Department of Transportation
conditions. In the future, growth in air cargo at OAK is anticipated to be driven at least in part by international cargo. Currently, there should be no issues in meeting future air cargo demand at OAK, as areas such as North Field have already been designated expansion areas should a need arise.106
Strategies Strategies to address the needs of the global gateway function in the Bay Area are described within this section. Existing planned and programmed projects associated with each strategy are listed with project identification numbers corresponding to Appendix A, where appropriate, as examples of the types of projects that should be undertaken to implement the strategies.
Expansion/Modernization of Transload, Distribution Centers, and Warehouses Insufficient containerization and special cargo storage and handling and processing facilities in the Bay Area means there is a need to develop regional strategies to increase warehousing and distribution centers in the Bay Area, especially given land availability constraints. It should be noted that there is a significant and growing concentration of warehouses and distribution centers serving the Bay Area in the Northern San Joaquin Valley, and there are economic and transportation-related reasons why this trend makes sense and is likely to continue. However, for cargo moving through the Port of Oakland that is destined for the Bay Area, having warehouses and distribution centers closer to the Port has advantages in terms of the potential to reduce truck vehicle miles traveled (VMT), particularly on I-880, I-238, and I-580. Further, having more local warehousing space geared for transloading could make the Port of Oakland a more attractive import port, and could provide job diversification opportunities for the Bay Area.
Currently, the reclamation of the Oakland Army Base, the Outer Harbor Intermodal Terminal (OHIT) project (GG9), will provide additional warehouses adjacent to the Port, thus, addressing some of this need. Additionally, it is recommended that an updated study be done to understand the feasibility of developing inland ports and/or repurposing brownfield sites for warehouse and transload facility development at these older industrial sites within the Bay Area.
Container Terminal Development and Modernization The Port of Oakland’s ability to accommodate future growth is partly influenced by deficiencies in intermodal cargo-handling capabilities. Through the OHIT project (GG9), a new intermodal terminal will provide direct rail access and improved and modernized cargo-handling capabilities. In addition, 106 California Air Cargo Groundside Needs Study, 2013.

San Francisco Bay Area Freight Mobility Study
California Department of Transportation 6-5
modernization of existing terminals is another important type of strategy to improve cargo-handling capabilities. Currently, the SSA Marine Operator is taking over leases of two contiguous terminals, creating the largest container terminal in Northern California, servicing 20 international carriers with 10 post-Panamax cranes.107 Over the years a number of inland port concepts have been discussed but none have proven operationally or financially viable. Two projects still under development in the Central Valley included in the appendix are the inland port at Crows Landing (Stanislaus County, GG7) as well as a short-haul rail connection at Shafter (Kern County, GG8). Both projects will potentially connect to the Port of Oakland, though they may also serve as rail transload facilities for domestic cargo that will provide additional interregional connectivity. It should be noted that since neither of these inland port projects are located within the Bay Area, an updated assessment of their potential benefits to the Port of Oakland, taking into account current and projected market for import and export flows, is warranted. This is particularly important with the initiation of the new I-580 Marine Highway barge service linking the Port of Stockton and the Port of Oakland (described later in this chapter). While inland ports linked to the Port of Oakland via nonhighway modes provides the opportunity to expand port-related activities off-site when there are constraints to expanding operations at the Port of Oakland and to do so without creating truck-related impacts on communities adjacent to the Port of Oakland, there is not likely to be sufficient market for all of the different inland port concepts that have been developed over the last decade. Previous inland port studies have also revealed challenging economic conditions that could make them unattractive from a business perspective. The Marine Highway project provides an opportunity to reassess these concepts based on the performance of a real example. In addition, as congestion on existing interregional corridors increases and if fuel prices continue to escalate, the economics of inland ports will evolve. Thus, periodic reassessment of these concepts is warranted.
Bulk and Auto Terminal Expansion and Modernization In addition to container terminals, bulk terminals and auto terminals also need expansion and modernization to meet future growth in bulk cargo and auto transport from Bay Area ports. This is particularly true for bulk and break bulk commodities, such as waste and scrap and nonmetallic minerals, which are expected to experience significant growth as exports, and which have received less attention in past goods movement studies as compared to container cargo. Further market assessments and infrastructure plans should be conducted for the bulk and auto terminals at the Port of Oakland, Port of San Francisco, Port of Redwood City, Port of Richmond, and other smaller ports to determine whether a regional strategy for expansion would be beneficial. Currently, there are
107 http://www.ssamarine.com/07182013.html.

San Francisco Bay Area Freight Mobility Study
6-6 California Department of Transportation
several projects falling under this strategy, including the OHIT project (GG9), which will modernize Berth 7, a break bulk terminal; the cargo capacity enhancement project (GG12) and the redevelopment of Wharves 1 and 2 project (GG13) at the Port of Redwood City; and the Pier 96 proposed bulk export terminal at the Port of San Francisco (GG14).
Deepwater Channel Maintenance and Dredging As mentioned in the needs section, the Port of Oakland needs to have continued dredging in order to meet channel depth requirements of post-Panamax container ships. While currently there are no plans underway at the Port of Oakland for dredging, the Port of Sacramento is currently planning a channel deepening project (GG6) that will dredge the Sacramento River channel to a depth of 35 feet. In addition, there are also plans for channel deepening at the Port of Redwood City (GG5) and Port of Stockton (GG4). Maintenance dredging of the Baldwin Ship Channel (which extends from the Golden Gate, through the Carquinez Straits, to approximately the Pittsburg/Antioch boundary) to maintain channel depth of 35 feet is critical to ensuring that ports along the Carquinez Strait and San Joaquin River in Contra Costa and Solano Counties can remain viable for exporting bulk commodities, such as petroleum coke, waste and scrap, and other energy and chemical products.
Expansion/Modernization of Air Cargo Handling Infrastructure Because of the significant decline in air cargo volumes that each of the region’s airports experienced during the last recession, on top of declines in air cargo activity that had occurred after September 11, 2001, most of the region’s airports have sufficient cargo capacity and support facilities. Of the Bay Area air cargo airports, SFO projects the largest growth, especially in international cargo due to an anticipated rise in high-tech manufacturing industries. In light of this growth picture and uncertainties about the future, needs for expansion are considered less critical than other Global Gateway needs. Nonetheless, there are a few projects that should be undertaken to maintain existing cargo-handling capability. Currently, there are projects at SJC that involve construction of a new cargo airline facility (GG1), as well as relocation/expansion of belly-freight facilities that includes additional space (GG2). Additionally, SFO also has a project to enhance storage capacity of warehouses and office space (GG3).
Strategies to Ensure Sufficient Cargo Throughput Inclement weather at SFO can disrupt the supply chain for the shipment of important cargo. As such, it would be useful in future goods movement plans to evaluate strategies to ensure sufficient cargo throughput from/to the Bay Area, including strategies to increase international cargo at OAK. Currently, there are no projects that address this need.

San Francisco Bay Area Freight Mobility Study
California Department of Transportation 6-7
Improve Port of Oakland Truck Efficiency through Freight Advanced Traveler Information System (FRATIS) Given the cost impacts of delays at the Port of Oakland’s terminal gates on an otherwise financially strapped truck drayage industry, it is important to improve the efficiency of marine terminals and their interface with the roadway system wherever possible. FRATIS is a technology solution being developed by the FHWA’s Office of Operations with public and private sector partners. Currently, there is a pilot of FRATIS that will test the concept in Southern California at the Ports of Los Angeles and Long Beach. In its most basic configuration, FRATIS is a web-based software system that provides terminal operators with a “prenotification” of trucks arriving at the Port for a specific load. Twenty-four hours before a drayage company wants to pick up a specific container, the drayage trucking company will log the request into the FRATIS web system, giving the marine terminal operator a “heads up” that this specific load will be requested tomorrow. The marine terminal operator can then, before the truck arrives, move that specific container off the stack and into a position that will be easily accessible when the truck arrives the following day. This system should significantly reduce waiting times for truck drayage drivers and improve the overall efficiency and throughput of the terminals. The FRATIS technology can also be expanded to include other ITS applications that would improve port efficiencies without the need for costly infrastructure expansion. Though FRATIS has not been planned for Port of Oakland, there is a project (GG11) that will construct ITS infrastructure and message boards en route to the Port’s maritime facility. This type of project could be expanded to include an overall assessment of the benefits of FRATIS at the Port of Oakland.
6.2 INTERREGIONAL CORRIDORS Needs and Deficiencies
Highway Congestion The growth in several key industries and sectors will have significant impacts on the interregional corridors. Particularly, delay is a major issue on interregional corridors. As part of this project, the Task 2 Report, Inventory of Facilities with Freight Mobility Issues, provided a detailed analysis to quantify delay on Bay Area roadways. To do so, the Caltrans Performance Systems (PeMS) database was used. Since PeMS defines congestion as areas where highway speeds drop to less than 45 mph, this criterion was used to isolate all the congested highway segments and truck delay was calculated for these high congestion areas.108 108 Average daily total truck delay in the study refers to the truck-hours that are traveled
at an average hourly speed below 55 mph and aggregated over a day, and is
Footnote continued

San Francisco Bay Area Freight Mobility Study
6-8 California Department of Transportation
Figure 6.1 shows the truck delays on major Bay Area roadways. By understanding the causes of these bottlenecks and delay locations, Caltrans can gain useful insights that may suggest future needs and potential projects that can help fix the situation. To help understand the causes of these delays, previous Corridor System Management Plans (CSMP) were looked at for select corridors to determine the cause of truck bottlenecks.
The needs and deficiencies of the interregional network are discussed below, including specific delay locations along each corridor.
Central Corridor (I-80, UP Central Corridor, and BNSF Route to Stockton Subdivision) This is a primary rail corridor in the Bay Area. Most of the intermodal rail traffic moving on this route is international cargo moving from the Port of Oakland. The corridor includes one of the busiest segments of track in the Northern California rail system. Several years ago, UP notched the tunnel over Donner Pass to allow intermodal trains and doublestacked trains to move over the Pass, and this was expected to create an increase in the amount of rail traffic moving out of the Port of Oakland along the Central Corridor. As trade volumes increase with the recovery of the U.S. economy, growth in rail traffic along this corridor is expected to increase.
While most of the focus in recent years on the Central Corridor has been on growth in international intermodal rail traffic on the Martinez Subdivision (from Oakland to Richmond via Martinez) and potential passenger rail conflicts with expanded services on the Capitol Corridor and the Amtrak San Joaquin service, more recently there has been growth in movement of crude oil from the Bakken fields of North Dakota into the region’s oil refineries along the northern Contra Costa waterfront. This shift in crude oil supplies has created a new source of growth in rail traffic on the Martinez Subdivision, and is impacting the lesser used UP Tracy (between Martinez and Tracy) and BNSF Stockton (Richmond to Fresno) Subdivisions. While freight rail capacity has not been an issue yet on this portion of the interregional rail network, it is important for regional goods movement plans to acknowledge this growth in traffic and to continue to assess capacity constraints, safety concerns, and impacts on grade crossings.
computed using hourly truck volume estimates, speed data (from Caltrans PeMS database for the periods of March 5 to 7 and March 12 to 14, 2013), and the estimated extent of congested area. Hourly truck volumes were estimated using the 2012 Caltrans bidirectional average daily total truck counts and 2010 to 2012 Caltrans vehicle classification counts on freeways. The extent of congested area was estimated by combining adjacent congested locations.

San Francisco Bay Area Freight Mobility Study
California Department of Transportation 6-9
Figure 6.1 Average Daily Total Truck Delays in the Bay Area
Source: Bottlenecks data obtained from Caltrans PeMS database, Time Series Speed Contours on Freeways for the
Period from March 5 to 7 and 12 to 14, 2013; Caltrans Truck Counts, 2011.

San Francisco Bay Area Freight Mobility Study
6-10 California Department of Transportation
The I-80 highway corridor is a less used interregional corridor than the I-580 corridor because the connections to the interior U.S. via this route must move over the Sierra Nevada Mountains, and winter weather closures make this a less used route for long-haul traffic. However, I-80 does provide connections to Sacramento, and there are agricultural products that move into the Bay Area and the Port of Oakland via this route. The portions of I-80 in Contra Costa County and Alameda County provide access to the Port of Richmond and the Richmond rail yards for long-haul rail connections. The issues on this corridor include the following:
• Rail/Multimodal Issues:
– The 2013 California State Rail Plan (CSRP) identified a major rail bottleneck along the Central Corridor on the UP Martinez Subdivision between the Port of Oakland and Martinez. This is the busiest rail segment in Northern California with UP and BNSF traffic and the Amtrak San Joaquin and Capitol Corridor services. The projections in the CSRP suggest that there will be a need for increased track capacity along this segment of the Martinez Subdivision in order to meet future demand for both freight and passenger services. It is possible that the forecasts in the CSRP may not fully account for the potential growth in crude petroleum shipments along this rail line, which could further exacerbate the capacity constraints on this corridor and restrict potential expansion of passenger services that conflict with freight services.
– There are also concerns about at-grade crossings and impacts on communities. A number of crossings in the Martinez Subdivision are noted as locations with high potential for accidents at crossings. Looking at the data for rail traffic growth, the Martinez Subdivision will have the greatest rail traffic volumes. When the traffic splits between the BNSF TRANSCON line at Richmond and the UP Martinez Subdivision going north, this becomes less of an issue as the line moves away from population centers.
– For the foreseeable future, interregional highway needs on I-80 are not expected to be significant as many carriers prefer use of the I-580 to I-5 interregional connection to avoid travel over the Sierra Nevada Mountains (particularly during winter weather when road closures often occur). There are some significant congestion issues on the portion of I-80 that moves through Alameda and Contra Costa Counties, but this section serves largely intraregional traffic.

San Francisco Bay Area Freight Mobility Study
California Department of Transportation 6-11
Altamont Corridor (I-580 and UP/ACE109) The Altamont Corridor carries the greatest volume of interregional truck traffic, as it is the primary access route to the Interstate system. It also connects with I-205 to distribution warehouses in Tracy (south San Joaquin County) that serve the Bay Area (and must connect to the Port of Oakland for movement of import containers to the distribution centers) and is the primary route for agriculture exporters in the San Joaquin Valley. All of these sources of traffic are expected to grow, and this growth will impact this corridor. At present, this is a relatively low-volume rail corridor (the UP Oakland Subdivision), but rail traffic could grow if it is used as a reliever route for the Martinez Subdivision. There is also potential for using this route as a short-haul rail connection between the Central Valley and the Port of Oakland. The issues on this corridor include the following:
• Highway Issues:
– I-580 – This route has the worst areas of high truck delay directionally in the region depending on the time of day. I-580 eastbound at El Charro Road and I-580 westbound at SR 84 have the worst truck delays in the Bay Area, with average daily total truck hours of delay110 of 155 hours and 134 hours, respectively.111
• Rail Issues:
– The 2013 CSRP has identified bottlenecks between Elmhurst (near Union City) and Newark on the UP mainline where the Oakland Subdivision (Melrose to Niles Junction) connects with the Coast Subdivision.
Strategies Strategies to address the needs of the interregional corridors in the Bay Area are described in this section. Existing planned and programmed projects associated with each strategy are listed with project identification numbers corresponding to Appendix A, where appropriate, as examples of the types of projects that should be undertaken to implement the strategies. It should be noted that many interregional corridor projects also benefit the intraregional core system.
Preservation of Highway Infrastructure Deterioration of highways and bridges due to future growth in heavy-truck volumes will create a growing need for highway maintenance and preservation projects. This is true for all highways, roadways, and local streets in the Bay 109 This is the Altamont Corridor Express that shares trackage with UP. 110 This means that the speed is less than 55 mph. 111 Information from Task 2, Inventory of Facilities with Freight Mobility Issues.

San Francisco Bay Area Freight Mobility Study
6-12 California Department of Transportation
Area across the functions; thus, preservation should also happen on intraregional networks and urban goods movement networks, as well as last-miles connectors. However, given that the highest volumes of heavy-truck traffic are found on the I-580 interregional corridor, this is an area of particular concern for long-term maintenance and preservation.
Relieve Freight Rail Bottlenecks Insufficient capacity on rail lines to accommodate both freight and passenger rail growth, especially along the Martinez Subdivision, will continue to be a major concern. Strategies to help relieve rail bottlenecks can include rail track addition and improvement, signal improvement, tunnel clearance, additional tracks and connectors, and positive train control. Improvements on both freight-only lines and shared-used corridors will benefit freight movement. Some planned and programmed projects in the Bay Area that will help relieve bottlenecks and ensure improved operations are: the Tehachapi Trade Corridor Rail Improvement Project (IRC53); double-tracking segments of the Caltrain line between San Jose and Gilroy (IRC44); and several track and signal improvements on UP Martinez and Oakland Subdivisions and BNSF Stockton Subdivision (IRC61-IRC95), including the Richmond Rail Connector Project, and Positive Train Control (Port Chicago to Bakersfield). It should be noted that most bottleneck elimination projects and mainline capacity improvements on the region’s rail mainlines are likely to be addressed through investments by the Class I railroads. The projects that are recommended for this strategy are ones where there is shared freight-passenger track. Thus, the owning railroad may give a lower priority to the improvements even if the regional benefits seems to be greater than benefits that can be attained by the owning railroad alone.
Improvement and Separation of At-Grade Highway-Rail Crossings Future growth in freight and passenger rail volumes will place additional trains on rail lines, creating delays and increased safety concerns at at-grade rail crossings. Strategies to improve safety and reduce delays at these locations can range from grade separations, consolidations of crossings, and improved signalization along all routes, especially those with the highest risk for accidents and delay. While a comprehensive study needs to be performed to further determine a regional strategy to address at-grade crossing safety, several projects to improve grade crossings are planned in the Bay Area (IRC5–IRC17), including the 7th Street Grade Separation providing access to the Port of Oakland and Grade Separation Structure on Central Avenue at UP crossing in West Contra Costa County.
Continue Development of Marine Highway and Additional Rail Connections One strategy to provide alternative means of connectivity in order to handle future growth in interregional freight is to provide additional rail and waterway

San Francisco Bay Area Freight Mobility Study
California Department of Transportation 6-13
connections to relieve some of the pressure on congested highway corridors. The marine highway (M-580) that is already under operation is a regular barge service for containerized cargo, providing increased connectivity between the Port of Oakland and the Port of Stockton. Projects such as the marine highway and short-haul rail services can create important system redundancy and resiliency, along with diverting truck traffic off of especially congested interregional corridors. Past studies of these types of projects have concluded that they often do not generate sufficient rate of return (primarily because of the costs of additional handling as cargo changes modes) to attract private investors without some government subsidies. Continuing reevaluation of these alternative modal services should be conducted as costs of congestion, air quality issues, or costs of fuel rise to a level that could justify the projects on the basis of their potential public benefits.
Freeway Delay Reduction Strategies One of the most critical issues facing the interregional corridors is system delays. Infrastructure strategies to reduce delays include capacity expansion and improvement, interchange reconfiguration, and operations and safety improvements. All of the region’s interregional truck corridors are highly congested; and the forecast growth in truck traffic and auto traffic on corridors such as I-580 and I-80 suggest that there will be a need to expand capacity or look for ways to encourage development of additional interregional corridors or improvement/expansion of existing corridors. Projects such as truck-only lanes (e.g., I-238/I-580 truck bypass lane), auxiliary lanes (e.g., I-580 eastbound auxiliary lanes from Hacienda Road to Greenville Road, currently under construction), lane widening and new alignments (e.g., widen I-80 and improve direct freeway-to-freeway connections), and local operational improvements (e.g., SR 92 operational improvements to Chess Drive on- and off-ramps) are already planned for the Bay Area and listed as projects IRC1 and IRC96-98, IRC2-IRC4, IRC99-106, IRC18-IRC40, IRC41-42, and IRC57 and IRC 59, respectively.
In some cases, it may not be financially feasible in the near to medium term to expand interregional corridors to meet projected long-term needs. However, many congested segments of the interregional corridors in the Bay Area are located in areas where it still may be possible to acquire right-of-way to at least create the opportunity to expand facilities in the future. Right-of-way needs on the I-80 and I-580 corridors should be periodically reviewed, particularly in light of the projected growth in interregional truck traffic. Finally, as plans continue to evolve for a variety of projects on the I-580 corridor that could include high-occupancy vehicle (HOV) or express (high-occupancy toll (HOT)) lanes, Bay Area Rapid Transit District (BART) extension, or various truck lane options, a comprehensive corridor plan should be developed that takes into account how each of these options would affect each of the different user groups, including

San Francisco Bay Area Freight Mobility Study
6-14 California Department of Transportation
interregional truck traffic. The I-580 Interregional Multimodal Corridor Study112 provides an initial attempt at taking a comprehensive look at the corridor that could be expanded upon in future plans.
Intelligent Transportation Systems (ITS) Strategies to Improve Interregional Corridor Freight System Efficiency In addition to infrastructure improvements, ITS strategies should be adopted to get the most out of the overall transportation system to reduce delay, reduce nonrecurring congestion, and improve overall operations of the corridors. The Bay Area has made significant investments in a variety of ITS and operations improvements. Beyond the traditional field device deployments of detection, surveillance, and dynamic message signs (DMS) by Caltrans, MTC has also heavily invested in the Freeway Performance Initiative, including a large-scale ramp metering program, as well as building and maintaining the largest 511 traveler information system in the country. There are currently several projects (IRC54-IRC56) planned that will implement Integrated Corridor Mobility (ICM) strategies along I-80, including Adaptive Ramp Metering (ARM) and Active Traffic Management (ATM). At its heart, ATM strives to actively manage the system in real-time while leveraging advanced simulation models to project traffic conditions into the future 20 minutes. By providing operators in a traffic management center (TMC), small tailored simulation traffic models with which they can project out in time the impacts of an incident, they can better manage the system by not only ensuring the correct first responding vehicles get to the scene, but they can provide better traveling information to the public as well.
In addition, with the emergence of mobile computing and the power this provides to the traveling public, in terms of easy access to third-party and private traveler information resources such as traffic on Google maps, many public sector 511 systems are asking themselves: “what role should the public sector play in this new reality?” Many of the questions at this stage are unknown, but public surveys begin to get at where consumer attitudes are going in terms of this field; and many public agencies are partnering directly with Google, TomTom, and others in helping to define that role.
Improvement of Existing Interregional Highways that are not Currently Used Extensively for Truck Traffic SR 152 is a prime example of a corridor that has potential to offer increased interregional benefits to agricultural traffic traversing the Bay Area between the Central Coast and the Central Valley. It could also provide an alternative route for distribution traffic from warehouses in the Central Valley traveling to South
112 I-580 Interregional Multimodal Corridor Study, conducted by Dowling Associates, The
Tioga Group, and W&S for the San Joaquin Council of Governments, August 12, 2011.

San Francisco Bay Area Freight Mobility Study
California Department of Transportation 6-15
Bay population centers. However, to meet this objective, improvements will need to be made to make this a safe and efficient route for trucks. Caltrans’ Interregional Transportation Strategic Plan (ITSP) recommends that the various MPOs and RTPAs along the corridor should study a range of alternatives to completing the necessary improvements to make SR 152 a major interregional corridor. Similarly, U.S. 101 is likely to increase in importance as an interregional corridor connecting with the Central Coast. The improvement program identified in the ITSP for this corridor should also be fully implemented.
6.3 INTRAREGIONAL CORE SYSTEM ISSUES AND NEEDS Needs and Deficiencies
The Central Core Roads (I-880, Portions of U.S. 101 on the Peninsula, and Portions of I-80 in Alameda and Contra Costa Counties) Several intraregional routes experience high levels of truck delay because they are also heavily used commuter routes. I-880 has several operational bottlenecks that further limit capacity. Key bottleneck areas on I-880 include I-880 northbound at Tennyson Road and at the Davis Street interchange in the AM and PM periods, both due to two side-by-side on-ramps, and at 23rd Avenue in the AM period due to on-ramps spaced too closely.113 There are additional bottlenecks on I-880 with slightly less severe levels of truck delay. There are also truck safety issues that have been identified on I-880 in segments between I-980 and I-80 in the north and between SR 92 and I-238 in the south.
U.S. 101 has much lower truck volumes than does I-880, in part, because it does not serve a major seaport and it does not directly feed a major interregional corridor the way I-880 does. However, there are a number of bottlenecks along U.S. 101 that have relatively high levels of truck delay. In addition, truck volumes on U.S. 101 are generally the highest in Santa Clara County, and collision rates are higher than the statewide average on segments between McKee Road and SR 87, and between I-580 and McKee Road, according to the CSMPs.
Though I-80 is primarily an interregional corridor, the sections with most of the delay issues actually serve mostly intraregional functions. Thus, they are included in this section. I-80 has high levels of truck delay between the Bay Bridge and Albany, but mostly because this is one of the most congested commuter corridors. I-80 westbound at University Avenue is the worst delay hotspot on the corridor, according to the Performance Measurement System 113 Information from Task 2, Inventory of Facilities with Freight Mobility Issues.

San Francisco Bay Area Freight Mobility Study
6-16 California Department of Transportation
(PeMS) analysis conducted in Task 2, Inventory of Facilities with Freight Mobility Issues.
Other Important Intraregional Corridors (I-680, SR 4, SR 92, SR 37, SR 12, and Others) I-680 has comparable volumes to I-880 south of I-580. These routes share the demand for truck traffic moving to and from the South Bay and Fremont. Other routes have needs that are tied to the specific industries they serve. For example, SR 4 serves the refineries and chemical manufacturers in Contra Costa County. SR 37 is important for the region’s wine-related traffic. When compared to major truck routes, the total truck traffic on these routes is modest. However, some of these routes, such as SR 12, have high levels of seasonal fluctuation in truck traffic (SR 12 serves seasonal agricultural traffic) and delays can be significant during peak season. The highest level of truck delay on these routes is found on I-680 between SR 238 and SR 262.
Transbay Connections – I-80 (Bay Bridge) and SR 92 (San Mateo Bridge) With respect to the Transbay connections, both I-80 (San Francisco-Oakland Bay Bridge) and SR 92 (San Mateo Bridge) experience delay, but have lower overall total truck traffic than what is served by U.S. 101. There have been several ideas to increase Transbay connections for goods movement, including the use of BART to SFO for small package deliveries and ferry movements of freight. None of these ideas has advanced far in the planning process due to financial and operational challenges.
Strategies Strategies to address the needs of the intraregional core system in the Bay Area are similar to the ones for the interregional corridors. Existing planned and programmed projects associated with each strategy are listed with project identification numbers corresponding to Appendix A, where appropriate, as examples of the types of projects that should be undertaken to implement the strategies.
Improvement and Separation of At-Grade Highway-Rail Crossings At-grade crossing improvements should also be made along the intraregional core system. While a full crossing inventory should be performed to determine a systemwide approach, projects including an underpass at Lone Tree Way (CIRN15-CIRN18) will improve existing at-grade rail crossings. Though these projects are not necessarily driven by freight rail needs, the locations of the identified four projects affect freight rail tracks and operations.

San Francisco Bay Area Freight Mobility Study
California Department of Transportation 6-17
Strategies to Improve Overall Freeway Travel Conditions Safety improvements, delay reduction, and access improvements are all types of strategies that will improve the overall mobility on freeways that form the intraregional core network. Thus, projects on intraregional roadways often address all of these or a combination of these issues. For instance, an interchange reconfiguration project will improve safety by providing an improved design, which will also reduce delay and provide better access, should trucks need that interchange to access other routes. Interchange and roadway improvements, constructions, and reconfigurations make up the majority of projects that will improve overall freeway travel conditions (CIRN 19-76). Freeway improvement strategies can also include auxiliary lane additions to improve operations; an example would be adding auxiliary lanes on I-680 in both directions between Sycamore Valley Road in Danville to Crow Canyon Road in San Ramon (CIRN213). Additional strategies include truck climbing lanes (such as widening of SR 92 to include a passing lane between San Mateo-Hayward Bridge to I-280); traditional lane widening, realignments, and new alignments (such as widening of SR 12 (Jameson Canyon) from I-80 in Solano County to SR 29 in Napa County); and traditional operational improvements (such as the conversion of Willow Road on the west side of Dumbarton Bridge between SR 84 and U.S. 101 to an expressway). These are listed as projects CIRN88-92, CIRN14, CIRN74, and CIRN98-104; and CIRN77, CIRN78, CIRN82, CIRN93, and CIRN94, respectively. Additionally, there is an innovative planned research project that is investigating the feasibility of using the BART rail system in place of trucks to move mostly small package air freight in and out of SFO and OAK (CIRN84).114
Strategies to Improve Transbay Connections Insufficient Transbay connections for freight movements call for strategies to improve connections through providing alternative freight transportation services other than highway bridges. The impact that congestion on bridges has on goods movement, particularly for air cargo (which is often using expedited delivery services), needs to be better understood. In addition, further studies can be done to explore alternative options using ferries for Transbay goods movement.
6.4 URBAN GOODS MOVEMENT ISSUES AND NEEDS Needs and Deficiencies Needs and deficiencies in the urban goods movement system are caused by: 1) the lack of comprehensive arterial corridor system planning across 114 This project is subject to the outcome of the feasibility study and engineering and
environmental assessment.

San Francisco Bay Area Freight Mobility Study
6-18 California Department of Transportation
jurisdictions, and 2) the lack of coordination with land use planning. While the largest truck volumes on regional roadways are found on the interregional corridors and the intraregional core system, there is a network of major arterial truck routes that provide an important function for urban goods delivery, particularly to retailers, commercial businesses, and residences. These arterial roadways are primarily city and county streets and roads that cross jurisdictional boundaries and are not usually managed as a system. This can result in discontinuity in regional arterial truck corridors; inconsistent size and weight restrictions or time-of-day controls; lack of signal coordination considering the acceleration and deceleration characteristics of heavy trucks; and inconsistency of street design features, particularly as regards to geometrics and accommodation of multiple modes of travel (auto, truck, transit, bicycle, and pedestrian) within a highly constrained right-of-way. Because most regional studies tend to focus on the major freight hubs and the State Highway System, there is less discussion on the needs of arterial corridors.
A second cause of deficiencies and needs in the urban goods movement system is primarily related to future land use trends, including the trend for industrial land uses such as manufacturing, warehousing and distribution to move outside of the central Bay Area, and the potential conflicts that can be generated from Smart Growth115 implementation in various types of Priority Development Areas (PDA)116.
If land use patterns continue to emphasize dense residential and commercial development in the central core of the region, older industrial space will be converted to these higher value uses, pushing many goods movement-dependent industries to locations on the periphery of the region or out of the region altogether. For many of these businesses, there will still be a need to access the central core areas, and these emerging development patterns will create a need for trucks to travel longer distances from distribution centers and corporation yards that are far from urban centers in order to make deliveries during limited daytime hours. With more distribution centers located further from the regional center, the average trucking distance is likely to increase. In order to operate safely and improve efficiency, truckers operate during off-peak hours whenever possible. As congestion on intraregional corridors grows, the ability of trucks to avoid operating during peak periods may lessen if they have to move between a base of operations outside the region and the urban core.
115 Smart growth is an urban planning and transportation theory that concentrates
growth in compact, walkable urban centers to avoid sprawl. 116 PDAs represent areas local Bay Area jurisdictions have identified as part of the
Sustainable Communities Strategy in Plan Bay Area for new and/or intensified development.

San Francisco Bay Area Freight Mobility Study
California Department of Transportation 6-19
With different modes competing for the same highly constrained space, increasing conflicts between trucks and other modes are likely. Transit-oriented development (TOD) in the Bay Area shares many of the same corridors with the major rail and truck routes in the region, creating challenges for goods movement. In addition, dense mixed-use development poses particular challenges for managing urban goods pickup and delivery. A potential strategy to reduce conflicts involves the tiering of truck routes to improve operations when trucks and other modes share the streets. Tiered truck routes is a concept by which designated truck routes are put into a hierarchy with higher priority routes having greater restrictions on nonfreight uses and lower priority routes having less restrictions on nonfreight uses. The hierarchy is based on the amount of truck traffic and the goods movement functions along the routes, the physical suitability of the route for trucks vs. other users, and the potential for alternative routes for different traffic streams.
Finally, another deficiency in the urban goods movement system is the paucity of available truck parking and the need for improved parking management in dense urban areas.117
Strategies Strategies to address the needs of the urban goods movement system in the Bay Area are discussed below. A number of these strategies are also applicable to the intraregional core system and so they are only briefly discussed. In addition, many urban goods movement strategies are discussed in Chapter 7 as they affect the community and environment. Existing planned and programmed projects associated with each strategy are listed with project identification numbers corresponding to Appendix A, where appropriate, as examples of the types of projects that should be undertaken to implement the strategies.
Improvement and Separation of At-Grade Highway-Rail Crossings At-grade crossing improvements should also be made along the urban goods movement network. While a full rail at-grade crossing inventory should be performed to determine a systemwide approach, projects (UGMS4-UGMS12) such as the grade separation over Decoto Road in Union City, or an overpass on Mowry Avenue in Fremont will improve existing at-grade rail crossings. Grade separations are typically not to the benefit of the railroads but to address highways and local road congestion and safety issues.
Truck Parking Infrastructure Development and Expansion Lack of truck parking for pickup/delivery activities has been an ongoing problem in urban areas, and particularly for the Bay Area. The 2008 Alameda
117 Truck Parking Facility Feasibility and Location Study, Final Report, 2008.

San Francisco Bay Area Freight Mobility Study
6-20 California Department of Transportation
County Truck Parking Facility and Location Study done by the Alameda County Congestion Management Agency concluded that there is a shortage for truck parking and looked at various potential sites for truck parking, but it is important to follow up on the study to develop additional trucking parking infrastructure throughout the Bay Area.
Strategies to Improve Travel Conditions on Arterial Corridors Safety improvements, delay reduction, and access improvements are all types of strategies that will improve the overall mobility on roadways that form the urban goods movement network. Projects such as the widening of Auto Mall Parkway from four to six lanes; safety improvements to Vasco Road in the Contra Costa County; and the North Richmond truck route extension from Market Avenue to Parr Boulevard (UGMS1-3, UGMS10, UGMS13-48) will improve the overall travel conditions on urban goods movement roadways.
Arterial Smart Corridors The arterial network in any community is the largest single transportation component, and most of the local truck routes that comprise the urban goods movement function are arterials. Over the past two decades, many municipalities in the Bay Area have heavily invested in upgrading and updating their signal systems; providing systems that adapt, in real-time, to the traffic conditions without operator involvement. Currently in the Bay Area, there is an East Bay SMART corridors program in place, which consists of two major arterial corridors: the San Pablo Avenue and the Hesperian/International/East 14th Boulevard corridors118 – primarily aimed at improving bus operations. One additional step that could be implemented is developing Smart Corridors along arterial corridors that have either heavy vehicle or transit traffic or are significant for freight and drayage movements. Smart Corridors are an evolutionary development from advanced signal systems and offer additional technological upgrades, such as transit signal priority, closed-circuit television cameras (CCTV), and arterial Dynamic Message Signs at major decision points such as freeway interchanges. These added improvements provide the same level of situational awareness found on the region’s freeways. They are relatively low-cost improvements and can have tremendous benefits on one of the largest pieces of the transportation system. The City of Chicago and its suburban neighbors are actively pursuing these types of projects. If arterial Smart Corridors are created on local truck routes, it would also be possible to examine ways to adjust signal timing to account for turning movements of heavy trucks, or to experiment with truck signal prioritization in industrial areas.
118 http://www.accma.ca.gov/pages/HomeSMARTCorrProg.aspx.

San Francisco Bay Area Freight Mobility Study
California Department of Transportation 6-21
Development of Comprehensive Arterial Truck Corridor System Plans Much as there has been a move to develop Corridor System Management Plans (CSMPs)119 for the State’ Highway System, it would be beneficial for Caltrans and MTC to work with the county congestion management agencies, transportation commissions, and the cities in the region to develop comprehensive arterial corridor system plans for the major arterial truck corridors in the region. These plans should consider the need to maintain continuity in truck routes and restrictions, and should provide guidance for Complete Streets implementation that includes consideration of truck movements along with other travel modes.
6.5 LAST-MILE CONNECTOR ISSUES AND NEEDS Needs and Deficiencies Proactive planning is required to foresee capacity constraints in last-mile connections before they become bottlenecks. There are a number of last-mile deficiencies that have been identified and are beginning to be alleviated. These include both roadway connectors and last-mile rail connections, which are often handled by the region’s short line railroads. One prominent example is the Outer Harbor Intermodal Terminal (OHIT) Rail Access Project. Currently, delays in rail access to the Port of Oakland impact both UP and BNSF operations when entering the Port. These rail delays cascade to impact commuter and Amtrak trains. The OHIT Rail Access project of the Port of Oakland, which was funded through state TCIF funds ($242 million), a TIGER120 grant ($15 million), and other local sources, was awarded in 2012 and will help the Port speed the effort in
119 The goal of a Corridor System Management Plan (CSMP) is to define how a travel
corridor is performing, understand why it is performing that way, and recommend system management strategies to address problems within the context of a long-range planning vision. CSMPs are being developed throughout California for corridors within which projects are funded from the Corridor Mobility Improvement Account.
120 The Transportation Investment Generating Economic Recovery, or TIGER Discretionary Grant program, provides a unique opportunity for the U.S. Department of Transportation (DOT) to invest in road, rail, transit, and port projects that promise to achieve critical national objectives. Congress dedicated more than $4.1 billion to the program: $1.5 billion for TIGER I, $600 million for TIGER II, $526.944 million for FY 2011, $500 million for FY 2012, $473.847 million for FY 2013, and $600 million for the FY 2014 round of TIGER grants to fund projects that have a significant impact on the nation, a region or a metropolitan area. Source: http://www.dot.gov/tiger.

San Francisco Bay Area Freight Mobility Study
6-22 California Department of Transportation
alleviating this problem.121 There are also local roadway improvements that are included in the OHIT project, as well as roadway access improvements to the planned global logistics center at the former Oakland Army Base.
Strategies Strategies to address the needs of the last mile connectors in the Bay Area are discussed in this section. A number of these strategies are also applicable to the intraregional core system and so they are only briefly discussed in this section. Existing planned and programmed projects associated with each strategy are listed with project identification numbers corresponding to Appendix A, where appropriate, as examples of the types of projects that should be undertaken to implement the strategies.
Improvement of Rail Connectors Constraints on rail cargo movements to ports and industries are due to insufficient capacity and operational challenges on last-mile connectors. Currently, apart from the Oakland Army Base Redevelopment Project (LMC1), there is also a Quint Street Lead Port Rail Access Project that will relocate and improve a one-mile spur connecting Caltrain mainline track to Port of San Francisco’s railyard (LMC13).
Improvement of Roadway Access to Freight Facilities This strategy involves enhanced access to airports, intermodal rail facilities, and ports, as well as other freight activity centers. While there is a need to further study access needs of particular industrial clusters and to define specific last-mile connectors that serve these clusters (and their improvement needs), there are already several projects planned in the Bay Area. This list includes a project that will improve access to OAK from I-880 through ITS and other strategies (LMC11), a project to improve access to Oakland Army Base (roadway reconstruction and alignment) (LMC12), as well as several other projects that includes interchange improvements on U.S. 101, SR 12, as well as roadway reconstructions (LMC2-10 and LMC14-18).
121 “$15 Million Awarded to Port of Oakland Army Base First Phase Rail Project,”
June 19, 2012, http://www.portofoakland.com/newsroom/pressReleases/2012/pr_270.aspx.

San Francisco Bay Area Freight Mobility Study
California Department of Transportation 7-1
7.0 Community and Environmental Impacts and Mitigation Strategies
In addition to the needs and deficiencies of the freight system that are directly related to demand and infrastructure and operational needs, there are also environmental and community impacts resulting from freight movement in the Bay Area that need to be addressed with targeted strategies. Impacts to air quality from proximity to freight facilities, as well as those due to land use are summarized below along with strategies that can mitigate these impacts.
7.1 COMMUNITY AND ENVIRONMENTAL IMPACTS Air Quality Impacts Air pollution is one of the most significant issues facing communities, and goods movement is responsible for a significant share of particular types of air pollution. Prolonged exposure to air pollutants may lead to reduced lung function, asthma, or other respiratory illnesses; increased cancer risk; and premature death, among other health risks.
Diesel Particulate Matter In the Bay Area, diesel particulate matter (PM) is the pollutant of most concern as it accounts for 85 percent of the cancer risk from toxic air contaminants.122 PM refers to either airborne solid or liquid particles classified as either PM10 or PM2.5, with the numbers representing particulate diameter size in micrometers. Motor vehicle exhaust is largely responsible for PM2.5, and can create health risks such as breathing and respiratory system difficulties, lung tissue damage, cancer, and premature death. From July 2009 to December 2011, during the peak PM2.5 concentration period, freight transportation contributed to 17 percent of total PM2.5 pollution in the Bay Area (13 percent from diesel vehicles, 2 percent from ships, and 2 percent from aircraft/trains). In the future, considering current regulations, and assuming no additional regulations or policies will be adopted, PM2.5 emissions from on- and off-road motor vehicles are expected to decline
122 BAAQMD Toxic Air Contaminants Annual Report, 2011.

San Francisco Bay Area Freight Mobility Study
7-2 California Department of Transportation
until 2020 due to aggressive regulations on diesel engines. After 2020, vehicle emissions are expected to increase by less than 1 percent annually until 2030.
Though pollution issues in the Bay Area are less severe than many areas throughout California, this is not true for all Bay Area communities. There are communities in the Bay Area that are disproportionately impacted by air quality issues, such as the West Oakland community and the City of Richmond community. Truck trips through the West Oakland neighborhood, generated by operations at the Port of Oakland and nearby industrial operations, create adverse health effects for individuals in this socially and economically disadvantaged community.
Nitrogen Oxides (NOx) and Ozone Ozone is formed through reactions between NOx and volatile organic compounds (VOC). Sources of the pollutants that create ozone include vehicle exhaust, industrial processes, gasoline vapors, chemical solvents, methane gas (cattle), and even some elements of natural vegetation. Compared to the rest of California’s nonattainment areas, the Bay Area has relatively less severe problems with ozone, as the region is classified in the “marginal” category by the United States Environmental Protection Agency (EPA) for ozone attainment. In the future, NOx (precursor to ozone) emissions of on-road vehicles are expected to decline due to fleet turnover and the requirement of more stringent emission regulations for trucks. This is true despite projected increases in population and VMT.
Greenhouse Gases (GHG) GHGs are the cause of the “greenhouse effect,” which refers to the rise in earth’s temperature resulting from atmospheric gases trapping the sun’s heat. This effect can lead to climate change impacts, such as sea-level rise and extreme weather events that could affect significant portions of the freight infrastructure. In 2007, 95.8 million metric tons of carbon dioxide (CO2)-equivalent GHGs were emitted by all sources in the Bay Area, of which 36.4 percent came from the transportation sector. Of the transportation emissions, 76.2 percent were attributable to freight. In the future, Bay Area GHG emissions are expected to increase at an average rate of approximately 1.4 percent per year, absent policy changes and if current trends continue.123
Independent Owner-Operator Issue at the Port of Oakland One of the contributing factors to truck-related emissions associated with the Port of Oakland can be traced to the structure of the trucking industry that serves
123 http://www.baaqmd.gov/~/media/Files/Planning%20and%20Research/
Emission%20Inventory/regionalinventory2007_2_10.ashx.

San Francisco Bay Area Freight Mobility Study
California Department of Transportation 7-3
the Port. Many of the licensed motor carriers (LMC) that serve the Port are large-to mid-sized companies that provide other logistics services. While some have their own trucks and drivers, they also utilize the services of independent owner-operators (IOO) for much of the trucking activity. While the IOOs also gain some benefit from owning and operating a truck, over time, there have been some negative impacts of this system. Since the IOOs are paid by the load and are not paid hourly, as congestion has increased (both on roadways and at the terminal gates), the number of loads (also known as “turns”) that the drivers can carry per day has declined, directly affecting incomes of the drivers. IOOs also do not receive benefits nor do they have collective bargaining rights since they are not employees of the LMCs. Price pressure on imported goods sold in the U.S. has caused shippers to demand and often receive low rates from their transportation service providers. This price pressure often falls on the IOOs.
Due to a combination of factors, when IOOs have experienced this downward price pressure, they have tended to reduce one of the few costs they have control over, vehicle maintenance, which contributes to IOO-owned port drayage trucks often being the dirtiest trucks on the road. The California Air Resources Board (CARB) has sought to address this problem through promulgation of new emission standards for drayage trucks. In the past, the State of California, BAAQMD, and the Port of Oakland have had programs to help IOOs finance conversion to cleaner trucks. However, the next round of emission reductions will require expensive conversions, and there currently is no additional monetary assistance to help pay for the new technologies. How this will be resolved in a manner which protects communities from the adverse health impacts of truck emissions while protecting the IOOs from negative financial consequences has not been determined.
Impacts from Proximity to Freight Facilities Apart from air quality, freight movement often creates other negative impacts on communities in proximity to freight facilities. These can include light pollution from activities, such as nighttime freight operations; noise pollution from truck braking and horn blowing by trains; vibrations from heavy trucks and rail; and ecosystem pollution (water, soil, wetlands) from the movement of hazardous materials. In the Bay Area, the communities in the East Bay along the I-880 and I-80 corridors are likely to experience the largest impacts from freight activities, especially since there is a high degree of residential development that abuts these corridors as compared to the Peninsula, the I-580, and Tri-Valley124 areas.
Several communities in the Bay Area are affected by their proximity to freight facilities, with the West Oakland community as a prime example, due to its location near the waterfront, the Port of Oakland and other major freight 124 This is a triangle-shaped region in the eastern San Francisco Bay Area. It is based
around the Cities of Pleasanton, Livermore, Dublin, San Ramon, and Danville.

San Francisco Bay Area Freight Mobility Study
7-4 California Department of Transportation
infrastructure, such as rail terminals, rail lines as well as major freeways. The adverse impacts on communities such as West Oakland are largely due to truck traffic, where trucks may be creating noise, light, and other health hazards and intrude on the community by parking illegally on residential streets. The main reasons behind the truck encroachment problem are fourfold: 1) lack of adequate parking and service facilities, 2) lack of signage for truck routes, 3) lack of adequate access to service facilities and freight facilities via legally designated routes, and 4) lack of local enforcement and regulations. Terminal operations, terminal delay and hours of service regulations also have effects on the illegal truck parking issue. A comprehensive solution that addresses all facets of this issue should be developed and implemented.
Impacts from proximity to freight facilities exist in various communities in the Bay Area, though these impacts are not well quantified. In Oakland, illegal truck parking remains an important problem, and while the City of Oakland adopted a truck routing ordinance in 2005 to remove heavy trucks from residential streets, enforcement of this ordinance is inadequate. Recently, an East Oakland Truck Route Assessment Study125 was completed, which provides recommendations to update truck routes in East Oakland. Given the existing impacts of the Port of Oakland, the Oakland Army Base Redevelopment Program is also likely to generate various impacts on the community. This includes positive impacts such as job creation, as well as negative impacts such as noise and increased traffic congestion.
7.2 MITIGATION STRATEGIES Strategies that can be adopted in the Bay Area to help mitigate the environmental and community impacts along with strategies that are already underway are presented below.
Air Quality Mitigation Strategies
Continue Implementation of Major Regulatory Standards and Adopted Regional Control Measures to Reduce Truck Emissions While there are many regulations that affect emissions from trucks, the one that will have the greatest impact is CARB’s On-Road Heavy-Duty Diesel Vehicles (In-Use) Regulation, which will be the main cause for the reduction in NOx and PM2.5 emissions in the immediate future. Truck emission standards are generally set by the U.S. EPA for new trucks and will normally take decades to have full effect. However, in California, the introduction of low emission trucks is accelerated by the On-Road Heavy-Duty Diesel Vehicles (In-Use) Regulation, 125 City of Oakland, East Oakland Truck Route Assessment Study, Draft Report, Kimley-
Horn and Associates, Inc., September 2013.

San Francisco Bay Area Freight Mobility Study
California Department of Transportation 7-5
which applies to trucks already on the road. The regulation calls for phase-in of best available control technology for PM and NOx between 2011 and 2023. By 2023, nearly all trucks and buses will need to have 2010 model-year engines or equivalent. Some of the other truck regulations enacted by ARB are shown in Table 7.1 below; and include emissions, fuel, and vehicles standards. These regulations will have a significant impact on truck emissions over time and result in a much faster turnover of trucks on the road than would otherwise occur in the absence of the regulations.
Table 7.1 ARB Diesel Air Toxic Control Measures for Heavy-Duty Vehicles, Equipment, and Ships
Pollutant Impacts to Public Health/the Environment
Trucks and Buses Since 2008, idling limited to 5 minutes
By 2016, all trucks meet equivalent of 2007/2010 PM standard
By 2023, all trucks meet equivalent of 2010 NOx standard
Drayage Trucks By 2010, pre-Model Year (MY) 1994 trucks banned
By 2010, MY 1994-2003 trucks meet 2007/2010 PM standard
By 2014, all trucks meet 2007/2010 PM and 2007 NOx standard
By 2023, all trucks meet 2010 NOx standard
Public Fleet Vehicles By 2012, all trucks meet equivalent of 2007/2010 PM standard
Garbage Trucks By 2011, all vehicles have installed Best Available Control Technology (BACT)
Transit Buses By 2003, met an NOx fleet average of 4.8 g/bhp-hr
By 2007, PM emissions reduced by 85% from 2002 baseline
For fleets in the Bay Area with 200+ buses, 15% of new buses purchased from 2011-2026 must be zero emissions (may be amended in 2012)
Truck Refrigeration Units By 2020, engines must meet Ultra-Low Emission standard
Locomotives In 2007, begin using 15 ppm Sulfur fuel in California-based locomotives
By 2008, conduct health risk assessments for major rail yards
By 2009, install idling reduction devices on California-based locomotives
Construction Equipment Since June 2008, idling limited to 5 minutes
Between 2014 and 2023, fleets with more than 5,000 total horsepower (hp) must meet fleet average NOx targets or turnover/replace 4.6-10% of fleet hp
Between 2017 and 2023, fleets with 2,501 to 5,000 total hp must meet fleet average NOx targets or turnover/replace 4.6-10% of fleet hp
Between 2019 and 2029, fleets with less than 2,501 total hp must meet fleet average NOx targets or turnover/replace 4.6-10% of fleet hp
Cargo Handling Equipment
By 2007, new equipment meets equivalent of Tier 4 off-road engine standards or 2007 PM/NOx on-road engine standards
By 2015, pre-2007 yard trucks meet equivalent of Tier 4 off-road engine standards or 2007 PM/NOx on-road engine standards

San Francisco Bay Area Freight Mobility Study
7-6 California Department of Transportation
Pollutant Impacts to Public Health/the Environment
By 2017, all other pre-2007 equipment must meet equivalent of Tier 4 off-road engine standards or 2007 PM/NOx on-road engine standards
Harbor Craft Beginning in 2009, engines for new vessels or repowers meet Tier 2 or Tier 3 off-road standards; new ferries must be 85% below Tier 2 standards
By 2016, pre-2000 engines meet Tier 2, 3, or 4 off-road standards
By 2022, all engines must meet Tier 2, 3, or 4 off-road standards
Ships In 2009, ships began using Marine Diesel Oil (MDO) with 0.5% sulfur or Marine Gas Oil (MGO) with 1.5% sulfur; by August 2014, ships begin using MDO or MGO with 0.1% sulfur
In 2014, 50% reduction in auxiliary engine use during 50% of visits by cruise and container ships (shore power)
In 2017, 70% reduction in auxiliary engine use during 70% of visits by cruise and container ships (shore power)
In 2020, 80% reduction in auxiliary engine use during 80% of visits by cruise and container ships (shore power)
Back-up Generators (BUG)
By 2008, PM emissions for BUGs reduced by 85% in new engines
Source: http://www.baaqmd.gov/~/media/Files/Planning%20and%20Research/Plans/PM%20Planning/ParticulatesMatter_Nov%207.ashx.
The Bay Area 2010 Clean Air Plan (CAP) provides a comprehensive plan to improve Bay Area air quality and protect public health through definition and implementation strategies that involve all pollutants. The 2010 CAP control strategy includes revised, updated, and new measures in three traditional control measure categories: Stationary Source Measures, Mobile Source Measures (MSM), and Transportation Control Measures (TCM). In addition, the CAP identifies two new categories of control measures: Land Use and Local Impact Measures, and Energy and Climate Measures. The control measures in CAP most relevant for trucking include the following:
• MSM B-1 – Fleet Modernization for Medium-and Heavy-Duty On-Road Vehicles – This program is designed to encourage other organizations to provide incentives for the purchase of new trucks to meet CARB’s 2010 emission standards for heavy-duty engines. Between 2010 and 2015, the Air District will directly provide and/or work with other entities to provide incentives to accelerate the replacement of up to 5,000 heavy‐duty on‐road diesel engines in advance of requirements for the CARB’s in‐use heavy‐duty truck regulation (mentioned before).
Currently, this measure is partially being addressed by the Carl Moyer program, a state program that provides grant funding for cleaner than required engines and equipment.126 Stakeholder interviews have indicated that many private sector entities in marine, trucking, and railroading businesses have benefitted from this program. For example, in 2010, Richmond Pacific Railroad and California Northern Railroad received Carl
126 Source: http://www.arb.ca.gov/msprog/moyer/moyer.htm (last accessed on
September 19, 2013).

San Francisco Bay Area Freight Mobility Study
California Department of Transportation 7-7
Moyer funds for purchasing locomotives. In year 14 of the program (2013), a total of 85 projects, or 112 engine retrofits or replacements were funded in the Bay Area at a cost of $5.4 million.127
• MSM B-2 – Low NOx Retrofits in Heavy-Duty On-Road Vehicles – This measure is designed to reduce NOx emissions from on-road, heavy-duty vehicles. Between 2010 and 2015, the Air District will provide incentives to install CARB‐verified abatement equipment to reduce NOx emissions from existing on‐road heavy‐duty truck engines. Emphasis will be placed on bringing existing engines into early compliance with CARB’s in‐use truck regulation. The retrofit of heavy-duty diesel engines with NOx abatement equipment is estimated to cost $30,000 per engine. The Bay Area Air Quality Management District (BAAQMD) staff anticipates that about 75 percent of the retrofits will occur between 2013 and 2015 as fleets prepare to comply with NOx requirements in the CARB in‐use truck engine regulation. It is anticipated that BAAQMD will make available up to $3 million to $5 million per year in incentives for the retrofit of existing trucks between 2010 and 2015.
• TCM B-4 – Goods Movement Improvements and Emission Reduction Strategies – This measure will reduce emissions associated with goods movement by investing in the Bay Area’s trade corridors and by providing incentive funding for diesel equipment owners to purchase cleaner‐than‐required vehicles and equipment. This measure is funded by Proposition 1B, a voter approved $19.9 billion transportation infrastructure bond for California. Proposition 1B included a $2 billion Trade Corridors Improvement Fund (TCIF) to improve goods movement infrastructure statewide. In 2008, the State augmented the program to nearly $2.5 billion and programmed just over $3 billion for high‐priority goods movement projects. Proposition 1B also included $1 billion for a Goods Movement Emissions Reduction program. The BAAQMD is responsible for developing various programs for the bond, including a diesel truck replacement program. Currently, the year 4 of the truck replacement program funding level is at $14.5 million.128
Continue Implementation of the Maritime Air Quality Improvement Plan (MAQIP) As the single largest source of freight activities, the Port of Oakland, in partnership with BAAQMD and other stakeholders, developed the MAQIP in
127http://www.baaqmd.gov/~/media/Files/Strategic%20Incentives/Carl%20Moyer/C
MP%20Year%2014%20Projects.ashx. 128http://www.baaqmd.gov/~/media/Files/Strategic%20Incentives/Goods%20Movem
ent%20Docs/GMP%20YR4%20solcit2%20Fact%20Sheet%2010312013.ashx.

San Francisco Bay Area Freight Mobility Study
7-8 California Department of Transportation
2009. This plan is focused on reducing the exposure for local residents, especially in West Oakland and workers to diesel PM as a result of maritime activities and stationary point sources.129 To support the plan, as part of an earlier action, the Port committed to a goal of reducing diesel PM from seaport sources by 85 percent between 2005 and 2020, with interim goals set for 2012. To achieve this goal, three general approaches are used, which include the following:
1. Source Control – This can be voluntary actions or regulatory requirements, such as equipment retrofits and replacements.
2. Operational Changes – This includes nonregulatory approaches to further reduce emissions, and can include concepts such as “virtual” container yard (a computerized information system about the availability and location of empty containers that matches importers and exporters so that containers can be delivered directly from an importer (after unloading) to an exporter without the need for an extra trip back to the Port for storage).” “Chassis pooling” (a program to create a “pool” of truck chassis that all trucking companies can use in order to reduce the amount of miles driven by “bobtail” (tractor only) trucks to pick up an empty chassis) to increase efficiency, or larger-scale projects such as building of a new near-dock intermodal terminal that reduce truck vehicle miles traveled moving between the Port and the off-dock intermodal terminals.
3. Regulatory Compliance – This includes programs that assist with compliance with CARB and BAAQMD regulations. Some key examples include early action retrofit/replacement of port drayage trucks, as well as compliance with CARB’s “shore power” regulation. In the first case, the Port, along with other entities provided $22 million in grants for truck retrofit and replacement to assist truck owners to meet the January 1, 2010 CARB deadline. In the second case, the Port of Oakland also recently (June 2013) completed a Shore Power Program (that allows docked ships to run on electricity thereby reducing emissions from diesel engines that would otherwise be running to provide shore power) to meet CARB emission reduction targets from ships docked.130
Based on the 2012 Inventory131, the Port of Oakland already has achieved a 70 percent reduction in PM2.5, which is only 15 percent away from its 2020 goal. With continued progress and follow-through on MAQIP strategies, the Port should be able to fully achieve its air quality targets by 2020. Table 7.2 below
129 Bay Area Air Quality Management District, Understanding Particulate Matter –
Protecting Public Health in the San Francisco Bay Area, November 2012. 130 http://www.portofoakland.com/maritime/shorePower.aspx. 131 http://www.portofoakland.com/pdf/environment/maqip_emissions_results.pdf.

San Francisco Bay Area Freight Mobility Study
California Department of Transportation 7-9
shows the progress made by the Port in terms of emissions reductions between 2005 and 2012.
Table 7.2 Emission Changes for Port of Oakland, 2005 to 2012
Emission
Ocean-Going
Vessels
Cargo-Handling
Equipment Harbor Craft Locomotives Trucks
Overall Percentage
Change 2005-2012
DPM -72% -63% -30% -77% -88% -70%
CO -1% -49% 14% -81% -67% -33%
NOx 4% -46% -32% -75% -60% -15%
SOx -80% -92% -94% -100% -90% -80%
ROG 50% -33% 11% -83% -74% 1%
Source: http://www.portofoakland.com/pdf/environment/maqip_postcard.pdf.
Address Funding/Financing Needs of IOOs at the Port of Oakland for Engine Conversions to Meet New Regulatory Standards Starting on January 1, 2014, trucks with pre-2007 engines are not permitted to access the Port of Oakland. While various partner agencies were able to make funding available to the IOOs for the first round of engine retrofits associated with CARB’ drayage truck emissions rules, these funds have been exhausted. None of the existing incentive programs being offered by the BAAQMD (including additional funding from the Carl Moyer Program) provide grants for port drayage trucks. It is critical for all regional air quality control agencies, transportation agencies, the Port of Oakland, and other key stakeholders work together to identify other possible sources of financial assistance that can be used to help IOOs make this next round of emission reductions.
Explore Opportunities for Freight Rail Electrification Options for electrifying freight rail infrastructure were reviewed in 2007 as part of the Bay Area Regional Rail Plan. The main area of focus was on the passenger rail system and included assessment of the potential conflict from overhead catenary systems (electrical lines) that power trains. The Caltrain corridor is slated for a gradual electric conversion. Through the Peninsula Corridor Electrification Project, the corridor would shift over to full electric power after 2019. Caltrain trains along with freight trains will share the track along the 51-mile corridor. The improvements on community impacts from electrification include not only lower emissions, but also decreased noise and vibration.
There is currently a question as to whether or not a similar pattern of rail electrification is desirable and feasible for Bay Area freight operations. The economic and logistical hurdles to freight rail electrification are far higher than for passenger trains. The diversity of freight routes greatly complicates the

San Francisco Bay Area Freight Mobility Study
7-10 California Department of Transportation
feasibility of using a catenary system to support freight operations. Tying freight operations to the grid also increases the system’s vulnerability when compared with diesel locomotives that can be easily replaced in the case of mechanical difficulty.132
Due to its more severe air quality attainment status, agencies in the South Coast Air Basin in Southern California have been assessing opportunities to shift all major goods movement modes, including freight rail, to zero local emission technologies, and rail electrification. An assessment of rail electrification options for Southern California, including potential application of dual-use diesel/electric locomotives, was conducted by the Southern California Association of Governments (SCAG). The study133 noted that a number of electrification technologies for freight rail operations are in use in other countries, but also pointed out some of the critical differences in terms of power requirements, operations, and long-haul system continuity that differ between western U.S. freight rail operations and those of other countries. The study concluded that there are still significant technology development needs before electrified freight rail operations could be feasible in Southern California. It is likely that similar conclusions would be reached for the Bay Area. However, the region would benefit from continued technology research and development (R&D) programs at the State and federal levels to more thoroughly assess rail electrification options for the future.
Improve Diesel-Powered Locomotives Improving performance of the diesel powered locomotive fleet is another key strategy. Locomotives can have a service life of up to 50 years. For this reason, older locomotives that predate EPA-mandated emissions controls make up a growing share of total emissions attributable to train operations. By 2025, EPA estimates that 34 percent of the nationwide Class I line-haul fleet will be the more stringent emissions Tier 4 locomotives Nevertheless, switcher locomotives, which operate in proximity to rail yards and thereby impact urban air quality, tend to be older than line-haul locomotives. Switchers produce an analogous problem to drayage trucks in the heavy-duty vehicle fleet, in that they are frequently retired line-haul locomotives that have been converted to service as switchers. One strategy is to encourage rail operators to purchase new locomotives for switching activity rather than relying on retired line-haul locomotives.
132 http://reasonrail.blogspot.com/2012/05/why-freight-will-never-electrify.html. 133 Task 8, Analysis of Freight Rail Electrification in the SCAG Region, SCAG, 2012.

San Francisco Bay Area Freight Mobility Study
California Department of Transportation 7-11
Develop Climate Adaptation Contingencies Much of the Bay Area’s freight infrastructure is located along the San Francisco Bay and is potentially at risk of sea level rise impacts. Bay Area planners should review publications on adaptation strategies, including the recently published document, called Addressing Climate Change Adaptation in Regional Transportation Plans: A Guide for California MPOs and RTPAs.134 Another key source is the 2010 to 2011 Climate Change Resilience Pilot for the Bay Area135, done in partnership with MTC. Caltrans and the Bay Conservation and Development Commission (BCDC), and sponsored by FHWA.
Work with Fleet Operators and Fuel Suppliers to Assist with Implementation of Alternative Fuel Options for Trucking In recent years, there has been renewed interest in the use of low-emission, alternative fuels, such as biodiesel and natural gas (both compressed natural gas (CNG) and liquefied natural gas (LNG)) for trucking. In particular, the new sources of low-cost natural gas in the U.S. have made natural gas a very competitively priced option for trucking fleets. Many of the initial applications have focused on captive fleets that have their own fueling networks at truck terminals. However, for alternative fuels to have broader applicability, networks of public fueling infrastructure would need to be developed throughout the Bay Area. A number of private companies have begun to develop a natural gas fueling infrastructure throughout the U.S. Regional and State agencies could aid this process by helping to assemble the data necessary to conduct fuel market assessments, and provide these data and data on potential site locations while working in collaboration with truck operators and the private fueling station operators.
Proximity to Freight Strategies
Map Impacts of Freight Noise and Vibration While the impacts of air emissions are well documented, the impacts of freight noise and vibration are less commonly assessed. Nevertheless, these impacts are frequently the cause of community resistance and conflict between freight operations and surrounding residents. By assessing the externalities of freight impacts from train and truck noise as well as terminal activities, the Bay Area can better predict potential conflicts and inform the true extent of freight impacts to residents and developers.
134http://www.dot.ca.gov/hq/tpp/offices/orip/climate_change/documents/FR3_CA_
Climate_Change_Adaptation_Guide_2013-02-26_.pdf#zoom=65. 135http://www.fhwa.dot.gov/environment/climate_change/adaptation/ongoing_and_c
urrent_research/vulnerability_assessment_pilots/.

San Francisco Bay Area Freight Mobility Study
7-12 California Department of Transportation
Incorporate Job Access Considerations into the Environmental Justice (EJ)136 Process EJ efforts have typically aimed at ensuring that populations living in proximity to heavy industrial activity are not forced to endure disproportionate, unsafe, or unhealthy levels of pollution, including noise and light pollution when compared with non-EJ communities. Unfortunately, these efforts have sometimes come into conflict with preserving industrial activity and associated freight-related jobs. Job access impacts should be evaluated alongside environmental impacts in the EJ process.
Land Use Strategies
Preserve Industrial Land Industrial land is under threat within the Bay Area where a combination of high land costs and a shifting economic base is leading to conversions of historically industrial land to alternative uses. In addition, the number of acres of industrial land “on the books” is not always reflective of the land that can actually be used for industrial purposes, as some acreage will be environmentally constrained. Several U.S. cities have taken steps to preserve industrial land. The State and region can look to these cases to provide guidance to cities as they update their general plans, for instance such as the cleaning up of brownfields.
136 Environmental Justice is the fair treatment and meaningful involvement of all people
regardless of race, color, national origin, or income with respect to the development, implementation, and enforcement of environmental laws, regulations, and policies.

San Francisco Bay Area Freight Mobility Study
California Department of Transportation 8-1
8.0 Performance Measurement
Beyond recommending and implementing strategies, the public sector should establish a way to measure progress. This makes performance measurement important because it helps to identify needed improvements, monitors effectiveness, and helps to supply relevant data to decision-makers. The use of performance measures for freight transportation has grown significantly in recent years. The implementation of these measures, however, is often stymied in part by the shared public and private sector roles in the freight system, which limits the ability of either side to have full knowledge and understanding of the data available to assess performance. Freight specific performance measures should be accurate, accessible, meaningful, sustainable, and lead to improved decision-making.137
California’s large and diverse freight portfolio poses a unique challenge in identifying measures that represent the State in its totality, yet are specific enough to advance understanding of freight needs. Performance measurement factors are featured strongly in the latest federal surface transportation law, MAP-21. In several states, such as California, freight advisory committees have been assisting state departments of transportation in vetting proposed measures that are appropriate to their state’s freight context and conditions. Through the development of quantifiable measures, the state DOT is required to balance the needs of competing interests and distill common areas of agreement. Regional measures for the Bay Area should be consistent with measures developed at the statewide level, while also addressing unique regional goods movement challenges.
At the federal level, the U.S. Department of Commerce has assembled the Advisory Committee on Supply Chain Competitiveness, and one of the working groups within this advisory committee is looking at performance measures for supply chain competitiveness. The working group has already examined other national systems, such as the Canadian freight fluidity measures; and they have also looked at how the private sector currently measures the performance of its supply chains. Recommended national measures will certainly provide opportunities for implementation of local analogs.
Determining multimodal freight performance measures agreeable to all parties is a daunting task. Some data are cost-prohibitive to obtain and other information could potentially jeopardize competition if revealed by the private sector. In addition, to be equitable in an ideal multimodal world, measures would need varying modal parameters, as well as considering modal interdependence. 137 NCFRP Report 10, Performance Measures for Freight Transportation, TRB, 2011.

San Francisco Bay Area Freight Mobility Study
8-2 California Department of Transportation
Limitations in the availability of data or the viability of collecting data can also undermine otherwise promising measures.
Existing Freight Performance Measurement in California The CFAC was commissioned to advise on the development of State freight performance measures consistent with MAP-21. In November 2013, the Committee reviewed draft performance measures tied to six goals. While the goals have been solidified, the specific measures are still under review. The six goals that were developed as part of this process are described below:
1. Economic Competitiveness – Improve the contribution of the California freight transportation system to economic efficiency, productivity, and competitiveness. The performance measures that are being developed to support this goal track factors on the cost of moving goods.
2. Safety and Security – Improve the safety, security, and resilience of the freight transportation system. These performance measures track the number of crashes, injuries, and fatalities associated with different freight types.
3. Congestion Relief – Reduce costs to users by minimizing congestion on the freight transportation system. Performance measures related to this goal track the extent of congestion and delay on the network. They measure cumulative delay and system reliability.
4. Freight System Infrastructure and Preservation – Improve the state of good repair of the freight transportation system. Performance measures tied to this goal will track the condition of pavement, bridges, rail tracks, and channels.
5. Innovative Technology and Practices – Use innovative technology and practices to operate, maintain, and optimize the efficiency of the freight transportation system while reducing its environmental and community impacts. Performance measures within this category are tied to the implementation of new technologies to improve system performance.
6. Environmental Stewardship – Avoid and reduce adverse environmental and community impacts of the freight transportation system. Performance measures in this category include reductions in criteria pollutants.
Prior Performance Measurement Activities within California Prior to MAP-21, California had developed performance measures138 since 2007 in order to evaluate other aspects of its transportation system. While several of the measures have relevance for freight, they do not specifically address freight. Progress on the measures is documented through a quarterly report, the most
138 http://www.dot.ca.gov/perf/.

San Francisco Bay Area Freight Mobility Study
California Department of Transportation 8-3
recent of which was published in June 2013. Measures within the existing performance report that are helpful for tracking the performance of the freight system include the following:
• PM 1.1 Traveler Safety – Fatalities per 100 Million Vehicle Miles Traveled (MVMT) on the California State highway system – The reason why this measure is helpful for freight is that truck-involved fatalities contribute to total fatalities within the State.
• PM 2.2b – Percent of major incidents cleared in less than 90 minutes – This measure is relevant for freight because freight operations rely on narrow delivery windows. Lengthy incident clearance times make unexpected breakdowns in the reliability of the network, as occur due to traffic incidents, a major impediment to improving freight efficiency.
• PM 2.2a – Travel Time Reliability on selected corridors in California – This is relevant for freight because reliability is, in some ways, more critical to freight operations than speed. When routes provide more reliable service, they enable the planning for and assembly of more precise and sophisticated supply chains.
• PM 4.1a – Pavement Condition – Percent of distressed lane miles – Poor pavement condition is relevant for freight because it can negatively impact truck operating costs, can lead to damage of valuable cargo, and can contribute to accidents.
Potential Freight Performance Measures for Bay Area The identification and validation of a set of performance measures will constitute a key component of the California Freight Mobility Plan (CFMP). While the CFAC has developed performance measures tied to overall freight system goals, the State and all regions within the State, including the Bay Area, may take the approach of developing a performance measurement system that addresses clearly articulated, mutually exclusive goals that reflect the multimodal nature of freight transportation, and the concerns of various freight stakeholders groups. The freight measures should also be aligned vertically, where the approaches used to develop regional level measures should be consistent with that of state-level measures, and the goals should also be consistent.
While goals of the freight performance measurement system can vary among states, an ideal performance measurement system should have goals that belong to the categories of understanding and meeting demand, improving safety, improving system conditions, improving travel mobility and access, and promoting economic development, as well as environmental sustainability. While some of these categories are historically covered by other states, demand measures have rarely been used at the State level. Through collecting and maintaining freight system demand data, foundational demand measures shed light on each part of the multimodal system, its condition of use, and provide critical inputs in policy development.

San Francisco Bay Area Freight Mobility Study
8-4 California Department of Transportation
Finally, freight performance measures can also be categorized by their key constituencies, shippers, carriers, state and local agencies, and the federal government. These are shown as four nested circles in Figure 8.1. While each of these stakeholder groups has their own particular interests, measures that intersect multiple stakeholder groups can be more valuable. For instance, measuring the Travel Time Index on major freeways will not only benefit shippers from a speed and reliability perspective, but also benefit carriers in terms of profitability from saved travel times, as well as addressing mobility and efficiency goals from an agency perspective. An increasingly multimodal outlook by public agencies means that measures that cover all of these stakeholder groups can allow for easier benchmarking among modes; some of which are privately owned and operated.
Figure 8.1 Primary Areas of Concern to Freight Stakeholders
Source: Cambridge Systematics, Inc.
Drawing from recent studies conducted by Cambridge Systematics, including the Oregon Freight System Performance Measures Project, The Vermont Freight Plan, and National Cooperative Freight Research Program (NCFRP) Report 10 on Performance Measures for Freight Transportation, a set of potential freight performance measures that would be applicable to the Bay Area context are suggested in Table 8.1, which follows. These measures are selected from various potential measures to ensure their near-term implementability, evaluated from the dimensions of data availability, ease of reporting, and resource requirements. Finally, only a handful of measures are provided to avoid the issue of lack of focus when too many measures are introduced.

San Francisco Bay Area Freight Mobility Study
California Department of Transportation 8-5
Table 8.1 Recommended List of Short-Term Freight Performance Measures for Bay Area
Category Mode Number Performance
Measure Reason for Inclusion
Data Availability (Easily Available,
Available) Ease of Reporting (Easy, Moderate)
Resource Requirements
(Minimal, Modest, Moderate)
Demand Highway D1 Tons of Freight This is a primary indicator of demand of freight on highways. It is crucial to understanding the level of truck activity.
Available. FAF3 data readily available for download from the FHWA.
Moderate. Staff can perform simple queries using FAF on-line extraction tool.
Modest. Staff can check for annual updates of FAF data on-line and track the data on a spreadsheet.
Air D2 Tonnage of enplaned/deplaned freight cargo
This metric can be used to measure freight activity at all airports that handle freight, including dedicated air freighters and belly cargo.
Easily Available. Federal Aviation Administration (FAA)
Moderate. FAA data is widely available; however, a degree of data interpretation is necessary to isolate freight activities.
Modest. These statistics can be easily updated on a monthly or annual basis.
Rail D3 Rail tons, ton-miles, value
Tons and ton-miles of rail freight is a key indicator of the demand for the ground freight transportation system and can serve as the baseline for additional measure development.
Available. Data available through FAF3, STB Waybill Sample.
Moderate. The extraction tool provided by FAF enables the user to query a variety of tonnage and ton-mile information, including total flows, domestic flows, import flows, and export flows.
Modest. Minimal staff time resources are required check for provisional tonnage and ton-mile data availability, to pull information from the FAF web site and to track it in an excel format.
Marine/Water D4 Tons of Freight Moved at Ports
Measuring tons of freight moved at the region’s port can indicate the demand as well as competitiveness of the regional’s marine and waterway transportation system.
Easily Available. Data available through each port, or the Army Corps of Engineers
Moderate. Staff can obtain and consolidation tonnage data from each port, and directly report the data.
Easy. Staff should be easily able to obtain annual data from each port.
Safety Rail/Highway S1 Annual number/rate of crashes at at-grade crossings
This measure demonstrates a key preventable source of crashes for which countermeasures can be deployed from both the rail and the roadside.
Easily Available. Existing vehicle crashes at rail crossings performance measures are published nationally by Operation Lifesaver.
Easy. The data is publically available.
Minimal. Data is updated annually by Federal Railroad Administration (FRA).

San Francisco Bay Area Freight Mobility Study
8-6 California Department of Transportation
Category Mode Number Performance
Measure Reason for Inclusion
Data Availability (Easily Available,
Available) Ease of Reporting (Easy, Moderate)
Resource Requirements
(Minimal, Modest, Moderate)
Highway S2 Number of truck-involved fatalities and crashes
These are the most basic and useful measures to travel highway safety by trucks.
Available. Combination of Fatality Analysis and Reporting System (FARS) and state/regional surveys.
Easy. The data can be easily calculated.
Minimal. Data is continuously updated through FARS.
Highway S3 Truck-involved crash injury rate
This rate measure provides additional information beyond reporting number of crashes since it is weighted against growth in VMT.
Available. Caltrans Reported Data/FARS.
Moderate. The resources required include staff time for the Crash Analysis and Reporting Unit to calculate the measure.
Modest. Data is continuously updated through FARS; VMT data is updated by Caltrans.
Condition Highway C1 Percent of Pavement in Fair or Better Condition along Key Freight Corridors
Keeping roadway pavements in a state of good repair decreases the risk of damage to trucks and cargo, and helps ensure a high level of service for freight.
Available. Caltrans. Moderate. Current overall pavement condition is a measure tracked by Caltrans; Caltrans needs to determine the portion of these routes that are on key freight corridors.
Modest. This overall pavement condition is already tracked by Caltrans. Additional staff resource will be needed to determine the portion of these on freight corridors by staff annually.
Rail C2 Percent of Track Miles rated at 286,000 pounds or higher
The most profitable rail shipments providing the greatest transportation savings per ton-mile are those that are fully loaded to 286,000 pounds per railcar.
Available. Railroads and FRA.
Moderate. This performance measure involves the relatively straightforward approach of using the railcar capacity rating spreadsheet to calculate the percent of mainline track that is 286,000 compliant, compared to the entire system. Minimal data analysis is necessary to produce reportable statistics.
Modest. This information should be updated annually to reflect the rail lines that were inspected during the year. As FRA-funded inspections collect the required data for this measure, there is no additional cost to the State.

San Francisco Bay Area Freight Mobility Study
California Department of Transportation 8-7
Category Mode Number Performance
Measure Reason for Inclusion
Data Availability (Easily Available,
Available) Ease of Reporting (Easy, Moderate)
Resource Requirements
(Minimal, Modest, Moderate)
Rail C3 Percent of Rail track that is rated FRA Class 2 or higher
Higher track classes and higher authorized speeds are necessary for efficient freight movement on rail that is potentially competitive with trucking. The FRA sets the speed limit for railroads according to track “class.” Line improvements allow an upgrade in class, resulting in higher train speeds, improved efficiency, and greater system capacity.
Available. Data on track class is available from the FRA.
Easy. This performance measure involves the relatively straightforward approach of using the FRA Track Class spreadsheet to calculate the percent of mainline track that is FRA Class 2, compared to the entire mainline system.
Minimal. Minimal data analysis is necessary to produce reportable statistics.
Highway C4 Number of Bridges and Percent that are Categorized as Not Distressed
Keeping bridges along highways in a state of good repair decreases the risk of damage to trucks, as well as cargo, and helps ensure a high level of service for freight.
Available. Caltrans. Moderate. To increase the measure of effectiveness for freight system evaluation, bridges should be tracked specifically for freight significant roadways instead of all bridges.
Minimal. These statistics can be easily updated on an annual basis and tracked historically.
Mobility Highway M1 Travel Time Index on Freight Significant Routes (ratio of peak-period time to free-flow travel time)
Reliability is the key variable for developing complex freight supply chains.
Available. Caltrans/INRIX. INRIX is a global positioning system (GPS) probe vehicle-based traffic data set.
Moderate. Data is available, but costly. Once purchased, minimal staff time will be required to manipulate and interpret the data.
Minimal. Data is updated continuously by INRIX.
Air M2 Percent of on-time departures and arrivals at freight significant airports
This measure serves as an indicator of the mobility and reliability of the air system. As air freight is generally made up of high value, time-sensitive commodities, reliability of the system is an extremely important indicator to industries dependent on these services.
Easily Available. Bureau of Transportation Statistics (BTS).
Easy. A proxy measure of on-time performance of passenger air carriers (who also carry freight) is available from the BTS.
Minimal: Data from the BTS is readily available.

San Francisco Bay Area Freight Mobility Study
8-8 California Department of Transportation
Category Mode Number Performance
Measure Reason for Inclusion
Data Availability (Easily Available,
Available) Ease of Reporting (Easy, Moderate)
Resource Requirements
(Minimal, Modest, Moderate)
Economic Multimodal E1 Multimodal Value of Freight
This is seen as a key input to freight’s role in spurring economic growth. It also partially illustrates the commodity mix.
Easily Available. FAF3 data readily available for download from the FHWA.
Moderate. The extraction tool provided by FAF enables the user to query freight value information for all modes, including total flows, domestic flows, import flows, and export flows.
Minimal. Minimal staff time resources are required to check for provisional freight value data availability, to pull information from the FAF web site and to track it in an Excel format.
Multimodal E2 Percentage of through freight versus locally generated freight
This metric is important for California due to its role as an international gateway for intermodal trade.
Available. FAF3, U.S. Census Foreign Trade Statistics.
Moderate. Calculated through a combination of available data sources.
Moderate. This measure is potentially very useful, but would need to be calibrated to California conditions.
Environmental Multimodal EN1 Metric tons of GHG emissions per ton-mile
This metric evaluates the overall efficiency of the freight system at moving freight without respect to modal categorization.
Available. Motor Vehicle Emission Simulator (MOVES) model/FAF3/Cal/EPA
Moderate. Data is available through the EPA MOVES Model and FAF3; however, it requires some manipulation.
Moderate. The accuracy of the results is limited by model inputs.
Source: Cambridge Systematics, Inc.

San Francisco Bay Area Freight Mobility Study
California Department of Transportation 9-1
9.0 Recommended Future Studies
Much work has been done in the Bay Area to determine the critical roles of goods movement in the regional economy and to understand current and future system performance and needs. The San Francisco Bay Area Freight Mobility Study pulls much of this information together, including existing plans and proposed projects; and provides recommended strategies for advancing regional goals for the goods movement system. Additional work will be needed to refine these strategies and to turn them into actionable projects and policies. Work is currently underway supported by MTC and the Alameda County Transportation Commission (Alameda CTC) to take these next steps in the form of the “Goods Movement Collaborative and Goods Movement Plan Update.”
As part of, or in addition to, these ongoing regional and countywide goods movement planning efforts, this study recommends the following areas for future study.
9.1 DATA AND MODELING CAPABILITIES The San Francisco Bay Area has very limited freight flow data and modeling capability with which to evaluate project impacts and identify future deficiencies in the freight system. While MTC does include a truck element in its regional travel demand model, the truck model was developed several decades ago and has not been updated to take advantage of recent advances in the state of the art in freight modeling. This limits the model’s value as an evaluation tool for project analysis. In addition, there are selected freight issues that would benefit from more focused data sets and tools, such as for the analysis of interregional commodity flows, gateway performance evaluations, and rail at-grade crossing impact analysis. The approach suggested is to improve the data and modeling capabilities of the region in a modular fashion that would allow for incremental improvements as funds become available, while producing capabilities with each module that could be used immediately without waiting for the entire suite of tools and data to be developed. The following recommendations would address these issues.
County-Level Commodity Flow Data and Flows on Major Corridors The analysis of freight flows conducted for the SFBAFMS relied on commodity flow data from the FHWA’s FAF. Using the FAF for regional commodity flow analysis is beneficial because it ensures consistency with national analyses and the data are available at no cost. The current version of FAF, however, does not include county-level data, and this creates certain difficulties for regional analysis.

San Francisco Bay Area Freight Mobility Study
9-2
Ideally, Caltrans and MTC should be able to use the commodity flow data to examine freight flows on major interregional corridors. This type of analysis provides a better understanding of the regional economic implications of freight movements because commodity movements can be tied to the economic sectors that generate the flows. Many freight modeling studies have shown that in major urban areas, this type of data is most useful to examine interregional flows, and not local pickup and delivery activities associated with urban goods movement (these latter flows are generally not well accounted for in regional commodity flow data). Nonetheless, given the significant truck movements on the region’s interregional corridors and the limited interregional connectivity in the Bay Area, interregional analysis is a significant need for the Bay Area and all of Northern California.
One approach to filling this gap in the region’s data would be to develop an approach to disaggregate the FAF data to the county level. There are a number of techniques for doing this, and this approach has been used in other regional studies, including the Central Coast California Commodities Flow Study (2011) and the San Joaquin Valley Interregional Goods Movement Plan (2013). Prior to doing this, additional discussion with FHWA is important because FHWA has announced that it will be releasing its own version of county-level data in FAF Version 4. However, the county-level release is not expected until late 2015, and this may be too late to use the data for the next regional transportation plan update. Aside from disaggregating FAF data, there are also several commercial sources of commodity flow data that could be investigated to fill the data gap.
In addition to obtaining county-level data, the region should develop a simple capability to produce corridor-level flow information using standard travel demand modeling traffic assignment techniques. Producing a simple flow model at the corridor level, consistent with the approach used in the San Joaquin Valley Interregional Truck Model, would be beneficial for the interregional corridor studies recommended later in this report.
Truck Model Update As previously noted, the region’s truck modeling capability is extremely limited, and the techniques and data used in the region’s travel demand model are likely out of date for truck analysis. This limits the ability to forecast gaps and deficiencies in the goods movement system and to evaluate goods movement projects.
Developing a new regional truck model could be a major undertaking with significant data collection required. An incremental approach is recommended focusing on some of the most critical elements of the ultimate model. These elements should be developed in a modular fashion so that the modules can be linked together. Potential modules are presented below:
• Port model – As one of the major truck trip generators in the region and a nationally significant freight facility, a logical starting point for model

San Francisco Bay Area Freight Mobility Study
California Department of Transportation 9-3
development in the Bay Area would be to focus on the Port of Oakland. A model for the Port could look to other ports in North America as a starting point. The Ports of Los Angeles and Long Beach (San Pedro Bay) have one of the most sophisticated truck models and would be an excellent example to build from. The San Pedro Bay ports truck model includes a trip generation spreadsheet model that incorporates terminal-by-terminal information about physical and operational characteristics, including mode split, time-of-day operations characteristics, and other operational features. Truck distribution techniques for this model are evolving to consider truck trips to off-dock intermodal yards and transload facilities independent of other port truck movements. The distribution model is based on terminal gate origination-destination surveys. Other port models that should be investigated include those either recently developed or under development at the Port of Vancouver (British Columbia), the Port of Tacoma, and the Port of Seattle, as these represent a range of different levels of sophistication, data intensiveness, and cost for development. A port model could be used to evaluate a range of different strategies and issues that have significant impacts on surrounding communities, as well as for major inter- and intraregional corridors. It could also be useful for air quality analysis.
• Interregional Corridor Model – As already described, understanding interregional freight flows and the ability to evaluate alternative approaches to achieving greater freight connectivity between the Bay Area and the rest of Northern California is an important freight planning need. The best approach to developing an interregional freight modeling capability would be to base the model on interregional commodity flow data. This would be consistent with the San Joaquin Valley model and would have the benefits previously described. In addition, by focusing on interregional commodity flows, a multimodal model could be developed and this would help in evaluating modal diversion opportunities for new services such as the M-580 marine highway or short-haul rail projects linking the Central Valley with the Port of Oakland.
• Truck trip generation and distribution model update for the regional travel demand model – In order to do general evaluations of major truck route improvements, it would be helpful to have an updated truck model. While there are a variety of fairly complex freight modeling techniques that are being developed that incorporate supply chain logic and truck touring capabilities (such as those developed in Calgary and Chicago), MTC might choose to proceed more incrementally, preserving the basic four-step logic (trip generation, trip distribution, mode choice and trip assignment) in its original truck model. Truck trip generation could be updated with surveys of local businesses, as was recently done by SCAG, or trip generation rates could be borrowed from other metropolitan areas for the most common urban land uses. Trip distribution models could potentially be developed using some of the new techniques developed for the SCAG model, potentially using INRIX (a company that specializes in providing traffic data,

San Francisco Bay Area Freight Mobility Study
9-4
including GPS and probe vehicle data that tracks truck speeds and routes) or other GPS-based data sources to determine truck trip length distribution and origin-destination (O-D) patterns. A major element of this effort would be to collect new truck counts and to do extensive calibration of the model for major truck routes. It would be ideal if this could be done prior to the development of the next regional transportation plan. One complication that is likely to arise if this approach is pursued is how to integrate an older style 4-step model with the more modern activity-based approach that MTC has adopted for the regional travel demand model. There are freight analogs to the activity-based models in use for passenger travel, and these should be investigated before any approach is adopted.
Grade Crossing Delay Model While at-grade crossing delays, emissions, and safety issues are not as significant an issue in the Bay Area as they are in Southern California, there are growing concerns about increasing train volumes on a number of major rail corridors in the region, and crossing issues may increase in importance in the future. The San Pedro Bay ports have developed a spreadsheet model for evaluating vehicle delay, emissions, and accident potential for grade crossing analysis that could be adapted for use in the Bay Area. In order to do this, a simplified approach to forecasting train volumes by line segment would be needed, but could be built from tools developed for the recent 2013 California State Rail Plan. In addition, if the port truck traffic model is developed as suggested above, it will likely need to include a truck-rail mode split component; and this could be integrated into a grade crossing analysis tool, since the most significant growth market for rail in the Bay Area is international intermodal rail. A second data need for building a grade crossing analysis model will be data on roadway vehicle volumes at the crossings. This could potentially be drawn from the regional travel demand model, but may require some local traffic count data collection.
9.2 GLOBAL GATEWAY NEEDS ANALYSIS Several trends were identified related to the region’s global gateways that would benefit from follow-up studies. Since Caltrans recently completed an air cargo access groundside needs study, the focus of new studies would be on the region’s ports.
Transload Study and Port Inland Flows (Imports and Exports) Supply chain and logistics practices of major importers and exporters using the Port of Oakland are shifting. Many of these global logistics trends are documented in the work conducted for the SFBAFMS. Additional work to analyze the implications for traffic flows by different modes would be beneficial to determine what the best strategies are to capture the economic benefits of these changes for the region, and to effectively plan for new traffic patterns.

San Francisco Bay Area Freight Mobility Study
California Department of Transportation 9-5
One of the more significant changes that have been occurring on the container import side of international trade is the trend towards transloading. With changes that are likely to occur at the Port with the construction of the Outer Harbor Intermodal Terminal and development of the Oakland Army Base, it is important to better understand what the demand will be for transload warehousing space, where transloading is occurring and where it can occur in the future, how the Class I railroads are likely to use their new and existing Northern California intermodal terminals to meet future inland point intermodal (IPI) or direct intermodal and transload traffic in the future, and what the implications of these changes are for local economic/real estate development and traffic flow patterns. A study is recommended to examine existing and projected transload patterns and how they will change inland truck and rail flows in the future. The study should also look at what regional land use and transportation strategies should be adopted to ensure that the region maximizes benefits and minimizes negative impacts of these changing patterns.
Small Port Maritime Needs Analysis The Bay Area has many small marine terminals that specialize in particular types of noncontainerized cargo. A number of the bulk commodities for both import and export that these ports specialize in are poised for growth based on the freight flow analysis conducted for the SFBAFMS. It is not clear that the region has a comprehensive strategy for maximizing the benefits that could come from this growth while minimizing negative impacts. A more in-depth analysis of these niche ports is recommended that would focus on potential for growth by commodity, land use impacts based on future expansion needs, and identification of local access needs. As part of this analysis, the impacts of future sea-level rise should also be considered.
9.3 INTERREGIONAL CORRIDOR ANALYSIS One of the most critical freight issues identified in the SFBAFMS is the limited interregional connections for freight movement. A more comprehensive analysis of future growth on the region’s primary interregional corridors, in cooperation with neighboring regions, is recommended to determine potential strategies for addressing growth. These strategies could include development of dedicated truck lanes or more traditional highway capacity improvements, development or improvement of existing corridors to provide for greater alternative routing options, or alternative modes (such as short-haul rail services).
9.4 INDUSTRY SUPPLY CHAIN STUDIES The SFBAFMS introduced the idea of supply chain analysis for specific major industries as a way to understand the relationship between industry growth and freight transportation demand. A follow-up analysis is needed focusing on the

San Francisco Bay Area Freight Mobility Study
9-6
same industries that were studied in the SFBAFMS to get a more in-depth sense of how industry supply chains are changing, what the growth prospects for these industries are in the Bay Area, and how transportation needs are changing.
• Containerized imports of consumer goods – The major issue here is how distribution channels and networks are likely to evolve as importers adopt practices, such as transloading and “4-corner” distribution patterns139, as well as growth in e-commerce as a primary distribution channel. To some extent, the transload study recommended previously would address at least one of the most important logistics trends for this supply chain.
• Petroleum Refining – This should be coupled with an analysis of the range of development options for the Northern Contra Costa Waterfront as there is likely to be interest in development of related chemical product manufacturing and distribution for the older industrial areas along the waterfront. Changing patterns of supply for petroleum were discussed in this study, but a more in-depth look at how changes in the energy, petrochemical, and biopharmaceutical supply chains in the Bay Area are likely to affect transportation patterns in Contra Costa County would be beneficial.
• Precision Instrument Manufacturing and Biomedical Equipment Manufacturing – These are industries that continue to grow in the Bay Area, and most of the commodity flow data and export trade data show these products as being major components of freight flow in the region by value. However, there is little known about how the future manufacturing and distribution patterns of these industries are likely to evolve in the region. In the late 1990s and early 2000s, it appeared that the growth in high-tech, computer-related manufacturing in the Bay Area would continue to place stress on the region’s air cargo capacity. But changes in the computer supply chain have changed this picture dramatically. Given the high-growth forecasts for movement of precision instrumentation and biomedical equipment in the region, it will be important to understand what types of products are likely to be manufactured here and what types of transportation they will need.
The SFBAFMS also provided supply chain analysis of the wine industry and the construction aggregates industry. Both are important to the region in terms of value and/or tonnage of product shipped. However, the most important trends
139 A 4-corner distribution pattern is one where large retailers split their ports of entry for
imported consumer goods among the 4 coastal corners of the U.S. (e.g., Pacific Northwest, Pacific Southwest, Northeast, and Southeast or Gulf). This reduces inland transportation costs to certain markets and creates greater diversity and risk management potential for supply chains.

San Francisco Bay Area Freight Mobility Study
California Department of Transportation 9-7
for these industries have been characterized in this study, and no further analysis is needed at this time.
9.5 URBAN GOODS MOVEMENT TOOLBOX AND GUIDANCE FOR PRIORITY DEVELOPMENT AREAS (PDA) As the Bay Area economy continues to shift away from manufacturing and is increasingly a “knowledge-based” economy, goods movement will increasingly be focused on supplying local knowledge-based businesses and consumers. This urban goods movement activity will occur on local streets and arterials in increasingly dense, mixed-use developments. The approach that the region is taking to PDAs and Complete Streets expresses this vision of the Bay Area’s future urban form. It is important that the region develop approaches that cities can use in various PDA types to accommodate goods movement, as needed. This could include providing guidance in some of the following areas:
• Developing land use guidelines that reduce conflicts between goods movement and other uses.
• Examining truck routes to ensure continuity across jurisdictional lines.
• Developing guidelines for truck routes and potential approaches to create a hierarchy of truck routes when there are other modal users in the same right-of-way. This could include design guidelines for geometrics and other street and intersection characteristics, ensuring access by trucks to goods movement needs, addressing safety needs from interactions between trucks and other modes, and addressing conflicts between freight rail and passenger rail or transit in key goods movement corridors.
• Examining needs for heavy-haul and over-dimensional trucks and hazardous waste transport from both a regional and local perspective and ensuring that routes address safety concerns, pavement maintenance issues, and neighborhood impacts and ensuring continuity of routes across jurisdictions.
• Developing a regional inventory of truck parking and needs at key concentrations of goods movement activity throughout the region and developing strategies to manage truck parking, particularly on local streets around warehouses, manufacturing areas, and other truck-oriented land uses.
9.6 FREIGHT SYSTEM RESILIENCY STUDY The Bay Area is at risk for a number of different types of natural and manmade disasters, including earthquakes, flooding, hazardous materials spills and chemical/petroleum fires, safety incidents as well as impacts from sea level rise;

San Francisco Bay Area Freight Mobility Study
9-8
any of which could close major freight infrastructure for extended periods of time. The region needs to examine the degree to which it would be vulnerable to these types of disruptions, how much redundancy exists in the system to be able continue to provide critical supplies to industry and to support populations, and how long it would take to bring the most critical freight infrastructure back on line. An example of a study to understand the effect of sea level rise was recently done that looked at the effect of sea level rise on the shorelines of San Francisco.140 The study concluded that under various potential sea level rise scenarios, large industrial areas along the Bay would be at risk of flood damage. With a 16-inch sea level rise, approximately 72 percent of SFO and OAK is at risk with potential to disrupt approximately one million metric tons of cargo. In addition, highway segments and rail lines would also be at risk. The report provides a framework for selecting adaptation strategies to address these risks.
9.7 FREIGHT INTELLIGENT TRANSPORTATION SYSTEMS (ITS) AND TECHNOLOGY APPLICATIONS As funding for expanding transportation infrastructure has become more constrained, there has been increasing interest in technologies such as ITS for improving the efficiency of freight operations. A number of technology applications have been suggested throughout this report, including the FRATIS concept around ports and intermodal hubs, Smart Corridors, and virtual container yards at the Port of Oakland. “Connected vehicles” is another area of technology that could be applied to improve freight operations in the Bay Area. Connected vehicles provide links between on-board vehicle information systems and roadside systems to provide drivers with information, such as location of parking, safety problems, and traveler information; and can provide information to traffic managers and dispatchers on emerging traffic problems, regulatory enforcement needs, or input to routing decisions. Connected vehicles can also provide vehicle-to-vehicle communications to allow for autonomous vehicle operations that improve safety or allow for truck “platooning” (which can increase both safety and capacity of a roadway without building new roadway infrastructure).
A comprehensive freight technology plan that incorporates the best applications of the technologies described above to meet regional freight needs would benefit the Bay Area. As part of this assessment, regional stakeholders should also examine the potential impacts and benefits to air quality from improved freight efficiency.
140 Living with Rising Bay: Vulnerability and Adaptation in San Francisco Bay and on its
Shoreline, October 6, 2011, San Francisco Bay Conservation and Development Commission, http://www.bcdc.ca.gov/BPA/LivingWithRisingBay.pdf.

San Francisco Bay Area Freight Mobility Study
California Department of Transportation 9-9
9.8 ADDITIONAL STUDY OF FREIGHT AND THE ENVIRONMENT A substantial amount of work has been done to understand the impacts of freight operations in the Bay Area on air quality, and a number of important regulatory measures and air quality improvement plans are already being implemented. Whatever new studies are conducted should clearly support these ongoing efforts. Nonetheless, several of the strategies recommended in this SFBAFMS would require additional study. The highest priorities for future study are:
• Development of new funding/financing resources for converting drayage trucks to cleaner engines as required by current regulations. This should be a comprehensive look at what funding resource are available or could be developed under current law to assist the IOOs in meeting the latest round of emissions reductions.
• Preparing market and site selection data for alternative fuels infrastructure. This would include gathering data on fleet composition, truck routes and volumes on the routes, different types of trucking fleets by market dimensions, and potential available sites for locating fueling infrastructure. Any study of this type could be conducted in cooperation with fuel suppliers and fleet managers.
• Continued examination of climate change adaptation strategies for vulnerable freight resources. This continued study would need to be integrated with other broader regional studies of transportation system climate change adaptation, such as impacts from sea level rises, and should also be coordinated with any resiliency studies as recommended previously.


San Francisco Bay Area Freight Mobility Study
California Department of Transportation 10-1
10.0 Conclusion
Over the next 25 years, the economy of the Bay Area will continue its transformation in ways that will change the nature of goods movement demand. The region will continue to be a major international trade gateway, primarily through the Port of Oakland and SFO. The Port of Oakland will continue to see relative balance between exports and imports. Success in growing the import business at the Port will require continued improvement in the frequency and reliability of rail services so that the Port can serve a larger hinterland. Potential rail bottlenecks, especially on the Martinez Subdivision where both freight and passenger rail growth is anticipated, will need to be addressed, as will the impacts of delays at at-grade crossings. Development of expanded marine terminal capacity and new transload warehouses, such as are planned for the former Oakland Army Base, can make the Port of Oakland a more attractive import port while capturing the economic benefits of the growth for Bay Area residents.
Expansion of export cargoes, particularly agricultural products from the Central Valley, along with the growth in distribution of imports from inland warehouses, will continue to strain capacity on I-580, the region’s busiest interregional highway corridor. With anticipated growth in domestic interregional commodity flows, along with the growth in export traffic and import distribution, a variety of approaches will be needed to address east-west connectivity on interregional corridors. This may include expansion of existing routes, the use of ITS technologies to more effectively manage existing capacity, and the development of alternative modes, such as short-haul intermodal shuttles and inland barge services.
The region’s airports are expected to experience significant international cargo growth and modest domestic cargo growth. Existing capacity is likely to be sufficient for the foreseeable future although over the long term, finding ways to more effectively address Transbay access to the airports or more evenly balance international cargo services between SFO and OAK could help achieve greater overall efficiency in the region’s air cargo system.
Given the rising incomes of Bay Area residents and regional land use patterns that will continue to emphasize higher density residential and commercial development, the region will need to address potential conflicts in the urban goods movement system and along last-mile connectors. Caltrans and MTC can assist the region’s cities that will be addressing these issues by developing guidelines for incorporating truck management into Complete Streets planning, by developing a comprehensive arterial system management, and by helping with the implementation of Smart Corridor systems.

San Francisco Bay Area Freight Mobility Study
10-2
The Bay Area has made significant progress in addressing air quality and environmental justice issues that have arisen in connection with goods movement activity near neighborhoods. A pressing near-term need is to find ways to continue assisting drayage truck drivers make the transition to lower emission trucks. Other neighborhood issues, such as addressing the lack of truck parking, may also require regional solutions.
While other regions of California have often received greater attention at the state and national levels, the Bay Area is poised to play a leadership role in goods movement planning. Bay Area innovation can help advance goods movement planning with focus on the following issues and opportunities:
• Planning for the export economy, particularly for high value products such as advanced manufacturing, specialty agricultural and food products, and wine and for the growing bulk products market, particularly waste and scrap exports;
• Planning goods movement in a mega-regional economy that emphasizes the strong economic linkages among a number of Northern California regions;
• Planning for farm-to-market goods movement needs that link the Bay Area with other regions in Northern California; and
• Planning for goods movement in a modern urban center that addresses the role of goods movement in Complete Streets, develops approaches to comprehensive arterial system planning, and that applies innovative technology approaches to managing urban truck movements.

San Francisco Bay Area Freight Mobility Study Appendix
California Department of Transportation A-1
A. Appendix
Table A.1 Projects for Bay Area Goods Movement and Functional Needs Identification (in the Order of Mode and Improvement Type)
GG Proj ID
IRC Proj ID
CIRN Proj ID
LMC Proj ID
UGMS Proj ID Source
RTP ID Project Title Project Description County Mode
Improvement Type
Total Cost Escalated
(in Millions)
Total Committed Escalated
(in Millions)
Total Discretionary
Escalated (in Millions)
IRC1 IIIb. Additional Projects found in Alameda CTC’s Northern California Goods Movement Projects List outside Bay Area and sourced to GMAP
N/A I‐205/I‐580 construct auto‐truck separation lane
N/A San Joaquin Highway Auto-truck separation lane
$17 N/A N/A
IRC3 CIRN8 I. Plan Bay Area Projects List (downloaded on Oct 1, 2013)
21116 Widen I-580 for HOV and auxiliary lanes eastbound from Hacienda Road to Greenville Road and westbound from Greenville Road to Foothill Road
Widen I-580 in both directions to add HOV and auxiliary lanes. Original cost was $272 million; reduced by $30 million by taking out WB off-ramp to Dublin/Pleasanton BART element (#230630).
Alameda Highway Aux $226 $226 $ –
CIRN2 I. Plan Bay Area Projects List (downloaded on Oct 1, 2013)
21604 Add northbound and southbound modified auxiliary lanes on U.S. 101 from Oyster Point to San Francisco County line
Adds northbound and southbound modified auxiliary lanes. San Mateo Highway Aux $77 $34 $43
CIRN3 I. Plan Bay Area Projects List (downloaded on Oct 1, 2013)
21608 Construct auxiliary lanes (one in each direction) on U.S. 101 from Marsh Road to Embarcadero Road
Add northbound and southbound auxiliary lanes. San Mateo Highway Aux $132 $132 $ –
CIRN10 I. Plan Bay Area Projects List (downloaded on Oct 1, 2013)
22602 Construct auxiliary lane on I-680 in both directions between Sycamore Valley Road in Danville to Crow Canyon Road in San Ramon
Provide an auxiliary lane on I-680 in both directions between Sycamore Valley Road in Danville and Crow Canyon Road in San Ramon.
Contra Costa Highway Aux $34 $15 $20
CIRN4 I. Plan Bay Area Projects List (downloaded on Oct 1, 2013)
22845 Construct auxiliary lane on southbound U.S. 101 from Ellis Street to eastbound SR 237
Constructs a U.S. 101 southbound (SB) auxiliary lane from Ellis Street interchange to eastbound (EB) Route 237. The project will reduce queue back-up onto SB U.S. 101 mainline during the AM peak period by providing additional storage. The project may also include Traffic Operation Systems (TOS) elements.
Santa Clara Highway Aux $4 $ – $4
CIRN11 I. Plan Bay Area Projects List (downloaded on Oct 1, 2013)
230052 Construct auxiliary lanes on I-880 near Winton Avenue in Hayward
NB and SB 880 between West A and Winton NB 880 between A Street and Paseo Grande.
Alameda Highway Aux $23 $23 $ –
CIRN12 I. Plan Bay Area Projects List (downloaded on Oct 1, 2013)
230054 Construct auxiliary lanes on I-880 between Whipple Road and Industrial Parkway West
Construct Auxiliary Lanes on NB and SB I-880 between Whipple Road and Industrial Parkway West. NB lanes between Industrial Parkway and Alameda Creek. SB lanes between Industrial and Whipple Road
Alameda Highway Aux $10 $10 $ –
CIRN5 I. Plan Bay Area Projects List (downloaded on Oct 1, 2013)
230410 Construct auxiliary lane on southbound U.S. 101 from Great America Parkway to Lawrence Expressway
Aux lane on U.S. 101 from Great America Pkwy to Lawrence Expressway
Santa Clara Highway Aux $3 $ – $3
CIRN13 I. Plan Bay Area Projects List (downloaded on Oct 1, 2013)
230411 Construct auxiliary lane on eastbound SR 237 from Mathilda Avenue to Fair Oaks Avenue
SR 237 Eastbound, build auxiliary lanes between Mathilda Avenue to Fair Oaks Avenue
Santa Clara Highway Aux $7 $ – $7

San Francisco Bay Area Freight Mobility Study Appendix
A-2 California Department of Transportation
GG Proj ID
IRC Proj ID
CIRN Proj ID
LMC Proj ID
UGMS Proj ID Source
RTP ID Project Title Project Description County Mode
Improvement Type
Total Cost Escalated
(in Millions)
Total Committed Escalated
(in Millions)
Total Discretionary
Escalated (in Millions)
IRC2 CIRN1 I. Plan Bay Area Projects List (downloaded on Oct 1, 2013)
230468 Provide auxiliary lanes on I-80 in eastbound and westbound directions from I-680 to Airbase Parkway, add eastbound mixed-flow lane from State Route 12 East to Airbase Parkway, and remove I-80/auto Mall hook ramps and C-D slip ramp
Project provides Auxiliary Lanes on I-80 in the EB & WB directions from I-680 to Airbase Parkway; also includes an EB mixed flow lane from SR 12E to Airbase Pkwy and removes the I-80/Auto Mall hook ramps and C-D road slip-ramp.
Solano Highway Aux $52 $ – $52
CIRN6 I. Plan Bay Area Projects List (downloaded on Oct 1, 2013)
230531 Construct auxiliary lanes on U.S. 101 in Mountain View and Palo Alto, from State Route 85 to Embarcadero Road
Add auxiliary lanes, and extend double HOV lanes, in each direction, along U.S. 101 from north of Route 85 to south of Embarcadero Road in Santa Clara County. This project complements the adjoining project in San Mateo County, adding auxiliary lanes between the Santa Clara/San Mateo County line and Marsh Road.
Santa Clara Highway Aux $106 $106 $ –
IRC4 CIRN9 I. Plan Bay Area Projects List (downloaded on Oct 1, 2013)
240076 Construct auxiliary lanes on I-580 eastbound between Isabel Avenue and North Livermore Avenue, and North Livermore Avenue and First Street (includes widening the Arroyo Las Positas Bridge at two locations and providing additional improvements to accommodate future express lanes)
Construct Eastbound Auxiliary Lanes between Isabel Avenue and North Livermore Avenue and North Livermore Avenue and First Street. The project will also widen the Arroyo Las Positas Bridge at two locations and provide additional improvements to accommodate a future Express Lane facility.
Alameda Highway Aux $41 $41 $ –
CIRN7 I. Plan Bay Area Projects List (downloaded on Oct 1, 2013)
240466 U.S. 101 express lanes between Whipple Avenue and Cochrane Road: convert HOV lane to express lane between Whipple Avenue (in San Mateo County) and Santa Clara County line; convert HOV lane into express lane and construct additional express lane between Santa Clara County line and Cochrane Road (included under VTA Express Lane Network RTPID #240742) Add aux lanes in both northbound and southbound direction on U.S. 101 from Great America Parkway to Lawrence Expressway.
U.S. 101 express lanes between Whipple Avenue and Dunne Avenue: convert HOV lane to express lane between Whipple Avenue (in San Mateo County) and Santa Clara County line; convert HOV lane into express lane and construct additional express lane between Santa Clara County line and Dunne Avenue (included under VTA Express Lane Network RTPID #240742). Add aux lanes in both northbound and southbound direction on U.S. 101 from Great America Parkway to Lawrence Expressway.
Santa Clara Highway Aux $480 $ – $ –
UGMS1 I. Plan Bay Area Projects List (downloaded on Oct 1, 2013)
240498 Widen Brokaw Bridge over Coyote Creek
Widen north side of the bridge to add an additional through traffic lane on westbound Brokaw Road.
Santa Clara Highway Bridge widening $24 $ – $24
UGMS3 II. Additional Projects found in Plan Bay Area Projects List (downloaded on Oct 1, 2013) suggested in Alameda CTC’s Northern California Goods Movement Projects List
230318 Extend North Richmond truck route from Market Avenue to Parr Boulevard, involves two lanes, shoulders on both sides and sidewalk on west side
From Market Avenue to Parr Boulevard, the North Richmond truck route – truck route will extend northward to connect to Parr Boulevard – will be two lanes (12-foot wide each), plus 8-foot shoulders on either side, plus 5-foot sidewalk on the west side for a total 45-foot right-of-way.
Contra Costa Highway Extension $20 $ – $20
UGMS2 IIIa. Additional Projects found in Alameda CTC’s Northern California Goods Movement Projects List in Bay Area and sourced to MTC Plan
N/A Clement Avenue Extension Signalization improvements, ROW acquisition, and new construction, as well as resurfacing of a segment between Broadway and Grand Street. Improves connection between Alameda and nearby industrial area. Also provides a direct connection along the City of Alameda’s northern truck route, which would improve efficiency in movement.
Alameda Highway Extension $6 N/A N/A

San Francisco Bay Area Freight Mobility Study Appendix
California Department of Transportation A-3
GG Proj ID
IRC Proj ID
CIRN Proj ID
LMC Proj ID
UGMS Proj ID Source
RTP ID Project Title Project Description County Mode
Improvement Type
Total Cost Escalated
(in Millions)
Total Committed Escalated
(in Millions)
Total Discretionary
Escalated (in Millions)
CIRN14 I. Plan Bay Area Projects List (downloaded on Oct 1, 2013)
230627 Implement upgrades to SR 12 (Jameson Canyon) between Napa and Solano Counties (includes grade realignment and full safety barrier)
Completion of upgrading of Highway 12 (Jameson Canyon) between Napa and Solano Counties. Grade realignment, full safety barrier.
Bay Area Region/ Multicounty
Highway Grade realignment and safety
$13 $13 $ –
IRC30 CIRN55 I. Plan Bay Area Projects List (downloaded on Oct 1, 2013)
21144 Reconfigure I-80/Gilman Street interchange, involves dual roundabout at interchange and bicycle/pedestrian improvements
The proposed project will reconfigure the I-80/Gilman interchange located in northwest Berkeley, near its boundary with the City of Albany. The reconfiguration is needed to address congestion, operations, and safety issues on the most congested freeway segment in the Bay Area. Capacity constraint and vehicular safety due to the current stop sign controlled ramps are serious issues at this interchange. The project design will also provide adequate pedestrian, bicycle, and public transit movements through the interchange area. The proposed reconfiguration is likely a dual roundabout that has a roundabout on each side of the interchange with a connecting segment.
Alameda Highway Interchange $26 $1 $25
CIRN49 I. Plan Bay Area Projects List (downloaded on Oct 1, 2013)
21205 Improve I-680/State Route 4 interchange (includes connecting northbound I-680 to westbound SR 4, connecting eastbound SR 4 to southbound I-680, and widening SR 4 between Morello and SR 242)
Improves the I-680/SR 4 interchange, which consists of freeway-to-freeway direct connectors for NB I-680 to WB SR 4 movement (Phase 1) and the WB SR 4 to SB I-680 movement (Phase 2), and widening SR 4 between SR 242 and Morello from 2 lanes to 3 lanes per direction (Phase 3). The 2-lane direct connectors will replace a single-lane loop ramp and a single-lane diagonal ramp, respectively. Will eliminate weaving between the I-680 and Pacheco Boulevard ramps by constructing two loop ramps and two direct connection flyover ramps.
Contra Costa Highway Interchange $205 $33 $172
IRC21 CIRN43 I. Plan Bay Area Projects List (downloaded on Oct 1, 2013)
21475 Reconstruct I-580/First Street interchange
Reconstruct and modify Interchange. Alameda Highway Interchange $44 $38 $6
IRC22 CIRN44 I. Plan Bay Area Projects List (downloaded on Oct 1, 2013)
21477 Reconstruct I-580/Greenville Road interchange
Reconstruct and modify Interchange. Alameda Highway Interchange $54 $43 $11
CIRN22 I. Plan Bay Area Projects List (downloaded on Oct 1, 2013)
21602 Reconstruct U.S. 101/Broadway interchange
Reconstructs the U.S. 101/Broadway interchange. San Mateo Highway Interchange $80 $47 $33
CIRN34 LMC7 I. Plan Bay Area Projects List (downloaded on Oct 1, 2013)
21603 Improve U.S. 101/Woodside Road interchange
Modifies the Woodside Road Interchange at U.S. 101. San Mateo Highway Interchange $73 $36 $36
CIRN36 I. Plan Bay Area Projects List (downloaded on Oct 1, 2013)
21606 Reconstruct U.S. 101/Willow Road interchange
Many of the interchanges along U.S. 101 have substandard designs dating back to the 1940s and 1950s and are not designed to handle large volumes of traffic. Most of these older interchanges are cloverleaf. Current design standards favor a diamond design.
San Mateo Highway Interchange $61 $34 $27
CIRN33 I. Plan Bay Area Projects List (downloaded on Oct 1, 2013)
21607 Modify University Avenue overcrossing of U.S. 101 to improve operational efficiency and safety (includes widening of overcrossing, constructing new southbound off-ramp and auxiliary lane, and adding bicycle lanes)
Stage 2 modification will continue the overall operational and safety improvements of this interchange. Stage 2 has been planned over two phases: Phase 2A will include construction of a diagonal southbound off-ramp, widening of University Avenue overcrossing for pedestrians on the north side of the structure and adding approximately 400 meters of auxiliary lane on the southbound. Phase 2B of the project will include widening the over-crossing structure on the south side, as well as the approaches on both sides of the structure to accommodate bike
San Mateo Highway Interchange $3 $3 $ –

San Francisco Bay Area Freight Mobility Study Appendix
A-4 California Department of Transportation
GG Proj ID
IRC Proj ID
CIRN Proj ID
LMC Proj ID
UGMS Proj ID Source
RTP ID Project Title Project Description County Mode
Improvement Type
Total Cost Escalated
(in Millions)
Total Committed Escalated
(in Millions)
Total Discretionary
Escalated (in Millions)
lanes. Stage 2B will be implemented upon securing funding and currently remains unfunded. The City is seeking grants funds to complete Stage 2B. The cost estimate for Stage 2B is $ 0.90 million.
CIRN32 I. Plan Bay Area Projects List (downloaded on Oct 1, 2013)
21722 Improve interchange at U.S. 101 southbound Trimble Road/De La Cruz Boulevard/Central Expressway
Modifies existing loop cloverleaf ramp from SB U.S. 101 to Trimble Rd into a partial cloverleaf ramp (diagonal ramp with signalized intersection). The SB U.S. 101 on-ramp from De La Cruz Boulevard/Central Expressway will be modified to 1 mixed-flow lane, 1 HOV lane with ramp metering equipment. The on-ramp will be modified to improve merging onto SB U.S. 101. The De La Cruz Boulevard bridge across U.S. 101 will be widened from 4 lanes to 6 lanes. The segment between De La Cruz Boulevard/Trimble Road intersections to bridge overcrossing will be widened by an additional lane.
Santa Clara Highway Interchange $43 $19 $24
IRC18 CIRN21 I. Plan Bay Area Projects List (downloaded on Oct 1, 2013)
21785 Widen interchange at U.S. 101/ Blossom Hill Road
Reconfigure interchange at U.S. 101/Blossom Hill Road in San Jose; modifications are on the local roadway system, including widening of Blossom Hill Road over U.S. 101.
Santa Clara Highway Interchange $24 $10 $15
IRC19 CIRN24 I. Plan Bay Area Projects List (downloaded on Oct 1, 2013)
21786 Widen interchange at U.S. 101/Hellyer Avenue
Widening the overcrossing from 2 to 4 lanes and installing traffic signals at each of the two off-ramp intersections. This will entail widening the existing structure. At the intersection with the southbound on and off-ramps, Hellyer Avenue will be widened to include a second eastbound through lane and a separate left-turn pocket. The southbound off-ramp will be widened to provide 2 left-turn lanes. At the intersection of the Northbound off-ramp, Hellyer will be widened from 1 to 2 lanes in the eastbound direction and the westbound left-turn pocket.
Santa Clara Highway Interchange $18 $ – $18
CIRN20 LMC5 I. Plan Bay Area Projects List (downloaded on Oct 1, 2013)
22191 U.S. 101 North Project – Phase B – Airport Boulevard interchange improvements and Airport Boulevard
Modifies existing 2-lane cloverloop interchange with a modern minimum 5-lane interchange with ramp improvements. Includes a collector distributer road between Airport & Fulton, soundwalls, and landscaping. Widens Airport Boulevard to meet the new General Plan requirements of 2 lanes in each direction with a center left-turn lane and right-turn lanes.
Sonoma Highway Interchange $43 $43 $ –
CIRN29 I. Plan Bay Area Projects List (downloaded on Oct 1, 2013)
22195 Improve U.S. 101/Old Redwood Highway interchange (includes modifying/replacing existing 2-lane interchange to at least a 5-lane interchange and improving ramps)
Replaces existing 2-lane cloverloop interchange with a modern 4-lane overpass interchange with ramp improvements.
Sonoma Highway Interchange $43 $43 $ –
CIRN19 LMC4 I. Plan Bay Area Projects List (downloaded on Oct 1, 2013)
22279 Construct new interchange at U.S. 101/Produce Avenue
Constructs a new interchange to replace the Produce Avenue on-/off-ramps from Highway 101. The South Airport Boulevard hook ramps to U.S. 101 at Wondercolor Lane would also be incorporated in the project.
San Mateo Highway Interchange $162 $86 $75
CIRN50 I. Plan Bay Area Projects List (downloaded on Oct 1, 2013)
22350 Improve I-680/SR 4 interchange Phases 4 and 5 (includes connecting southbound I-680 to eastbound SR 4, connecting westbound SR 4 to northbound I-680, and constructing HOV flyover ramps from westbound SR 4 to I-680 southbound from I-680 northbound to eastbound SR 4)
Provides additional improvements to the 3-level interchange constructed in Phases 1, 2, and 3. Phase 4 will connect SB I-680 to EB SR 4. Phase 5 will connect WB SR 4 to NB I-680. Phase 6 will construct HOV flyover ramps from WB SR 4 to I-680 SB and from I-680 NB to EB SR 4.
Contra Costa Highway Interchange $221 $ – $221

San Francisco Bay Area Freight Mobility Study Appendix
California Department of Transportation A-5
GG Proj ID
IRC Proj ID
CIRN Proj ID
LMC Proj ID
UGMS Proj ID Source
RTP ID Project Title Project Description County Mode
Improvement Type
Total Cost Escalated
(in Millions)
Total Committed Escalated
(in Millions)
Total Discretionary
Escalated (in Millions)
IRC29 CIRN54 I. Plan Bay Area Projects List (downloaded on Oct 1, 2013)
22355 Modify I-80/Central Avenue interchange, includes connecting Pierce Street to San Mateo Street and relocating traffic signal to San Mateo/Central Avenue intersection
Construct new signals and changeable message signs to redirect I-80 westbound on-ramp traffic during weekend peak periods to I-580, connect Pierce Street to San Mateo Street to relocate the traffic signal at Pierce Street/Central Avenue to the San Mateo Street/Central Avenue intersection, and construct other necessary improvements.
Contra Costa Highway Interchange $25 $21 $4
IRC31 CIRN56 I. Plan Bay Area Projects List (downloaded on Oct 1, 2013)
22360 Reconstruct I-80/San Pablo Dam Road interchange, includes relocating of westbound El Portal on-ramp to the full interchange northwards, providing access to McBryde Avenue through a new connector road from San Pablo Dam Road interchange, and replacing Riverside Avenue pedestrian overcrossing
Reconstruct interchange to improve traffic operations. Due to their close proximity, project includes relocation of the isolated WB El Portal on-ramp to the full interchange northward, and providing access to McBryde Rd through a frontage road from San Pablo Dam Road I/C instead of existing McBryde WB off-ramp. It also includes replacing the Riverside Avenue Pedestrian overcrossing.
Contra Costa Highway Interchange $114 $30 $84
UGMS13 I. Plan Bay Area Projects List (downloaded on Oct 1, 2013)
22388 Construct on- and off-ramp for SR 242 at Clayton Road
Construct on- and off-ramp for SR 242 at Clayton Road. Contra Costa Highway Interchange $35 $6 $29
CIRN40 I. Plan Bay Area Projects List (downloaded on Oct 1, 2013)
22390 Reconstruct SR 4/Willow Pass Road ramps in Concord
Reconstruct the SR 4/Willow Pass Road ramps in Concord to facilitate smart growth development projects on the Concord Naval Weapons Station.
Contra Costa Highway Interchange $35 $26 $9
CIRN23 I. Plan Bay Area Projects List (downloaded on Oct 1, 2013)
22656 Improve U.S. 101/East Washington Street interchange (includes new northbound on-ramp and improvements to southbound on-ramp)
Expand the interchange as needed for operations improvement (MP 4.72). Add new NB on-ramp; make improvements to the SB on-ramp through widening and correcting curve.
Sonoma Highway Interchange $22 $22 $ –
CIRN26 I. Plan Bay Area Projects List (downloaded on Oct 1, 2013)
22965 Improve interchange at U.S. 101/Mabury Road/Taylor Street
Constructs a new interchange with full access to the U.S. 101 freeway. The project will provide access to U.S. 101 for the heavy local commuter traffic that currently is forced to use the congested Old Oakland Road interchange (north of Mabury Road). The interchange would also act as the primary access to the future Berryessa BART station.
Santa Clara Highway Interchange $63 $27 $35
CIRN35 LMC8 I. Plan Bay Area Projects List (downloaded on Oct 1, 2013)
22979 Improve interchange at U.S. 101/Zanker Road/Skyport Drive/Fourth Street
Constructs a new interchange connecting Zanker Road, an Old Bayshore Highway, with North Fourth Street and Skyport Drive at U.S. 101. The interchange will provide an overcrossing across U.S. 101 to improve limited existing connectivity across U.S. 101 to the North San Jose employment centers. In addition, the interchange would improve access to Mineta International Airport (San Jose) from U.S. 101. The existing intersection at North First Street and Skyport Drive, North Fourth Street and Old Bayshore Highway, northbound U.S. 101 on- and off-ramp, northbound U.S. 101 off-ramp to Brokaw Road will be modified to construct this interchange.
Santa Clara Highway Interchange $113 $49 $64
CIRN37 LMC9 I. Plan Bay Area Projects List (downloaded on Oct 1, 2013)
94075 Construct interchange at intersection of SR 12/SR 29/Airport Road
Constructs an interchange at the intersection of Route 12/29/Airport Road, grade separated in Napa County. Environmental is underway at Caltrans, funded by county RIP.
Napa Highway Interchange $6 $2 $4
CIRN39 I. Plan Bay Area Projects List (downloaded on Oct 1, 2013)
98222 Construct freeway-to-freeway direct connectors between SR 4 Bypass and SR 160
Provides freeway-to-freeway direct connectors from westbound SR 4 Bypass to northbound SR 160, and from southbound SR 160 to eastbound SR 4 Bypass.
Contra Costa Highway Interchange $53 $53 $ –

San Francisco Bay Area Freight Mobility Study Appendix
A-6 California Department of Transportation
GG Proj ID
IRC Proj ID
CIRN Proj ID
LMC Proj ID
UGMS Proj ID Source
RTP ID Project Title Project Description County Mode
Improvement Type
Total Cost Escalated
(in Millions)
Total Committed Escalated
(in Millions)
Total Discretionary
Escalated (in Millions)
CIRN59 I. Plan Bay Area Projects List (downloaded on Oct 1, 2013)
230066 Improve I-880/Marina Boulevard interchange (includes on-and off-ramp improvements, overcrossing modification, and street improvements)
Improvements to the I-880/Marina Boulevard Interchange, including on/off ramp improvements, overcrossing modification, and street improvements.
Alameda Highway Interchange $34 $34 $ –
CIRN48 I. Plan Bay Area Projects List (downloaded on Oct 1, 2013)
230110 Improvement SR 262 Mission Boulevard cross connector, includes widen Mission Boulevard to 3 lanes in each direction throughout I-680 interchange, extend westbound right-turn lane from Warm Springs to Mohave, extend westbound left-turn lanes at Warm Springs, rebuild northbound and southbound I-680 on and off ramps
This project will increase the mobility between I-680 and I-880 by improving the most direct and heavily used east-west cross-connector corridor in Alameda County. This project will widen Mission Boulevard to 3 lanes in each direction throughout the I-680 interchange. It will extend the WB right-turn lane from Warm Springs to Mohave. It will extend both WB left-turn lanes at Warm Springs an additional 130 ft. It will regrade and rebuild the NB and SB I-680 on- and off-ramps. It will install 2 new intersections with street lights and storm drain treatment at the NB and SB I-680 on- and off-ramps. It will relocate existing facilities on WB Mission Boulevard between Warm Springs and Mohave.
Alameda Highway Interchange $20 $ – $20
IRC23 CIRN45 I. Plan Bay Area Projects List (downloaded on Oct 1, 2013)
230132 Improve I-580/Isabel/Route 84 interchange, includes providing 6 lanes over I-580 at Isabel/Route 84 interchange and 4 lanes over I-580 at Portola flyover
Complete ultimate improvements at I-580/Isabel/Route 84 Interchange to provide 6 lanes over 580 at Isabel/84 Interchange and 4 lanes over 580 at Portola flyover.
Alameda Highway Interchange $31 $26 $5
CIRN42 I. Plan Bay Area Projects List (downloaded on Oct 1, 2013)
230203 Construct State Route 4 Bypass interchange at Sand Creek Road
Convert 2-lane expressway to a 4-lane freeway and construct an interchange at Sand Creek Road. With respect to the interchange, SR 4 Bypass will cross over Sand Creek Road with loop for westbound Sand Creek Road to eastbound SR 4 Bypass and diamond ramps on east side and northeast quadrant.
Contra Costa Highway Interchange $35 $35 $ –
CIRN41 I. Plan Bay Area Projects List (downloaded on Oct 1, 2013)
230206 Construct SR 4 Bypass interchange at Balfour Road (Phase 1)
SR 4 Bypass will cross over Balfour Road with a loop for eastbound Balfour Road to westbound SR 4 Bypass, and diamond ramps in all 4 quadrants.
Contra Costa Highway Interchange $46 $46 $ –
UGMS14 I. Plan Bay Area Projects List (downloaded on Oct 1, 2013)
230284 Montague Expressway & McCarthy/O’Toole Interchange Improvements
Construct a square loop grade separation project at Montague Expressway and McCarthy/O’Toole intersection.
Santa Clara Highway Interchange $41 $41 $ –
CIRN60 I. Plan Bay Area Projects List (downloaded on Oct 1, 2013)
230363 Construct interchange at I-880 and Montague Expressway (includes improvements to Montague Expressway)
Construct Par-Clo interchange at I-880 and Montague Expressway, including improvements on Montague.
Santa Clara Highway Interchange $14 $14 $ –
CIRN51 I. Plan Bay Area Projects List (downloaded on Oct 1, 2013)
230370 Improve interchange at I-680/Montague Expressway
Construct Par-Clo Interchange at I-680 and Montague Expressway, including improvements on Montague.
Santa Clara Highway Interchange $27 $ – $27
CIRN25 LMC6 I. Plan Bay Area Projects List (downloaded on Oct 1, 2013)
230417 Modify U.S. 101/Holly Street interchange (includes widening eastbound to northbound loop to 2 lanes and eliminating northbound to westbound loop)
Widen EB to NB loop to 2 lanes and eliminate NB to WB Loop. Provide grade-separated pedestrian and bicycle path.
San Mateo Highway Interchange $19 $19 $-
CIRN28 I. Plan Bay Area Projects List (downloaded on Oct 1, 2013)
230492 Improve interchange at U.S. 101/Old Oakland Road
Interchange improvements at U.S. 101 and Old Oakland Road Possible widening on Old Oakland Road.
Santa Clara Highway Interchange $24 $10 $14
CIRN38 I. Plan Bay Area Projects List (downloaded on Oct 1, 2013)
230532 Improve interchange at State Route 237/North 1st Street
Interchange improvements at SR 237 and N 1st Street. Santa Clara Highway Interchange $2 $2 $ –

San Francisco Bay Area Freight Mobility Study Appendix
California Department of Transportation A-7
GG Proj ID
IRC Proj ID
CIRN Proj ID
LMC Proj ID
UGMS Proj ID Source
RTP ID Project Title Project Description County Mode
Improvement Type
Total Cost Escalated
(in Millions)
Total Committed Escalated
(in Millions)
Total Discretionary
Escalated (in Millions)
CIRN61 I. Plan Bay Area Projects List (downloaded on Oct 1, 2013)
240037 Reconstruct I-880/West Winton Avenue interchange, involves reconfiguring eastbound to southbound on-ramp and new connection to Southland Mall Drive
Reconstructing ramps to create a partial cloverleaf interchange with signalized foot of ramp intersections. Project would reconfigure eastbound to southbound on-ramp and a new connection to Southland Mall Drive opposite the southbound off ramp intersection.
Alameda Highway Interchange $26 $ – $26
CIRN57 I. Plan Bay Area Projects List (downloaded on Oct 1, 2013)
240047 Reconstruct I-880/A Street interchange, includes widening of A Street from 5 lanes to 6 lanes underneath overpass, adding additional freeway lane in each direction, modifying intersection and signal
Reconstruct interchange to accommodate widening of A Street from 5 lanes to 6 lanes underneath the overpass. This will require constructing one additional freeway lane in each direction. This would also involve intersection and signal modifications.
Alameda Highway Interchange $64 $ – $64
CIRN62 I. Plan Bay Area Projects List (downloaded on Oct 1, 2013)
240052 Improve I-880/Whipple Road interchange, includes northbound off-ramp, surface street improvements and realignment between Union City and Hayward city limits
Full interchange improvements at Whipple Road/I-880, including northbound off-ramp, surface street improvements, and realignment (Union City and Hayward city limits).
Alameda Highway Interchange $62 $ – $62
CIRN31 I. Plan Bay Area Projects List (downloaded on Oct 1, 2013)
240160 Construct southbound on- and off-ramps to U.S. 101 at Peninsula Avenue to add on- and off-ramps from southbound U.S. 101
Construct southbound on and off ramps to U.S. 101 at Peninsula Avenue to add on and off ramps from southbound U.S. 101.
San Mateo Highway Interchange $6 $3 $3
IRC26 I. Plan Bay Area Projects List (downloaded on Oct 1, 2013)
240210 Implement I-505/Vaca Valley Parkway interchange improvements (includes widening southbound off-ramp at Vaca Valley Parkway, widening Vaca Valley Parkway to provide protected left-turn pockets, and signalization of the southbound ramp intersection)
Widen the southbound off-ramp at Vaca Valley Parkway, widen Vaca Valley Parkway to provide protected left-turn pockets, and signalize the southbound ramp intersection.
Solano Highway Interchange $2 $2 $ –
IRC28 CIRN53 I. Plan Bay Area Projects List (downloaded on Oct 1, 2013)
240318 Reconstruct the Ashby Avenue interchange on I-80
I-80 at Ashby Avenue – Reconstruct the Ashby Avenue Interchange. The proposed interchange elements include construction of a new bridge to replace the two existing bridges and construction of two roundabouts.
Alameda Highway Interchange $54 $1 $53
CIRN30 I. Plan Bay Area Projects List (downloaded on Oct 1, 2013)
240441 Improve interchange at U.S. 101/Oregon Expressway/Embarcadero Road
Improvements to U.S. 101/Oregon Expressway/Embarcadero Road Improvements.
Santa Clara Highway Interchange $128 $ – $128
CIRN27 I. Plan Bay Area Projects List (downloaded on Oct 1, 2013)
240554 Improve interchanges at SR 237/Mathilda Avenue and U.S. 101/Mathilda Avenue
Modifications to both the U.S. 101/ Mathilda and SR 237/Mathilda interchanges. It would reduce one signalized intersection and increase intersection spacing in the Mathilda Avenue/SR 237 Interchange Area.
Santa Clara Highway Interchange $18 $ – $18
IRC24 CIRN46 II. Additional projects found in Plan Bay Area Projects List (downloaded on Oct 1, 2013); suggested in Alameda CTC’s Northern California Goods Movement Projects List
21489 Improve I-580/San Ramon Road/Foothill Road interchange, includes eliminating eastbound diagonal off-ramp and eastbound loop off-ramp and constructing new signalized intersection at off-ramp
I-580/San Ramon Road/Foothill Road interchange improvements. Elimination of eastbound diagonal off-ramp and eastbound loop off-ramp. Construction of new signalized intersection for off ramp vehicles.
Alameda Highway Interchange $4 $3 $1

San Francisco Bay Area Freight Mobility Study Appendix
A-8 California Department of Transportation
GG Proj ID
IRC Proj ID
CIRN Proj ID
LMC Proj ID
UGMS Proj ID Source
RTP ID Project Title Project Description County Mode
Improvement Type
Total Cost Escalated
(in Millions)
Total Committed Escalated
(in Millions)
Total Discretionary
Escalated (in Millions)
IRC27 CIRN52 II. Additional projects found in Plan Bay Area Projects List (downloaded on Oct 1, 2013); suggested in Alameda CTC’s Northern California Goods Movement Projects List
22632 Widen American Canyon Road overpass at I-80
Vallejo: American Canyon Road overpass at I-80; capacity and safety improvements, realign overpass.
Solano Highway Interchange $12 $12 $ –
IRC34 CIRN64 II. Additional projects found in Plan Bay Area Projects List (downloaded on Oct 1, 2013)l; suggested in Alameda CTC’s Northern California Goods Movement Projects List
240015 Construct a new interchange at SR 92/Whitesell Street and extend Whitesell Street to Clawiter Road (includes new on-ramp from southbound Clawiter Road to SR 92 westbound on a bridge over the SR 92 westbound off-ramp to Whitesell Street)
Construct a new diamond interchange at SR 92 and Whitesell Street, which would be extended to the south of the freeway to form a T intersection with Clawiter Road. The project would provide a new on-ramp from southbound Clawiter Road to SR 92 westbound on a bridge over the SR 92 westbound off-ramp to Whitesell Street.
Alameda Highway Interchange $78 $78 $ –
CIRN58 II. Additional projects found in Plan Bay Area Projects List (downloaded on Oct 1, 2013); suggested in Alameda CTC’s Northern California Goods Movement Projects List
240025 Reconstruct interchange at I-880/Industrial Parkway to provide a northbound off-ramp and a southbound HOV bypass lane on the southbound loop off-ramp (includes reconstruction of bridge over I-880)
Reconstruct Interchange to provide a northbound off-ramp and a southbound HOV bypass lane on the southbound loop off-ramp. Reconstruct bridge over I-880.
Alameda Highway Interchange $65 $65 $ –
IRC33 CIRN63 II. Additional projects found in Plan Bay Area Projects List (downloaded on Oct 1, 2013); suggested in Alameda CTC’s Northern California Goods Movement Projects List
240562 Upgrade Clawiter Road/SR 92 interchange (includes new ramps and an overcrossing for the Whitesell Street extension and ramp intersection signalization)
Upgrades to the existing Clawiter Road interchange with SR 92, add ramps and an overcrossing for the Whitesell Street extension and would signalize ramp intersections.
Alameda Highway Interchange $55 $55 $ –
IRC25 CIRN47 IIIa. Additional projects found in Alameda CTC’s Northern California Goods Movement Projects List in Bay Area and sourced to Alameda CWTP, but not found in Plan Bay Area Projects List
240144 I-580/Santa Rita Rd interchange improvements
This project will reconstruct the southbound approach of Santa Rita at Pimlico/I-580 eastbound off-ramp to add a second southbound left-turn lane. This reconstruction will include alteration to the southbound loop ramp
Alameda Highway Interchange $3 $1 $2
IRC20 IIIb. Additional projects found in Alameda CTC’s Northern California Goods Movement Projects List outside Bay Area and sourced to TCIF Tier 2
N/A I-5/I\‐580/SR 32/Bird Interchange Construction of new interchange on SR 132 and widening of SR 132 between I-5/I-580. Would help serve aggregate businesses in the area. Match may come from private sector, but is not committed.
San Joaquin Highway Interchange $41 N/A N/A
IRC32 IIIb. Additional projects found in Alameda CTC’s Northern California Goods Movement Projects List outside Bay Area and sourced to GMAP
N/A I‐80 Soda Springs Interchange to Truckee Agriculture Inspection Station, rehabilitate roadway
N/A Nevada Highway Interchange $120 N/A N/A

San Francisco Bay Area Freight Mobility Study Appendix
California Department of Transportation A-9
GG Proj ID
IRC Proj ID
CIRN Proj ID
LMC Proj ID
UGMS Proj ID Source
RTP ID Project Title Project Description County Mode
Improvement Type
Total Cost Escalated
(in Millions)
Total Committed Escalated
(in Millions)
Total Discretionary
Escalated (in Millions)
IRC35 IIIb. Additional projects found in Alameda CTC’s Northern California Goods Movement Projects List outside Bay Area and sourced to GMAP
N/A I-5/I-80 Reconstruct ramp eastbound to northbound
N/A Sacramento Highway Interchange $13 N/A N/A
IRC36 IIIb. Additional projects found in Alameda CTC’s Northern California Goods Movement Projects List outside Bay Area and sourced to GMAP
N/A I‐5/I‐80 Revise Interchange N/A Sacramento Highway Interchange $35 N/A N/A
CIRN70 I. Plan Bay Area Projects List (downloaded on Oct 1, 2013)
22769 Improve northbound I-880 interchange at 23rd and 29th Avenue, involves improving on- and off-ramp geometrics, modifying local streets, and landscaping/soundwalls
Provides for the improvements to northbound I-880 at 23rd and 29th Avenue Interchange by improving the freeway on- and off-ramp geometrics. The project will also replace the structures of these overcrossings. The project also includes modifications of local streets, landscape enhancement, and construction of a soundwall.
Alameda Highway Interchange $109 $105 $4
IRC40 CIRN69 IIIa. Additional projects found in Alameda CTC’s Northern California Goods Movement Projects List in Bay Area and sourced to Alameda CWTP, but not found in Plan Bay Area Projects List
230086 Noncapacity Increasing Freeway/Expressway Interchange Modifications (I-580/Fallon and I-580/Hacienda)
I-580/Fallon Road I/C Improvements (Phase 2): Reconstruction of overcrossing to provide 4 lanes in each direction; reconstruction of the southbound to eastbound loop on‐ramp; widening of the eastbound off‐ramp to provide 2 exit lanes with two left-turn and two right-turn lanes; widening of the eastbound on‐ramp; widening of the westbound off‐ramp to provide two left-turn and two right-turn lanes; widening the westbound on‐ramp. I‐580/Hacienda Drive I/C Improvements: Reconstruction of overcrossing to provide additional northbound lane; widening of the eastbound off‐ramp to include a third left‐turn lane; modifying the westbound loop on‐ramp; and widening the westbound off‐ramp to include a third left‐turn lane.
Alameda Highway Interchange $39 $22 $17
IRC38 CIRN67 I. Plan Bay Area Projects List (downloaded on Oct 1, 2013)
21100 Modify I-580/Vasco Road interchange, includes widening I-580 overcrossing to provide 8 lanes and bike lanes/shoulders, constructing auxiliary lanes on I-580 between Vasco and First Street, widening Vasco Road to 8 lanes between Northfront Road and Las Positas Road
Modify I-580/Vasco Road Interchange. Widen I-580 overcrossing to provide 8 traffic lanes and bike lanes/shoulders. Construct auxiliary lanes on I-580 between Vasco and First Street. Add new loop ramp in southwest quadrant. Includes widening Vasco Road to 8 lanes between Northfront Road and Las Positas Road, and other local roadway improvements.
Alameda Highway Interchange with aux
$64 $55 $9
CIRN65 I. Plan Bay Area Projects List (downloaded on Oct 1, 2013)
240062 Construct improvements for the SR 84/I-680 interchange, widen SR 84 from Pigeon Pass to I-680, and construct auxiliary lanes on I-680 between Andrade and SR 84
Construct interchange improvements for the SR 84/I-680 Interchange, widen SR 84 from Pigeon Pass to I-680 and construct auxiliary lanes on I-680 between Andrade and SR 84.
Alameda Highway Interchange with aux
$277 $ – $277
IRC37 IIIa. Additional projects found in Alameda CTC’s Northern California Goods Movement Projects List in Bay Area and sourced to MTC Plan
N/A I-505 Weave Correction Realign the southbound connector from I-505 to westbound I-80, install an auxiliary lane between the southbound I-505 on-ramp and the East Monte Vista off‐ramp, and close the short gap in the fourth westbound lane of I‐80 just east of I‐505.
Solano Highway Interchange with aux, safety
$9 N/A N/A

San Francisco Bay Area Freight Mobility Study Appendix
A-10 California Department of Transportation
GG Proj ID
IRC Proj ID
CIRN Proj ID
LMC Proj ID
UGMS Proj ID Source
RTP ID Project Title Project Description County Mode
Improvement Type
Total Cost Escalated
(in Millions)
Total Committed Escalated
(in Millions)
Total Discretionary
Escalated (in Millions)
CIRN66 LMC10 I. Plan Bay Area Projects List (downloaded on Oct 1, 2013)
22100 Replace overcrossing structure at I-880/Davis Street interchange and add additional travel lanes on Davis Street (includes ramp, intersection, and signal improvements)
Replaces the existing overcrossing structure with a new structure, providing higher clearance for I-880 traffic and additional travel lanes on Davis Street to improve capacity and safety, along with ramp, intersection, and signal improvements.
Alameda Highway Interchange with vertical clearance
$11 $11 $ –
CIRN71 I. Plan Bay Area Projects List (downloaded on Oct 1, 2013)
22990 Widen SR 262 from I-880 to Warm Springs Boulevard (includes reconstructing SR 262/I-880 and SR 262/Kato Road interchanges) and reconstruct Union Pacific Railroad underpasses
Serves as Phase 1B of the overall project in Santa Clara and Alameda Counties on I-880 from SR 237 to Fremont Boulevard and in Alameda County on SR 262 from I-880 to Warm Springs Boulevard. The overall project will reconstruct the SR 262(Mission Boulevard)/Warren Avenue/I-880 Interchange and widen I-880. This Phase 1B will complete the widening on SR 262 and reconstruct two UPRR underpasses.
Alameda Highway Interchange, highway-rail grade
separation
$62 $62 $ –
IRC39 CIRN68 I. Plan Bay Area Projects List (downloaded on Oct 1, 2013)
230326 Improve I-80/I-680/SR 12 Interchange (Phase 1), includes widen I-80 and I-680 and improve direct freeway-to-freeway connections
General. This alternative would improve widen I-80 and I-680, as well as improve the connections from westbound I-80 to I-680 and SR 12 (West); directly connect northbound I-680 and SR 12 (West); directly connect northbound I-680 to westbound SR 12 (West) and westbound I-80; directly connect eastbound I-80 to southbound I-680; connect the I-80/Red Top Road interchange with Business Center Drive; and construct or improve interchanges at SR 12 (West)/Red Top Road, I-80/Red Top Road, I-80/Green Valley Road, and I-680//Red Top Road. A third eastbound lane would be added to SR 12 (East) from the Chadbourne Road on-ramp to the Webster Street off-ramp. Western Segment – Mainline Improvements. Westbound I-80 would have 6 lanes, including an HOV lane and an auxiliary lane matching the existing cross section at the existing Suisun Valley Road overcrossing. Immediately to the west of the Suisun Valley Road overcrossing, a seventh lane would be added and an eighth lane added with the on ramp from Suisun Valley Road. A ninth lane would be added immediately west of the Green Valley Road off-ramp. The four right lanes would exit from I-80 to connect to SR 12 (West) and I-680. There would be a left exit from the HOV lane to an HOV connector to I-680. A wider, single-span bridge would replace the existing bridge over Green Valley Creek. The existing loop on-ramp from northbound I-680 to westbound I-80 would be removed. The connector from northbound I-680 to SR 12 (West) would be constructed to replace this movement. The portion of I-680 north of Red Top Road would be realigned. Western Segment – Freeway-to-Freeway Interchange Improvements. New connector ramps from westbound I-80 to westbound SR 12 (West) and southbound I-680 would be constructed. The westbound I-80 to southbound I-680 connector would cross over I-80, the eastbound SR 12 (West) connector to eastbound I-80, the UPRR tracks, Fulton Drive, and the realigned Lopes Road. Access from westbound I-80 to westbound SR 12 (West) would be braided with (cross over), the Green Valley Road on-ramp to westbound I-80. A separate direct connector structure would be built to carry the HOVs in both directions between I-680 and I-80 east of the I-80/I-680/SR 12 interchange. A new direct connector from northbound I-680 to westbound SR 12 (West) and westbound I-80 would be constructed. A new direct connector from eastbound I-80 to southbound I-680 would be constructed. The connection from eastbound I-80 to southbound I-680 would be removed.
Solano Highway Interchange, widening
$578 $347 $231

San Francisco Bay Area Freight Mobility Study Appendix
California Department of Transportation A-11
GG Proj ID
IRC Proj ID
CIRN Proj ID
LMC Proj ID
UGMS Proj ID Source
RTP ID Project Title Project Description County Mode
Improvement Type
Total Cost Escalated
(in Millions)
Total Committed Escalated
(in Millions)
Total Discretionary
Escalated (in Millions)
Western Segment – Local Interchange Improvements. The Green Valley Road overcrossing at I-80 would be replaced to accommodate the realignment and widening of I-80 east of the existing overcrossing and to connect to the former location of I-680 south of I-80. The overcrossing would consist of the westerly 4 lanes of the ultimate 7-lane structure. The Green Valley Road/I-80 interchange would have a tight diamond configuration westbound and a partial cloverleaf (loop on-ramp) configuration in the eastbound direction. The same interchange and overcrossing would provide access to the existing alignment of I-680 (which will be relinquished as a local arterial, consistent with the Ultimate Alternative C). A new on-ramp at Green Valley Road would provide access to the new westbound I-80 alignment. A new westbound on-ramp would be added at the existing Suisun Valley Road interchange, along with the removal of Neitzel Road. An interchange would be built on SR 12 (West) with a realigned Red Top Road and an extension of Business Center Drive. The I-80/Red Top Road interchange would be partially reconstructed to have a westbound exit loop to Red Top Road and SR 12 (West). The I-680/Red Top Road interchange would be constructed. Western Segment – Local Road Improvements. A new road would be constructed to connect the I-80/Red Top Road interchange with Business Center Drive. Between I-80 and SR 12 (West), Red Top Road would be realigned to cross over the UPRR and SR 12 (West) approximately 0.2.
UGMS16 I. Plan Bay Area Projects List (downloaded on Oct 1, 2013)
21473 Construct a 4-lane arterial connecting Dublin Boulevard and North Canyons Parkway
Construct a 4-lane arterial connection between the future easterly end of Dublin Boulevard in the City of Dublin and the westerly end of North Canyons Parkway in the City of Livermore. This project, along with planned improvements within the City of Dublin, would complete the freeway reliever route along the north side of I-580 between I-680 and Route 84 (Isabel Avenue). A 2-lane connection could be constructed as an initial phase.
Alameda Highway New alignment $12 $12 $ –
IRC42 CIRN73 I. Plan Bay Area Projects List (downloaded on Oct 1, 2013)
22400 Conduct environmental and design studies to create a new alignment for SR 239 and develop corridor improvements from Brentwood to Tracy – project development
Environmental and design study to construct a new State Route connecting SR 4 to I-205/I-580 near Tracy. Route alignment is not yet defined.
Contra Costa Highway New alignment $30 $14 $16
CIRN74 I. Plan Bay Area Projects List (downloaded on Oct 1, 2013)
94506 Construct an east-west connector between I-880 and SR 238/Mission Boulevard (includes improvements to roadways and intersections along Decoto Road, Fremont Boulevard, Paseo Padre Parkway, Alvarado-Niles Road, and SR 238 (Mission Boulevard)
Construct an improved east-west connection between I-880 and SR 238 (Mission Boulevard) comprised of a combination of new roadways along preserved rights-of-way and improvements to existing roadways and intersections along Decoto Road, Fremont Boulevard, Paseo Padre Parkway, Alvarado-Niles Road, and SR 238 (Mission Boulevard).
Alameda Highway New alignment $196 $110 $86
UGMS17 I. Plan Bay Area Projects List (downloaded on Oct 1, 2013)
230157 Construct a 2-lane gap closure on Las Positas Road from Arroyo Vista to west of Vasco Road
In Livermore: On Las Positas Road from Arroyo Vista to 1,500 feet west of Vasco Road; construct 2-lane gap closure.
Alameda Highway New alignment $4 $4 $ –

San Francisco Bay Area Freight Mobility Study Appendix
A-12 California Department of Transportation
GG Proj ID
IRC Proj ID
CIRN Proj ID
LMC Proj ID
UGMS Proj ID Source
RTP ID Project Title Project Description County Mode
Improvement Type
Total Cost Escalated
(in Millions)
Total Committed Escalated
(in Millions)
Total Discretionary
Escalated (in Millions)
IRC41 CIRN72 I. Plan Bay Area Projects List (downloaded on Oct 1, 2013)
230294 Widen and create new alignment for SR 152 (from SR 156 to U.S. 101)
SR 152 (U.S. 101 at Monterey Street to Santa Clara County Line on SR 152), including U.S. 101 widening from Monterey Street to the SR 25/U.S. 101 Interchange; new interchange at SR 25/U.S. 101; and new SR 152 alignment: U.S. 101 to SR 156; SR 152 improvements include roadway and access control improvements between SR 156 and the (Santa Clara) county line, new eastbound truck climbing lanes over Pacheco Pass, and possible toll facilities.
Santa Clara Highway New alignment $917 $917 $ –
CIRN75 I. Plan Bay Area Projects List (downloaded on Oct 1, 2013)
98154 Implement U.S. 101 Marin Sonoma Narrows Phase 1 (Marin County), including extension of the U.S. 101 HOV lane in Marin County, construction of Redwood Landfill Interchange, and realignment of San Antonio Creek
Extends the U.S. 101 HOV lane in Marin County from SR 37 to Atherton Avenue in the northbound direction and to Rowland Boulevard in southbound direction. Construct Redwood Landfill Interchange with frontage roads and Class 1 bike path. Realign mainline at San Antonio Creek to avoid flooding and provide standard sight distance. The project would result in 1 HOV and 2 general purpose lanes in each direction. The HOV lanes would connect to HOV lanes extending from Novato to Richardson Bay Bridge. This project will close most of the direct access points to U.S. 101, and will provide access through frontage roads and Interchanges.
Marin Highway New interchange $222 $222 $ –
UGMS19 I. Plan Bay Area Projects List (downloaded on Oct 1, 2013)
230269 Construct a new interchange at Trimble Road and Montague Expressway
To construct a new flyover ramp at Trimble and Montague Expressway.
Santa Clara Highway New interchange $37 $37 $ –
UGMS18 I. Plan Bay Area Projects List (downloaded on Oct 1, 2013)
230356 Construct interchange at Lawrence Expressway and Arques Avenue
Construct interchange at intersection of Lawrence Expressway and Arques Avenue with square loops on Kern and Titan.
Santa Clara Highway New interchange $52 $52 $ –
CIRN76 I. Plan Bay Area Projects List (downloaded on Oct 1, 2013)
240671 Improve interchange at I-280/Senter Road
Extend Senter Rd and construct new on/off ramps and modify existing on-/off-ramps into a collector/distributor ramp system.
Santa Clara Highway New interchange $52 $ – $52
CIRN77 I. Plan Bay Area Projects List (downloaded on Oct 1, 2013)
240436 Improve southbound U.S. 101 between San Antonio Road to Carleston Road/Rengstorff Avenue
Southbound improvements on U.S. 101 from San Antonio Road to Charleston Road/Rengstorff Avenue.
Santa Clara Highway Not specified $51 $ – $51
CIRN78 I. Plan Bay Area Projects List (downloaded on Oct 1, 2013)
98207 Construct Bus Rapid Transit (BRT) facility from Alameda Naval Station to 12th Street BART station, improve freeway weaving at I-880/I-980 interchange, construct new on-ramp at Market Street/6th Street and off-ramp at Martin Luther King Way/5th Street, improve operations at Posey and Webster Tubes, construct park-and-ride on Mariner Square Drive near Posey Tube entrance, add Intelligent Transportation Systems (ITS) elements on Webster Street, Ralph Appezatto Memorial Parkway, 6th Street, 5th Street, Broadway, Harrison Street, and 7th Street (Phase 1)
The City of Alameda, City of Oakland, Bay Area Rapid Transit (BART), Alameda County Transportation Commission, Caltrans, and AC Transit have been coordinating on implementing a multimodal project in the Cities of Alameda and Oakland. This project will address the access needs associated with 22,000 new homes through the Sustainable Communities Strategy’s Initial Vision Scenario in PDAs in Downtown Oakland and Jack London Square; and redevelopment of the former Naval Air Station and along the Northern Water Front in Alameda and provide the freeway access eliminated after the Loma Prieta earthquake. The key features of the project and associated benefits include: 1) offers transit access (BRT) between the cities and the PDAs by constructing a BRT facility from Alameda Naval Station PDA to 12th Street BART station with a goal to provide 15-minute headways. This transit system will link various other transit enhancements like International Boulevard BRT and transit systems supporting Lake Merritt BART Station PDA, Oak to Ninth project, and other in-fill developments in Alameda and Oakland. A recent analysis shows that approximately 5,600 daily riders just from Alameda could be served by the BRT system. 2 reduces freeway weaving at I-880/I-980 interchange, enhances pedestrian access in
Alameda Highway Operations & safety
$83 $8 $75

San Francisco Bay Area Freight Mobility Study Appendix
California Department of Transportation A-13
GG Proj ID
IRC Proj ID
CIRN Proj ID
LMC Proj ID
UGMS Proj ID Source
RTP ID Project Title Project Description County Mode
Improvement Type
Total Cost Escalated
(in Millions)
Total Committed Escalated
(in Millions)
Total Discretionary
Escalated (in Millions)
Oakland near Chinatown Senior Center. Traffic analysis shows that without the project, stacking length for the 95th percentile queue at the 7th Street and Harrison Street intersection, adjacent to the Chinatown Senior Citizen Center, will be 786 feet in 2030. With the project, the number of vehicles will be reduced by almost 50%, to a stacking length of 439 feet. 3) Provides multimodal access and enhances goods movement on I-880 and into Oakland and Alameda by providing new on-ramp at Market Street at 6th Street and an off-ramp at Martin Luther King Way and 5th Street. 4) Reduces operational deficiencies for all vehicle movement between the Cities of Alameda and Oakland through the Posey and Webster Tubes and in downtown Oakland. 5) Develops bike and pedestrian improvements to enhance connectivity between Chinatown and Jack London Square. 6) Provides a Park-and-Ride Facility along Mariner Square Drive in Alameda near the Posey Tube entrance. This element will add a transit center near the Posey Tube, and will reduce automobile trips through the Tube by encouraging motorists to leave the car and use transit. 7) Incorporates ITS along the freeway and on major arterials, including Webster Street and Ralph Appezatto Memorial Parkway in Alameda; and 6th Street, 5th Street, Broadway, Harrison Street, and 7th Street in Oakland. The ITS elements will provide traveler information, quicker response to emergencies, and reduce delays by better managing the nonrecurring congestion due to incidents. 8) Implements sustainability principles in design, construction, and operation of the project to minimize environmental impacts.
CIRN82 I. Plan Bay Area Projects List (downloaded on Oct 1, 2013)
22282 Improve operations at U.S. 101 near SR 92
U.S. 101 operational improvements near SR 92. Project may have phased construction.
San Mateo Highway Operations/ITS $221 $30 $192
IRC54 CIRN79 I. Plan Bay Area Projects List (downloaded on Oct 1, 2013)
230221 Implement I-80 Integrated Corridor Mobility (ICM) project operations and management
This project will implement Adaptive Ramp Metering (ARM), and Active Traffic Management (ATM) strategies will be employed to reduce congestion and provide incident management capabilities.
Bay Area Region/Multicounty
Highway Operations/ITS $70 $70 $ –
IRC55 CIRN80 I. Plan Bay Area Projects List (downloaded on Oct 1, 2013)
230597 Implement I-80 Integrated Corridor Mobility Project (includes the installation/upgrade of corridor management elements along the I-80 corridor (Phase 1) and along parallel and connecting arterials (Phase 2) to allow sharing of real-time traveler information among public agencies and the public)
The project limits are along the I-80 corridor from the Carquinez Bridge (Contra Costa County) to the San Francisco Bay Bridge Toll Plaza (Alameda County), including parallel and connecting arterials. The I-80 Corridor Mobility Project will install new and upgrade existing corridor management elements along the I-80 corridor (Phase 1 and along parallel and connecting Arterials (Phase 2) to allow sharing of real-time traveler information among public agencies and the public.
Contra Costa Highway Operations/ITS $28 $28 $ –
IRC57 CIRN83 I. Plan Bay Area Projects List (downloaded on Oct 1, 2013)
230704 Make SR 92 operational improvements to Chess Drive on- and off-ramps
Make SR 92 operational improvements to Chess Drive on-/off-ramps.
San Mateo Highway Operations/ITS $3 $3 $ –
IRC56 CIRN81 I. Plan Bay Area Projects List (downloaded on Oct 1, 2013)
240624 Implement I-80 ICM Project Operations and Management – Local Portion – Maintenance
I-80 ICM Project Operations and Management – Local Portion – Maintenance in Contra Costa; this project will implement ARM and ATM strategies, which will be employed to reduce congestion and provide incident management capabilities.
Contra Costa Highway Operations/ITS $3 $3 $ –

San Francisco Bay Area Freight Mobility Study Appendix
A-14 California Department of Transportation
GG Proj ID
IRC Proj ID
CIRN Proj ID
LMC Proj ID
UGMS Proj ID Source
RTP ID Project Title Project Description County Mode
Improvement Type
Total Cost Escalated
(in Millions)
Total Committed Escalated
(in Millions)
Total Discretionary
Escalated (in Millions)
GG10 LMC11 UGMS20 IIIa. Additional projects found in Alameda CTC’s Northern California Goods Movement Projects List in Bay Area and sourced to MTC Plan
N/A Oakland Airport Area ITS Project Design and implement ITS along 98th Avenue and Hegenberger Road from I-880 to OAK. Includes installation of CCTV cameras, vehicle detectors, dynamic message signs, transit priority, real‐time traveler information displays, etc. to improve management of the corridors leading to/from OAK and the I-880/Coliseum area. This project would interconnect the signals along these routes to minimize delay and improve traffic flow, and provide the Port and City with centralized control for incident management. Real‐time traffic‐responsive systems would be considered. ITS linkages would benefit OAK access to significant numbers of trucks traversing the arterial linkages to and from I-880, including many high‐value air freight shipments.
Alameda Highway Operations/ITS $15 N/A N/A
GG11 IRC58 IIIa. Additional projects found in Alameda CTC’s Northern California Goods Movement Projects List in Bay Area and sourced to MTC Plan
N/A Port of Oakland ITS Project would construct infrastructure and variable message boards at three locations en route to the Port’s maritime facilities. It is assumed that the Central Communications Center will be located at a facility in the Maritime Support Center. Cost does not include the facility.
Alameda Highway Operations/ITS $5 N/A N/A
IRC59 I. Plan Bay Area Projects List (downloaded on Oct 1, 2013)
240532 Improve intersections on SR 152 at Frazier Lake Road, Bloomfield Road, Watsonville Road, and Ferguson Road
Add EB right-turn lane at the intersection of SR 152 and Frazier Lake Road; widen SR 152 at the intersection of Bloomfield Road; and additional turn lanes at SR 152 and Watsonville Road; signalize and widen SR 152 south leg and Ferguson Road from 2 to 4 lanes.
Santa Clara Highway Operations/ITS (safety issues at Ferguson Rd)
$10 $ – $10
UGMS23 I. Plan Bay Area Projects List (downloaded on Oct 1, 2013)
22063 Improve SR 238 corridor near Foothill Boulevard/I-580 by removing parking during peak periods and spot widening
Adds travel lanes on Foothill Boulevard north of Mission-Foothill Jackson intersection by removing parking during the peak hours, and south of Mission-Foothill-Jackson to Palisades Street. Provides spot widening at Mission Boulevard/Carlos Bee Boulevard and improvements at Mission/Harder, Mission/Berry, Mission/Moreau High School and Mission/Tennyson. Constructs a one-way loop system in downtown Hayward by converting Foothill Boulevard between Jackson and A Street to 6 lanes northbound, A Street between Foothill Boulevard and A Street to 5 lanes westbound and Mission Boulevard to 5 lanes southbound between A Street and Jackson Street. Provide pavement overlays on Mission Boulevard south of Industrial to south city limits and construct traffic signal at Mission-Blanche. Provide pavement overlay on SB 185 north of A Street to north city limits.
Alameda Highway Parking restrictions and spot widening
$122 $122 $ –
LMC14 I. Plan Bay Area Projects List (downloaded on Oct 1, 2013)
21549 Implement Bayview Transportation Improvements
Implement direct access routes from U.S. 101 to the Hunters Point Shipyard along Cesar Chavez Street to Illinois Street, Cargo Way and Jennings Street, and along Cesar Chavez Street to Evans Avenue. The direct access route from U.S. 280 will travel along Pennsylvania Avenue to Illinois Street, then on to Cargo and Jennings. Improvements will include repaving existing roadway and adding new curbs, curb ramps, sidewalks, street lighting, trees, and route signage.
San Francisco Highway Reconstruction $37 $12 $26
LMC15 UGMS25 IIIa. Additional projects found in Alameda CTC’s Northern California Goods Movement Projects List in Bay Area and sourced to Alameda CWTP, but not found in Plan Bay Area Projects List
240279 Mandela Parkway and 3rd Street Corridor Commercial/Industrial Area Street Reconstruction
Reconstruct roadway network to address traffic safety concerns, rehabilitate the roadway surfaces to withstand truck traffic and address rail crossings, and provide streetscapes conducive to commercial and industrial development.
Alameda Highway Reconstruction $157 $ – $157

San Francisco Bay Area Freight Mobility Study Appendix
California Department of Transportation A-15
GG Proj ID
IRC Proj ID
CIRN Proj ID
LMC Proj ID
UGMS Proj ID Source
RTP ID Project Title Project Description County Mode
Improvement Type
Total Cost Escalated
(in Millions)
Total Committed Escalated
(in Millions)
Total Discretionary
Escalated (in Millions)
UGMS24 IIIa. Additional projects found in Alameda CTC’s Northern California Goods Movement Projects List in Bay Area and sourced to Alameda CWTP, but not found in Plan Bay Area Projects List
240290 Melrose‐Coliseum District Street Reconstruction (formerly ‘Oakland Coliseum Transportation Infrastructure Access Improvements’?)
Reconstruct Coliseum Way and 50th Avenue to handle heavy-truck traffic, reduce safety hazards due to sight distance, and provide bicycle and pedestrian safety facilities (part of RTP Goods Movement Programmatic Project).
Alameda Highway Reconstruction $14 $1 $13
LMC16 UGMS26 IIIa. Additional projects found in Alameda CTC’s Northern California Goods Movement Projects List in Bay Area and sourced to Alameda CWTP, but not found in Plan Bay Area Projects List
240282 Tidewater District Street Reconstruction Reconstruct Oakport, Lesser, Tidewater, and High Streets in Oakland west of the I-880 Freeway. Do major reconstructions of streets to serve heavy-truck traffic, reconfigure roadway intersection configurations, and provide public sidewalks (also bikeway on High, Lesser, and Tidewalter Streets).
Alameda Highway Reconstruction $5 $0 $5
UGMS27 IIIa. Additional projects found in Alameda CTC’s Northern California Goods Movement Projects List in Bay Area and sourced to Alameda CWTP, but not found in Plan Bay Area Projects List
240280 Woodland‐81st Avenue Industrial Zone street reconstruction
Reconstruct goods movement streets within the Woodland‐81st Avenue industrial area to withstand heavy-truck traffic; modify gateways, provide at‐grade safe RR crossings (listed separately and as part of RTP programmatic project).
Alameda Highway Reconstruction, highway-rail at-grade crossing
$12 $ – $12
UGMS28 I. Plan Bay Area Projects List (downloaded on Oct 1, 2013)
240101 Replace Fruitvale Bridge between Tilden Way in Alameda and Fruitvale Avenue in Oakland (includes widening for travel lanes)
Replace the existing railroad and vehicular bridges with one structure that can provide the only Lifeline access from Alameda. Provide dedicated transit lanes, bike lanes, median, and sidewalks. The Bridge is located on the Oakland Estuary between Tilden Way in Alameda and Fruitvale Avenue in Oakland.
Alameda Highway Road and rail bridge
replacements
$142 $ – $142
UGMS29 I. Plan Bay Area Projects List (downloaded on Oct 1, 2013)
240100 Replace Park Street Bridge between Park Street in Alameda and 29th Avenue in Oakland
Replace the existing railroad and vehicular bridges with one structure that can provide the only lifeline access from Alameda. Provide dedicated bike lanes, median, and sidewalks. The Bridge is located on the Oakland Estuary between Park Street in Alameda and 29th Avenue in Oakland.
Alameda Highway Road bridge replacement
$70 $ – $70
UGMS30 I. Plan Bay Area Projects List (downloaded on Oct 1, 2013)
240324 Retrofit Miller Sweeney Bridge between Tilden Way and Fruitvale Avenue, includes bike lanes, median, and sidewalks
Retrofit the existing bridge with one structure that can provide the only lifeline access from Alameda. Provide dedicated bike lanes, median, and sidewalks. The Bridge is located on the Oakland Estuary between Tilden Way in Alameda and Fruitvale Avenue in Oakland.
Alameda Highway Road bridge retrofitting
$61 $ – $61
UGMS31 I. Plan Bay Area Projects List (downloaded on Oct 1, 2013)
240094 Implement Crow Canyon Road Safety Improvements Project (includes roadway realignment, shoulder widening, retaining wall systems, and guardrail modifications along Crow Canyon Road between E. Castro Valley Boulevard and the Alameda/Contra Costa county line)
The project includes roadway realignment, shoulder widening, retaining wall systems, and guardrail modifications along Crow Canyon Road between E. Castro Valley Boulevard and the Alameda/Contra Costa county line.
Alameda Highway Roadway realignment and
safety
$24 $24 $ –
UGMS33 I. Plan Bay Area Projects List (downloaded on Oct 1, 2013)
98198 Improve safety and operations on Vasco Road in Contra Costa and Alameda Counties
Includes safety improvements to Vasco Road in Contra Costa County.
Contra Costa Highway Safety $45 $11 $34

San Francisco Bay Area Freight Mobility Study Appendix
A-16 California Department of Transportation
GG Proj ID
IRC Proj ID
CIRN Proj ID
LMC Proj ID
UGMS Proj ID Source
RTP ID Project Title Project Description County Mode
Improvement Type
Total Cost Escalated
(in Millions)
Total Committed Escalated
(in Millions)
Total Discretionary
Escalated (in Millions)
UGMS32 I. Plan Bay Area Projects List (downloaded on Oct 1, 2013)
230306 Improve safety on Alhambra Avenue by adding second southbound lane from Walnut Avenue to south side of SR 4, includes signal modifications
The project adds a second southbound Alhambra Avenue lane from Walnut Avenue to the south side of Highway 4. Signal modifications are included.
Contra Costa Highway Safety $3 $1 $3
IRC96 CIRN85 IIIa. Additional projects found in Alameda CTC’s Northern California Goods Movement Projects List in Bay Area and sourced to GMAP, MTC Plan
N/A I-238/I-580 truck bypass lane Construct a truck bypass lane from I-580 to I-238; would have capacity benefits, as well as safety benefits by eliminating current left merge.
Alameda Highway Truck bypass lane $120 N/A N/A
CIRN88 I. Plan Bay Area Projects List (downloaded on Oct 1, 2013)
21613 Widen SR 92 between San Mateo-Hayward Bridge to I-280, includes uphill passing lane from U.S. 101 to I-280
Widening of SR 92 between San Mateo-Hayward Bridge and I-280.
San Mateo Highway Truck climbing lane
$35 $19 $16
IRC97 CIRN86 I. Plan Bay Area Projects List (downloaded on Oct 1, 2013)
22013 Construct I-580 eastbound truck climbing lane at the Altamont Summit
Construct I-580 eastbound truck climbing lane from Greenville Road Undercrossing to one mile east of North Flynn Road (Altamont Summit).
Alameda Highway Truck climbing lane
$66 $66 $ –
CIRN89 I. Plan Bay Area Projects List (downloaded on Oct 1, 2013)
22610 Widen and extend major streets, and improve interchanges in West Contra Costa County
Funds future widening projects to major streets and interchange improvements, such as truck climbing lane on Cumming Skyway, San Pablo Avenue Safety Improvements, Arlington Avenue Traffic Calming, and Pittsburg Avenue extension.
Contra Costa Highway Truck climbing lane
$45 $45 $ –
CIRN90 I. Plan Bay Area Projects List (downloaded on Oct 1, 2013)
230291 Construct northbound truck climbing lane from Clearbrook Drive in Concord to crest of Kirker Pass Road, includes 12-foot dedicated truck climbing lane, bike lane and 8-foot paved shoulder
This project will add NB truck climbing lane from Clearbrook Drive in the City of Concord to a point 1,000 beyond the crest of Kirker Pass Road. The addition will include a 12-foot dedicated truck climbing lane and a Class II bike lane within an 8-foot paved shoulder.
Contra Costa Highway Truck climbing lane
$10 $6 $4
IRC98 CIRN87 IIIa. Additional projects found in Alameda CTC’s Northern California Goods Movement Projects List in Bay Area and sourced to TCIF Tier 2, GMAP, SJV IRGMS, MTC Plan
N/A WB I-580 Truck Climbing Lane Over Altamont Pass
Truck climbing lane between the I-205/Hansen Road overcrossing and the summit of Altamont Pass. Strong support from Central Valley agricultural community. Caltrans staff is working on project development.
Alameda/ San Joaquin
Highway Truck climbing lane
$70 N/A N/A
CIRN91 I. Plan Bay Area Projects List (downloaded on Oct 1, 2013)
94644 Construct a westbound slow vehicle lane on SR 92 between SR 35 and I-280
Constructs a westbound slow vehicle lane on SR 92. San Mateo Highway Truck climbing lanes
$21 $10 $10
CIRN92 I. Plan Bay Area Projects List (downloaded on Oct 1, 2013)
230311 Widen and improve Peterson Road with the addition of a truck-stacking lane
Local roadway that provides truck access to the south gate of Travis Air Force Base by way of SR 12 to Walters Road to Peterson Road.
Solano Highway Truck stacking lane
$2 $2 $ –
CIRN93 I. Plan Bay Area Projects List (downloaded on Oct 1, 2013)
21612 Improve access to and from the west side of Dumbarton Bridge on SR 84 connecting to U.S. 101, includes flyovers, interchange improvements, and conversion of Willow Road between SR 84 and U.S. 101 to expressway
Phase 1 of Gateway 2020 improvement. First phase improvement of access to/from west side of Dumbarton Bridge on SR 84 connecting to U.S. 101 (includes flyovers, interchange improvements, and conversion of Willow Road Between SR 84 and U.S. 101 to expressway). For modeling purposes: * Flyover from westbound Hwy 84 to Willow Road (84); * Elimination of University and SR 84 Interchange (University will connect to Willow near Highway 84). * Conversion of Willow to Expressway between SR 84 (Bay Front Expressway) and U.S. 101 (no lights) * Flyover from Willow to U.S. 101 South
San Mateo Highway Upgrade to expressway
$64 $54 $10

San Francisco Bay Area Freight Mobility Study Appendix
California Department of Transportation A-17
GG Proj ID
IRC Proj ID
CIRN Proj ID
LMC Proj ID
UGMS Proj ID Source
RTP ID Project Title Project Description County Mode
Improvement Type
Total Cost Escalated
(in Millions)
Total Committed Escalated
(in Millions)
Total Discretionary
Escalated (in Millions)
CIRN94 I. Plan Bay Area Projects List (downloaded on Oct 1, 2013)
240672 Implement Marin Sonoma Narrows Phase 1 (Sonoma County)
Replacing Petaluma Boulevard South Interchange and adding frontage roads to accommodate a future third lane. It Includes widening and seismically upgrading the Petaluma River Bridge. It brings the section of Hwy 101 from the Sonoma County line to the Petaluma Boulevard South interchange up to freeway standards. Currently, it is an expressway between the county line and the Petaluma Boulevard South Interchange.
Sonoma Highway Upgrade to freeway
$123 $123 $ –
CIRN102 I. Plan Bay Area Projects List (downloaded on Oct 1, 2013)
230202 Widen SR 4 Bypass from 2 to 4 Lanes from Laurel Road to Sand Creek Road
Convert a 2-lane expressway to a 4-lane freeway from Laurel Road to Sand Creek Road.
Contra Costa Highway Widening $20 $20 $ –
UGMS10 I. Plan Bay Area Projects List (downloaded on Oct 1, 2013)
21892 Widen Woodside Road from 4 lanes to 6 lanes from El Camino Real to Broadway, includes adding shoulders
Widens Woodside Road from 4 to 6 lanes from El Camino Real to Broadway. Add shoulders.
San Mateo Highway Widening $3 $2 $1
UGMS38 I. Plan Bay Area Projects List (downloaded on Oct 1, 2013)
22613 Widen and extend major streets, and improve interchanges in southwest Contra Costa County (includes widening Camino Tassajara to 4 lanes between Danville and Windemere Parkway, and to 6 lanes from Windemere Parkway to Alameda County line)
Funds future widening projects to major streets and interchange improvements, such as widening Camino Tassajara to 4 lanes (Danville-Windemere Pkwy) and to 6 lanes (Windemere Pkwy to Alameda County line).
Contra Costa Highway Widening $42 $42 $ –
UGMS34 I. Plan Bay Area Projects List (downloaded on Oct 1, 2013)
22776 Widen SR 84 from 2 lanes to 4 lanes from north of Pigeon Pass to Stanley Boulevard and from 2 lanes to 6 lanes from Stanley Boulevard to Jack London Boulevard
Widen SR 84 from 2 lanes to 4 lanes from north of Pigeon Pass to Stanley Boulevard; and from 2 lanes to 6 lanes from Stanley Boulevard to Jack London Boulevard.
Alameda Highway Widening $145 $135 $11
CIRN96 I. Plan Bay Area Projects List (downloaded on Oct 1, 2013)
94152 Widen SR 12 (Jameson Canyon) from 2 lanes to 4 lanes from I-80 in Solano County to SR 29 in Napa County (Phase 1)
Widen SR 12 (Jameson Canyon) from SR 29 in Napa County to I-80 in Solano County from 2 lanes to 4 lanes.
Bay Area Region/Multicounty
Highway Widening $140 $140 $ –
IRC104 CIRN99 I. Plan Bay Area Projects List (downloaded on Oct 1, 2013)
98133 Widen Pacheco Boulevard from 2 lanes to 4 lanes between Blum Road to Arthur Road
Widen Pacheco Boulevard from 2 to 4 lanes from Blum Road to Arthur Road. This project upgrades this 2-lane rural highway segment to a 4-lane arterial.
Contra Costa Highway Widening $58 $58 $ –
UGMS47 I. Plan Bay Area Projects List (downloaded on Oct 1, 2013)
230236 Widen Pittsburg-Antioch Highway from 2 lanes to 4 lanes
Widen existing 2-lane arterial roadway to 4-lane arterial with turning lanes at appropriate locations.
Contra Costa Highway Widening $15 $15 $ –
UGMS37 I. Plan Bay Area Projects List (downloaded on Oct 1, 2013)
230238 Widen California Avenue from 2 lanes to 4 lanes with 2 left-turn lanes
Widen existing 2-lane arterial roadway to 4-lanes with 2 wide left-turn lanes.
Contra Costa Highway Widening $13 $13 $ –
UGMS15 I. Plan Bay Area Projects List (downloaded on Oct 1, 2013)
230456 Widen Zanker Road from 4-lanes to 6-lanes
Widen Zanker Road from 4 to 6 lanes to support traffic circulation in North San Jose area.
Santa Clara Highway Widening $61 $61 $ –
UGMS46 I. Plan Bay Area Projects List (downloaded on Oct 1, 2013)
230457 Widen Oakland Road from 4-lanes to 6-lanes between U.S. 101 and Montague Expressway
Provides median island landscaping and operational improvements in roadway corridor between North San Jose and Downtown San Jose area. Widens Oakland Road from 4 to 6 lanes.
Santa Clara Highway Widening $13 $5 $7
UGMS48 I. Plan Bay Area Projects List (downloaded on Oct 1, 2013)
230590 Widen Railroad Avenue on Mare Island to 4 lanes from G Street to SR 37
Widen Railroad Avenue on Mare Island to 4 lanes from G Street to SR 37.
Solano Highway Widening $5 $5 $ –
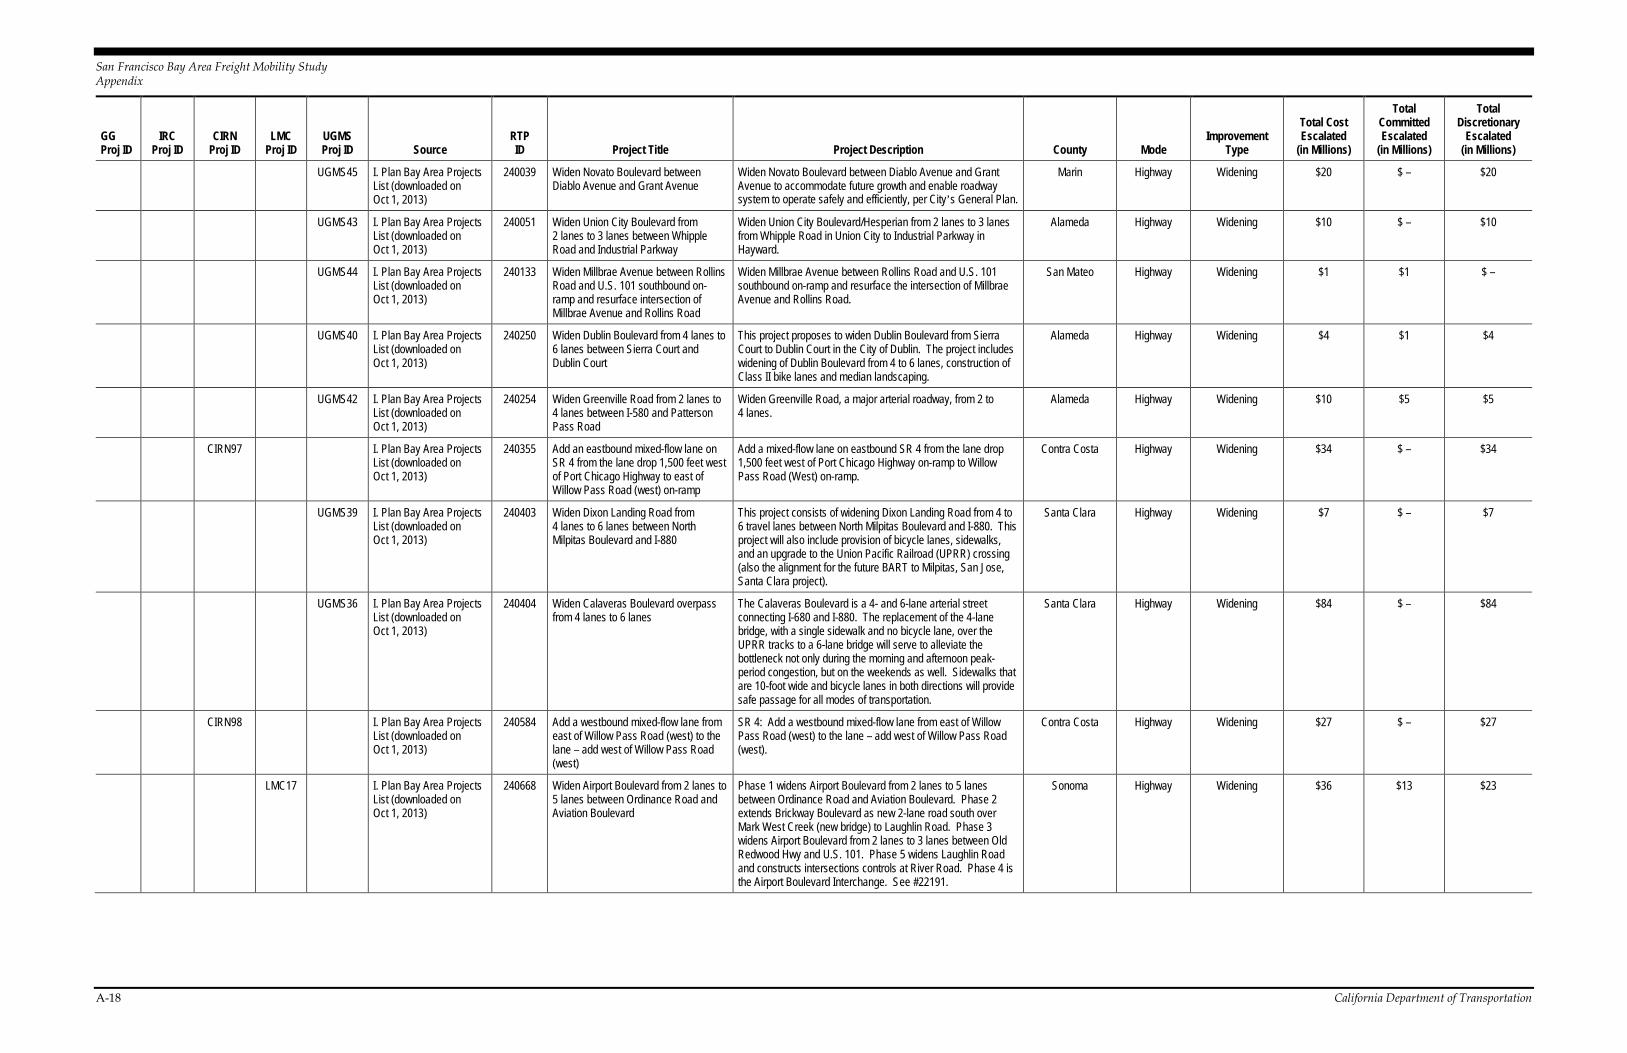
San Francisco Bay Area Freight Mobility Study Appendix
A-18 California Department of Transportation
GG Proj ID
IRC Proj ID
CIRN Proj ID
LMC Proj ID
UGMS Proj ID Source
RTP ID Project Title Project Description County Mode
Improvement Type
Total Cost Escalated
(in Millions)
Total Committed Escalated
(in Millions)
Total Discretionary
Escalated (in Millions)
UGMS45 I. Plan Bay Area Projects List (downloaded on Oct 1, 2013)
240039 Widen Novato Boulevard between Diablo Avenue and Grant Avenue
Widen Novato Boulevard between Diablo Avenue and Grant Avenue to accommodate future growth and enable roadway system to operate safely and efficiently, per City’s General Plan.
Marin Highway Widening $20 $ – $20
UGMS43 I. Plan Bay Area Projects List (downloaded on Oct 1, 2013)
240051 Widen Union City Boulevard from 2 lanes to 3 lanes between Whipple Road and Industrial Parkway
Widen Union City Boulevard/Hesperian from 2 lanes to 3 lanes from Whipple Road in Union City to Industrial Parkway in Hayward.
Alameda Highway Widening $10 $ – $10
UGMS44 I. Plan Bay Area Projects List (downloaded on Oct 1, 2013)
240133 Widen Millbrae Avenue between Rollins Road and U.S. 101 southbound on-ramp and resurface intersection of Millbrae Avenue and Rollins Road
Widen Millbrae Avenue between Rollins Road and U.S. 101 southbound on-ramp and resurface the intersection of Millbrae Avenue and Rollins Road.
San Mateo Highway Widening $1 $1 $ –
UGMS40 I. Plan Bay Area Projects List (downloaded on Oct 1, 2013)
240250 Widen Dublin Boulevard from 4 lanes to 6 lanes between Sierra Court and Dublin Court
This project proposes to widen Dublin Boulevard from Sierra Court to Dublin Court in the City of Dublin. The project includes widening of Dublin Boulevard from 4 to 6 lanes, construction of Class II bike lanes and median landscaping.
Alameda Highway Widening $4 $1 $4
UGMS42 I. Plan Bay Area Projects List (downloaded on Oct 1, 2013)
240254 Widen Greenville Road from 2 lanes to 4 lanes between I-580 and Patterson Pass Road
Widen Greenville Road, a major arterial roadway, from 2 to 4 lanes.
Alameda Highway Widening $10 $5 $5
CIRN97 I. Plan Bay Area Projects List (downloaded on Oct 1, 2013)
240355 Add an eastbound mixed-flow lane on SR 4 from the lane drop 1,500 feet west of Port Chicago Highway to east of Willow Pass Road (west) on-ramp
Add a mixed-flow lane on eastbound SR 4 from the lane drop 1,500 feet west of Port Chicago Highway on-ramp to Willow Pass Road (West) on-ramp.
Contra Costa Highway Widening $34 $ – $34
UGMS39 I. Plan Bay Area Projects List (downloaded on Oct 1, 2013)
240403 Widen Dixon Landing Road from 4 lanes to 6 lanes between North Milpitas Boulevard and I-880
This project consists of widening Dixon Landing Road from 4 to 6 travel lanes between North Milpitas Boulevard and I-880. This project will also include provision of bicycle lanes, sidewalks, and an upgrade to the Union Pacific Railroad (UPRR) crossing (also the alignment for the future BART to Milpitas, San Jose, Santa Clara project).
Santa Clara Highway Widening $7 $ – $7
UGMS36 I. Plan Bay Area Projects List (downloaded on Oct 1, 2013)
240404 Widen Calaveras Boulevard overpass from 4 lanes to 6 lanes
The Calaveras Boulevard is a 4- and 6-lane arterial street connecting I-680 and I-880. The replacement of the 4-lane bridge, with a single sidewalk and no bicycle lane, over the UPRR tracks to a 6-lane bridge will serve to alleviate the bottleneck not only during the morning and afternoon peak-period congestion, but on the weekends as well. Sidewalks that are 10-foot wide and bicycle lanes in both directions will provide safe passage for all modes of transportation.
Santa Clara Highway Widening $84 $ – $84
CIRN98 I. Plan Bay Area Projects List (downloaded on Oct 1, 2013)
240584 Add a westbound mixed-flow lane from east of Willow Pass Road (west) to the lane – add west of Willow Pass Road (west)
SR 4: Add a westbound mixed-flow lane from east of Willow Pass Road (west) to the lane – add west of Willow Pass Road (west).
Contra Costa Highway Widening $27 $ – $27
LMC17 I. Plan Bay Area Projects List (downloaded on Oct 1, 2013)
240668 Widen Airport Boulevard from 2 lanes to 5 lanes between Ordinance Road and Aviation Boulevard
Phase 1 widens Airport Boulevard from 2 lanes to 5 lanes between Ordinance Road and Aviation Boulevard. Phase 2 extends Brickway Boulevard as new 2-lane road south over Mark West Creek (new bridge) to Laughlin Road. Phase 3 widens Airport Boulevard from 2 lanes to 3 lanes between Old Redwood Hwy and U.S. 101. Phase 5 widens Laughlin Road and constructs intersections controls at River Road. Phase 4 is the Airport Boulevard Interchange. See #22191.
Sonoma Highway Widening $36 $13 $23

San Francisco Bay Area Freight Mobility Study Appendix
California Department of Transportation A-19
GG Proj ID
IRC Proj ID
CIRN Proj ID
LMC Proj ID
UGMS Proj ID Source
RTP ID Project Title Project Description County Mode
Improvement Type
Total Cost Escalated
(in Millions)
Total Committed Escalated
(in Millions)
Total Discretionary
Escalated (in Millions)
UGMS35 II. Additional projects found in Plan Bay Area Projects List (downloaded on Oct 1, 2013); suggested in Alameda CTC’s Northern California Goods Movement Projects List
230114 Widen Auto Mall Parkway from 4 lanes to 6 lanes between I-680 and I-880
Widening of Auto Mall Parkway from 4 to 6 lanes, including intersection improvements and widening of bridge over UPRR.
Alameda Highway Widening $25 $ – $25
UGMS41 II. Additional projects found in Plan Bay Area Projects List (downloaded on Oct 1, 2013); suggested in Alameda CTC’s Northern California Goods Movement Projects List
240264 Widen Fremont Boulevard to 6 lanes and 2 bike lanes from Grimmer Boulevard to I-880
Widen Fremont Boulevard to 6 lanes and 2 bike lanes from Grimmer Boulevard to I-880; install new traffic signals at Grimmer Boulevard intersection and Industrial Drive intersection.
Alameda Highway Widening $5 $ – $5
IRC101 CIRN95 IIIa. Additional projects found in Alameda CTC’s Northern California Goods Movement Projects List in Bay Area and sourced to MTC Plan
N/A U.S. 101 Widening from Cochrane Road to Monterey Highway
Widen U.S. 101 between Cochrane Road to Monterey Highway (Morgan Hill to Gilroy) from 6 to 8 lanes, and construct 2 new interchanges at Tennant and Buena Vista.
Santa Clara Highway Widening $260 N/A N/A
IRC100 IIIb. Additional projects found in Alameda CTC’s Northern California Goods Movement Projects List outside Bay Area and sourced to TCIF Tier 2
N/A I‐80 Widening project Operational and capacity improvements. Local sales tax secured for match. Need clarification on exact project limits.
Sacramento Highway Widening $200 N/A N/A
IRC99 IIIb. Additional projects found in Alameda CTC’s Northern California Goods Movement Projects List outside Bay Area and sourced to TCIF Tier 2, SJV IRGMS
N/A I-5 widening project – Stockton Widens a key segment of I-5 in Central and North Stockton, which carries up to 18% trucks and is a key connector to the Port of Stockton. Matching funds through Measure K and local sources. Need clarification on exact project limits not clear?
San Joaquin Highway Widening $260 N/A N/A
IRC102 IIIb. Additional projects found in Alameda CTC’s Northern California Goods Movement Projects List outside Bay Area and sourced to GMAP
N/A I-205 Tracy, 11th Avenue to I-5, widen 4 to 6 lanes
N/A San Joaquin Highway Widening $103 N/A N/A
LMC18 IIIa. Additional projects found in Alameda CTC’s Northern California Goods Movement Projects List in Bay Area and sourced to TCIF Tier 2, GMAP, MTC Plan
N/A North Airport Air Cargo (Infield) Road Access Improvements
Phase 1 – widen and connect SR 61 (Doolittle Drive) with Earhart Road and extend into the Infield area at North Field. Another $8.4M second phase for a later date. Improves capacity and access to North Airport air cargo tenants.
Alameda Highway Widening & extension
$10 N/A N/A

San Francisco Bay Area Freight Mobility Study Appendix
A-20 California Department of Transportation
GG Proj ID
IRC Proj ID
CIRN Proj ID
LMC Proj ID
UGMS Proj ID Source
RTP ID Project Title Project Description County Mode
Improvement Type
Total Cost Escalated
(in Millions)
Total Committed Escalated
(in Millions)
Total Discretionary
Escalated (in Millions)
IRC105 CIRN100 I. Plan Bay Area Projects List (downloaded on Oct 1, 2013)
22134 Construct a lane on southbound U.S. 101 using the existing median from south of Story Road to Yerba Buena Road; modify the U.S. 101/Tully road interchange to a partial cloverleaf
Modify U.S. 101/Tully IC. Construct operational and safety improvements as follows: construct 1 additional lane in the SB direction from south of Story Road intersection; modify U.S. 101/Tully Road interchange to Par-Clo and rebuild Tully Road intersection. May also include soundwalls.
Santa Clara Highway Widening & interchange
$97 $97 $ –
CIRN101 UGMS21 I. Plan Bay Area Projects List (downloaded on Oct 1, 2013)
230170 Improve 42nd Avenue and High Street, includes extending and aligning 42nd Avenue with Alameda Avenue to create road parallel to High Street, widening High Street between Oakport Street and Coliseum Way, realigning E. 8th Street near Alameda Avenue, and modifying traffic signals and other intersection improvements
The project consists of extending and aligning 42nd Avenue with Alameda Avenue to provide a road parallel to High Street; widening High Street to provide additional capacity at the intersections of the freeway connector roads of Oakport Street and Coliseum Way; realigning E. 8th Street near Alameda Avenue; and extending and realigning Jensen and Howard Streets to connect High Street and 42nd Avenue. Includes modified traffic signals and intersection improvements. On High Street, the limits of construction are approximately 600 feet (190 meters) to west of I-880 and 500 feet (150 meters) to the east of I-880. On 42nd/Alameda Avenue, the limits of construction are approximately 1,000 feet (290 meters) to the west of I-880. Improvements are also proposed for Howard Street/Jensen Street and E. 8th Street, as well as the intersections of High Street at Oakport Street and Coliseum Way.
Alameda Highway Widening & operations/ITS
$18 $6 $12
UGMS22 II. Additional projects found in Plan Bay Area Projects List (downloaded on Oct 1, 2013); suggested in Alameda CTC’s Northern California Goods Movement Projects List
21093 Implement SR 92/Clawiter Road/Whitesell Street interchange improvements and local intersection improvements
The project involves improving the access to and from SR 92 in the area of existing Clawiter Road interchange, and to provide some congestion relief to I-880 and several major arterials, such as Winton Avenue, Clawiter Road, and Deport Road. The project is being delivered in two phases. Phase I comprises local street system modification, which includes the following: 1) the widening of West Winton Avenue at the intersection of Hesperian Boulevard with minor signal phasing modifications at Hesperian Boulevard and Middle Lane/Southland Drive; 2) the widening and extension of Whitesell Street between Depot Road and SR 92; 3) installation of a new traffic signal and improvements at the eastbound SR 92 off-ramp at Clawiter Road and Eden Landing Roads; and 4) intersection improvements at the westbound SR 92 off-ramp at Clawiter Road and Breakwater Avenue. The Whitesell Street extension and widening will include 2 travel lanes and a bike lane in each direction with new curb, gutter, sidewalk, and landscape strip on each side. The project also includes the installation of storm, sewer and water lines, and LED street lighting.
Alameda Highway Widening & operations/ITS
$28 $28 $ –
IRC103 IIIb. Additional projects found in Alameda CTC’s Northern California Goods Movement Projects List outside Bay Area and sourced to GMAP
N/A I‐80 Capacity improvements and carpool lanes Sacramento County line to east of SR 65
N/A Placer Highway Widening & operations/ITS
$169 N/A N/A
I. Plan Bay Area Projects List (downloaded on Oct 1, 2013)
230205 Widen SR 4 Bypass from 2 to 4 lanes from Sand Creek Road to Balfour Road
Convert 2-lane expressway to 4-lane freeway from Sand Creek Road to Balfour Road.
Contra Costa Highway Widening (Sand Creek Rd to Balfour Rd)
$22 $22 $ –
IRC106 CIRN103 I. Plan Bay Area Projects List (downloaded on Oct 1, 2013)
21714 Widen U.S. 101 from Monterey Street to SR 129 – project development
Constructs a full interchange at the intersection of U.S. 101 and SR 25, including an extension to Santa Teresa Boulevard. The project includes widening of U.S. 101 between Monterey Highway and SR 129, and improvements on SR 25 from U.S. 101 to the Santa Clara County line.
Santa Clara Highway Widening, interchange
$7 $ – $7

San Francisco Bay Area Freight Mobility Study Appendix
California Department of Transportation A-21
GG Proj ID
IRC Proj ID
CIRN Proj ID
LMC Proj ID
UGMS Proj ID Source
RTP ID Project Title Project Description County Mode
Improvement Type
Total Cost Escalated
(in Millions)
Total Committed Escalated
(in Millions)
Total Discretionary
Escalated (in Millions)
CIRN104 I. Plan Bay Area Projects List (downloaded on Oct 1, 2013)
98999 Widen SR 4 from Somersville Road to SR 160, including improvements to interchanges
Widens SR 4 from 4 to 8 lanes (3 mixed flow lanes + HOV in each direction), including auxiliary lanes and a wide median for mass transit from Somersville Road to Hillcrest Avenue, and from 4 lanes to 6 lanes (3 mixed flow in each direction) from Hillcrest to SR 160.
Contra Costa Highway Widening, Interchanges
$442 $442 $ –
IRC8 I. Plan Bay Area Projects List (downloaded on Oct 1, 2013)
240208 Improve highway-rail grade crossings at 4 crossings in Fremont
Improve highway-rail crossing safety at 4 at-grade crossings in the City of Fremont by installing raised medians, railroad gate improvements, and sidewalk. Rail crossing locations are Fremont Boulevard, Maple Street, Dusterberry Way, and Nursery Avenue.
Alameda Rail Highway-rail at-grade crossing
$3 $ – $3
CIRN15 I. Plan Bay Area Projects List (downloaded on Oct 1, 2013)
240667 Implement Windsor River Road/Windsor Road/NWPRR Intersection improvements. Reconfigure intersection and improve railroad, vehicle, and pedestrian interface.
Windsor River Road/Windsor Road/NWPRR Intersection improvements. Reconfigure intersection and improve railroad, vehicle, and pedestrian interface.
Sonoma Rail Highway-rail at-grade crossing
$9 $ – $9
IRC11 UGMS4 I. Plan Bay Area Projects List (downloaded on Oct 1, 2013)
21103 Construct grade separation structure on Central Avenue at UPRR crossing
Construct a grade separation structure on Central Avenue (4-lane arterial street) at UPRR crossing. Project is an enhancement.
Alameda Rail Highway-rail grade separation
$19 $1 $18
IRC16 UGMS11 I. Plan Bay Area Projects List (downloaded on Oct 1, 2013)
21214 Widen Wilbur Avenue over Burlington Northern Santa Fe Railroad from 2 lanes to 4 lanes
Widen Wilbur Avenue from 2 lanes to 4 lanes over Burlington Northern Santa Fe Railroad.
Contra Costa Rail Highway-rail grade separation
$16 $16 $ –
IRC9 LMC1 I. Plan Bay Area Projects List (downloaded on Oct 1, 2013)
22082 Implement Outer Harbor Intermodal Terminals project (includes 7th Street grade separation and roadway improvements)
The Outer Harbor Intermodal Terminals project will construct new tracks across 7th and Maritime Streets between the Port’s Joint Intermodal Terminal and the Oakland Army Base. The 7th Street Grade Separation & Roadway Improvement Project will grade separate those new railroad tracks from roadway traffic. The 7th and Maritime Street intersection will be reconfigured, and the roadway will be elevated above the planned railroad tracks. The project limits are the 7th Street & I-880 interchange, the 7th and Middle Harbor Road intersection, and an approximately 1,500-foot section of Maritime Street north of 7th Street.
Alameda Rail Highway-rail grade separation
$332 $166 $166
CIRN18 I. Plan Bay Area Projects List (downloaded on Oct 1, 2013)
22779 Improve SR 262/I-880 interchange (Phase 2), which involves grade separation at Warren Avenue/UPRR
Serves as Phase 2 of the SR 262/I-880 Freeway Interchange Reconstruction and I-880 Widening Project. Phases 1a & 1b include direct connectors between SR 262 with HOV bypass lanes along the on-ramps, and freeway widening to provide for the completion of HOV lanes from Alameda County to the Santa Clara County line. This application is for the Phase 2 project – Grade Separation of Warren Avenue and UPRR tracks.
Alameda Rail Highway-rail grade separation
$80 $ – $80
IRC13 UGMS8 I. Plan Bay Area Projects List (downloaded on Oct 1, 2013)
230084 Construct a railroad grade separation at the Richmond Waterfront on the Marina Bay Parkway
Construct a railroad grade separation on Marina Bay Parkway in the Marina Bay District of Richmond.
Contra Costa Rail Highway-rail grade separation
$39 $39 $ –
CIRN16 I. Plan Bay Area Projects List (downloaded on Oct 1, 2013)
230249 Construct grade separation underpass at Lone Tree Way and UPRR
Construct a grade-separation underpass under the UPRR. Underpass consists of a 6-lane crossing and includes utility relocation.
Contra Costa Rail Highway-rail grade separation
$19 $4 $15

San Francisco Bay Area Freight Mobility Study Appendix
A-22 California Department of Transportation
GG Proj ID
IRC Proj ID
CIRN Proj ID
LMC Proj ID
UGMS Proj ID Source
RTP ID Project Title Project Description County Mode
Improvement Type
Total Cost Escalated
(in Millions)
Total Committed Escalated
(in Millions)
Total Discretionary
Escalated (in Millions)
IRC14 UGMS9 IIIa. Additional projects found in Alameda CTC’s Northern California Goods Movement Projects List in Bay Area and sourced to Alameda CWTP, but not found in Plan Bay Area Projects List
240273 Mowry Avenue Railroad Overpass Construct a grade-separation structure on Mowry Avenue at the UPRR crossing to provide access to Area 4 in Newark (Coast Subdivision).
Alameda Rail Highway-rail grade separation
$14 $ – $14
IRC10 LMC2 IIIa. Additional projects found in Alameda CTC’s Northern California Goods Movement Projects List in Bay Area and sourced to GMAP, MTC Plan
N/A Reconstruction of the Adeline Street Overpass
Replace the existing Adeline Street overpass (over the railroad tracks at 3rd Street and Adeline Street) to reduce the grade of the overpass and improve structure so it can accommodate overweight trucks.
Alameda Rail Highway-rail grade separation
$60 N/A N/A
CIRN17 I. Plan Bay Area Projects List (downloaded on Oct 1, 2013)
21114 Construct grade separations on Washington Boulevard/Paseo Padre Parkway at the UPRR tracks and proposed BART extension
Construction of grade separations (underpass at Paseo Padre Parkway and overpass at Washington Boulevard) at the UPRR tracks and proposed BART extension.
Alameda Rail Highway-rail grade separation
$109 $109 $ –
UGMS5 I. Plan Bay Area Projects List (downloaded on Oct 1, 2013)
230103 Construct grade separation over Decoto Road in the Decoto neighborhood
In conjunction with the grade separation over Decoto Road (Project #230101) continued grade separations of both rail lines through the residential neighborhood of Decoto.
Alameda Rail Highway-rail grade separation
$192 $ – $192
IRC12 LMC3 UGMS7 IIIa. Additional projects found in Alameda CTC’s Northern California Goods Movement Projects List in Bay Area and sourced to CCJPA FY08/09 – FY09/10 Business Plan, but not found in CCJPA FY13-14 Plan
N/A Grade Crossing Projects Implement High Street, Davis Street, and Hesperian Street Grade separation projects.
Alameda Rail Highway-rail grade separation
$67 N/A N/A
IRC17 UGMS12 IIIa. Additional projects found in Alameda CTC’s Northern California Goods Movement Projects List in Bay Area and sourced to Alameda CWTP, but not found in Plan Bay Area Projects List
230116 Berkeley Railroad Crossing Improvements
Design and construct railway crossing improvements, including grade separation at Gilman Avenue and quadrant gates, road closures, and at‐grade improvements at other crossings, per Quiet Zone Study.
Alameda Rail Highway-rail grade separation and at-
grade crossing
$112 $ – $112
IRC44 I. Plan Bay Area Projects List (downloaded on Oct 1, 2013)
21760 Double-track segments of the Caltrain line between San Jose and Gilroy
Double-track segments on the Caltrain line between San Jose and Gilroy.
Santa Clara Rail New tracks $31 $ – $31
IRC45 I. Plan Bay Area Projects List (downloaded on Oct 1, 2013)
240048 Caltrain South Terminal Track Capacity Expansion, Phases II and III – project development
Phase II of this project is to construct an additional mainline track and new signal controls just north of Diridon Station. Phase III is to install an additional mainline track and signal controls just south of Diridon Station.
Bay Area Region/Multicounty
Rail New tracks $16 $16 $ –

San Francisco Bay Area Freight Mobility Study Appendix
California Department of Transportation A-23
GG Proj ID
IRC Proj ID
CIRN Proj ID
LMC Proj ID
UGMS Proj ID Source
RTP ID Project Title Project Description County Mode
Improvement Type
Total Cost Escalated
(in Millions)
Total Committed Escalated
(in Millions)
Total Discretionary
Escalated (in Millions)
IRC50 IIIa. Additional projects found in Alameda CTC’s Northern California Goods Movement Projects List in Bay Area and sourced to CCJPA FY08/09 – FY09/10 Business Plan, but not found in CCJPA FY13-14 Plan
N/A Sacramento ‐ Benicia 3rd Track Improvement
Addition of 3rd main line tracks at selected locations (Bahia-Benicia, Suisun-Dixon, and Davis-West Sacramento).
Solano/Yolo/Sacramento
Rail New tracks $290 N/A N/A
IRC47 IIIa. Additional projects found in Alameda CTC’s Northern California Goods Movement Projects List in Bay Area and sourced to CCJPA FY08/09 – FY09/10 Business Plan, but not found in CCJPA FY13-14 Plan
N/A Newark‐Alviso added main tracks Add 2nd (and possible 3rd) main line tracks from Albrae through wildlife refuge/wetlands area to Alviso (design plans will be sensitive to environmental needs and wetlands areas).
Alameda Rail New tracks $169 N/A N/A
IRC51 IIIb. Additional projects found in Alameda CTC’s Northern California Goods Movement Projects List outside Bay Area and sourced to CCJPA FY08/09 – FY09/10 Business Plan
N/A Sacramento‐Roseville 3rd Track Add dedicated 3rd track to bypass freight trains between Sacramento and the Roseville freight yard, which will allow for more service between Sacramento and Roseville. There is another entry in State Rail Plan for a $2.13 M Sacramento‐Roseville 3rd main track.
Sacramento/Placer
Rail New tracks $75 N/A N/A
IRC48 IV. Additional projects found in 2013 State Rail Plan (CCJPA Improvements), CCJPA FY08/09 – FY09/10 Business Plan
N/A Oakland (Jack London Square) – Elmhurst 3rd main track
Add 3rd track from Oakland Jack London Square (JLS) Station to Elmhurst (near Oakland Coliseum) for added track capacity for more service between Oakland and San Jose.
Alameda Rail New tracks $42 N/A N/A
IRC46 IV. Additional projects found in 2013 State Rail Plan (CCJPA Improvements)
N/A CP Coast to State Route 237 (Gold Street) 2nd main track
N/A Santa Clara Rail New tracks $37 N/A N/A
IRC49 IV. Additional projects found in 2013 State Rail Plan (CCJPA Improvements), CCJPA FY08/09 – FY09/10 Business Plan
N/A Oakland (Jack London Square) to Embarcadero 3rd main track
Add 3rd main track in the Oakland Jack London Square (JLS) Station to Embarcadero area to improve conflicting movements of freight and passenger trains.
Alameda Rail New tracks $30 N/A N/A

San Francisco Bay Area Freight Mobility Study Appendix
A-24 California Department of Transportation
GG Proj ID
IRC Proj ID
CIRN Proj ID
LMC Proj ID
UGMS Proj ID Source
RTP ID Project Title Project Description County Mode
Improvement Type
Total Cost Escalated
(in Millions)
Total Committed Escalated
(in Millions)
Total Discretionary
Escalated (in Millions)
IRC53 IIIb. Additional projects found in Alameda CTC’s Northern California Goods Movement Projects List outside Bay Area and sourced to GMAP
N/A Tehachapi Trade Corridor Rail Improvement Project
Rail corridor through the Tehachapi Mountains poses operational challenges, including steep mountain grades, extreme track curvature, 12 tunnels, single‐line trackage along most of the corridor, and a high-volume of daily rail traffic. Project improves throughput and velocity on the corridor, increase capacity and efficiency for the Port of Oakland, and improve California shipper access to major national markets. Majority of goods passing over the corridor either originate or terminate in California. Match from BNSF. Increases key capacity for both domestic export from Valley and transcontinental traffic from Port. Would open up rail capacity in the San Joaquin Valley.
Kern Rail New Tracks and track upgrades
$113 N/A N/A
IRC52 IV. Additional projects found in 2013 State Rail Plan (ACE Improvements)
N/A Livermore to Pleasanton second main track and siding upgrades
N/A Alameda Rail New tracks and track upgrades
$11 N/A N/A
IRC61 IIIa. Additional projects found in Alameda CTC’s Northern California Goods Movement Projects List in Bay Area and sourced to the CCJPA FY08/09 – FY09/10 Business Plan, but not found in Plan Bay Area Projects List or CCJPA FY13-14 Plan
N/A High-Level Benicia‐Martinez Rail Crossing and Viaduct
Construct new or modify existing drawbridge structure so that Capitol Corridor trains are no longer subject to delays from bridge lifts for maritime ship traffic.
Contra Costa/Solano
Rail Rail bridge $1,200 N/A N/A
IRC65 IIIa. Additional projects found in Alameda CTC’s Northern California Goods Movement Projects List in Bay Area and sourced to CCJPA FY08/09 – FY09/10 Business Plan, but not found in CCJPA FY13-14 Plan
N/A Pinole‐Martinez Curve Realignment Realign the rail track curves along the San Pablo Bay and as practicable, add new bridges and earthwork to increase speeds.
Contra Costa Rail Rail realignment $279 N/A N/A
IRC62 IIIa. Additional projects found in Alameda CTC’s Northern California Goods Movement Projects List in Bay Area and sourced to TCIF Tier 2
N/A Alameda Creek Bridge Short-haul rail alignment option – provides connection at Niles Junction to the Oakland Sub separating passenger and freight service. No match – was originally included as part of the Dumbarton Rail project, but there is no funding available.
Alameda/ San Joaquin
Rail Rail realignment $32 N/A N/A
IRC66 IIIb. Additional projects found in Alameda CTC’s Northern California Goods Movement Projects List outside Bay Area and sourced to State Rail Plan (ACE Improvements)
N/A Stockton to Lathrop to Tracy track improvements (track realignment, siding extension, and curve realignment)
N/A San Joaquin Rail Rail realignment $15 N/A N/A
IRC64 IV. Additional projects found in 2013 State Rail Plan (CCJPA Improvements)
N/A Niles Junction bypass N/A Alameda Rail Rail realignment $77 N/A N/A

San Francisco Bay Area Freight Mobility Study Appendix
California Department of Transportation A-25
GG Proj ID
IRC Proj ID
CIRN Proj ID
LMC Proj ID
UGMS Proj ID Source
RTP ID Project Title Project Description County Mode
Improvement Type
Total Cost Escalated
(in Millions)
Total Committed Escalated
(in Millions)
Total Discretionary
Escalated (in Millions)
IRC63 IV. Additional projects found in 2013 State Rail Plan (San Joaquin Improvements)
N/A Bixler Curve Realignment N/A Contra Costa Rail Rail realignment $18 N/A N/A
IRC67 IV. Additional projects found in 2013 State Rail Plan (ACE Improvements)
N/A Track realignment UPRR Oakland Sub MP 55.5 to MP 54.0
N/A Alameda Rail Rail realignment $11 N/A N/A
IRC68 IIIb. Additional projects found in Alameda CTC’s Northern California Goods Movement Projects List outside Bay Area and sourced to TCIF Tier 1 (Active), State Rail Plan (CCJPA Improvements)
N/A Sacramento Intermodal Track Relocation
Realignment of freight and passenger tracks to new rail corridor south of Central Shops. Project includes track work, operational and safety upgrades, passenger platforms and other facilities, walkways, street overcrossings (5th and 6th Streets), and pedestrian/bike and utility tunnels. The project is one of three major choke points on the Central Corridor. The new alignment will allow longer trains to be accommodated, thereby, increasing freight capacity. The new track configuration and separated passenger facility will improve safety. The relocation project will accommodate increased freight handling at the Port of Oakland.
Sacramento Rail Rail relocation $81 N/A N/A
LMC13 V. Additional projects found in Caltrans Freight Planning Factsheet
N/A Quint Street Lead Port of San Francisco Rail Access
Rail line relocation and improvement of a one-mile spur connecting Caltrain mainline track to Port’s rail yard.
San Francisco Rail Rail relocation $3 N/A N/A
IRC69 IIIa. Additional projects found in Alameda CTC’s Northern California Goods Movement Projects List in Bay Area and sourced to TCIF Tier 2 and Alameda CWTP, but not found in Plan Bay Area Projects List
230102 Oakland Subdivision acquisition (Fremont to Oakland)
Short-haul rail alignment option‐ links Niles Junction to Port of Oakland. The acquisition of ROW provides the opportunity to separate passenger and freight rail, and thus reduces these conflicts from Industrial Parkway in Hayward to the Shinn Yards in Fremont. Match would rely on larger Dumbarton project, which is underfunded and the project status unclear. Final cost is unclear as it will be a negotiation with UP. Not a top priority for the Port of Oakland. Cost estimate shown here is from CWTP. Additional info from RTP entry indicates ancillary benefits by acquiring the Oakland Subdivision from the UPRR, important ROW would be reserved for Dumbarton Rail Segment G, Capitol Corridor, Altamont Commuter Express, and California High-Speed Rail Altamont Corridor that would serve the Union City Intermodal Station. Further, it would reduce construction costs and facilitate the construction of East West Connector (former SR 84) and the Union City Intermodal Station. It would also reduce the cost of the BART seismic retrofit of its aerial structure in Union City, where it is immediately adjacent to the Oakland Subdivision. The Oakland Subdivision ROWs between the Hayward BART Station and Fruitvale BART Station would be used for the East Bay Greenway.
Alameda Rail Rail ROW acquisition
$135 $35 $100
IRC70 IIIa. Additional projects found in Alameda CTC’s Northern California Goods Movement Projects List in Bay Area and sourced to GMAP, SJV IRGMS, TCIF Tier 1 (Inactive); IV. Additional Projects found in 2013 State Rail Plan (ACE Improvements)
N/A ROW Purchase for future short-haul rail service (San Joaquin County Short-Haul Freight Project)
Acquisition of the UPRR Oakland Subdivision and ROW between Stockton and Niles Junction (Fremont). This is a critical step to allow for eventual short-haul rail service connecting the Central Valley to the Port. ACE match of $75 million from regional sales tax. UPRR negotiations ongoing; therefore, project cost in flux. ACE operates on this ROW; multiple benefits from ownership. GMAP recommended continued investment on the Altamont Rail Corridor; project provides foundation for rail shuttle.
Alameda/San Joaquin
Rail Rail ROW acquisition
$300 N/A N/A

San Francisco Bay Area Freight Mobility Study Appendix
A-26 California Department of Transportation
GG Proj ID
IRC Proj ID
CIRN Proj ID
LMC Proj ID
UGMS Proj ID Source
RTP ID Project Title Project Description County Mode
Improvement Type
Total Cost Escalated
(in Millions)
Total Committed Escalated
(in Millions)
Total Discretionary
Escalated (in Millions)
IRC72 IIIa. Additional projects found in Alameda CTC’s Northern California Goods Movement Projects List in Bay Area and sourced to GMAP
N/A Reestablish service between Martinez and Tracy over the Mococo Line
When combined with Sacramento or Fresno Subdivision between Sacramento and Tracy, could provide more circuitous alternative to Martinez Subdivision. Could reduce freight/passenger conflicts or provide back‐up route if Martinez bridge over Carquinez needs closure.
Contra Costa/San Joaquin
Rail Rail service $29 N/A N/A
IRC71 IIIa. Additional projects found in Alameda CTC’s Northern California Goods Movement Projects List in Bay Area and sourced to SJV IRGMS, related TCIF Tier 1 (Inactive)
N/A California Interregional Intermodal Service (CIRIS) Inland Rail Shuttle
Short-haul rail between Central Valley and Port of Oakland. Requires ROW acquisition and contracted operator. Envisioned as PPP. ACCMA participated in a feasibility study for this service in 2000s.
Alameda/San Joaquin/
Stanislaus/Fresno/Tulare/Kings/Kern
Rail Rail service $12 N/A N/A
CIRN84 V. Additional projects found in Caltrans Freight Planning Factsheet
N/A BART Air Freight Utilize BART light-rail system to transport air freight in off-peak hours to/from San Francisco International Airport.
Bay Area Region/Multicounty
Rail Rail service N/A N/A N/A
IRC73 IIIb. Additional projects found in Alameda CTC’s Northern California Goods Movement Projects List outside Bay Area and sourced to State Rail Plan (ACE Improvements), Altamont Corridor Study
N/A Connection from UPRR Fresno Sub to UPRR Oakland Sub in Lathrop
N/A San Joaquin Rail Rail to rail interchange
$7 N/A N/A
IRC74 IIIa. Additional projects found in Alameda CTC’s Northern California Goods Movement Projects List in Bay Area and sourced to CCJPA FY08/09 – FY09/10 Business Plan, but not found in CCJPA FY13-14 Plan
N/A Bahia‐Benicia Second Main Track Project
Construct a second main line between two adjacent yards adjacent to the wetland to relieve main line switching moves from the two yards
Solano Rail Rail yard new tracks
$28 N/A N/A
IRC77 IV. Additional projects found in 2013 State Rail Plan (San Joaquin Improvements)
N/A Corridor-wide Signal upgrades (90 mph) N/A Contra Costa/San Joaquin/Stanislaus/
Merced/Madera/Fresno/Kings/Tulare/Kern
Rail Signal upgrade $55 N/A N/A
IRC76 IV. Additional projects found in 2013 State Rail Plan (San Joaquin Improvements)
N/A Positive Train Control (Port Chicago to Bakersfield)
N/A Contra Costa/San Joaquin/Stanislaus/
Merced/Madera/Fresno/Kings/Tulare/Kern
Rail Signal upgrade $25 N/A N/A
IRC75 IV. Additional projects found in 2013 State Rail Plan (ACE Improvements)
N/A Lathrop to Niles Junction signal upgrades
N/A Alameda/San Joaquin
Rail Signal upgrade $4 N/A N/A
IRC78 I. Plan Bay Area Projects List (downloaded on Oct 1, 2013)
240738 Martinez Rail Corridor improvements N/A Contra Costa Rail Track & signal upgrades
$36 $36 $ –

San Francisco Bay Area Freight Mobility Study Appendix
California Department of Transportation A-27
GG Proj ID
IRC Proj ID
CIRN Proj ID
LMC Proj ID
UGMS Proj ID Source
RTP ID Project Title Project Description County Mode
Improvement Type
Total Cost Escalated
(in Millions)
Total Committed Escalated
(in Millions)
Total Discretionary
Escalated (in Millions)
IRC82 IV. Additional Projects found in 2013 State Rail Plan (San Joaquin Improvements)
N/A Extension of Pittsburg siding N/A Contra Costa Rail Track extension N/A N/A N/A
IRC81 IV. Additional Projects found in 2013 State Rail Plan (San Joaquin Improvements)
N/A Extension of Orwood siding N/A Contra Costa Rail Track extension $20 N/A N/A
IRC79 IV. Additional Projects found in 2013 State Rail Plan (ACE Improvements), Altamont Corridor Study
N/A Extension of Altamont siding Track realignment, Remove permanent “shoefly.” Alameda Rail Track extension $10 N/A N/A
IRC80 IV. Additional Projects found in 2013 State Rail Plan (ACE Improvements), Altamont Corridor Study
N/A Extension of Midway siding N/A Alameda/San Joaquin
Rail Track extension $10 N/A N/A
IRC86 IIIa. Additional projects found in Alameda CTC’s Northern California Goods Movement Projects List in Bay Area and sourced to CCJPA FY08/09 – FY09/10 Business Plan, but not found in CCJPA FY13-14 Plan
N/A Oakland-Martinez Track Improvement Replace and upgrade track infrastructure (rail, subgrade, ties, and drainage ditches) to maintain travel times, ride quality, and system reliability.
Alameda Rail Track upgrade $75 N/A N/A
IRC92 IIIa. Additional projects found in Alameda CTC’s Northern California Goods Movement Projects List in Bay Area and sourced to CCJPA FY08/09 – FY09/10 Business Plan, but not found in CCJPA FY13-14 Plan
N/A Solano‐Yolo County Track Improvements
Complete siding extensions or install additional crossovers to increase track capacity and reliability.
Solano/Yolo Rail Track upgrade $19 N/A N/A
IRC89 IIIa. Additional projects found in Alameda CTC’s Northern California Goods Movement Projects List in Bay Area and sourced to Altamont Corridor Study
N/A Upgrade Random Siding to Mainline standards
Capacity/reliability benefits for ACE rail. Alameda/San Joaquin
Rail Track upgrade $7 N/A N/A
IRC90 IIIb. Additional projects found in Alameda CTC’s Northern California Goods Movement Projects List outside Bay Area and sourced to CCJPA FY08/09 – FY09/10 Business Plan
N/A Roseville‐Auburn Track Improvement Program
Extend sidings, add track, and install crossovers, which will allow for more service to Auburn and decrease travel times.
Placer Rail Track upgrade $32 N/A N/A

San Francisco Bay Area Freight Mobility Study Appendix
A-28 California Department of Transportation
GG Proj ID
IRC Proj ID
CIRN Proj ID
LMC Proj ID
UGMS Proj ID Source
RTP ID Project Title Project Description County Mode
Improvement Type
Total Cost Escalated
(in Millions)
Total Committed Escalated
(in Millions)
Total Discretionary
Escalated (in Millions)
IRC83 IIIb. Additional projects found in Alameda CTC’s Northern California Goods Movement Projects List outside Bay Area and sourced to GMAP
N/A Track and signal improvements, Bakersfield to Stockton.
N/A San Joaquin/Stanislaus/Fresno/Tulare/Kings/Kern
Rail Track upgrade $36 N/A N/A
IRC85 IV. Additional projects found in 2013 State Rail Plan (CCJPA Improvements)
N/A Niles Subdivision third main track (Niles Junction to Newark Junction or Shinn Connection to Newark Junction)
N/A Alameda Rail Track upgrade N/A N/A N/A
IRC84 IV. Additional projects found in 2013 State Rail Plan (CCJPA Improvements)
N/A Niles Canyon Railroad mainline track upgrade (New Niles Way to former SP mainline at CP Hears) and Random second main track upgrade on UPRR Oakland Sub
N/A Alameda Rail Track upgrade $46 N/A N/A
IRC91 IV. Additional projects found in 2013 State Rail Plan (CCJPA Improvements), CCJPA FY08/09 – FY09/10 Business Plan
N/A Sacramento‐Martinez Track Improvement Program
Upgrade track infrastructure to maintain travel times, ride quality, and system reliability.
Solano/Yolo/Sacramento
Rail Track upgrade $42 N/A N/A
IRC87 IV. Additional projects found in 2013 State Rail Plan (CCJPA Improvements), CCJPA FY08/09 – FY09/10 Business Plan
N/A Oakland‐San Jose Track Improvement Program
Replace and upgrade track infrastructure (rail, subgrade, and ties) to maintain travel times, ride quality, and system reliability
Alameda/Santa Clara
Rail Track upgrade $19 N/A N/A
IRC88 IV. Additional projects found in 2013 State Rail Plan (CCJPA Improvements), CCJPA FY08/09 – FY09/10 Business Plan
N/A Oakland‐San Jose Track Improvement Program, Phase 2
N/A Alameda/Santa Clara
Rail Track upgrade $19 N/A N/A
IRC93 IV. Additional projects found in 2013 State Rail Plan (Trade Corridor Improvements), TCIF Tier 1 (active)
N/A Martinez/Richmond Rail Connector Provides more efficient rail operations along the BNSF Stockton Subdivision and UPRR Martinez Subdivision north of downtown Richmond. Currently, BNSF trains have to travel through downtown Richmond to reach the Port of Oakland because there is no connector to the UPRR tracks that provides a more direct route to the Port. The UPRR Martinez Subdivision through Richmond has significantly fewer at‐grade crossings and is shorter. A connector would relieve traffic congestion at nine at‐grade crossings in downtown Richmond. The project would reduce the need for BNSF trains to use tracks north of Richmond on the Martinez Subdivision, freeing up capacity and reducing conflicts for both UPRR and passenger trains.
Contra Costa Rail Tracks connection $22 $11 $11
IRC94 IV. Additional projects found in 2013 State Rail Plan (San Joaquin Improvements)
N/A Port Chicago to Pittsburg transfer modifications (BNSF/UPRR track connection)
N/A Contra Costa Rail Tracks connection $18 N/A N/A

San Francisco Bay Area Freight Mobility Study Appendix
California Department of Transportation A-29
GG Proj ID
IRC Proj ID
CIRN Proj ID
LMC Proj ID
UGMS Proj ID Source
RTP ID Project Title Project Description County Mode
Improvement Type
Total Cost Escalated
(in Millions)
Total Committed Escalated
(in Millions)
Total Discretionary
Escalated (in Millions)
IRC95 IV. Additional projects found in 2013 State Rail Plan (CCJPA Improvements)
N/A Newark‐Albrae siding connection and south switching lead Extension for Newark yard
N/A Alameda Rail Tracks connection and track extension
$23 N/A N/A
IRC15 IIIa. Additional projects found in Alameda CTC’s Northern California Goods Movement Projects List in Bay Area and sourced to CCJPA FY08/09 – FY09/10 Business Plan, but not found in CCJPA FY13-14 Plan
N/A Oakland‐Pinole 3rd Track Reactivate and extend 3rd main line track from Port of Oakland to Point Pinole.
Alameda/Contra Costa
Rail Tracks reactivation $32 N/A N/A
GG4 IRC5 I. Plan Bay Area Projects List (downloaded on Oct 1, 2013)
240739 Dredge Channel to Port of Stockton N/A Solano Water Channel dredging $18 $18 $ –
GG6 IRC7 IIIb. Additional projects found in Alameda CTC’s Northern California Goods Movement Projects List outside Bay Area and sourced to TCIF Tier 1 (Active)
N/A Port of Sacramento Dredging (Sacramento River Deep Water Channel Project)
Involves the dredging of 35 miles of the Sacramento River deep water channel from Suisun Bay to Yolo County an additional five feet in depth (from 30 feet to 35 feet).
Yolo Water Channel dredging N/A N/A N/A
GG5 IRC6 V. Additional Projects found in Caltrans Freight Planning Factsheet
N/A Dredge Channel to Port of Redwood City
Deepen and improve Redwood City Channel and San Bruno Channel to a depth of 34 to 35 feet.
San Mateo Water Channel dredging N/A N/A N/A
GG12 V. Additional Projects found in Caltrans Freight Planning Factsheet
N/A Cargo capacity enhancement at Port of Redwood City
Upland improvements including new utilities, paving, drainage, and seawall will increase capacity to handle and store dry bulk cargo.
San Mateo Port Port storage facilities
N/A N/A N/A
GG14 V. Additional Projects found in Caltrans Freight Planning Factsheet
N/A Pier 96 Proposed Bulk Export Terminal Developing and operating a bulk marine cargo-handling terminal on approximately 15 acres of open land with direct berthing access located at the Port’s Pier 96. Additional land on the Port’s adjacent Backlands area may also be made available for lease to support the cargo handling operation.
San Francisco Port Port terminal facilities
N/A N/A N/A
GG13 V. Additional Projects found in Caltrans Freight Planning Factsheet, Port of Redwood City Newsletter, Currents, August 2013 Edition
N/A Redevelopment of Wharves 1 and 2 at Port of Redwood City
Reconstruction of Wharves 1 and 2 at Port of Redmond City with a new concrete wharf measuring 425 feet by 70 feet meeting current seismic standards is due to be completed by the end of 2013. The new wharf will increase current ship capacity from one to two ships docked simultaneously.
San Mateo Port Port terminal facilities
$17 N/A N/A
GG1 V. Additional Projects found in Caltrans Freight Planning Factsheet
N/A Construction of new cargo airline facilities at Mineta San Jose International Airport
Construction of new cargo airline facilities at or adjacent to existing east side cargo airline areas, including up to 1.2 million square feet of ramp, building, and vehicle parking/movement space.
Santa Clara Airport Airport airline facilities
N/A N/A N/A
GG2 V. Additional Projects found in Caltrans Freight Planning Factsheet
N/A Relocation of belly-freight facilities at Mineta San Jose International Airport
Relocation/expansion of belly-freight facilities to new site(s) on east side of SJC, including up to 93,000 square feet of building and vehicle parking/movement space.
Santa Clara Airport Airport airline facilities relocation
N/A N/A N/A
GG3 V. Additional Projects found in Caltrans Freight Planning Factsheet
N/A San Francisco International Airport Cargo Storage Capacity Enhancement
Replacement and expansion of warehouse and office space at the corner of West Field and West Cargo Roads near San Francisco International Airport
San Mateo Airport Airport storage facilities
N/A N/A N/A

San Francisco Bay Area Freight Mobility Study Appendix
A-30 California Department of Transportation
GG Proj ID
IRC Proj ID
CIRN Proj ID
LMC Proj ID
UGMS Proj ID Source
RTP ID Project Title Project Description County Mode
Improvement Type
Total Cost Escalated
(in Millions)
Total Committed Escalated
(in Millions)
Total Discretionary
Escalated (in Millions)
GG8 IIIb. Additional projects found in Alameda CTC’s Northern California Goods Movement Projects List outside Bay Area and sourced to TCIF Tier 1 (Inactive), SJV IRGMS, GMAP
N/A Shafter Intermodal Rail Facility Short-haul rail terminus option. New intermodal facility in Shafter to serve future short-haul rail operation.
Kern Intermodal New intermodal facility
$30 N/A N/A
GG7 IIIb. Additional projects found in Alameda CTC’s Northern California Goods Movement Projects List outside Bay Area and sourced to TCIF Tier 1 (Inactive), SJV IRGMS, GMAP
N/A Short-haul terminus at Crows Landing (San Joaquin Valley Short-Haul Rail/Inland Port Project)
Development of an inland port logistics center at Crows Landing Air Facility and the construction of a short‐haul rail service. The project includes railroad right‐of‐way acquisition and construction of 170-acre rail intermodal facility that provides for the loading and unloading of containers from railcars. Private developer contributing to match; value of county land committed to project proposed as additional match source. Requires either operating rights from UPRR along the Coast Subdivision or investments along East Bay (Oakland Subdivision ROW purchase and Alameda Creek improvements) connecting to the Port of Oakland, as well as access to intermodal facility at Port – timing and feasibility of which are unclear. Requires Niles Subdivision ROW purchase from Stockton to Fremont for mainline rail connection. Operating subsidy required.
Stanislaus Intermodal New intermodal facility
$52 N/A N/A
GG9 IRC43 I. Plan Bay Area Projects List (downloaded on Oct 1, 2013)
22760 Construct Outer Harbor Intermodal Terminal (OHIT) on former Oakland Army Base at 7th Street/Maritime Street (includes expanded intermodal terminal for the Port, warehouses, and truck parking lot)
The OHIT, a proposed intermodal rail facility and surrounding trade and logistics park, is planned to be located on the former Oakland Army Base. The proposed OHIT project will provide an expanded intermodal terminal for the Port, warehouses, a truck parking lot, and other improvements in and around the former Oakland Army Base. The project is bounded by 7th Street to the south, Maritime Street to the west, the EBMUD wastewater treatment plant to the north, and UPRR ROW to the east.
Alameda Intermodal New intermodal yard, warehousing,
truck parking
$326 $257 $70
IRC60 LMC12 I. Plan Bay Area Projects List (downloaded on Oct 1, 2013)
240024 Implement Oakland Army Base infrastructure improvements (includes reconstructing Maritime Street, realigning Burma Road and Wake Avenue)
Infrastructure improvements at the former Army Base include reconstructing Maritime Street to permit direct access between the marine terminals west of Maritime and the railyard to the east; realigning Burma Road and Wake Avenue to improve circulation and land utilization at the Army Base; a new access road to reduce traffic conflicts between port-related truck traffic and visitors to the planned regional park at the east touchdown of the San Francisco-Oakland Bay Bridge; and replacement of utilities in the public right-of-ways to enable development of the Army Base.
Alameda Intermodal Port of Oakland and Oakland Army
Base Access
$215 $97 $118
GG – Global Gateway; IRC – Interregional Corridors; CIRN – Core Intraregional Network; LMC – Last-Mile Connectors; and UGMS – Urban Goods Movement System.
Source: MTC and ABAG’s 2040 Plan Bay Area; 2013 California Rail Plan; 2009 Trade Corridor Improvement Fund (TCIF) update; 2007 California Goods Movement Action Plan; Caltrans Freight Planning Factsheets for Bay Area Ports and Airports; Port web sites; and Airport web sites.