improving freight mobility in a changing international...
TRANSCRIPT
Improving Freight Mobility in a Changing International
Environment
Jeff HellerNorfolk Southern Corp.
October 3, 2007
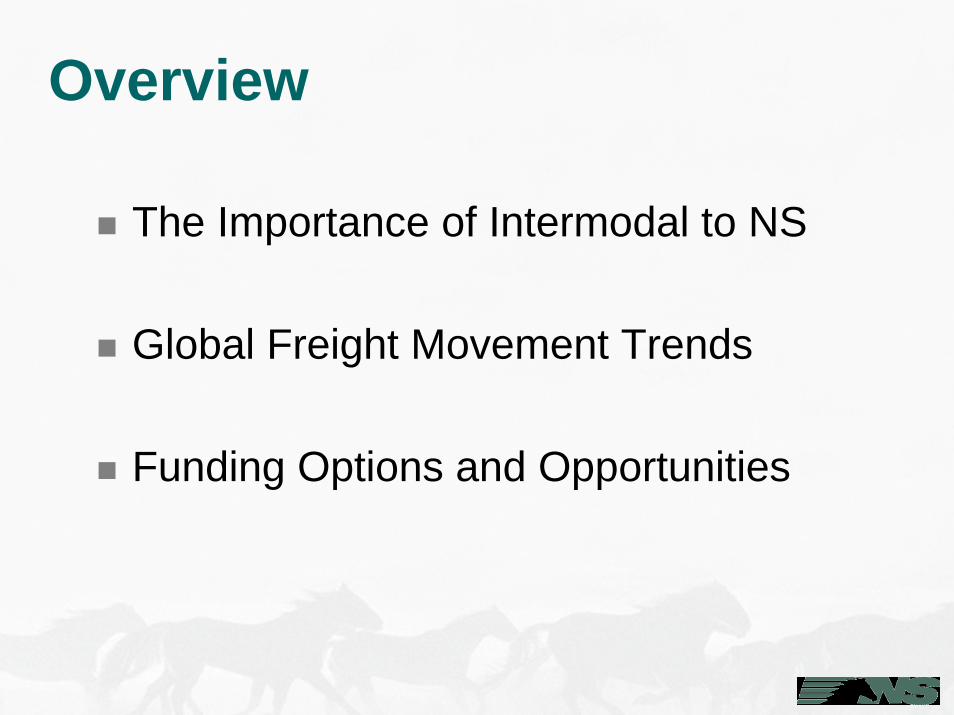
Overview
The Importance of Intermodal to NS
Global Freight Movement Trends
Funding Options and Opportunities
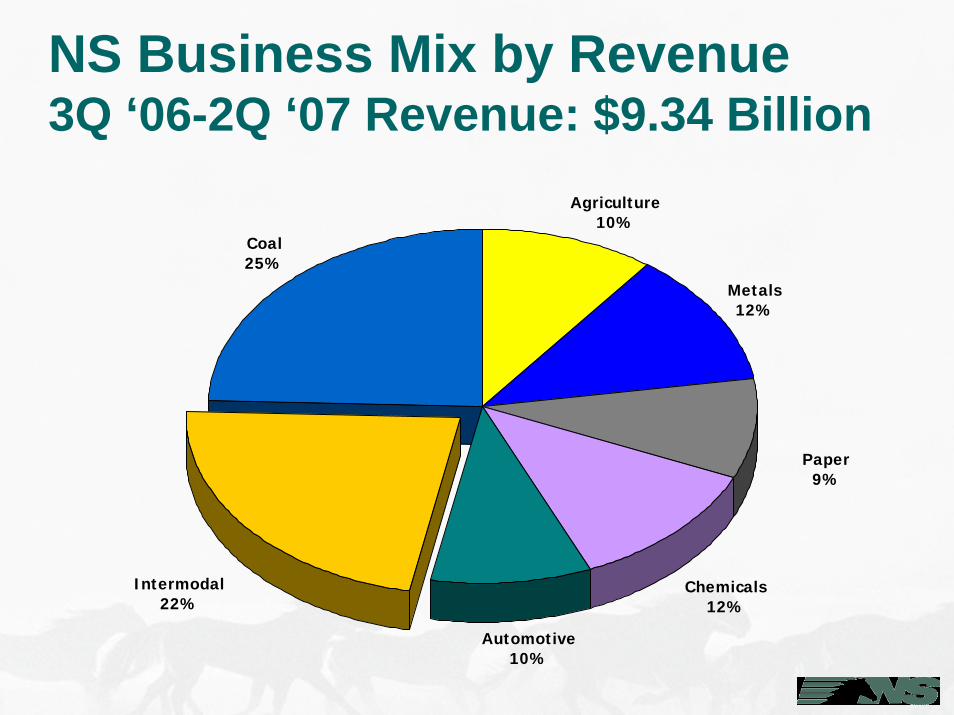
NS Business Mix by Revenue3Q ‘06-2Q ‘07 Revenue: $9.34 Billion
Agriculture10%
Metals12%
Chemicals12%
Automotive10%
Coal25%
Intermodal22%
Paper9%
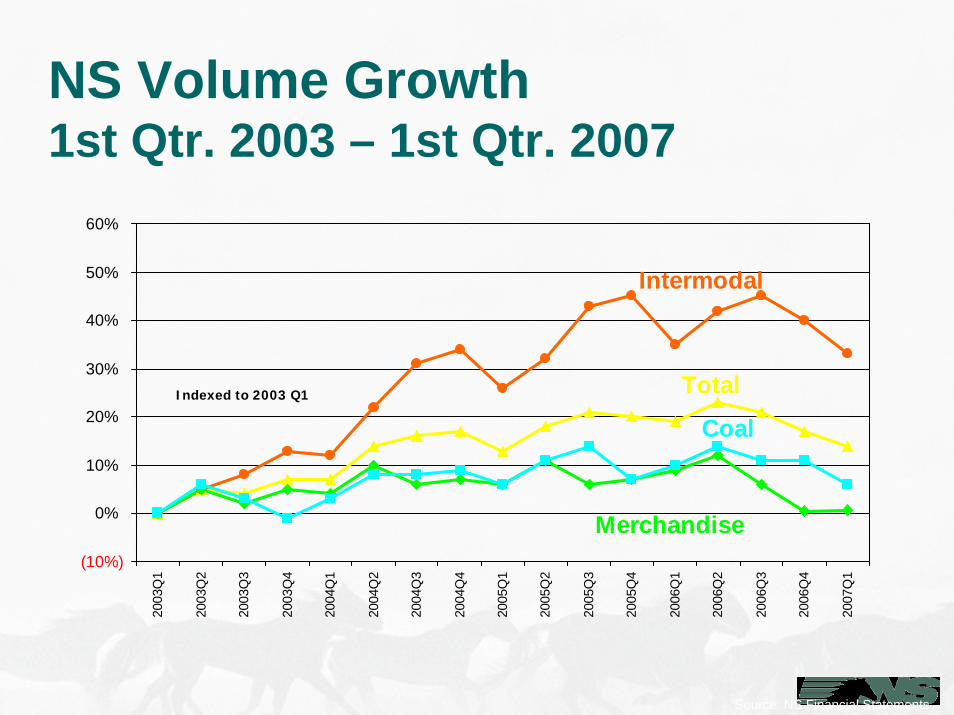
NS Volume Growth1st Qtr. 2003 – 1st Qtr. 2007
Total
Intermodal
Merchandise
Coal
(10%)
0%
10%
20%
30%
40%
50%
60%
2003
Q1
2003
Q2
2003
Q3
2003
Q4
2004
Q1
2004
Q2
2004
Q3
2004
Q4
2005
Q1
2005
Q2
2005
Q3
2005
Q4
2006
Q1
2006
Q2
2006
Q3
2006
Q4
2007
Q1
Indexed to 2003 Q1
Source: NS Financial Statements
900,000
1,400,000
1,900,000
2,400,000
2,900,000
3,400,000
First 12Months
2000 2001 2002 2003 2004 2005 2006 ThruAug.2007NS CSXT
51%
Gro
wth
7% G
rowth
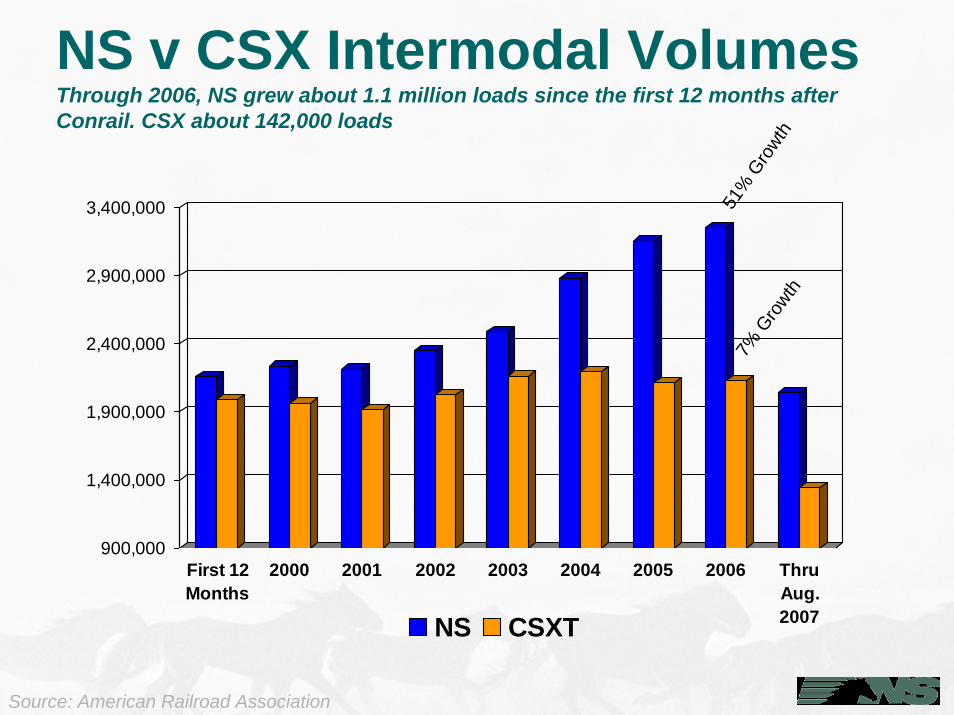
NS v CSX Intermodal VolumesThrough 2006, NS grew about 1.1 million loads since the first 12 months after Conrail. CSX about 142,000 loads
Source: American Railroad Association
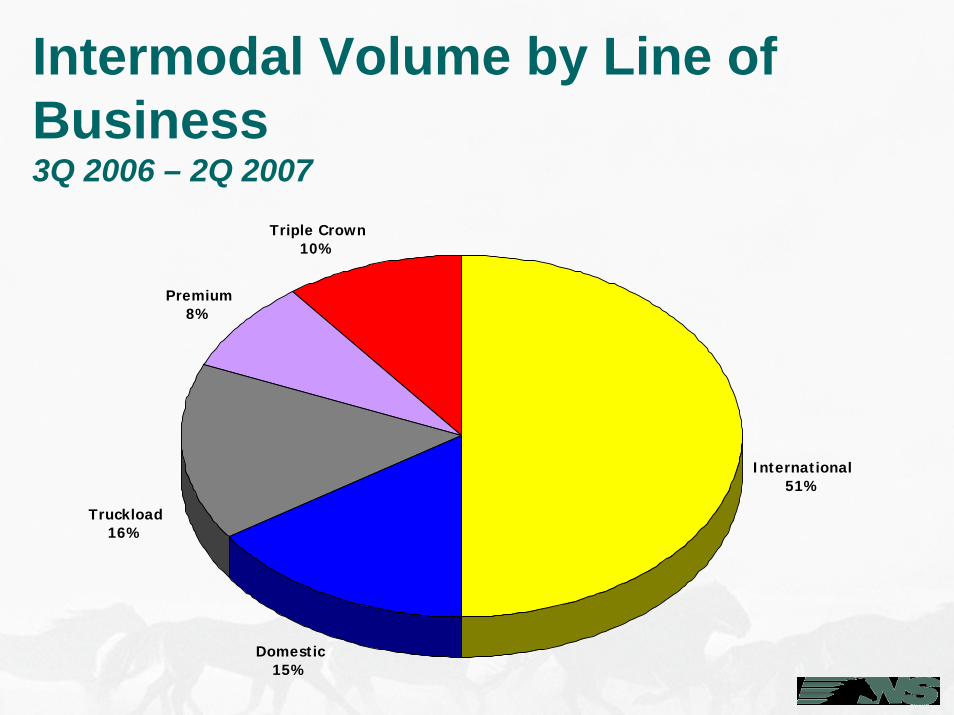
Intermodal Volume by Line of Business3Q 2006 – 2Q 2007
International51%
Domestic15%
Premium8%
Triple Crown10%
Truckload16%
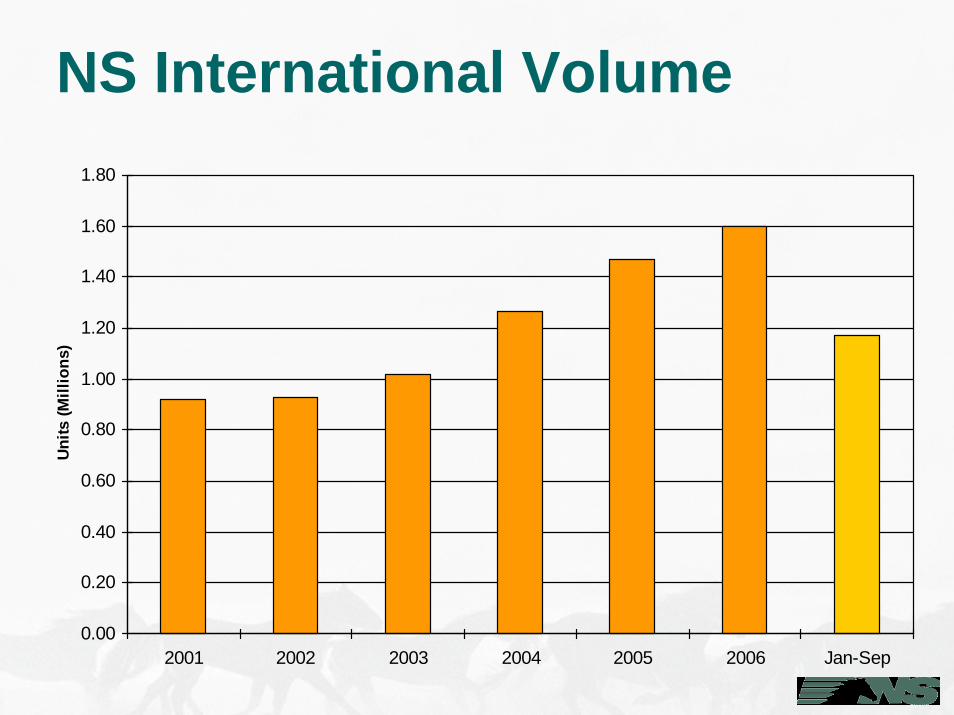
NS International Volume
0.00
0.20
0.40
0.60
0.80
1.00
1.20
1.40
1.60
1.80
2001 2002 2003 2004 2005 2006 Jan-Sep
Units
(Mill
ions
)
Freight Movement Trends
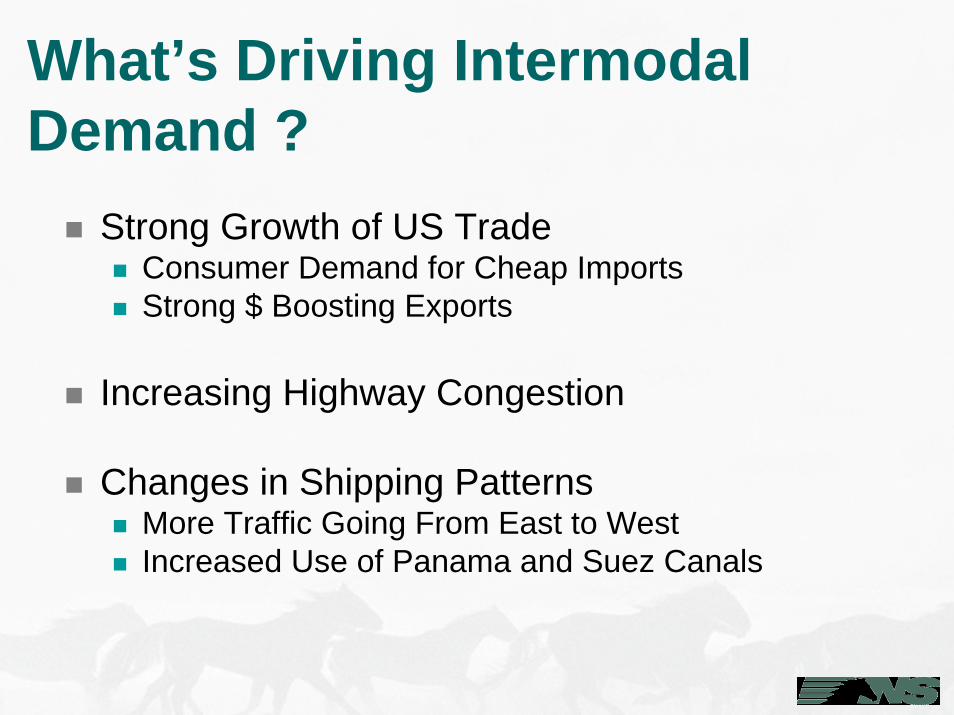
What’s Driving Intermodal Demand ?
Strong Growth of US TradeConsumer Demand for Cheap ImportsStrong $ Boosting Exports
Increasing Highway Congestion
Changes in Shipping PatternsMore Traffic Going From East to WestIncreased Use of Panama and Suez Canals
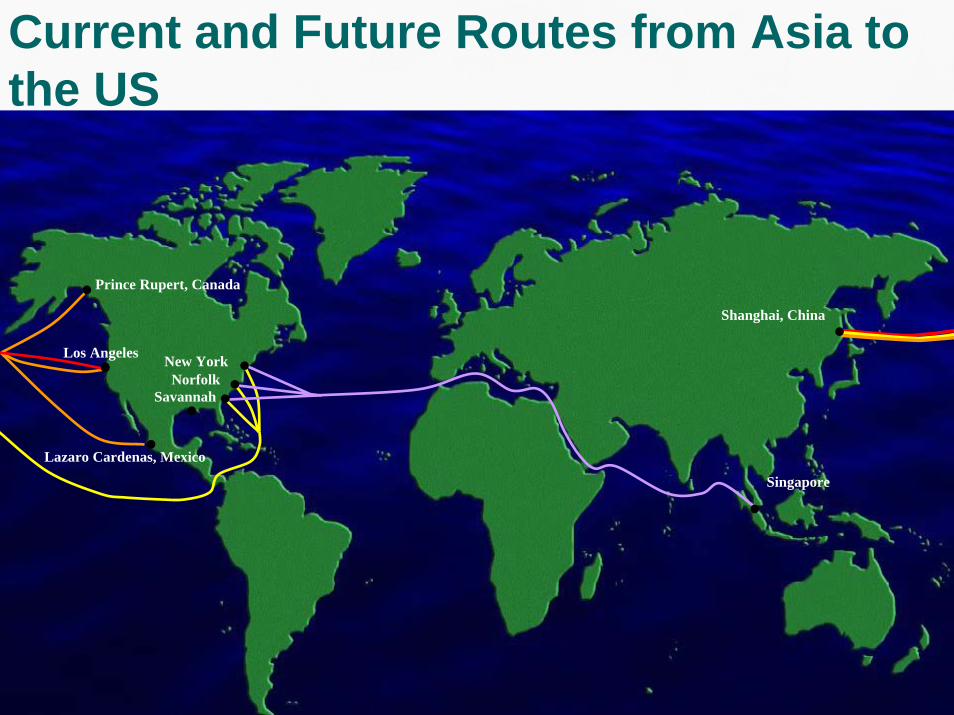
Prince Rupert, Canada
NorfolkNew York
Lazaro Cardenas, Mexico
Shanghai, China
Singapore
Savannah
Los Angeles
Current and Future Routes from Asia to the US

Westbound Forwarded Empty -33.4%
Transpacific Exports-2.3%
EC Exports +15.4%
EC Eastbound Empty+19.9%
NS International Volume FlowsJanuary - August 2007 vs. 2006
NS International Traffic with an
East Coast Focus
2006: 43%
2007: 49%
NS International Traffic with a
West Coast Focus
2006: 57%
2007: 51%
Transpacific Imports-7.6%
EC Imports +8.9%
Percent of port related volume, does not include business moving between two non-port locations.
New York
Baltimore
Norfolk
Philadelphia
Buffalo
Columbus
ClevelandDetroit
Louisville
Cincinnati
Pittsburgh
BostonAlbany
Charlotte
Charleston
Savannah
Jacksonville
Miami
AtlantaHuntsville
ChicagoPort of Oakland
Port of Long Beach
Port of Los Angeles
Ports of Seattle and Tacoma
Memphis
Dallas
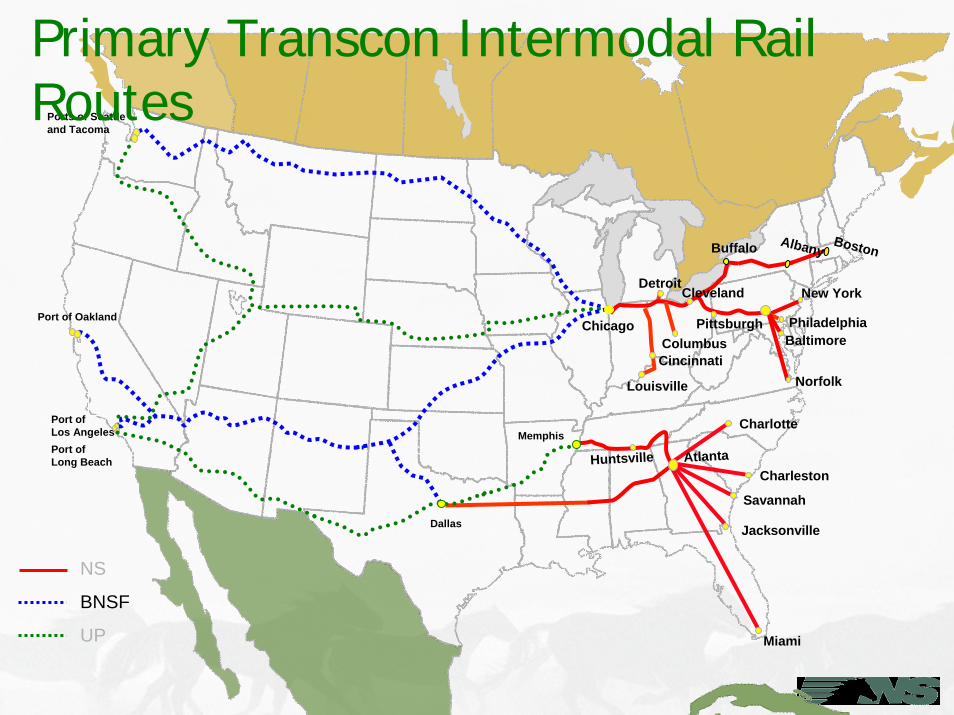
NS
BNSF
UP
Primary Transcon Intermodal Rail Routes

NS East Coast Port Services
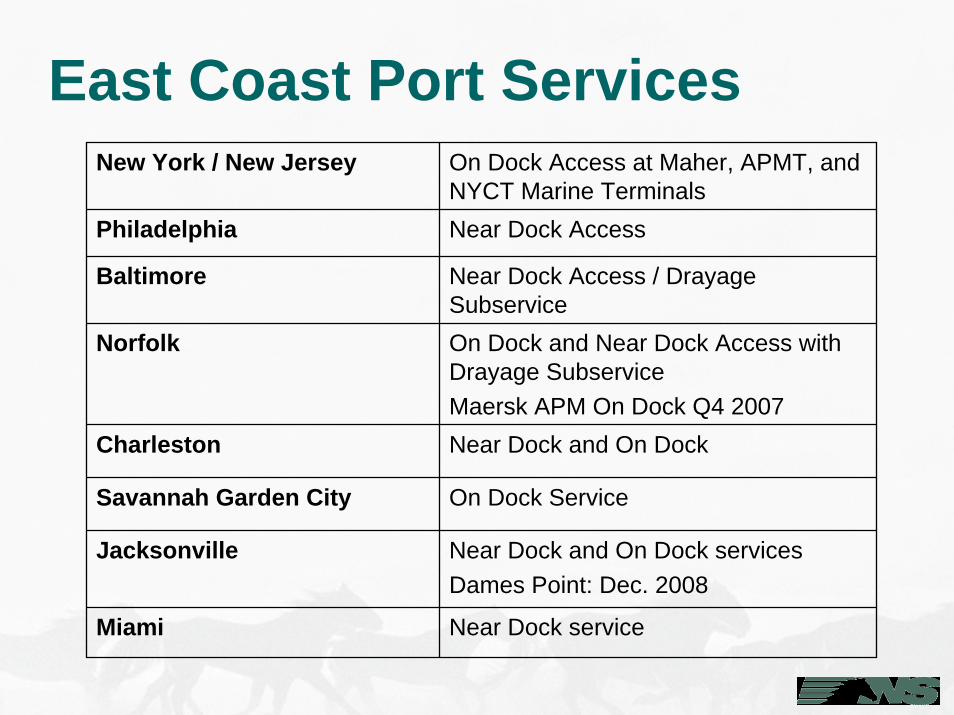
East Coast Port ServicesNew York / New Jersey On Dock Access at Maher, APMT, and
NYCT Marine TerminalsPhiladelphia Near Dock Access
Baltimore Near Dock Access / Drayage Subservice
Norfolk On Dock and Near Dock Access with Drayage SubserviceMaersk APM On Dock Q4 2007
Charleston Near Dock and On Dock
Savannah Garden City On Dock Service
Jacksonville Near Dock and On Dock servicesDames Point: Dec. 2008
Miami Near Dock service
Investment and Development
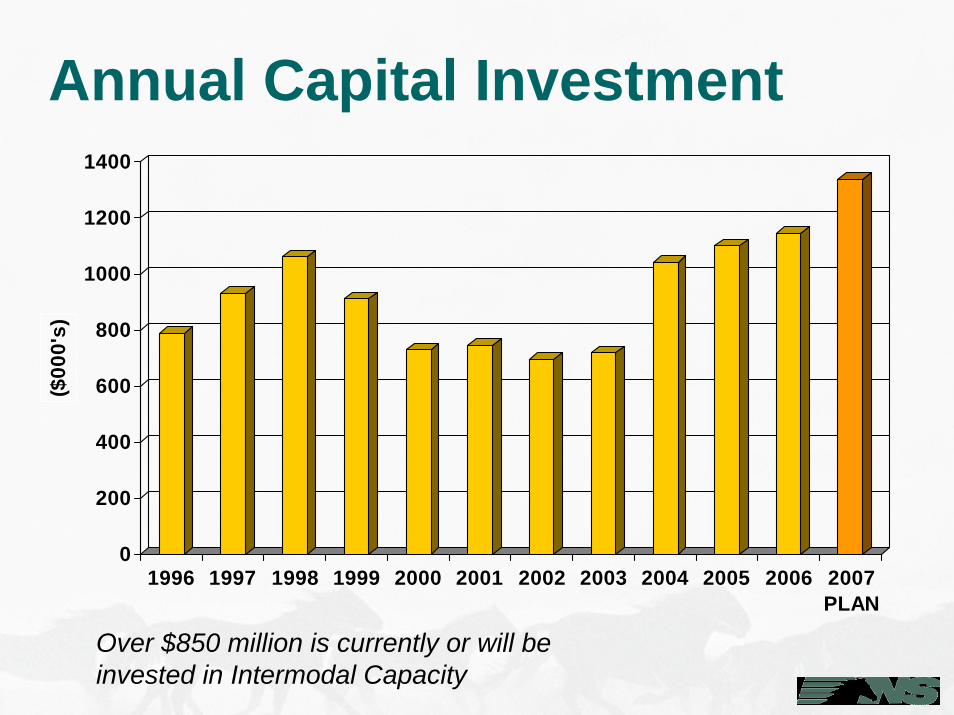
Annual Capital Investment
0
200
400
600
800
1000
1200
1400
($00
0's)
1996 1997 1998 1999 2000 2001 2002 2003 2004 2005 2006 2007PLAN
Over $850 million is currently or will be invested in Intermodal Capacity
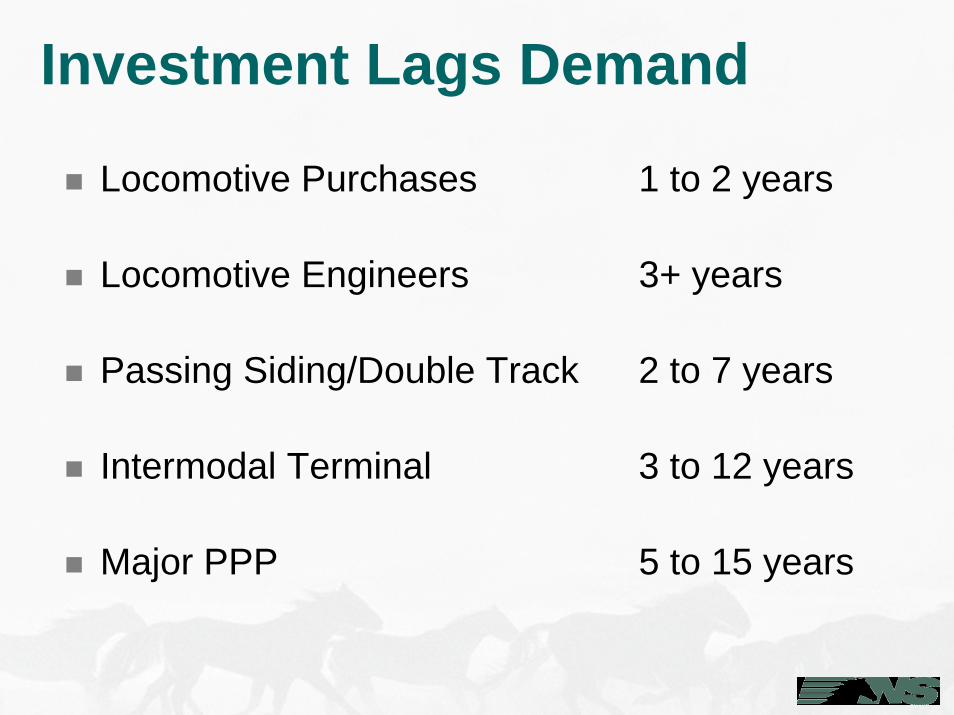
Investment Lags Demand
Locomotive Purchases 1 to 2 years
Locomotive Engineers 3+ years
Passing Siding/Double Track 2 to 7 years
Intermodal Terminal 3 to 12 years
Major PPP 5 to 15 years
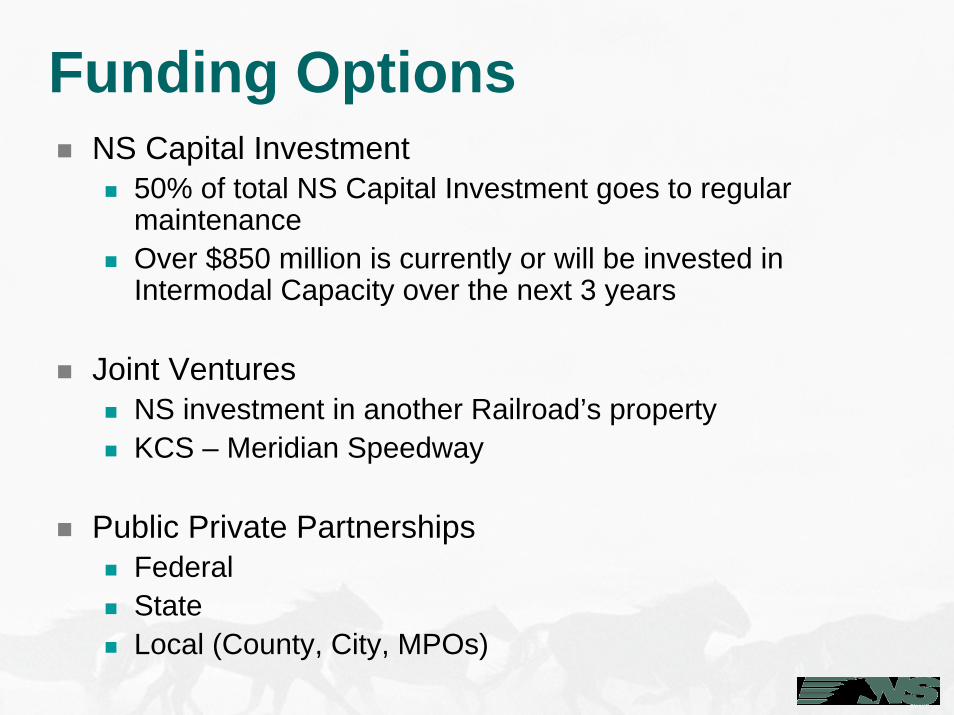
Funding OptionsNS Capital Investment
50% of total NS Capital Investment goes to regular maintenanceOver $850 million is currently or will be invested in Intermodal Capacity over the next 3 years
Joint VenturesNS investment in another Railroad’s propertyKCS – Meridian Speedway
Public Private PartnershipsFederalStateLocal (County, City, MPOs)
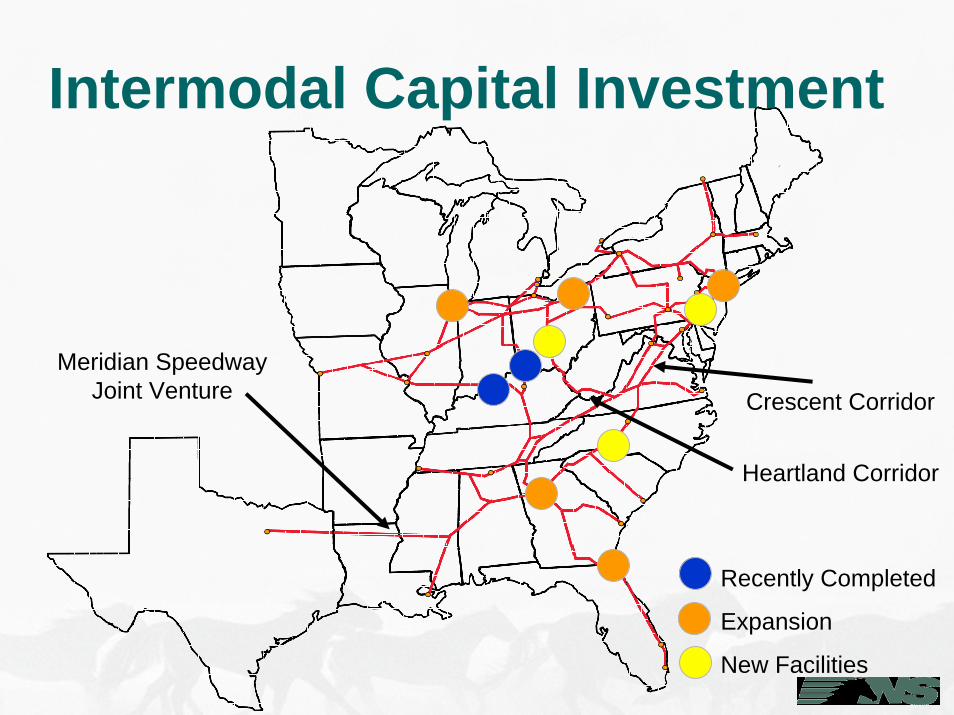
Intermodal Capital Investment
Meridian Speedway Joint Venture Crescent Corridor
Heartland Corridor
Recently Completed
Expansion
New Facilities

Corridor Capacity Projects
MemphisCharlotte
Atlanta
New Jersey
PhiladelphiaHarrisburg
Chicago
Kansas City
Buffalo
Cincinnati
Columbus
Dallas
Boston
Norfolk
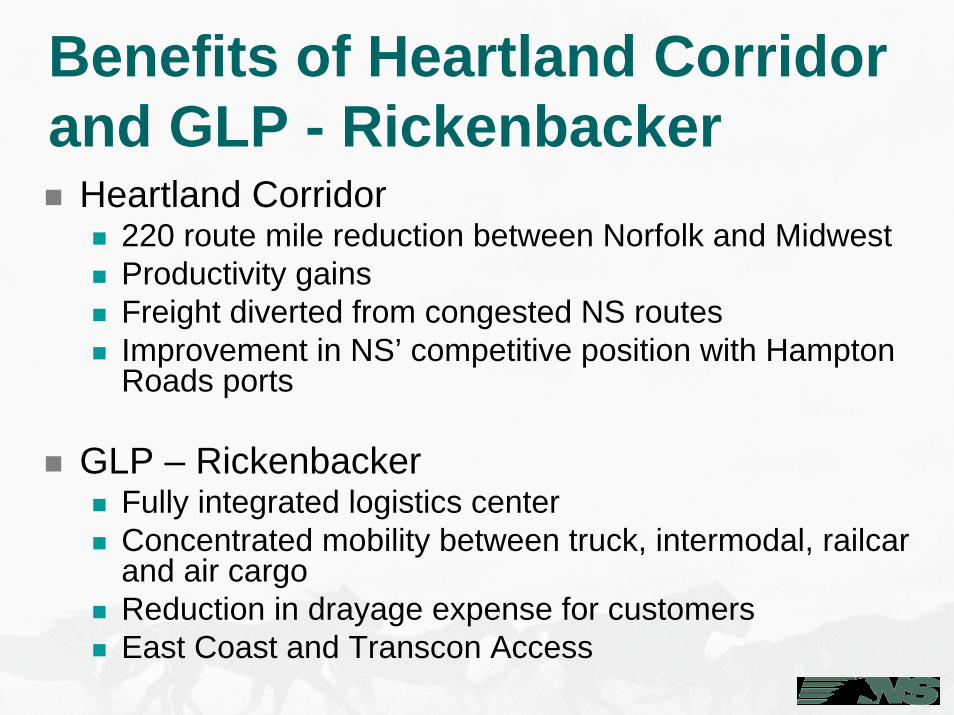
Benefits of Heartland Corridor and GLP - Rickenbacker
Heartland Corridor220 route mile reduction between Norfolk and MidwestProductivity gainsFreight diverted from congested NS routesImprovement in NS’ competitive position with Hampton Roads ports
GLP – RickenbackerFully integrated logistics centerConcentrated mobility between truck, intermodal, railcar and air cargoReduction in drayage expense for customersEast Coast and Transcon Access
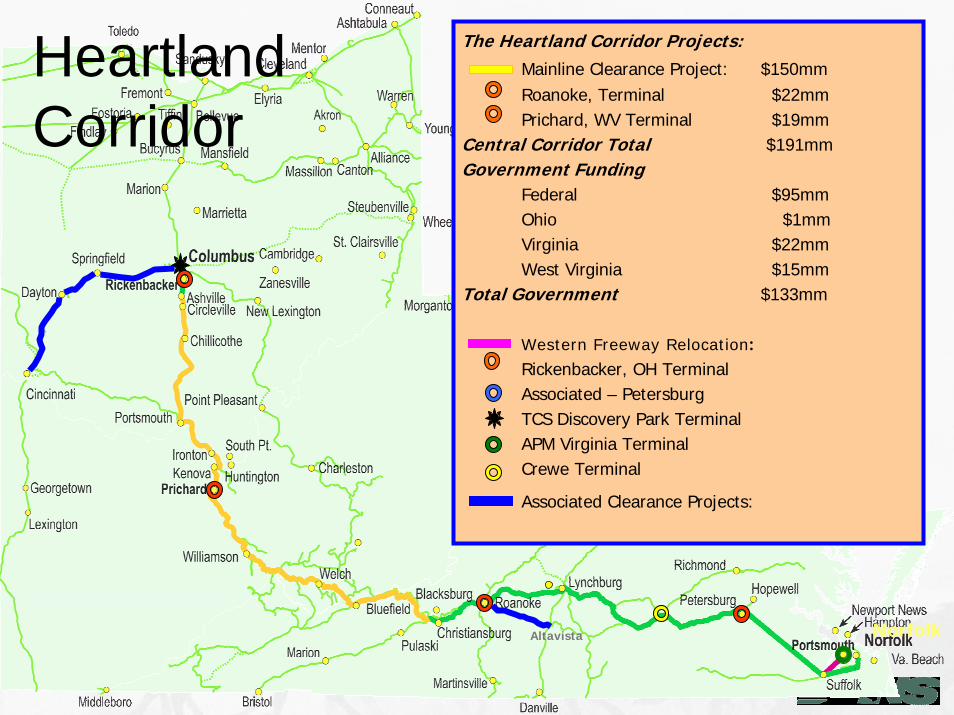
The Heartland Corridor Projects: Mainline Clearance Project: $150mmRoanoke, Terminal $22mmPrichard, WV Terminal $19mm
Central Corridor Total $191mmGovernment Funding
Federal $95mmOhio $1mmVirginia $22mmWest Virginia $15mm
Total Government $133mm
Western Freeway Relocation:
Rickenbacker, OH TerminalAssociated – Petersburg TCS Discovery Park TerminalAPM Virginia TerminalCrewe Terminal
Associated Clearance Projects:
Altavista Norfolk
Heartland Corridor
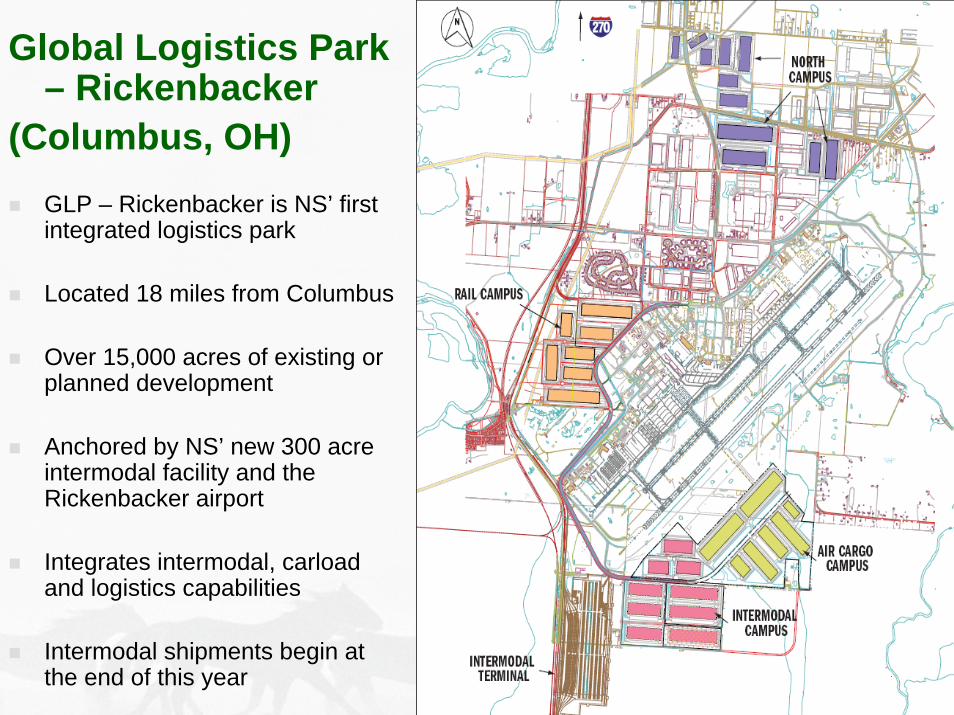
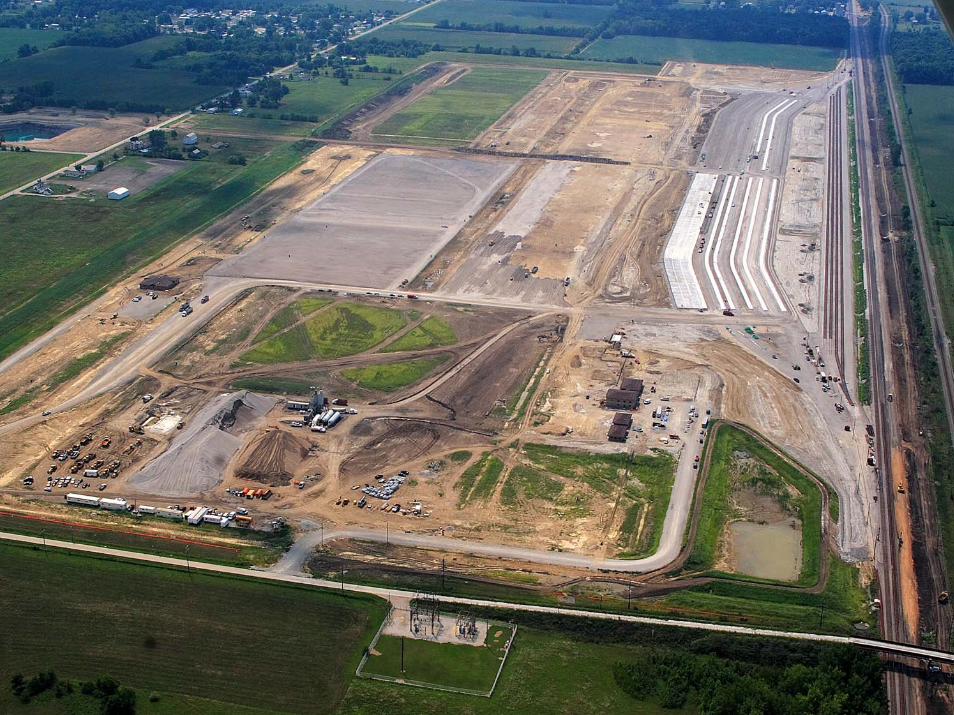
Global Logistics Park – Rickenbacker
(Columbus, OH)GLP – Rickenbacker is NS’ first integrated logistics park
Located 18 miles from Columbus
Over 15,000 acres of existing or planned development
Anchored by NS’ new 300 acre intermodal facility and the Rickenbacker airport
Integrates intermodal, carload and logistics capabilities
Intermodal shipments begin at the end of this year
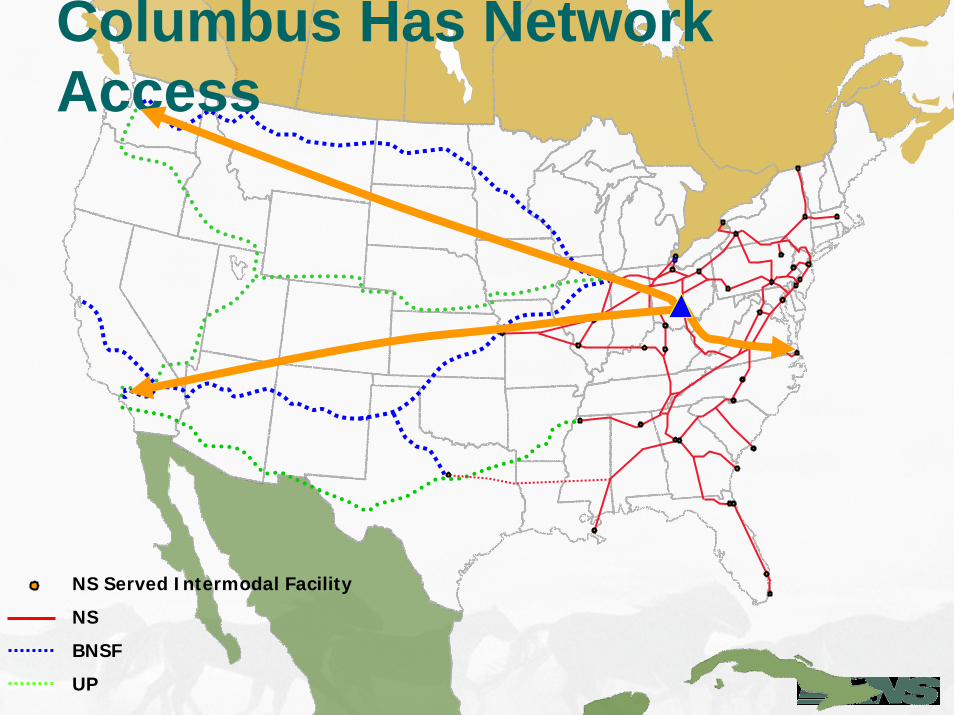
NS Served Intermodal Facility
NS
BNSF
UP
Columbus Has Network Access
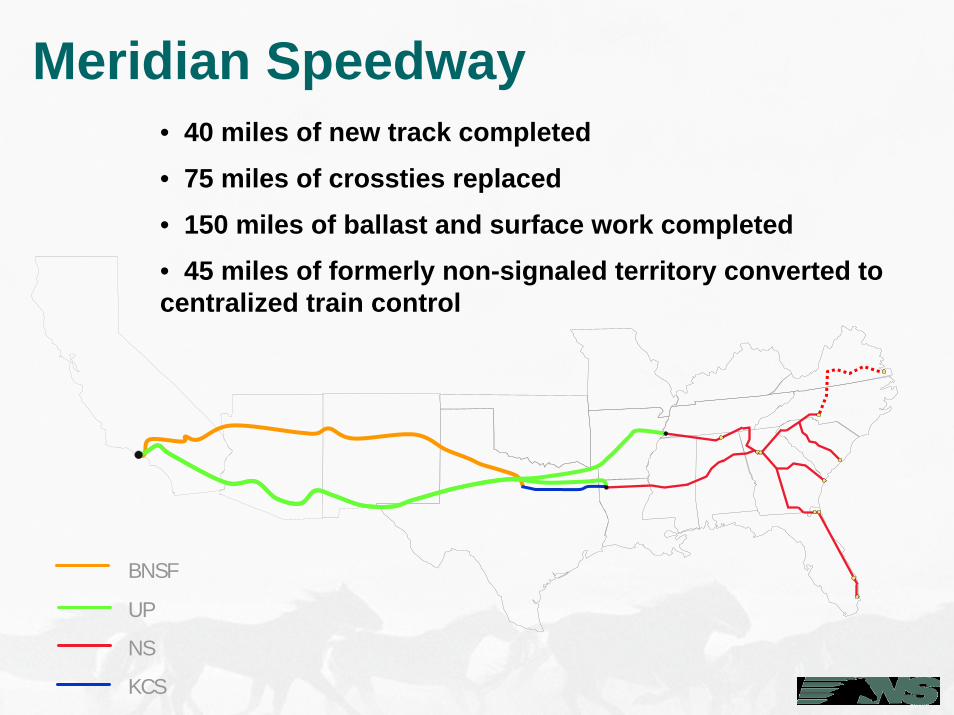
Meridian Speedway• 40 miles of new track completed
• 75 miles of crossties replaced
• 150 miles of ballast and surface work completed
• 45 miles of formerly non-signaled territory converted to centralized train control
BNSF
UP
NS
KCS
MemphisCharlotte
Atlanta
New Jersey
PhiladelphiaHarrisburg
Chicago
Kansas City
Buffalo
Cincinnati
Columbus
Dallas
Boston
Norfolk
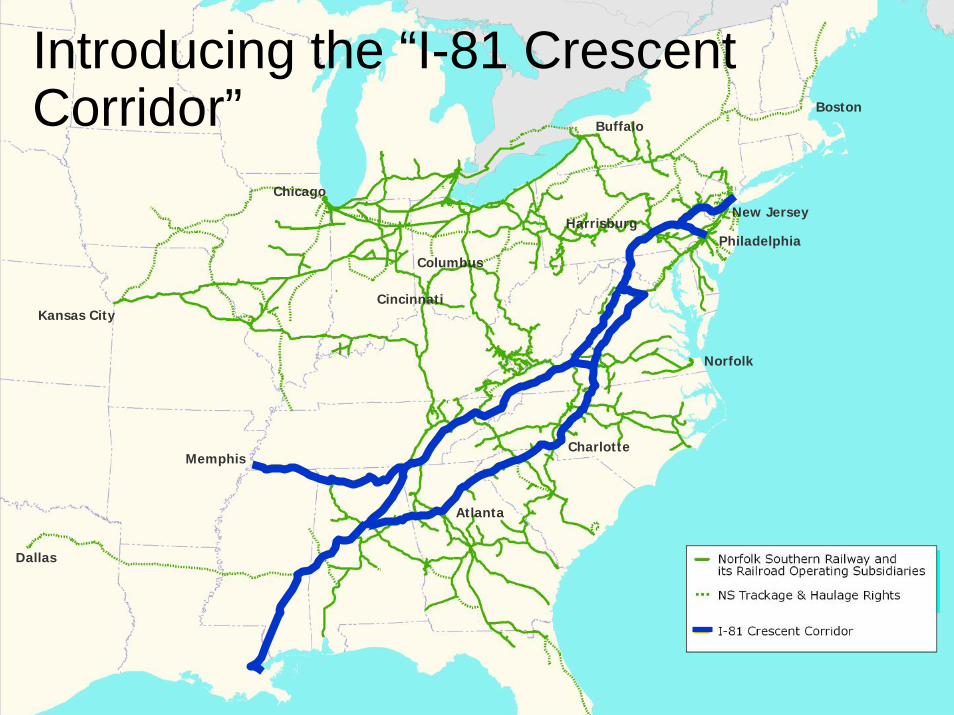
Introducing the “I-81 Crescent Corridor”
The Crescent Corridor Represents A Significant Opportunity for Freight Transportation
Long haul intermodal services along I-20, I-40, I-75, I-85 and I-81 Corridors are largely undeveloped
Significant highway congestion along portions of these routes, particularly in Virginia
NS estimates that there are over 1 million divertible truckloads in this corridor
Existing intermodal and motor carrier interest in developing services in this corridor

SummaryIntermodal rail services play a key role in the US transportation network
Continued Intermodal growth will be supported by road congestion, fuel costs, and environmental concerns, and must be accommodated in long term planning
Public-Private Partnerships will grow in importance as an ingredient for a successful transportation system