cn and hcn in dense interstellar clouds - arxiv · arxiv:astro-ph/0506535v1 22 jun 2005 cn and hcn...
TRANSCRIPT
arX
iv:a
stro
-ph/
0506
535v
1 2
2 Ju
n 20
05
CN and HCN in Dense Interstellar Clouds
Gai I. Boger and Amiel Sternberg
School of Physics and Astronomy and the Wise Observatory, The Beverly and Raymond
Sackler Faculty of Exact Sciences, Tel Aviv University, Tel Aviv 69978, Israel
ABSTRACT
We present a theoretical investigation of CN and HCN molecule formation
in dense interstellar clouds. We study the gas-phase CN and HCN production
efficiencies from the outer photon-dominated regions (PDRs) into the opaque
cosmic-ray dominated cores. We calculate the equilibrium densities of CN and
HCN, and of the associated species C+, C, and CO, as functions of the far-
ultraviolet (FUV) optical depth. We consider isothermal gas at 50 K, with
hydrogen particle densities from 102 to 106 cm−3. We study clouds that are
exposed to FUV fields with intensities (at 1000 A) from 5 × 10⁻¹⁹ to 5 × 10⁻¹⁴
erg s−1 cm−2 Hz sr−1, or 20 to 2 × 10⁵ times the mean interstellar FUV inten-
sity. We assume cosmic-ray H2 ionization rates ranging from 5×10⁻¹⁷ s−1, to an
enhanced value of 5 × 10⁻¹⁶ s−1. We also examine the sensitivity of the density
profiles to the gas-phase sulfur abundance.
Subject headings: galaxies:ISM – ISM:evolution – molecular processes
1. Introduction
Millimeter-wave line emissions of CN and HCN molecules are widely used probes of dense
molecular gas and of photon-dominated regions (PDRs) in the Galactic interstellar medium
(ISM). Observed sources include molecular interfaces in star-forming regions (Greaves &
Church 1996; Simon et al. 1997; Young Owl et al. 2000; Savage et al. 2002; Schneider et
al. 2003; Johnstone et al. 2003), reflection nebulae (Fuente et al. 1993, 1995, 2003; Jansen et
al. 1995), planetary nebulae (Bachiller et al. 1997a), and circumstellar envelopes and disks
(Wooten et al. 1982; Truong-Bach et al. 1987; Bachiller et al. 1997b; Lindqvist et al. 2000;
van Zadelhoff et al. 2003; Thi et al. 2004). Observations of CN and HCN have recently been
used to study PDRs in the starburst galaxy M82 and in other external systems (Fuente et
al. 2005; Meier & Turner 2005).
– 2 –
In nearby objects, such as the Orion Bar and the reflection nebulae NGC 2023 and 7023,
the molecular emissions have been mapped across the PDRs. The CN/HCN intensity ratios
are largest near the stellar sources of the illuminating far-ultraviolet (FUV) radiation fields,
and the intensity and density ratios decrease with increasing optical depth and distance from
the stars. This behavior is broadly consistent with theoretical expectations (Sternberg &
Dalgarno 1995 [SD95]; Jansen et al. 1995) and is evidence of selective photodissociation of
HCN versus CN (van Zadelhoff et al. 2003; Thi et al. 2004).
Many discussions of gas-phase nitrogen chemistry in molecular clouds have been pre-
sented in the literature (e.g., Herbst & Klemperer 1973; Prasad & Huntress 1980; Viala
1986; Pineau des Forets et al. 1990; Herbst et al. 1994; SD95; Lee et al. 1996; Turner et
al. 1997). Comprehensive reviews of PDR observations and theory, and related subjects have
been presented by Hollenbach & Tielens (1999), Sternberg (2004), and van Dishoeck (2005).
In this paper we focus on the gas-phase production of CN and HCN, and present results
for a wide range of conditions. We analyze how the CN and HCN formation and destruction
sequences vary with optical depth, first through the PDRs and then into the opaque cosmic-
ray dominated cores. We discuss how the (equilibrium) density profiles depend on the cloud
hydrogen gas densities and the incident FUV field intensities, and we identify the qualitative
changes in the density profiles that may be expected in moving from low- to high-density
systems. The production efficiencies of the carbon bearing CN and HCN molecules depend
on the availability of free C+ ions and C atoms in the gas, and we present and discuss the
associated C+, C, and CO density profiles in the parameter space we consider. In this paper
we do not consider HNC or the isomeric abundance ratio HCN/HNC (e.g., Watson 1974;
Schilke et. al. 1992; Herbst et al. 2000) which, together with CN/HCN, may be expected to
vary with optical depth, density, and FUV field strength.
In §2 we describe the basic ingredients of our models. In §3 we discuss the gas-phase
CN and HCN reaction sequences that operate in molecular clouds. In §4 we present detailed
results for a “reference model” to illustrate the depth-dependent formation pathways and
density profiles. In §5 we present our parameter study and discuss results for a range of
gas densities, FUV field strengths, cosmic-ray ionization rates, and gas-phase elemental
abundances. We summarize in §6.
2. Model Ingredients
We performed our model computations using an updated version of the SD95 code. The
models consist of static, plane-parallel, semi-infinite slabs, exposed on one side to isotropic
– 3 –
FUV (6-13.6 eV) radiation fields. The steady-state abundances of the atomic and molecular
species are computed as functions of the visual extinction, AV , from the cloud surface.
The models account for scattering and absorption of the FUV photons by dust grains, and
the resulting depth-dependent attenuation of the atomic and molecular photodissociation
and photoionization rates. The effects of H2 and CO absorption-line shielding are also
included. The molecular chemistry is driven by the combined action of FUV photoionization
and photodissociation, and cosmic-ray impact ionization. The resulting sequences of (two-
body) gas-phase ion-molecule and neutral-neutral reactions are mediated by dissociative
recombination and photo-destruction.
We assume that the spectral shapes of the incident FUV fields are identical to the Draine
(1978) representation of the interstellar field in the solar neighborhood (see also Parravano,
Hollenbach & McKee 2003). The field intensity is parameterized by a scaling factor χ, where
for χ = 1 the FUV intensity at 1000 A is 5.4× 10⁻²⁰ erg s−1 cm−2 Hz−1 sr−1. We construct
models for χ ranging from 20 to 2× 10⁵, appropriate for PDRs in the vicinity of young OB
stars and clusters (Sternberg et al. 2003).
In our computations we include the same set of 70 atomic and molecular carbon, nitro-
gen, oxygen, sulfur, and silicon bearing species 1 considered by SD95. Complex hydrocarbons
and PAHs are excluded. We solve the depth dependent equations of chemical equilibrium
∑
jl
kijl(T )njnl +∑
j
[χΓij + ξij]nj = ni
{
∑
jl
kjilnl +∑
j
[χΓji + ξji]}
(1)
as functions of AV . In these equations, ni are the densities (cm−3) of species i, and kijl(T )
are the (temperature-dependent) rate coefficients (cm3 s−1) for chemical reactions between
species j and l that lead to the production of i. The parameters χΓij and ξij are the
FUV photon and cosmic-ray destruction rates (s−1) of species j with products i. We solve
Equations (1) via Newton-Raphson iteration, and use Bulirsch-Stoer integration to compute
the column densities.
In our computations we include all reactions listed in the UMIST99 database (Le Teuff
et al. 2000) for which the reactants and products are species in our set. We adopt the
recommended UMIST99 rate-coefficients kijl, with several alterations and updates 2.
1We assume that the abundances of all other elements are negligible in the gas phase, including heavy
elements such as Mg and Fe which, when abundant, may become important positive-charge carriers in dense
molecular clouds (Oppenheimer & Dalgarno 1974; de Boisanger et al. 1996).
2Our input list of rate coefficients is available at ftp://wise3.tau.ac.il/pub/amiel/pdr. In our compilation
we use recent determinations of the rate coefficients and branching ratios for dissociative recombinations
– 4 –
The depth-dependent FUV photodissociation and photoionization rates are crucial quan-
tities. They depend on the intensity and spectral shape of the incident radiation field, on
the photodissociation and photoionization cross-sections, and on the dust grain scattering
and absorption properties. Dust attenutation is the primary mechanism for the reduction
of the photorates. Line-shielding is also important for the special cases of H2 and CO pho-
todissociation 3. For the depth dependent photodissociation and photoionization rates, we
adopt the biexponential representations
Γi = Ciexp(−αiAV − βiA2V ) (2)
and coefficients, Ci, αi, and βi, calculated by SD95 for the radiative transfer of a Draine field
penetrating a cloud of large (AV tot = 100) total optical depth (Roberge et al. 1991). We
assume a dust-to-gas ratio such that AV = 4.75× 10⁻²²(NH + 2NH2) (SD95; see also Draine
2003) where NH and NH2are the atomic and molecular hydrogen column densities (cm−2).
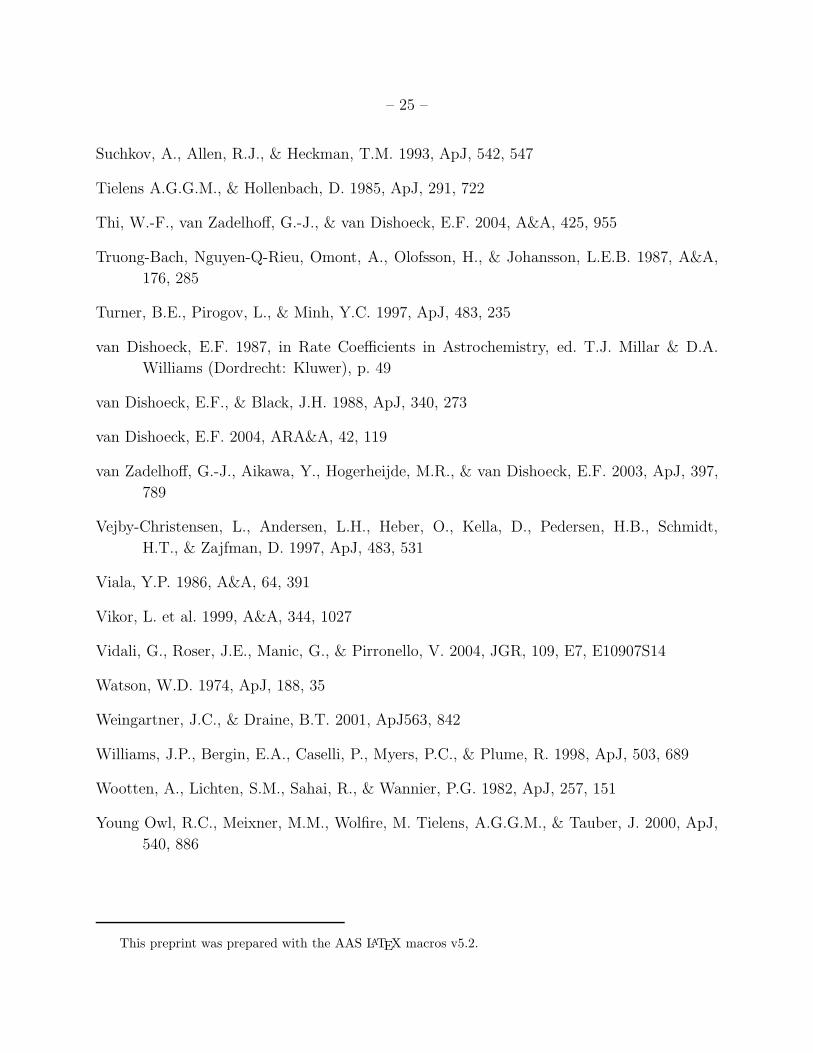
In Figure 1 we plot the CN and HCN photodissociation rates as functions of AV , for χ = 1
and a total cloud thickness AV tot = 100. The much more rapid attenuation of the CN
photodissociation rate compared to HCN is an important feature of the models, and reflects
the fact that the energetic photons (> 12.4 eV) required to dissociate CN (van Dishoeck
1987; Thi et al. 2004) are more readily absorbed by the dust grains.
The cosmic-ray destruction rates ξij in equation (1) include impact ionizations of H, H2
and He, by the primary cosmic-rays and secondary electrons, and induced FUV photodis-
sociation and photoionization of the heavier molecules (Gredel et al. 1989). In most of our
models we adopt a “dense cloud” H2 cosmic-ray ionization rate, ζ = 5 × 10⁻¹⁷ s−1 (e.g.,
Williams et al. 1998), but we also examine the effect of increasing ζ by up to a factor 10
(McCall et al. 2003; Brittain et al. 2004). The cosmic-rays are “freely penetrating” and ζ is
independent of cloud depth. Cosmic-ray ionization is the only source of H+, H+2 , and He+ in
our models. X-ray ionization (Maloney et al. 1996; Spaans & Meijerink 2005) is excluded.
The cosmic-ray induced photoionization and photodissociation rates are given by
ξi =ζpi
1− ω(3)
(Vejby-Christensen et al. 1997; Larson et al. 1998; Vikor et al. 1999; Jensen et al. 2000; McCall et al. 2003;
Geppert et al. 2004). For some neutral-neutral reactions we use rate-coefficients listed in UMIST95, or asgiven by Herbst et al. (2000) and Smith et al. (2004). We do not assume the small (∼ 50 K) activation
barriers postulated by Pineau des Forets et al. (1990) for the neutral-neutral reactions (see §3) involved in
the nitrogen chemistry.
3We set the Doppler parameter equal to 2 km s−1 for all absorption lines. As in SD95, we include H2
transitions in the Lyman and Werner bands, neglecting the rotational structure. We use the Federman et
al. (1979) self-shielding formulae for H2, and the van Dishoeck & Black (1989) shielding function for CO.
– 5 –
where ω is the grain albedo and pi are the photoabsorption “efficiency factors” (Gredel et
al. 1989). We adopt the efficiency factors pi listed in the UMIST99 compilation, and we set
ω = 0.5 (SD95).
Molecule formation requires the presence of H2. We assume that hydrogen molecules
are formed on grain surfaces with a rate coefficient
R = 3× 10⁻¹⁸T 1/2yF cm3 s−1 (4)
where T is the gas temperature, and yF is a “formation efficiency” that depends primarily
on the grain temperature (Manic et al. 2001; Biham et al. 2001, 2002; Cazaux & Tielens
2002; Vidali et al. 2004). We set yF = 1 appropriate for low-temperature (∼ 10−20 K) dust
grains. We do not consider accretion or ejection of other molecular species onto, or from,
the grains.
PDRs consist of several distinct zones or layers with sizes and locations that depend on
the gas density and FUV field strength. As discussed by SD95, these include the outer H I
zone, followed by the C II, S II, and Si II zones, terminated by a fully cosmic-ray dominated
dark core. In the H I zone, rapid photodissociation keeps the hydrogen in atomic form.
In the C II zone, the hydrogen “self-shields” and becomes molecular, but photoionization
maintains the carbon as C+. In the S II, zone the carbon is fully incorporated into CO, but
photoionization and charge-transfer maintain the sulfur as S+. In the Si II layer the silicon
is maintained as Si+, but the sulfur is either atomic or is incorporated into molecules. The
relative efficiencies of the various molecular formation sequences, and the resulting molecular
densities, vary with cloud depth and from zone to zone. For example, in the model considered
by SD95, for which the hydrogen particle density n = 106 cm−3 and χ = 2×10⁵, the CN/HCN
density ratio is large (∼ 10) in the the H I, C II, and S II layers, but then decreases and
becomes small (∼ 10−4) in the dark core. A large CN/HCN ratio was therefore identified as
an important feature of (dense) PDRs. SD95 identified additional molecular diagnostic ratios
of FUV irradiated gas, including OH/H2O, CO+/HCO+, and SO+/SO (see also Sternberg
et al. 1996).
The sizes and locations of the various zones also depend on the total gas-phase elemental
abundances. In our calculations we set the gas-phase elemental abundances equal to the
interstellar values observed in the diffuse cloud toward ζ Oph. Thus, we set C/H=1.32×10−4
(Cardelli et al. 1993), N/H=7.50 × 10−5 (Meyer et al. 1997), O/H=2.84 × 10−4 (Meyer et
al. 1998), Si/H=1.78× 10−6 (Cardelli et al. 1994), and S/H=8.30× 10−6 (Lepp et al. 1988).
We adopt a helium abundance He/H=0.1. In most of our models we keep the gas-phase
abundances fixed at these values, and independent of cloud depth. In one model we examine
the effect of reducing the S (and Si) abundances by a factor of 100.
– 6 –
In this paper, we study the behavior in cool isothermal clouds. Our results are insensitive
to the temperature for T . 200 K, and we adopt a representative gas temperature of T =
50 K. We consider isobaric clouds, so that the total hydrogen particle densities n ≡ nH+nH2
are constant through the clouds. The densities of all other species increase by a factor of 2
at the H to H2 transition layer. We present results for n ranging from 102 to 106 cm−3.
Explicit thermal balance computations (Sternberg & Dalgarno 1989; Burton et al. 1990)
show that in dense (n & 104 cm−3) PDRs the temperatures in the outer H I zones may
exceed 103 K. Molecular synthesis may then proceed via a “hot gas” chemistry in a thin
outer layer (e.g. via the efficient production of the reactive intermediate OH). However, the
contributions to the total CN and HCN column densities from the hot layers are expected
to be small (SD95). Here we exclude considerations of hot gas, and focus on the chemistry
in the more extended cooler regions.
3. CN and HCN Formation and Destruction
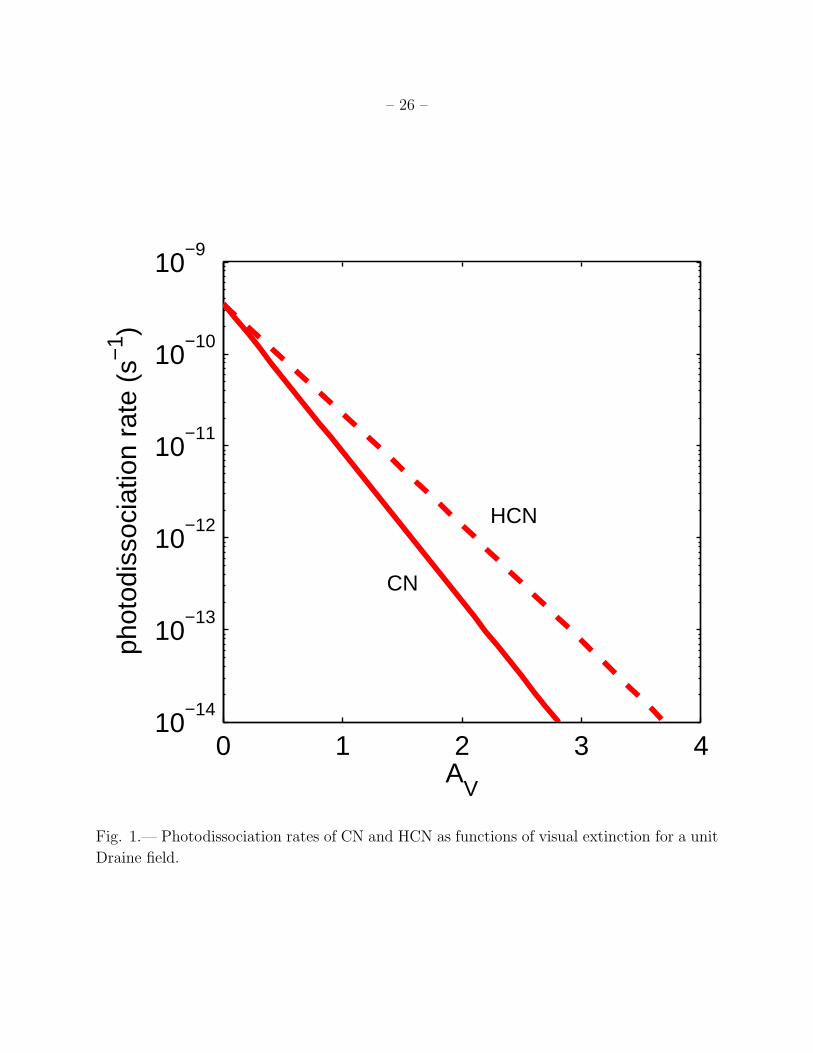
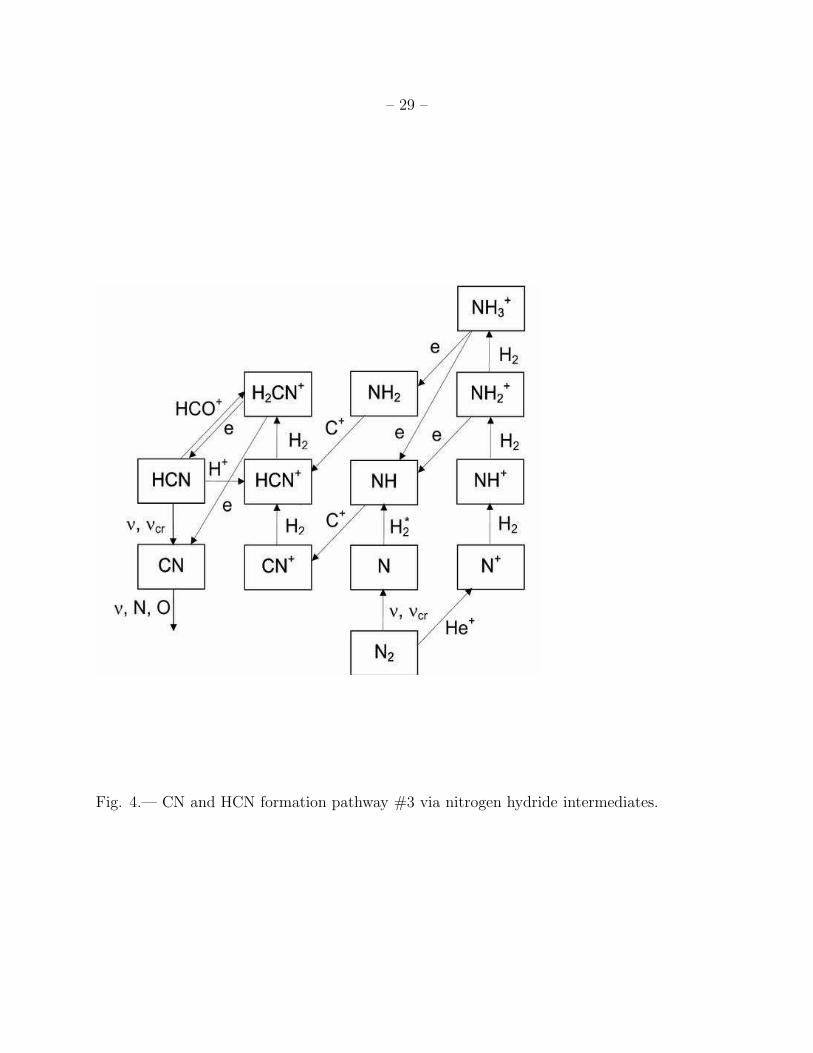
There are three major pathways to the gas-phase formation of CN and HCN, as illus-
trated in Figures 2-4. In pathway #1, production occurs via the formation of carbon hydrides
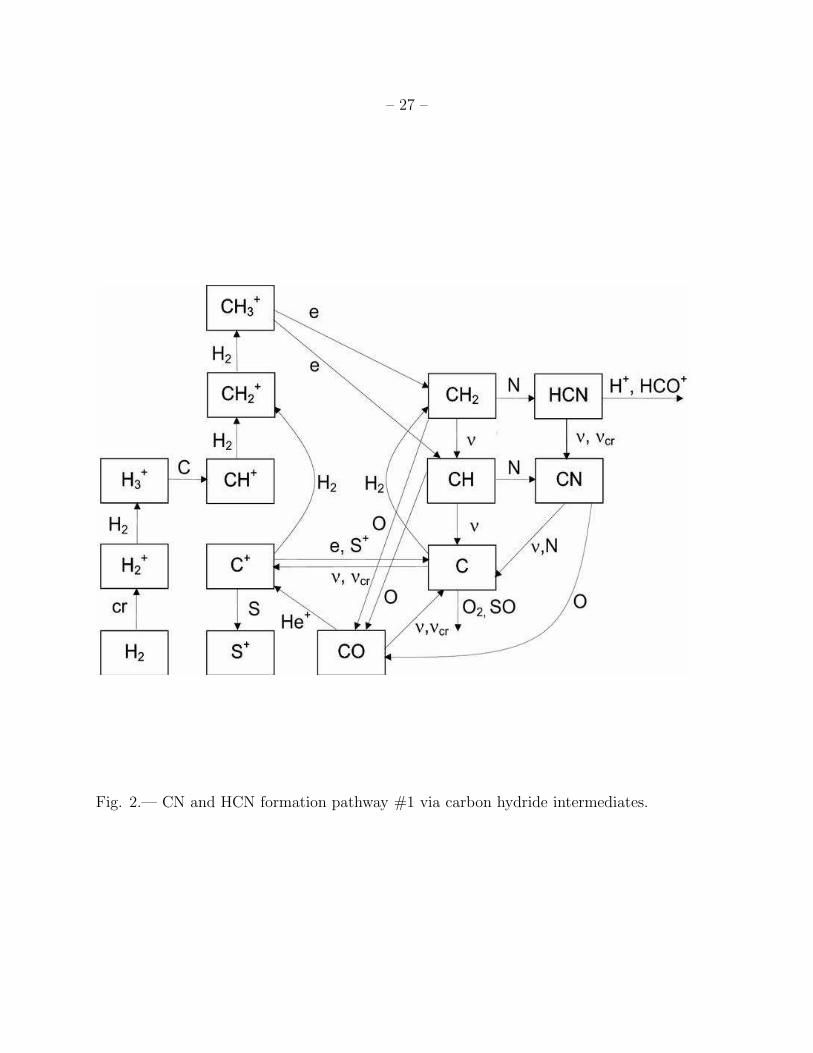
and intermediate CH and CH2 radicals. In pathway #2 an additional route to CN (but not
HCN) occurs via oxygen hydrides and the intermediates OH and NO. In pathway #3 the
molecules are produced via nitrogen hydrides and parent H2CN+ ions. We describe each of
these pathways in turn.
3.1. Pathway #1
In pathway #1, which is important at all cloud depths, CN and HCN are formed via
the neutral-neutral reactions 4
CH+ N → CN + H (R1)
and
CH2 +N → HCN + H . (R2)
4Reactions (R1) and (R2) play central roles in the formation of CN and HCN. In our computations we
assume a rate coefficient of 2.0 × 10⁻¹⁰ cm3 s−1 at 50 K for (R1), as implied by pulsed laser experiments
in room-temperature discharge flows, and a theoretical extrapolation to low temperature (Brownsword et
al. 1996). This is an order-of-magnitude larger than the rate coefficient reported by Messing et al. (1981),
and widely used in many previous PDR models including SD95. For Reaction (R2) we use the theoretical
value of 5.9× 10⁻¹¹ cm3 s−1 recently calculated by Herbst et al. (2000).
– 7 –
The required CH and CH2 intermediates are produced in three ways. First is via radia-
tive association
C+ +H2 → CH+2 + ν (R3)
followed by rapid abstraction
CH+2 +H2 → CH+
3 +H (R4)
and dissociative recombination
CH+3 + e → CH2 +H (R5)
CH+3 + e → CH + H2. (R6)
Second is cosmic-ray driven proton transfer
H2 + cr → H+2 + e (R7)
H+2 +H2 → H+
3 +H (R8)
C + H+3 → CH+ +H2 (R9)
followed by
CH+ +H2 → CH+2 +H (R10)
and then (R4), (R5), and (R6).
A third possibility is direct formation 5 via slow radiative association
C + H2 → CH2 + ν (R11)
which may become competitive in dense clouds where the fractional ionizations and the
relative H+3 densities, n
H+
3/n, become small.
In the outer PDR, the CH and CH2 radicals are removed by FUV photodissociation
and photoionization. In shielded regions they are removed by
CH + O → CO + H (R12)
CH2 +O → CO + H2 (R13)
in rapid reactions with the available oxygen atoms.
5Reaction (R11) was not included in the SD95 study. Here we adopt k11 = 1.0× 10⁻¹⁷ cm3 s−1 for the
rate coefficient (Smith et al. 2004).
– 8 –
3.2. Pathway #2
Pathway #2 is an additional route to CN (but not HCN), and becomes important mainly
in shielded regions. In this pathway CN is formed via the intermediates OH and NO in the
reaction pair
OH + N → NO +H (R14)
NO + C → CN +O . (R15)
The main source of OH is cosmic-ray driven proton transfer
O + H+3 → OH+ +H2 (R16)
followed by abstractions
OH+ +H2 → H2O+ +H (R17)
H2O+ +H2 → H3O
+ +H (R18)
and dissociative recombination
H3O+ + e → OH+H +H (R19)
H3O+ + e → OH+H2 . (R20)
Major removal mechanisms for OH and NO are photodissociation, and reactions with atomic
oxygen and nitrogen
OH + O → O2 +H (R21)
NO + N → N2 +O (R22)
in the shielded regions.
3.3. Pathway #3
Finally, in pathway #3 both CN and HCN are produced via dissociative recombination
H2CN+ + e → HCN + H (R23)
H2CN+ + e → CN+ H2 (R24)
where the parent H2CN+ ions are formed via
NH + C+ → CN+ +H (R25)
NH2 + C+ → HCN+ +H (R26)
– 9 –
followed by
CN+ +H2 → HCN+ +H (R27)
HCN+ +H2 → H2CN+ +H . (R28)
This pathway is mainly important in shielded regions, but may also operate in the outer H I
zone.
In shielded regions, where the N2 density becomes large, NH and NH2 are produced by
the cosmic-ray driven sequence
He+ +N2 → N+ +N+He (R29)
N+ +H2 → NH+ +H (R30)
NH+ +H2 → NH+2 +H (R31)
NH+2 +H2 → NH+
3 +H (R32)
followed by
NH+3 + e → NH + H2 (R33)
NH+3 + e → NH2 +H (R34)
In the H I zone, NH may be formed via
N + H∗
2 → NH+ H (R35)
where H∗
2 refers to the sum over all FUV-pumped hydrogen molecules in vibrational states
with energies large enough to overcome the endothermicity of the reaction.
3.4. Destruction
The CN and HCN density profiles also depend on the varying efficiencies of the destruc-
tion mechanisms. In the outer PDR, photodissociation
CN + ν → C+ N (R36)
HCN + ν → CN+ H (R37)
dominates. In shielded layers the CN radical is removed by
CN + N → N2 + C (R38)
CN + O → CO + N . (R39)
– 10 –
Reaction (R38) dominates at intermediate cloud depths where a high abundance of nitrogen
atoms are maintained by photodissociation. At large depths (R39) becomes the dominant
removal process. The saturated HCN molecule is removed primarily by cosmic-ray induced
photodissociation
HCN + crp → CN + H . (R40)
Photodissociation of HCN operates as an important source of CN, both in the PDR and in
the dark core. Additional removal processes for HCN in the dark core are
HCN + H+ → HCN+ +H (R41)
HCN + HCO+ → H2CN+ + CO (R42)
Reaction (R41) is important in low density clouds (n . 103 cm−3) where a large proton
density is maintained by cosmic-ray ionization. Reaction (R42) becomes important in dense
clouds (n & 103 cm−3).
3.5. Free Carbon: C+ and C
The efficiencies of the CN and HCN formation sequences depend on the availability of
“free carbon” particles, either as C+ ions or C atoms. As we discuss in §4, the CN and HCN
profiles are closely related to the C+ and C density distributions.
In the outer parts of the PDR, C+ is produced by FUV photoionization
C + ν → C+ + e . (R43)
In shielded regions the main source is cosmic-ray driven helium-impact dissociative ionization
of CO
He + cr → He+ + e (R44)
He+ + CO → C+ +O+He . (R45)
In the outer PDR, where the electron density is high, the C+ ions are removed by radiative
recombination
C+ + e → C + ν . (R46)
In shielded regions, radiative association (R3), and charge transfer neutralization
C+ + S → S+ + C , (R47)
become important. Charge transfer with atomic sulfur plays a particularly important role
in the partially shielded layers. In the dark core
C+ +O2 → CO +O+ (R48)
– 11 –
C+ +O2 → CO+ +O (R49)
dominate.
Carbon atoms are produced by radiative recombination and charge transfer ([R46] and
[R47]), FUV photodissociation
CO + ν → C+O (R50)
and cosmic-ray induced photodissociation
CO + crp → C+ O . (R51)
The C atoms are removed by photoionization in the outer PDR, by proton transfer and
radiative association ([R9] and [R11]), and cosmic-ray induced photoionization
C + crp → C+ + e (R52)
at intermediate depths, and by
C + O2 → CO +O (R53)
C + SO → S + CO (R54)
C + SO → CS + O (R55)
in the shielded cores.
4. Reference Model
The results of our model calculations are displayed in Figures 5, 6, and 7, which show
cuts through the χ, n, ζ parameter space we have considered. For each set of cloud parame-
ters we display the C+, C, CO, CN, and HCN densities (cm−3) and column densities (cm−2),
as well as the CN/HCN density and column density ratios, as functions of AV . The column
densities are integrated from the cloud surface, in the normal direction. We also display the
electron density profiles.
We first discuss our results for a specific “reference model”, with n = 104 cm−3, χ =
2×10³, and ζ = 5×10⁻¹⁷ s−1. We use this model to analyze the depth dependent formation
sequences and resulting density profiles. We also use it as a point of comparison as the cloud
parameters are varied. Our reference model is displayed in panels (c), (d), and (e) of Figure
5, and again in Figures 6 and 7.
In our reference model, and in our parameter study we adopt T = 50 K. For our
assumed set of reaction rate coefficients, the results we describe below are quite insensitive
– 12 –
to the assumed gas temperature, provided the gas is cold with T . 200 K. For example,
relative to our results for 50 K, the CN and HCN densities change by less than a factor of 2
at all AV, if T is decreased to 20 K, or increased to 200 K.
4.1. C+, C, and CO Density Profiles
The C+, C, and CO density profiles in our reference model show the familiar structure
seen in numerous PDR calculations (Tielens & Hollenbach 1985; van Dishoeck & Black 1988;
Le Bourlot et al. 1993a; Flower et al. 1994; SD95; Jansen et al. 1995; Bakes & Tielens 1998).
The carbon is ionized in the outer layers, and undergoes a conversion to CO as the ionizing
FUV radiation is attenuated. An important feature is the double peaked atomic carbon
density profile.
The first C peak is associated with the sharp transition of the available gas-phase carbon
from fully ionized to molecular form near the inner edge of the C II zone. In our reference
model this occurs at AV = 2. Due to the rapid production of CO at this location, the
C density at the peak reaches only ∼ 20% of the total gas-phase carbon abundance. The
transition is, effectively, directly from C+ to CO. After the conversion to CO only trace
quantities of C and C+ remain.
An important property of the C+/C/CO transition region is that photodissociation of
CO continues to dominate the production of the free carbon well beyond the point where
the conversion to CO is complete. For example, in our reference model, photodissociation
dominates up to AV = 2.5, well inside the S II zone. Up to this point, C+ continues to
be produced by photoionization, and the C+/C density ratio is set by the balance between
recombination and photoionization. Thus, in the C II zone, where the production rate of
atomic carbon via recombination is constant (since ne ≈ nC+), the C density increases as
the photoionization rate is attenuated. However, once the conversion to CO is complete the
atomic carbon density drops as the CO photodissociation rate decreases. This behavior gives
rise to the first C peak.
We note that for PAH abundances & 10−7 mutual neutralization, C+ + PAH− →
C + PAH, can compete with radiative recombination (Lepp et al. 1988) leading to a slight
shift in the positions of the C+/C/CO transition layers (Bakes & Tielens 1998). We do
not include the effects of PAHs in our analysis. Similarly, the process of “grain-assisted”
ion-electron recombination may become important when neαr/nαg < 1, where αr (equal to
1.4 × 10⁻¹¹ cm−3 s−1 at 50 K, for C+ ions), and αg . 10−14 cm3 s−1 are the radiative and
grain-assisted recombination rate coefficients. The efficiency of grain-assisted recombination
– 13 –
depends on the grain population size distribution and on the grain charge (Weingartner &
Draine 2001). In the computations we present here we exclude this process. Including it can
increase the C densities at the first C peak. We have verified that the CN and HCN density
profiles we discuss below are not affected significantly.
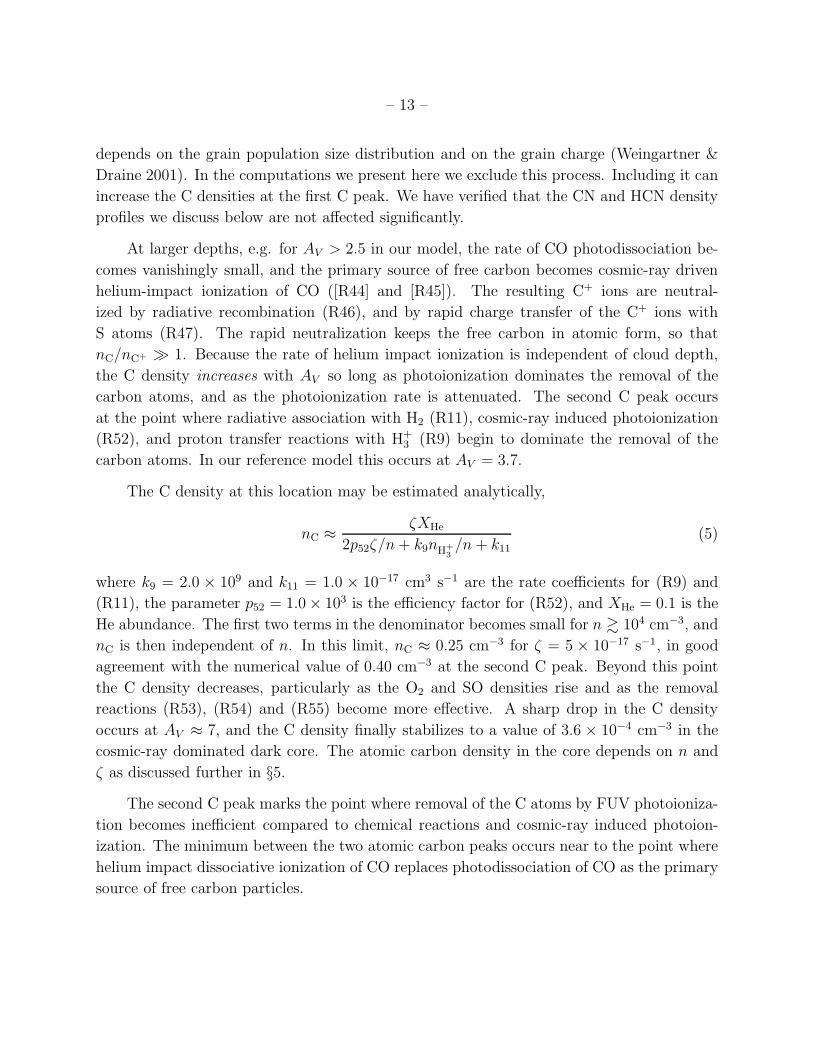
At larger depths, e.g. for AV > 2.5 in our model, the rate of CO photodissociation be-
comes vanishingly small, and the primary source of free carbon becomes cosmic-ray driven
helium-impact ionization of CO ([R44] and [R45]). The resulting C+ ions are neutral-
ized by radiative recombination (R46), and by rapid charge transfer of the C+ ions with
S atoms (R47). The rapid neutralization keeps the free carbon in atomic form, so that
nC/nC+ ≫ 1. Because the rate of helium impact ionization is independent of cloud depth,
the C density increases with AV so long as photoionization dominates the removal of the
carbon atoms, and as the photoionization rate is attenuated. The second C peak occurs
at the point where radiative association with H2 (R11), cosmic-ray induced photoionization
(R52), and proton transfer reactions with H+3 (R9) begin to dominate the removal of the
carbon atoms. In our reference model this occurs at AV = 3.7.
The C density at this location may be estimated analytically,
nC ≈ζXHe
2p52ζ/n+ k9nH+
3/n+ k11
(5)
where k9 = 2.0 × 10⁹ and k11 = 1.0 × 10⁻¹⁷ cm3 s−1 are the rate coefficients for (R9) and
(R11), the parameter p52 = 1.0× 10³ is the efficiency factor for (R52), and XHe = 0.1 is the
He abundance. The first two terms in the denominator becomes small for n & 104 cm−3, and
nC is then independent of n. In this limit, nC ≈ 0.25 cm−3 for ζ = 5 × 10⁻¹⁷ s−1, in good
agreement with the numerical value of 0.40 cm−3 at the second C peak. Beyond this point
the C density decreases, particularly as the O2 and SO densities rise and as the removal
reactions (R53), (R54) and (R55) become more effective. A sharp drop in the C density
occurs at AV ≈ 7, and the C density finally stabilizes to a value of 3.6 × 10⁻⁴ cm−3 in the
cosmic-ray dominated dark core. The atomic carbon density in the core depends on n and
ζ as discussed further in §5.
The second C peak marks the point where removal of the C atoms by FUV photoioniza-
tion becomes inefficient compared to chemical reactions and cosmic-ray induced photoion-
ization. The minimum between the two atomic carbon peaks occurs near to the point where
helium impact dissociative ionization of CO replaces photodissociation of CO as the primary
source of free carbon particles.
– 14 –
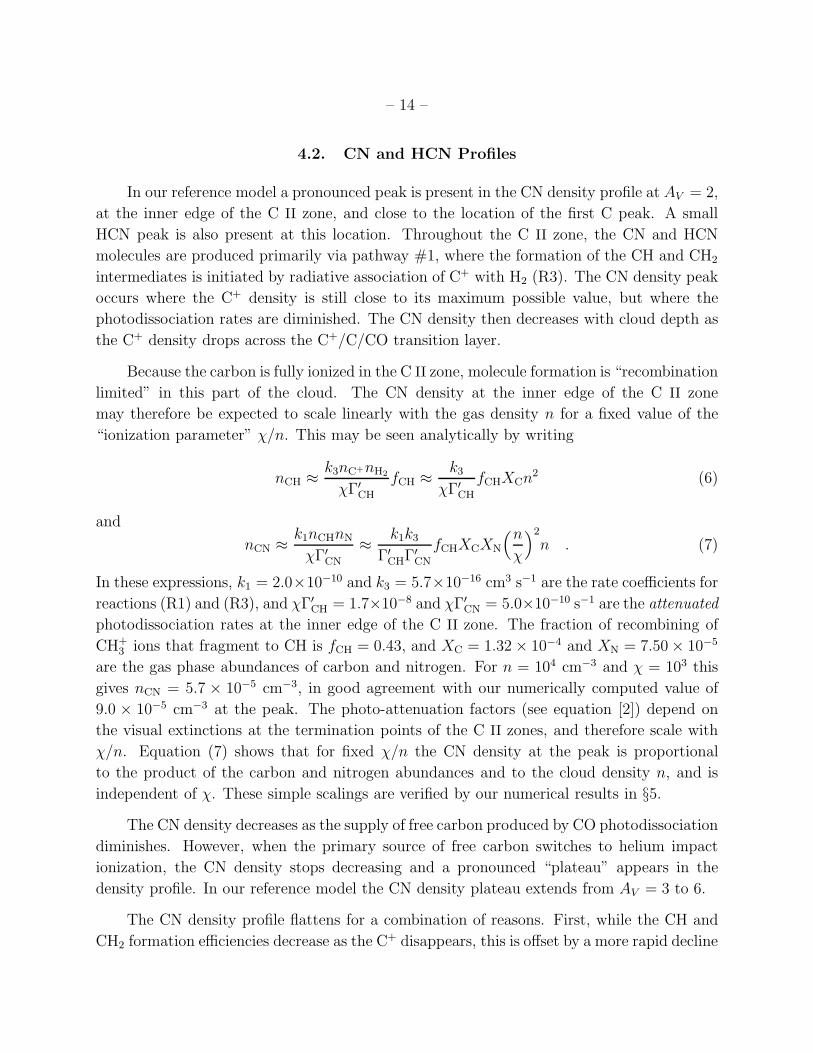
4.2. CN and HCN Profiles
In our reference model a pronounced peak is present in the CN density profile at AV = 2,
at the inner edge of the C II zone, and close to the location of the first C peak. A small
HCN peak is also present at this location. Throughout the C II zone, the CN and HCN
molecules are produced primarily via pathway #1, where the formation of the CH and CH2
intermediates is initiated by radiative association of C+ with H2 (R3). The CN density peak
occurs where the C+ density is still close to its maximum possible value, but where the
photodissociation rates are diminished. The CN density then decreases with cloud depth as
the C+ density drops across the C+/C/CO transition layer.
Because the carbon is fully ionized in the C II zone, molecule formation is “recombination
limited” in this part of the cloud. The CN density at the inner edge of the C II zone
may therefore be expected to scale linearly with the gas density n for a fixed value of the
“ionization parameter” χ/n. This may be seen analytically by writing
nCH ≈k3nC+nH2
χΓ′
CH
fCH ≈k3
χΓ′
CH
fCHXCn2 (6)
and
nCN ≈k1nCHnN
χΓ′
CN
≈k1k3
Γ′
CHΓ′
CN
fCHXCXN
(n
χ
)2
n . (7)
In these expressions, k1 = 2.0×10⁻¹⁰ and k3 = 5.7×10⁻¹⁶ cm3 s−1 are the rate coefficients for
reactions (R1) and (R3), and χΓ′
CH = 1.7×10⁻⁸ and χΓ′
CN = 5.0×10⁻¹⁰ s−1 are the attenuated
photodissociation rates at the inner edge of the C II zone. The fraction of recombining of
CH+3 ions that fragment to CH is fCH = 0.43, and XC = 1.32× 10⁻⁴ and XN = 7.50× 10⁻⁵
are the gas phase abundances of carbon and nitrogen. For n = 104 cm−3 and χ = 103 this
gives nCN = 5.7 × 10⁻⁵ cm−3, in good agreement with our numerically computed value of
9.0 × 10⁻⁵ cm−3 at the peak. The photo-attenuation factors (see equation [2]) depend on
the visual extinctions at the termination points of the C II zones, and therefore scale with
χ/n. Equation (7) shows that for fixed χ/n the CN density at the peak is proportional
to the product of the carbon and nitrogen abundances and to the cloud density n, and is
independent of χ. These simple scalings are verified by our numerical results in §5.
The CN density decreases as the supply of free carbon produced by CO photodissociation
diminishes. However, when the primary source of free carbon switches to helium impact
ionization, the CN density stops decreasing and a pronounced “plateau” appears in the
density profile. In our reference model the CN density plateau extends from AV = 3 to 6.
The CN density profile flattens for a combination of reasons. First, while the CH and
CH2 formation efficiencies decrease as the C+ disappears, this is offset by a more rapid decline
– 15 –
in the the CH and CH2 photodestruction rates. Second, the rise in the atomic carbon density
up to the second C peak leads to an increased efficiency of the proton-transfer sequence
initiated by (R9) in pathway #1. Third, CN formation via pathway #2 also begins to play
a significant role as the OH and NO densities increase.
Furthermore, while HCN (formed via [R2]) is removed by photodissociation, at these
cloud depths CN is removed by neutral-neutral reactions with N atoms (R38). Photode-
struction of CN is ineffective in the plateau because of the severe attenuation of the CN
photodissociation rate (see Figure 1). Importantly, photodissociation of HCN becomes a
major source of CN in the plateau. The HCN density therefore rises as the FUV field is
attenuated, but because the atomic nitrogen density remains large throughout, the resulting
CN density remains insensitive to AV .
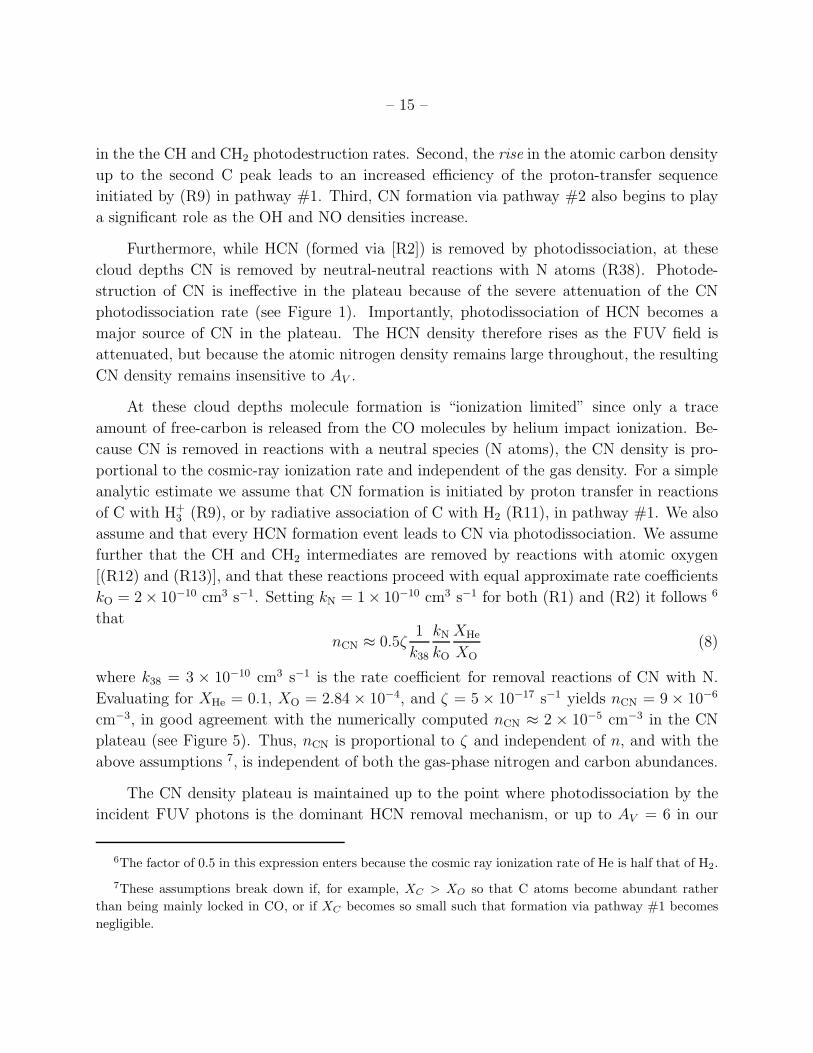
At these cloud depths molecule formation is “ionization limited” since only a trace
amount of free-carbon is released from the CO molecules by helium impact ionization. Be-
cause CN is removed in reactions with a neutral species (N atoms), the CN density is pro-
portional to the cosmic-ray ionization rate and independent of the gas density. For a simple
analytic estimate we assume that CN formation is initiated by proton transfer in reactions
of C with H+3 (R9), or by radiative association of C with H2 (R11), in pathway #1. We also
assume and that every HCN formation event leads to CN via photodissociation. We assume
further that the CH and CH2 intermediates are removed by reactions with atomic oxygen
[(R12) and (R13)], and that these reactions proceed with equal approximate rate coefficients
kO = 2× 10⁻¹⁰ cm3 s−1. Setting kN = 1× 10⁻¹⁰ cm3 s−1 for both (R1) and (R2) it follows 6
that
nCN ≈ 0.5ζ1
k38
kNkO
XHe
XO
(8)
where k38 = 3 × 10⁻¹⁰ cm3 s−1 is the rate coefficient for removal reactions of CN with N.
Evaluating for XHe = 0.1, XO = 2.84 × 10⁻⁴, and ζ = 5 × 10⁻¹⁷ s−1 yields nCN = 9 × 10⁻⁶
cm−3, in good agreement with the numerically computed nCN ≈ 2 × 10⁻⁵ cm−3 in the CN
plateau (see Figure 5). Thus, nCN is proportional to ζ and independent of n, and with the
above assumptions 7, is independent of both the gas-phase nitrogen and carbon abundances.
The CN density plateau is maintained up to the point where photodissociation by the
incident FUV photons is the dominant HCN removal mechanism, or up to AV = 6 in our
6The factor of 0.5 in this expression enters because the cosmic ray ionization rate of He is half that of H2.
7These assumptions break down if, for example, XC > XO so that C atoms become abundant rather
than being mainly locked in CO, or if XC becomes so small such that formation via pathway #1 becomes
negligible.
– 16 –
reference model. The HCN density reaches a peak value of 8.6×10⁻⁴ cm−3 at this point. At
larger depths cosmic-ray induced photodissociation becomes the dominant HCN destruction
mechanism, proceeding at a rate independent of AV . CN is removed by reactions with
oxygen atoms (R39). The CN and HCN formation efficiencies both decline as less C and C+
is available, and the CN and HCN densities decrease to their dark core values of 1.2× 10⁻⁶
and 2.6× 10⁻⁵ cm−3 respectively.
Figure 5e shows that the CN column density rise sharply to NCN = 6 × 1012 cm−2 at
the CN peak at AV = 2, and that much of the CN column is built up at this location. The
HCN column remains small at AV = 2, but continues to increase with cloud depth. NHCN
approaches 7×1014 cm−2 at AV = 6 where the HCN volume density is at its maximum. The
ratio NCN/NHCN ∼ 10 at AV = 2, and decreases to ∼ 0.1 at AV = 6 (see Figure 5f).
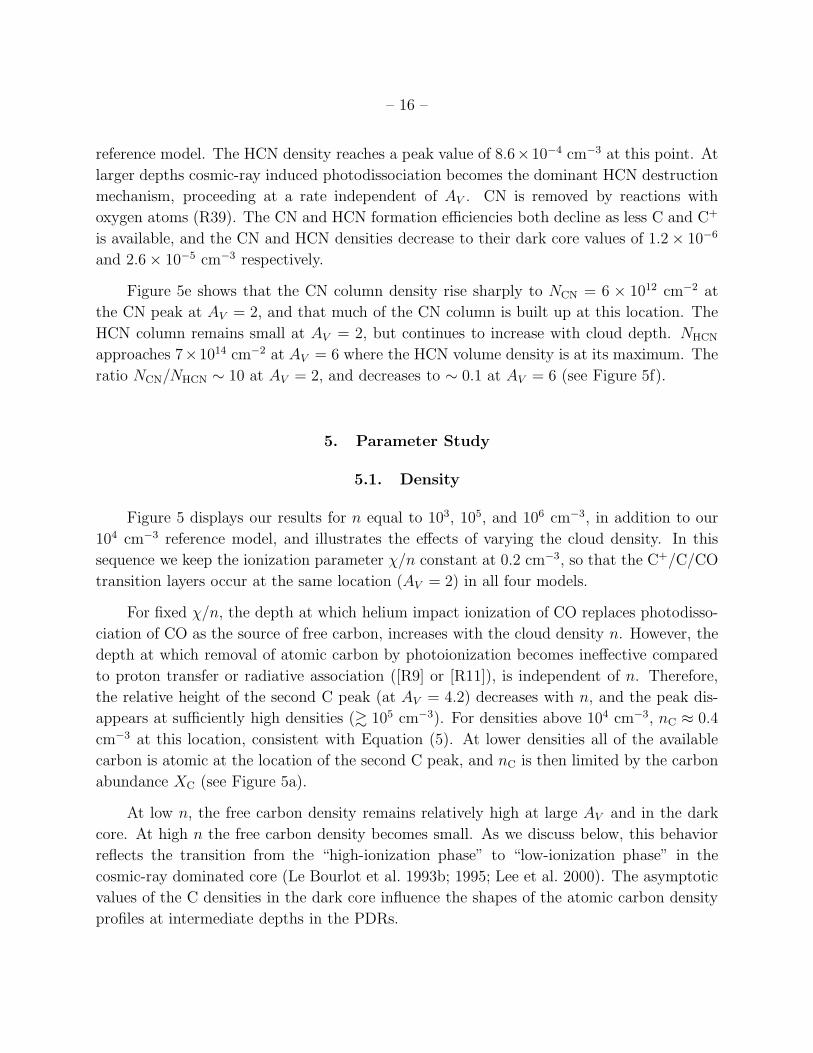
5. Parameter Study
5.1. Density
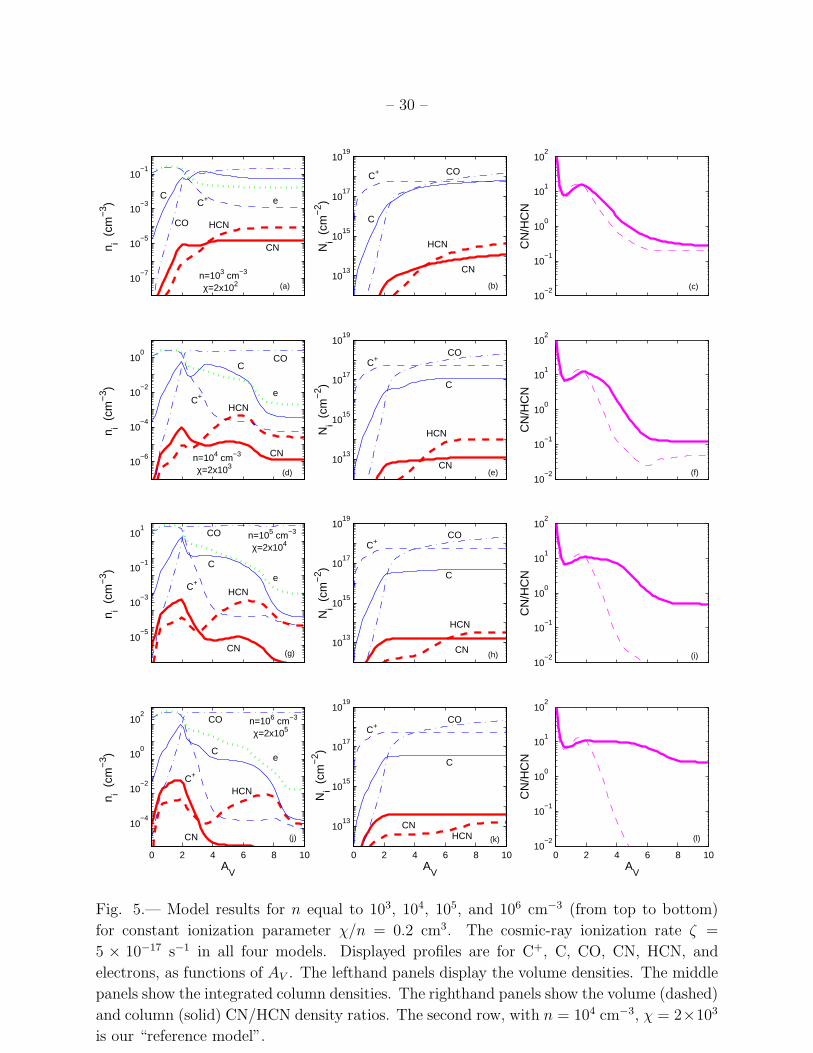
Figure 5 displays our results for n equal to 103, 105, and 106 cm−3, in addition to our
104 cm−3 reference model, and illustrates the effects of varying the cloud density. In this
sequence we keep the ionization parameter χ/n constant at 0.2 cm−3, so that the C+/C/CO
transition layers occur at the same location (AV = 2) in all four models.
For fixed χ/n, the depth at which helium impact ionization of CO replaces photodisso-
ciation of CO as the source of free carbon, increases with the cloud density n. However, the
depth at which removal of atomic carbon by photoionization becomes ineffective compared
to proton transfer or radiative association ([R9] or [R11]), is independent of n. Therefore,
the relative height of the second C peak (at AV = 4.2) decreases with n, and the peak dis-
appears at sufficiently high densities (& 105 cm−3). For densities above 104 cm−3, nC ≈ 0.4
cm−3 at this location, consistent with Equation (5). At lower densities all of the available
carbon is atomic at the location of the second C peak, and nC is then limited by the carbon
abundance XC (see Figure 5a).
At low n, the free carbon density remains relatively high at large AV and in the dark
core. At high n the free carbon density becomes small. As we discuss below, this behavior
reflects the transition from the “high-ionization phase” to “low-ionization phase” in the
cosmic-ray dominated core (Le Bourlot et al. 1993b; 1995; Lee et al. 2000). The asymptotic
values of the C densities in the dark core influence the shapes of the atomic carbon density
profiles at intermediate depths in the PDRs.
– 17 –
Figure 5 shows that the CN density at AV = 2 increases linearly with n, from ∼ 10−5 to
10−2 cm−3, in accordance with Equation (6). The “CN peak” becomes more pronounced as
n increases. In the n = 106 cm−3 model, the density of FUV-pumped H2 becomes large, and
CN is also formed via pathway #3 initiated by (R35). For n ≥ 104 cm−3 the “CN plateau”
from AV = 3 to ∼ 6 is apparent. At these depths nCN ≈ 2 × 10⁻⁵ cm−3 independent of n,
consistent with Equation (8). At low n, the CN density remains large to high AV due to the
elevated free carbon densities.
For fixed χ/n, FUV photodissociation of HCN is effective to greater depths as n in-
creases. The location of the HCN density peak therefore moves from a visual extinction of
5.6 to 7.2 as the gas density is increased from 104 to 106 cm−3. The column density ratio
NCN/NHCN remains large to greater depths as n is increased, but the density ratio nCN/nHCN
falls off sharply with AV (see Figure 5).
5.2. FUV Intensity, Sulfur Abundance, and Cosmic-Ray Ionization Rate
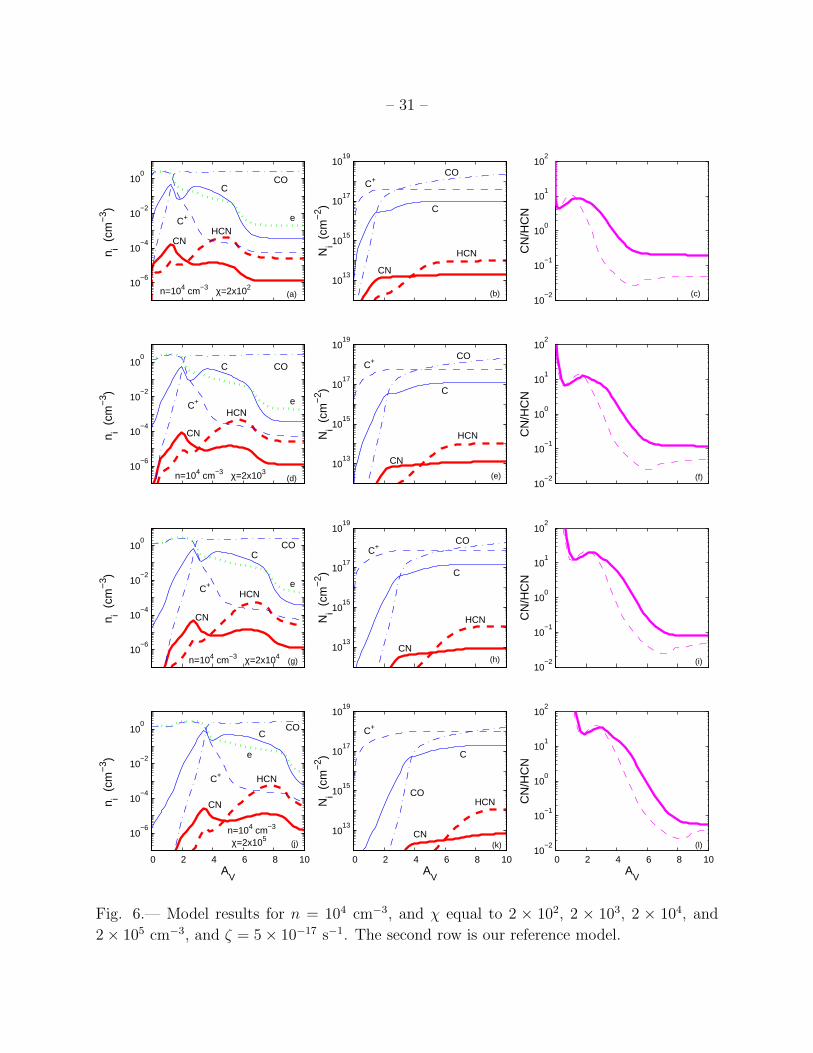
In Figure 6, we set n equal to 104 cm−3, and we vary χ from 2 × 10² to 2 × 10⁶.
This illustrates the effects of varying the incident FUV field intensity. The location of the
C+/C/CO transition layer moves from AV = 1.3 to 3.5 for this density and range of FUV
intensities. The position of the second C peak is also shifted to larger AV , as is the location
of the sharp drop in the C density, which moves from AV = 6 to 9. The approach to the
dark-core conditions occurs at greater AV as χ is increased.
Correspondingly, the locations of the CN peak and the inner HCN peak also move
inward as χ is increased. Because the CN photodissociation rate declines most rapidly with
AV (see Figure 1) nCN/nHCN and NCN/NHCN at the CN peak increase with χ, from ∼ 10 to
40 in our models.
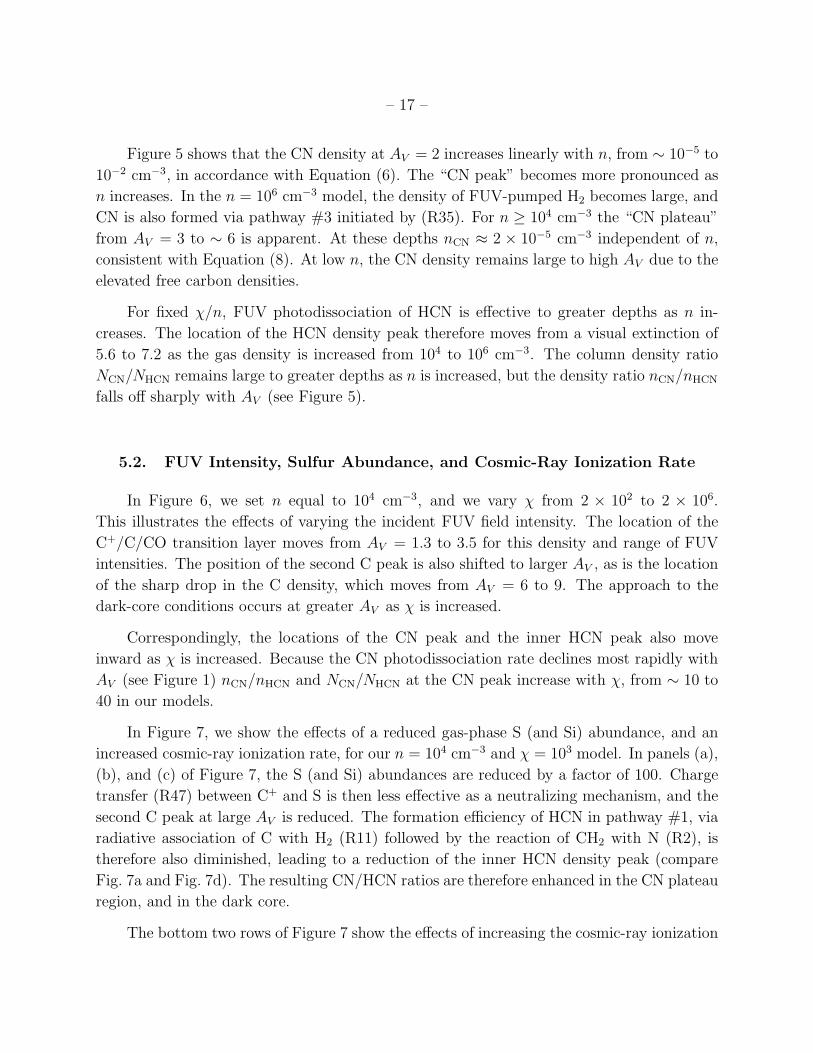
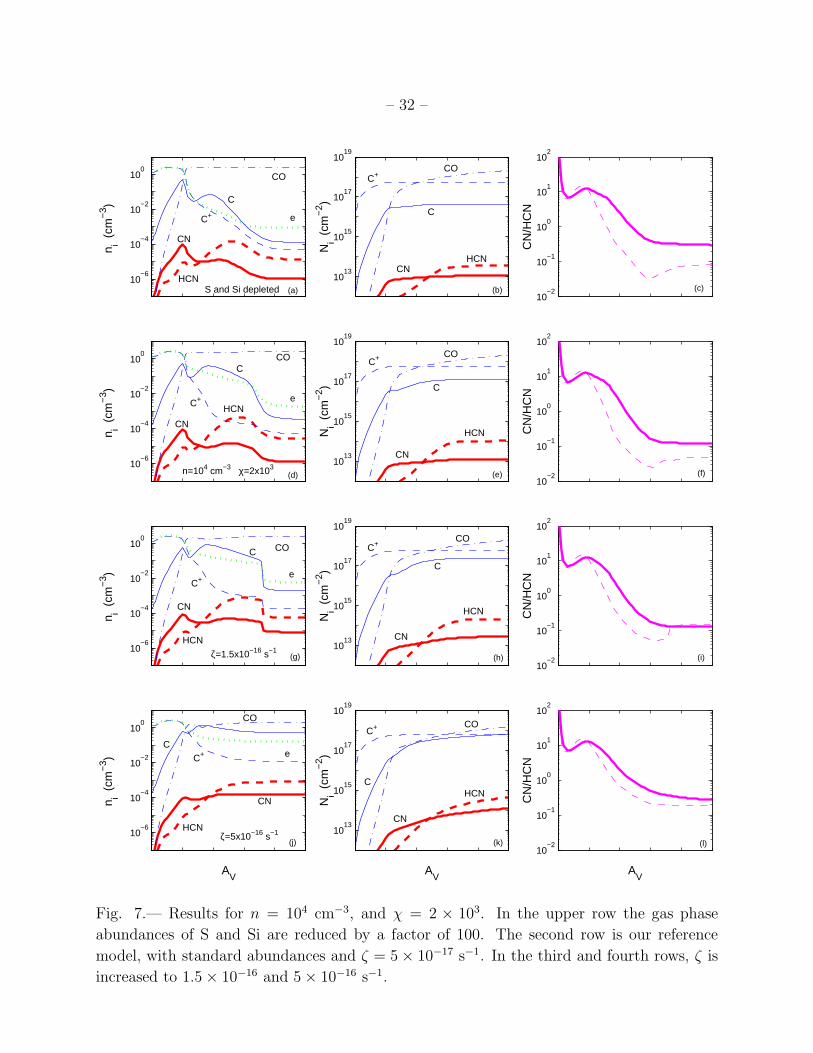
In Figure 7, we show the effects of a reduced gas-phase S (and Si) abundance, and an
increased cosmic-ray ionization rate, for our n = 104 cm−3 and χ = 103 model. In panels (a),
(b), and (c) of Figure 7, the S (and Si) abundances are reduced by a factor of 100. Charge
transfer (R47) between C+ and S is then less effective as a neutralizing mechanism, and the
second C peak at large AV is reduced. The formation efficiency of HCN in pathway #1, via
radiative association of C with H2 (R11) followed by the reaction of CH2 with N (R2), is
therefore also diminished, leading to a reduction of the inner HCN density peak (compare
Fig. 7a and Fig. 7d). The resulting CN/HCN ratios are therefore enhanced in the CN plateau
region, and in the dark core.
The bottom two rows of Figure 7 show the effects of increasing the cosmic-ray ionization
– 18 –
rate, by factors of 3 and 10, to 1.5 × 10⁻¹⁶ and 5 × 10⁻¹⁶ s−1. Increasing ζ mainly affects
the atomic carbon density profile. The first C peak is unaltered because it is is controlled
by purely photo-processes. However, the second C peak is enhanced by the increased rate
of helium impact destruction of CO (R44). The behavior is consistent with Equation (5).
Initially, the C density increases linearly with ζ . However, for sufficiently large ζ the atomic
carbon is removed by cosmic-ray induced photoionization (R52) and proton transfer reactions
with H+3 (R9), rather than by radiative association with H2 (R11). In this limit the C density
is independent of ζ , and all of the available gas phase carbon becomes atomic, as occurs for
our ζ = 5× 10⁻¹⁶ model.
The free carbon densities remain large throughout the cloud for high ζ . As we now
discuss, the shift from a low to high free carbon density with increasing ζ is related to a
“phase change” that occurs in the dark core.
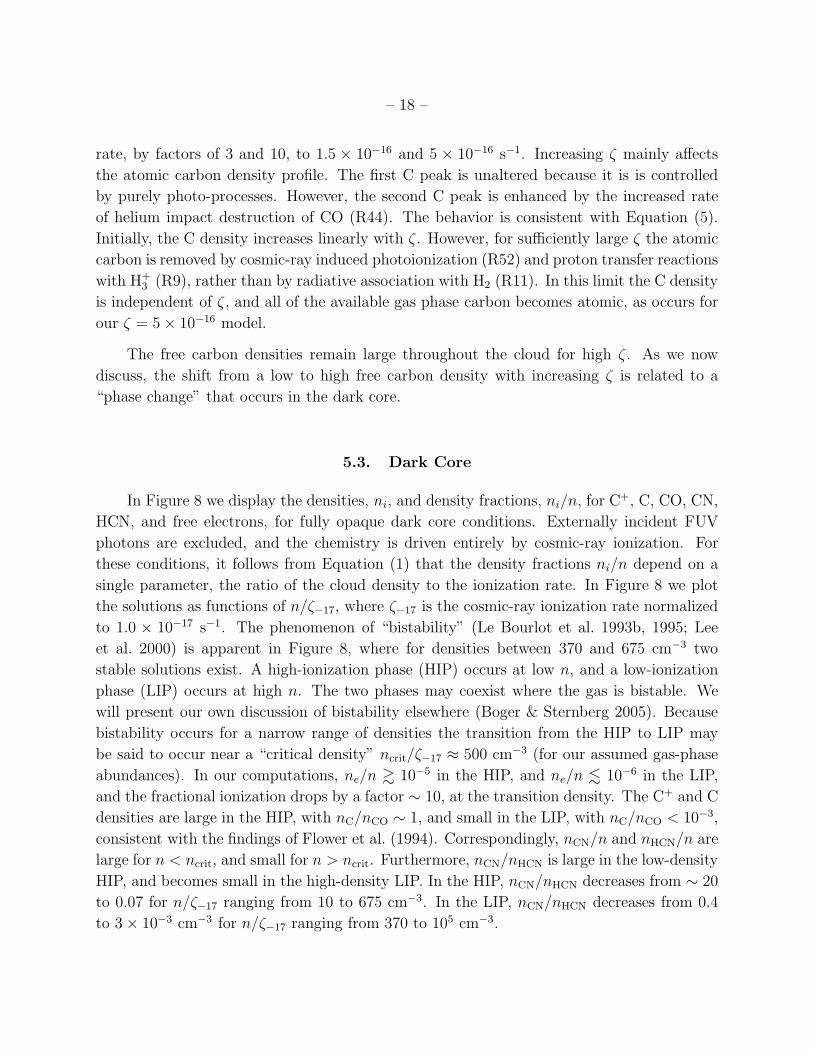
5.3. Dark Core
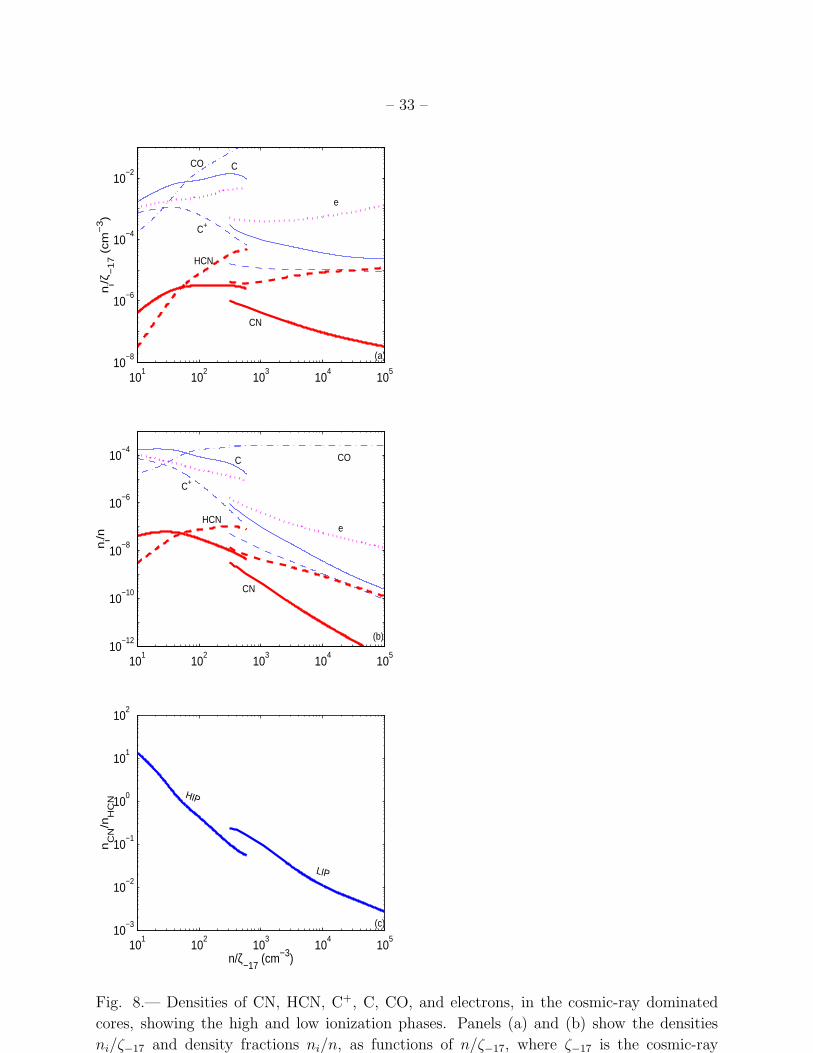
In Figure 8 we display the densities, ni, and density fractions, ni/n, for C+, C, CO, CN,
HCN, and free electrons, for fully opaque dark core conditions. Externally incident FUV
photons are excluded, and the chemistry is driven entirely by cosmic-ray ionization. For
these conditions, it follows from Equation (1) that the density fractions ni/n depend on a
single parameter, the ratio of the cloud density to the ionization rate. In Figure 8 we plot
the solutions as functions of n/ζ−17, where ζ−17 is the cosmic-ray ionization rate normalized
to 1.0 × 10⁻¹⁷ s−1. The phenomenon of “bistability” (Le Bourlot et al. 1993b, 1995; Lee
et al. 2000) is apparent in Figure 8, where for densities between 370 and 675 cm−3 two
stable solutions exist. A high-ionization phase (HIP) occurs at low n, and a low-ionization
phase (LIP) occurs at high n. The two phases may coexist where the gas is bistable. We
will present our own discussion of bistability elsewhere (Boger & Sternberg 2005). Because
bistability occurs for a narrow range of densities the transition from the HIP to LIP may
be said to occur near a “critical density” ncrit/ζ−17 ≈ 500 cm−3 (for our assumed gas-phase
abundances). In our computations, ne/n & 10−5 in the HIP, and ne/n . 10−6 in the LIP,
and the fractional ionization drops by a factor ∼ 10, at the transition density. The C+ and C
densities are large in the HIP, with nC/nCO ∼ 1, and small in the LIP, with nC/nCO < 10−3,
consistent with the findings of Flower et al. (1994). Correspondingly, nCN/n and nHCN/n are
large for n < ncrit, and small for n > ncrit. Furthermore, nCN/nHCN is large in the low-density
HIP, and becomes small in the high-density LIP. In the HIP, nCN/nHCN decreases from ∼ 20
to 0.07 for n/ζ−17 ranging from 10 to 675 cm−3. In the LIP, nCN/nHCN decreases from 0.4
to 3× 10⁻³ cm−3 for n/ζ−17 ranging from 370 to 105 cm−3.
– 19 –
Returning now to Figure 7, we note that the increase in the free carbon density at large
AV that occurs as ζ is increased, is due to the rise in ncrit, and a corresponding transition
from LIP to HIP conditions, for the specific gas density of 104 cm−3. The phase transition
is affected by the presence of some FUV radiation. For example, for ζ = 1.5 × 10⁻¹⁶ s−1 it
occurs at AV ≈ 7 rather than in the fully opaque core (see Figure 7g). As the ionization
rate is increased further, the gas is converted to the HIP throughout (see Figure 7j).
6. Discussion and Summary
CN and HCN molecules have been observed in a diversity of Galactic and extragalac-
tic sources, and the CN/HCN intensity and density ratios have been used as diagnostic
probes of FUV irradiated molecular gas. One recent and interesting example is the well-
known starburst galaxy M82 (d = 3.9 Mpc; L = 3.7 × 10¹⁰ L⊙; e.g. Forster-Schreiber et
al. 2003). Fuente et al. (2005) have reported measurements of CN 1-0 (113.490 GHz),
CN 2-1 (226.874 GHz), and HCN 1-0 (88.631 GHz) line emissions across the inner 650 pc
star-forming molecular disk in M82. They find that NCN/NHCN ∼ 5, and argue that the large
ratio is indicative of a giant and dense PDR bathed in the intense field of the starburst. They
derive n ∼ 104 to 105 cm−3, and χ ∼ 104. Fuente et al. (2005) conclude that AV . 5 in
the M82 clouds, since for optically thicker clouds the CN/HCN column density ratio would
be smaller than observed. Our results provide support for these conclusions. In this picture
∼ 10 to 20 individual clouds along the line of sight are required, since for characteristic
elemental abundances the computed CN and HCN columns for AV . 5 (see Figures 5 and
6) are about an order of magnitude smaller than observed (NCN = [2± 0.5]× 1014 cm−2 and
NHCN = [4± 0.5]× 1013 cm−2).
Alternatively, the large CN/HCN ratio might be a signature of a very large cosmic-ray
ionization rate, up to ∼ 5 × 10⁻¹⁵ s−1, as invoked by Suchkov et al. (1993) for M82 and
other starburst galaxies. For such high ionization rates the CN/HCN ratio could remain & 1
even in dense and opaque cores if these are maintained in the high-ionization phase. Our
results indicate that for ζ = 5 × 10⁻¹⁵ s−1, the HIP is maintained up to n ∼ 4 × 105 cm−3
(see Figure 8). This possibility is perhaps more compatible with the large C/CO ratio
& 0.5 inferred from observations of the 492 and 809 GHz C I fine-structure lines in M82
(Schilke et al. 1993; Stutzki et al. 1997; see also Gerin & Phillips 2000). As discussed above,
a large C/CO ratio is a signature of the HIP.
In this paper we have presented a theoretical study of CN and HCN molecule formation
in dense interstellar clouds exposed to intense FUV radiation fields. We have analyzed the
behavior of the CN/HCN density ratio for a wide range of conditions, with the aim of showing
– 20 –
how this molecular ratio may be used as a diagnostic probe of molecule formation in FUV
irradiated gas. For this purpose, we have constructed detailed models in which we solve the
equations of chemical equilibrium as functions of optical depth, for uniform density clouds
at constant gas temperature (50 K). Our results are insensitive to the gas temperature for
cold clouds with T . 200 K. We consider clouds with hydrogen particle densities ranging
from n = 102 to 106 cm−3, and FUV radiation intensities ranging from χ = 20 to 2 × 10⁵,
appropriate for star-forming clouds near young OB stars and clusters. We present results for
cosmic-ray ionization rates ranging from 5×10⁻¹⁷ to 5×10⁻¹⁶ s−1, and we also examine the
effects of large (factor 100) sulfur depletions on the computed density profiles. We present
calculations of the density profiles for CN and HCN, and for the associated species C+, C,
and CO. We analyze the behavior from the outer FUV photon-dominated regions, into the
fully opaque cosmic-ray dominated cores.
In this paper, we adopt a fixed characteristic shape for the FUV radiation spectrum,
and we do not examine the possible signatures of “soft” versus “hard” FUV fields (van Zadel-
hoff et al. 2003). Time-dependent effects due to episodic shadowing (Storzer et al. 1997),
fluctuating radiation fields (Parravano et al. 2003), grain processing (Charnley et al. 2001),
turbulent mixing and diffusion (Papadopoulos et al. 2004), and other dynamical processes,
are not considered here.
Our models show how observations of the CN/HCN abundances ratio in molecular
clouds may used as probes of FUV and cosmic-ray driven gas-phase chemistry for a wide
range of conditions. We find that in dense gas, CN molecules are characteristically and
preferentially produced near the inner edges of the C II zones in the PDRs. This is where C+
begins to recombine and where atomic carbon is incorporated into CO. Molecule formation is
“recombination limited” at these depths, and for fixed χ/n, the CN density is proportional to
the cloud density, and to the gas-phase carbon and nitrogen abundances. For n & 104 cm−3,
and for clouds with linear sizes corresponding to visual extinctions AV . 10, the entire
integrated CN column density is built up at the C+/C/CO transition layer. For characteristic
interstellar carbon and nitrogen gas-phase abundances the predicted CN columns are ∼
3 × 1013 cm−2. HCN is rapidly photodissociated in the outer parts of the PDRs including
the C+/C/CO transition layers. Because HCN is more vulnerable to photodissociation, the
CN/HCN density ratio is large at low AV , and decreases with increasing optical depth.
We find that the CN/HCN density ratio typically decreases from & 10 in the C+/C/CO
transition layers to . 0.1 in the opaque cores.
At intermediate and large depths, the bulk of the gas-phase carbon is locked in CO
molecules, and the CN and HCN densities depend on the rate at which carbon is released from
CO by cosmic-ray driven helium impact ionization. Molecule formation is then “ionization
– 21 –
limited” and occurs with an efficiency proportional to the cosmic-ray ionization rate. In dense
clouds, an enhanced abundance of atomic carbon is maintained at intermediate depths, where
charge transfer of C+ with S is effective, and where photo-destruction reduces the efficiency
with which the carbon atoms are removed in reactions with molecules. At these intermediate
depths the CN density is insensitive to AV . However, the HCN densities increase with AV
as the destructive FUV photons are absorbed.
The C+, C, CO, CN, and HCN densities in the opaque cores depend on whether the
cores are in the “low-ionization” or “high-ionization” phases that are possible for such gas.
We present computations for gas in both phases. The transition from the HIP to LIP occurs
at a critical value n/ζ−17 = 103 cm−3, consistent with previous findings. The CN/HCN
density ratio can become large & 1 in the LIP, but remains small in the HIP.
For dense gas in Galactic molecular clouds, and for characteristic cosmic-ray ionization
rates, a large CN/HCN density ratio may be interpreted reliably as an indicator of molecule
formation in PDRs. In clouds exposed to enhanced fluxes of cosmic-rays, as perhaps occurs in
starburst galaxies, a high CN/HCN ratio may alternatively be an indicator of opaque clouds
in the high-ionization phase. Measurements of the C/CO ratio can be used to distinguish
between these two possibilities.
Acknowledgments
We thank A. Dalgarno, A. Fuente, O. Gnat, E. Herbst, and C.F. McKee for discussions,
and the referee for helpful comments and suggestions. This research is supported by the
Israel Science Foundation, grant 221/03.
REFERENCES
Bachiller, R., Fuente, A., Bujarrabal, V., Colomer, F., Loup, C., Omont, A., & de Jong, T.
1997, A&A, 319, 235
Bachiller, R., Forveille, T., Huggins, P.J., & Cox, P. 1997, A&A, 324, 1123
Bakes, E.L.O., & Tielens, A.G.G.M. 1998, ApJ, 499, 258
Biham, O., Furman, I., Pirronello, V., & Vidali, G. 2001, ApJ, 553, 595
Biham, O., & Lipshtat, A. 2002, Phys. Rev. E, 66, 056103
– 22 –
Boger, G., & Sternberg, A. 2005, in prep.
Brittain, S.D., Simon, T., Craig, K., & Terrence, R.W. 2004, ApJ, 606, 911
Brownsword, R.A., Gatenby, S.D., Herbert, L.B., Smith, I.W.M., Stewart, D.W.A., &
Symonds, A.C. 1996, J. Chem. Soc. Faraday Trans., 92, 723
Burton, M.G., Hollenbach, D.J., & Tielens, A.G.G.M. 1990, ApJ, 620, 639
Cardelli, J.A., Mathis, J.S., Ebbets, D.C., & Savage, B.D. 1993, ApJ, 402, L17
Cardelli, J.A., Sofia, U.J., Savage, B.D., Keenan, F.P., & Dufton, P.L. 1994, ApJ, 420, L29
Cazaux, S., & Tielens, A.G.G.M. 2002, ApJ, 575, L29
Charnley, S.B., Rodgers, S.D.,& Ehrenfreund, P. 2001, A&A, 378, 1024
de Boisanger, C., Helmich, F.P., & van Dishoeck, E.F. 1996, AA, 310, 315
Draine, B.T. 1978, ApJS, 36, 595
Draine, B.T. 2003, ARA&A, 41, 241
Federman, S.R., Glassgold, A.E., & Kwan, J. 1979, ApJ, 227, 466
Flower, D.R., Le Bourlot, J., Pineau Des Forets, G., & Roueff, E. 1994, a, 282, 225
Forster-Schreiber, N.M., Genzel, R., Lutz, D., & Sternberg, A. 2003, ApJ, 599, 193
Fuente, A., Martin-Pintado, J., Cernicharo, J., & Bachiller, R. 1993, A&A, 276, 473
Fuente, A., Martin-Pintado, J., & Gaume, R. 1995, ApJ, 442, L33
Fuente, A., & Martin-Pintado, J. 1997, ApJ, 477, L107
Fuente, A., Rodriguez-Franco, A., Garcia-Burillo, S., Martin-Pintado, J, & Black, J.H. 2003,
A&A, 406, 899
Fuente, A. Garcia-Burillo, S., Gerin, M., Teyssier, D., Usero, A., Rizzom J.R., & de Vicente,
P. 2005, ApJ, 619, L155
Garcia-Burillo, S., Martin-Pintado, J., Fuente, A., Usero, A., & Neri, R. 2002, ApJ, 575,
L55
Gerin, M., & Phillips, T.G. 2000, ApJ, 537, 644
– 23 –
Greaves, J.S., & Church, S.E. 1996 MNRAS, 283, 1179
Gredel, R., Lepp, S., Dalgarno, A., & Herbst, E. 1989, ApJ, 347, 289
Herbst, E., Lee, H.-H., Howe, D.A.,& Millar, T.J. & 1994, MNRAS, 268, 335
Herbst, E., Terzieva, R., & Talbi, D. 2000, 311, 869
Hollenbach, D.J., & Tielens, A.G.G.M. 1997, ARA&A, 35, 179
Jansen, D.J., van Dishoeck, E.F., Black, J.H., Spaans, M., & Sosin, C. 1995, A&A, 302, 223
Jensen, M.J., Bilodeau, R.C., Safvan, C.P., Seiersen, K., Andersen, L.H., Pedersen, H.B., &
Heber, O. 2000, ApJ, 543, 764
Johnstone, D., Boonman, A.M.S., & van Dishoeck, E.F. 2003, A&A, 412, 157
Knauth, D.C., Federman, S.R., Pan, K., Yan, M., & Lambert, D.L. 2001, ApJS, 135, 201
Larson, A. et al. 1998, ApJ, 505, 459
Le Bourlot, J., Pineau Des Forets, G., Roueff, E., & Flower, D.R. 1993, A&A, 267, 233
Le Bourlot, J., Pineau des Forets, G., Roueff, E., & Schilke, P. 1993, ApJ, 416, L87
Le Bourlot, J., Pineau des Forets, G., & Roueff, E. 1995, A&A, 297, 251
Lee. H.-H., Bettens, R.P.A.,& Herbst, E., & 1996, A&A, 119, 111
Lee, H.-H., Roueff, E., Pineau des Forets, G., Shalabiea, O. M., Terzieva, R., & Herbst, Eric
1998, A&A, 334, 1047
Lepp, S., Dalgarno, A., van Dishoeck, E.F., & Black, J.H. 1988, ApJ, 329, 418
Le Teuff, Y.H., Millar, T.J., & Markwick, A.J 2000, A&A, 146, 157
Lindqvist, M., Schier, F.L., Lucas, R., & Olofsson, H. 2000, A&A, 361, 1036
Maloney, P.R., Hollenbach, D.J., & Tielens, A.G.G.M. 1996, ApJ, 466, 561
Manic, G., Ragun, G., Pirronello, V., Roser, J.E., & Vidali, G. 2001, ApJ, 548, L253
McCall, B.J. et al. 2003, Nature, 422, 500
Meier, D.S., & Turner, J.L. 2005, ApJ, 618, 259
Messing, I., Filseth, S.V., Sadowski, C.M., & Carrington, J. 1981, Chem.Phys., 74, 374
– 24 –
Meyer, D.M., Cardelli, J.A., & Sofia, U.J. 1997, ApJ, 490, L103
Meyer, D.M., Jura, M., & Cardelli, J.A. 1998, AJ, 493, 222
Oppenheimer, M., & Dalgarno, A. 1974, ApJ, 192, 29
Parravano, A. Hollenbach, D.J., & McKee, C.F. 2003, ApJ, 584, 797
Papadopoulos, P.P., Thi, W.-F., & Viti, S. 2004, MNRAS, 351, 147
Pineau des Forets, G., Roueff, E.,& Flower, D.R. 1990, MNRAS, 244, 668
Prasad, S.S., & Huntress, W.T., Jr. 1980, ApJS, 43, 1
Roberge, W.G., Jones, D., Lepp, S., & Dalgarno, A. 1991, ApJS, 77, 287
Savage, C., Apponi, A.J., Ziurys, L.M., & Wyckoff, S. 2002, ApJ, 578, 211
Schilke, P., Walmsley, C. M., Pineau Des Forets, G., Roueff, E., Flower, D. R., & Guilloteau,
S. 1992, a, 256, 595
Schilke, P., Carlstrom, J.E., Keene, J., & Phillips, T. G. 1993, ApJ, 417, L67
Schneider, N., Simon, R., Kramer, C., Kraemer, K., Stutzki, J., & Mookerjea, B. 2003, A&A,
406, 915
Simon, R., Stutzki, J., Sternberg, A., & Winnewisser, G. 1997, A&A, 327, L9
Sofia, U.J., Lauroesch, J.T., Meyer, D.M., & Cartledge, S.I.B. 2004, ApJ, 605, 272
Spaans, M., & Meijerink, R. 2005, Ap&SS, 295, 239
Sternberg, A., & Dalgarno, A. 1989, ApJ, 338, 197
Sternberg, A., & Dalgarno, A. 1995, ApJS, 99, 565
Sternberg, A., Yan, M., & Dalgarno, A. 1996, in IAU Symp. 178, Molecules in Astrophysics:
Probes and Processes, ed. E.F. van Dishoeck (Dordrecht: Kluwer), p. 141
Sternberg, A. 2004, in The Dense Interstellar Medium in Galaxies, eds. Pfalzner, S. et al.
(Berlin: Springer), p. 423
Storzer, H., Stutzki, J., & Sternberg, A. 1996, A&A, 310, 592
Stutzki, J. et al. 1997, ApJ, 477, L33
– 25 –
Suchkov, A., Allen, R.J., & Heckman, T.M. 1993, ApJ, 542, 547
Tielens A.G.G.M., & Hollenbach, D. 1985, ApJ, 291, 722
Thi, W.-F., van Zadelhoff, G.-J., & van Dishoeck, E.F. 2004, A&A, 425, 955
Truong-Bach, Nguyen-Q-Rieu, Omont, A., Olofsson, H., & Johansson, L.E.B. 1987, A&A,
176, 285
Turner, B.E., Pirogov, L., & Minh, Y.C. 1997, ApJ, 483, 235
van Dishoeck, E.F. 1987, in Rate Coefficients in Astrochemistry, ed. T.J. Millar & D.A.
Williams (Dordrecht: Kluwer), p. 49
van Dishoeck, E.F., & Black, J.H. 1988, ApJ, 340, 273
van Dishoeck, E.F. 2004, ARA&A, 42, 119
van Zadelhoff, G.-J., Aikawa, Y., Hogerheijde, M.R., & van Dishoeck, E.F. 2003, ApJ, 397,
789
Vejby-Christensen, L., Andersen, L.H., Heber, O., Kella, D., Pedersen, H.B., Schmidt,
H.T., & Zajfman, D. 1997, ApJ, 483, 531
Viala, Y.P. 1986, A&A, 64, 391
Vikor, L. et al. 1999, A&A, 344, 1027
Vidali, G., Roser, J.E., Manic, G., & Pirronello, V. 2004, JGR, 109, E7, E10907S14
Watson, W.D. 1974, ApJ, 188, 35
Weingartner, J.C., & Draine, B.T. 2001, ApJ563, 842
Williams, J.P., Bergin, E.A., Caselli, P., Myers, P.C., & Plume, R. 1998, ApJ, 503, 689
Wootten, A., Lichten, S.M., Sahai, R., & Wannier, P.G. 1982, ApJ, 257, 151
Young Owl, R.C., Meixner, M.M., Wolfire, M. Tielens, A.G.G.M., & Tauber, J. 2000, ApJ,
540, 886
This preprint was prepared with the AAS LATEX macros v5.2.
– 26 –
0 1 2 3 410
−14
10−13
10−12
10−11
10−10
10−9
AV
phot
odis
soci
atio
n ra
te (
s−1 )
CN
HCN
Fig. 1.— Photodissociation rates of CN and HCN as functions of visual extinction for a unit
Draine field.
– 27 –
Fig. 2.— CN and HCN formation pathway #1 via carbon hydride intermediates.
– 28 –
Fig. 3.— CN formation pathway #2 via oxygen hydride intermediates.
– 29 –
Fig. 4.— CN and HCN formation pathway #3 via nitrogen hydride intermediates.
– 30 –
10−7
10−5
10−3
10−1
n i (cm
−3 )
n=103 cm−3
χ=2x10²
CC+
CO
e
CN
HCN
(a)
1013
1015
1017
1019
Ni (
cm−
2 )
C
C+ CO
CN
HCN
(b)
10
−2
10−1
100
101
102
CN
/HC
N
(c)
10−6
10−4
10−2
100
n i (cm
−3 )
n=104 cm−3 χ=2x10³
C
C+
CO
e
CN
HCN
(d)
1013
1015
1017
1019
Ni (
cm−
2 ) C
C+CO
CN
HCN
(e)
10
−2
10−1
100
101
102
CN
/HC
N
(f)
10−5
10−3
10−1
101
n i (cm
−3 )
n=105 cm−3 χ=2x10⁴
C
C+
CO
e
CN
HCN
(g)
1013
1015
1017
1019
Ni (
cm−
2 )
C
C+CO
CN
HCN
(h)
10
−2
10−1
100
101
102
CN
/HC
N
(i)
0 2 4 6 8 10
10−4
10−2
100
102
AV
n i (cm
−3 )
n=106 cm−3 χ=2x10⁵
C
C+
CO
e
CN
HCN
(j)
0 2 4 6 8 10
1013
1015
1017
1019
AV
Ni (
cm−
2 )
C
C+CO
CNHCN (k)
0 2 4 6 8 1010
−2
10−1
100
101
102
AV
CN
/HC
N
(l)
Fig. 5.— Model results for n equal to 103, 104, 105, and 106 cm−3 (from top to bottom)
for constant ionization parameter χ/n = 0.2 cm3. The cosmic-ray ionization rate ζ =
5 × 10⁻¹⁷ s−1 in all four models. Displayed profiles are for C+, C, CO, CN, HCN, and
electrons, as functions of AV . The lefthand panels display the volume densities. The middle
panels show the integrated column densities. The righthand panels show the volume (dashed)
and column (solid) CN/HCN density ratios. The second row, with n = 104 cm−3, χ = 2×10³
is our “reference model”.
– 31 –
10−6
10−4
10−2
100
n i (cm
−3 )
C
C+
n=104 cm−3 χ=2x10²
CO
e
CNHCN
(a)
1013
1015
1017
1019
Ni (
cm−
2 ) C
C+CO
CN
HCN
(b)
10
−2
10−1
100
101
102
CN
/HC
N
(c)
10−6
10−4
10−2
100
n i (cm
−3 )
n=104 cm−3 χ=2x10³
C
C+
CO
e
CN
HCN
(d)
1013
1015
1017
1019
Ni (
cm−
2 ) C
C+CO
CN
HCN
(e)
10
−2
10−1
100
101
102
CN
/HC
N
(f)
10−6
10−4
10−2
100
n i (cm
−3 )
C
C+
CO
e
CN
HCN
(g)n=104 cm−3 χ=2x10⁴
1013
1015
1017
1019
Ni (
cm−
2 ) C
C+CO
CN
HCN
(h)
10
−2
10−1
100
101
102
CN
/HC
N
(i)
0 2 4 6 8 10
10−6
10−4
10−2
100
AV
n i (cm
−3 )
C
C+
CO
e
CN
HCN
(j)
n=104 cm−3 χ=2x10⁵
0 2 4 6 8 10
1013
1015
1017
1019
AV
Ni (
cm−
2 ) C
C+
CO
CN
HCN
(k)
0 2 4 6 8 1010
−2
10−1
100
101
102
AV
CN
/HC
N
(l)
Fig. 6.— Model results for n = 104 cm−3, and χ equal to 2 × 10², 2 × 10³, 2 × 10⁴, and
2× 105 cm−3, and ζ = 5× 10⁻¹⁷ s−1. The second row is our reference model.
– 32 –
10−6
10−4
10−2
100
n i (cm
−3 ) C
S and Si depleted
C+
CO
e
CN
HCN(a)
1013
1015
1017
1019
Ni (
cm−
2 )
C
C+CO
CNHCN
(b)
10
−2
10−1
100
101
102
CN
/HC
N
(c)
10−6
10−4
10−2
100
n i (cm
−3 )
C
C+
n=104 cm−3 χ=2x10³
CO
e
CN
HCN
(d)
1013
1015
1017
1019
Ni (
cm−
2 ) C
C+ CO
CN
HCN
(e)
10
−2
10−1
100
101
102
CN
/HC
N
(f)
10−6
10−4
10−2
100
n i (cm
−3 )
C
C+e
CN
HCN
(g)ζ=1.5x10⁻¹⁶ s−1
CO
1013
1015
1017
1019
Ni (
cm−
2 ) C
C+
CN
HCN
(h)
10
−2
10−1
100
101
102
CN
/HC
N
(i)
10−6
10−4
10−2
100
AV
n i (cm
−3 )
C
C+
CO
e
CN
HCN
(j)ζ=5x10⁻¹⁶ s−1
1013
1015
1017
1019
AV
Ni (
cm−
2 )
C
C+ CO
CN
HCN
(k)
10
−2
10−1
100
101
102
AV
CN
/HC
N
(l)
CO
Fig. 7.— Results for n = 104 cm−3, and χ = 2 × 10³. In the upper row the gas phase
abundances of S and Si are reduced by a factor of 100. The second row is our reference
model, with standard abundances and ζ = 5× 10⁻¹⁷ s−1. In the third and fourth rows, ζ is
increased to 1.5× 10⁻¹⁶ and 5× 10⁻¹⁶ s−1.
– 33 –
101
102
103
104
105
10−8
10−6
10−4
10−2
ni/ζ
−17 (
cm−
3)
CO C
e
C+
CN
HCN
(a)
101
102
103
104
105
10−12
10−10
10−8
10−6
10−4
ni/n
COC
e
C+
CN
HCN
(b)
101
102
103
104
105
10−3
10−2
10−1
100
101
102
n/ζ−17
(cm−3)
nC
N/n
HC
N
(c)
HIP
LIP
Fig. 8.— Densities of CN, HCN, C+, C, CO, and electrons, in the cosmic-ray dominated
cores, showing the high and low ionization phases. Panels (a) and (b) show the densities
ni/ζ−17 and density fractions ni/n, as functions of n/ζ−17, where ζ−17 is the cosmic-ray
ionization rate normalized to 1.0×10⁻¹⁷ s−1, and n is the hydrogen (H2) gas density. Panel (c)
displays the density ratio nCN/nHCN in the HIP and LIP.