assessment of tsunami flood situation from the great east ... · the tohoku pacific coast...
TRANSCRIPT

Assessment of Tsunami Flood Situation from the Great East Japan Earthquake
Hidetoshi NAKAJIMA and Mamoru KOARAI
Abstract
The massive tsunami from the 2011 off the Pacific Coast of Tohoku Earthquake (hereinafter referred to as the
“Tohoku Pacific Coast Earthquake”) that occurred on March 11, 2011, caused devastating damages along the Pacific
Coast. The GSI immediately formed an emergency team and started investigating to uncover the situation of tsunami
damage.
We emphasized on promptness in the beginning of the survey, created the "Tsunami flood area overview map" with a
purpose of improving the accuracy in our best effort over time, and kept on distributing the maps to the municipalities of the
affected areas, the national disaster response headquarters etc, while also releasing this information on the GSI website. In
addition to calculating the areas of inundation by the municipalities and by land use, an attempt was made to analyze the
distance and elevation reached by tsunami in coastal Miyagi Prefecture. Furthermore, elevation was measured precisely by
aerial laser survey mainly on areas where ground subsidence occurred due to the earthquake, and high precision elevation
data and the digital elevation topographic map have been prepared/provided.
1. Creating an inundation area overview map
1.1 Method of creation
Immediately after the tsunami disasters triggered by
the Tohoku Pacific Coast Earthquake on March 11th, the
GSI decided to create an "Tsunami flood area overview
map" to find out the situation of tsunami damage, and
created a damage overview map and also discussed about
the methods/target regions for the Tsunami flood area
overview map in the meantime until aerial photograph data
was available.
The Tsunami flood area overview map was created
by two teams: the "Interpretation Team" who records the
results of aerial photointerpretation onto a 1:25,000
topographic map, and the "Digitization Team" who
processes this information into digital data by Geographic
Information System (GIS). Normally in aerial
photointerpretation, the photographs are either printed onto
photographic paper or printed out as hard copies to visually
compare them in pairs and observe the landscapes and
features in details. However, since it was required to
promptly interpret a large number of aerial photographs this
time, the Digitization Team prioritized the speed at first by
interpreting with single (aerial) photograph data.
Specifically, they displayed high resolution image data on
the computer screen, checked for the presence of rubbles by
zooming in where necessary, and then recorded the
inundated areas on the topographic maps.
There are two types of error cause which are
"interpretation error" and "error in transferring onto
topographic map". Since single (aerial) photographs are
used for the interpretation, difference in landform
interpretation skills has little effect on the former, whereas
landform interpretation skills would be required to minimize
the latter. Thus it was decided to place those who are
experienced in landform interpretation in charge for all
interpretations this time as well.
1.2 Standard for interpretation
Interpreting the extent of tsunami is an act of
recording spots where the water depth was 0 m from the
ground level in areas inundated by tsunami. Generally, it is
difficult to judge whether tsunami had reached such spots.
Also, eight persons were assigned to the interpretation task,
but it is not favorable to have different judgments by the
interpreter. To avoid this, we set interpretation standards
such as "flood", "destruction of buildings", "forest
denudation/destruction", "tsunami flood trace on paddy
fields and villages" and "scattering of rubbles/driftwood",
and also performed crosschecks by multiple interpreters to
improve the accuracy.
1.3 Interpretation and digitization
In early afternoon on March 13th, we received the
aerial photograph data (southern Miyagi Prefecture/northern
Assessment of Tsunami Flood Situation from the Great East Japan Earthquake 55

Fukushima Prefecture) captured on the previous day, and
started the interpretation work at 13:40. The results were
constantly sent to the Digitization Team and digitized on
GIS by six persons. Interpretation of the portion captured on
the 12th was completed in less than 3 hours, and digitization
was completed in 4.5 hours. Then the data was checked and
mapped, and the GSI Tohoku Regional Survey Department
started providing the data to public organizations such as
on-site Disaster Response Headquarters from 14th the next
day.
2. Announcement of tsunami flood area sizes
(approximate numbers)
Interpretation/digitization of the aerial photographs
(1,886 in total) captured on March 12/13th was completed
by the evening of 15th, and the Tsunami flood area maps for
Iwate and Aomori Prefectures were provided in the same
night. On the other hand, we were unable to take additional
aerial photographs from the 14th due to bad weather
conditions in the Tohoku region.
As a tentative measure, we summed up the tsunami
flood area sizes by the municipality from the inundation
area maps that had already been created. At this point, the
area covered from north to south was between Hachinohe
City of Aomori Prefecture and Soma City of Fukushima
Prefecture. It must be noted, however, that we were unable
to grasp the overall picture of the tsunami flood area
because only a few strips of aerial photographs were taken
in the north area from Ishinomaki City. Upon calculating the
area sizes, we clarified the areas that had already been
photographed to avoid any misunderstanding, and also
announced the areas scheduled to be photographed at the
same time.
On March 18th which was one week after the
earthquake, we held a press release on "Tsunami flood area
sizes (approximate numbers)", and released the tsunami
flood area sizes by the municipality as well as the
"Inundation area overview map" on the GSI website.
As the photographing progressed, the Tsunami flood
area overview map was additionally modified on March
24th and April 4th, and then the tsunami flood area sizes
were updated.
3. Release of “Tsunami flood area overview map” of the
entire area
On April 8th, interpretations were completed for the
aerial photographs captured by GSI from Rokkasho Village
(Aomori) to Minamisoma City (Fukushima) and for the
satellite images of the region where flying restrictions were
imposed due to the accident at the Fukushima Daiichi
nuclear power plant. Then the Tsunami flood area overview
map and tsunami flood area sizes were released on the GSI
website. After that, we obtained aerial photographs of
coastal Chiba/Ibaraki captured on March 12th and 27th by
Chiba Prefectural Government and others, and conducted
interpretation/digitization including the satellite images of
southern Iwaki City, then released the "Tsunami flood area
overview map" (Figure 1) from Aomori to Chiba Prefecture
on April 18th.
This meant the completion of interpretation for the
entire area along the Pacific Coast that supposedly
experienced flood damages by this tsunami.
4. Land use in tsunami flood area
The land use map was created by combining the
interpretation results of the tsunami flood area and the land
use subdivision mesh data of digital national land
information. Land use classification is a collection of several
items from the digital national land information "Land use
subdivision mesh data" (FY 2006) released by the National
and Regional Planning Bureau of Ministry of Land,
Infrastructure, Transport and Tourism, then reclassifying the
data as shown in Table 1. From the land use map of the
tsunami flood area, the section from Matsushima Bay to
Sendai Plain (Matsushima Town, Matsushima District to
Watari Town, Watari District of Miyagi Prefecture ) is
shown in Figure 2.
Figure 3 shows the area sizes by land use and by the
municipality in the tsunami flood areas, calculated based on
the land use map of tsunami flood area. Ishinomaki City
recorded the largest Tsunami flood area size which
exceeded 70 km2, and its flood area size of building areas
exceeds 20 km2. In the order of tsunami flood area size,
Minamisoma City, Higashimatsushima City and Watari
Town exceeded 30 km2 then followed by Iwanuma City,
Soma City, Wakabayashi Ward (Sendai City), Natori City,
Bulletin of the Geospatial Information Authority of Japan, Vol.59 December, 201156

Fig.1 1:100,000 Tsunami flood area overview map (Sendai Area)
Tsunami Flood Area Overview Map⑬
km
LEGEND
Tsunami Flood area
Photographed area
GSI of Japan
Assessment of Tsunami Flood Situation from the Great East Japan Earthquake 57

Land use classification in this survey National Land Numerical Information
Land use subdivision mesh data
Type of land use Reference in definition
Building/arterial traffic site Building Building area Residential/urban areas
Arterial traffic Arterial traffic area Roads/railways/yards
Land for other use
Land for other use
Athletic complex, airport,
race track/baseball field/
school port district/vacant
artificial land, etc.
Paddy/other farmland/forest/wasteland/golf course
Paddy
Other farmland
Forest
Wasteland
Golf course
Rivers and lakes/seashore/salt waters
Rivers and lakes
Seashore
Seawater
Table 1 Land use classification
Yamamoto Town and Miyagino Ward (Sendai City) all
exceeding 20 km2, which indicates that the municipalities in
Ishinomaki Plain and Sendai Plain occupy the top of the list.
When we looked at the tsunami flood area sizes of
building areas by the municipality, high numbers were
found in the area from the center of Iwate Prefecture to
northern Fukushima Prefecture. In the order of tsunami
flood area size by building areas, Ishinomaki City marked
the highest number followed by Higashimatsushima City,
Kesennuma City and Iwaki City all exceeding 5 km2,
respectively.
Also, Figure 4 shows the area size ratios of building
areas inundated by tsunami in each municipality which are
indicated with different colors. More than 50% in Otsuchi
Town, Minamisanriku Town and Higashimatsushima City,
and more than 40% in Rikuzentakata City, Ishinomaki City,
Onagawa Town and Yamamoto Town were inundated.
Table 2 shows the land use component ratio of
tsunami flood areas by the prefecture. Of the entire tsunami
flood area, paddy field is the highest with 37%, followed by
building area (20%), land of other use (10%), rivers and
lakes (9%), and forest (7%). By the prefectures, Miyagi and
Fukushima had high ratios of paddy field and Iwate had a
high ratio of building areas, whereas Aomori, Ibaraki and
Chiba marked high ratios of seashore and land for other use.
5. Analysis of tsunami travel distance and elevation
Using the data of the Tsunami flood area overview
map released on April 18th, we targeted Miyagi Prefecture
and analyzed the tsunami travel distance and elevation of
the areas hit by the tsunami. Measurements were performed
in the following method:
① Between the borders of Iwate and Fukushima in the
Tsunami flood area overview map, count one mesh for
longitude/latitude with a flood area boundary (sections of
outer perimeter of the inundation extent polygon that are not
shorelines such as coastlines) as 1 point, and randomly
select 254 points reached by tsunami, then assign ID
numbers clockwise from north along the coastline.
② On GIS, estimate the route from which the tsunami
intruded into each spot in ①, then measure the distance
(traveled by tsunami).
③ Measure the elevation of areas hit by the tsunami (points
where boundaries are drawn on Tsunami flood area
overview map) by overlaying the Tsunami flood area
overview map and the high precision elevation data (DEM)
Bulletin of the Geospatial Information Authority of Japan, Vol.59 December, 201158

Fig.2 Land use map of tsunami flood areas (around Sendai Plain)
Assessment of Tsunami Flood Situation from the Great East Japan Earthquake 59

Fig. 3 Area sizes by land use in tsunami flood areas by the municipality
Paddy Other
farmland
Forest Wasteland Building
area
Arterial
traffic
area
Land for
other use
Rivers
and lakes
Seashore Seawater Golf
course
Aomori 3% 2% 10% 6% 10% 1% 21% 9% 33% 6% 0%
Iwate 17% 4% 9% 1% 34% 3% 15% 10% 3% 4% 0%
Miyagi 41% 7% 7% 1% 21% 2% 8% 10% 2% 1% 0%
Fukushima 53% 3% 4% 1% 12% 2% 9% 7% 3% 7% 0%
Ibaraki 6% 2% 4% 1% 15% 1% 23% 6% 29% 12% 0%
Chiba 21% 6% 12% 2% 15% 0% 8% 2% 23% 12% 0%
Total 37% 5% 7% 1% 20% 2% 10% 9% 6% 4% 0%
Table 2 Land use component ratio of tsunami flood areas by the prefecture (%)
Bulletin of the Geospatial Information Authority of Japan, Vol.59 December, 201160

Fig. 4 Tsunami flood percentage of building area by the municipality
Assessment of Tsunami Flood Situation from the Great East Japan Earthquake 61
measured right after the disaster.
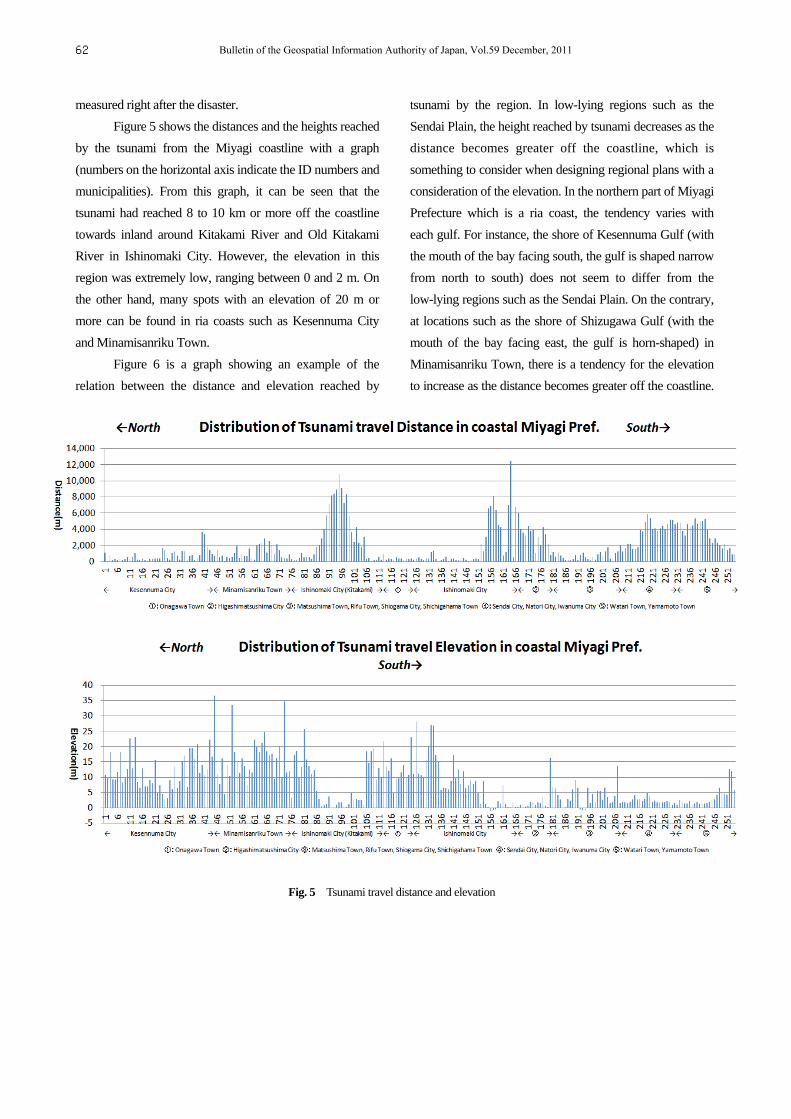
Figure 5 shows the distances and the heights reached
by the tsunami from the Miyagi coastline with a graph
(numbers on the horizontal axis indicate the ID numbers and
municipalities). From this graph, it can be seen that the
tsunami had reached 8 to 10 km or more off the coastline
towards inland around Kitakami River and Old Kitakami
River in Ishinomaki City. However, the elevation in this
region was extremely low, ranging between 0 and 2 m. On
the other hand, many spots with an elevation of 20 m or
more can be found in ria coasts such as Kesennuma City
and Minamisanriku Town.
Figure 6 is a graph showing an example of the
relation between the distance and elevation reached by
tsunami by the region. In low-lying regions such as the
Sendai Plain, the height reached by tsunami decreases as the
distance becomes greater off the coastline, which is
something to consider when designing regional plans with a
consideration of the elevation. In the northern part of Miyagi
Prefecture which is a ria coast, the tendency varies with
each gulf. For instance, the shore of Kesennuma Gulf (with
the mouth of the bay facing south, the gulf is shaped narrow
from north to south) does not seem to differ from the
low-lying regions such as the Sendai Plain. On the contrary,
at locations such as the shore of Shizugawa Gulf (with the
mouth of the bay facing east, the gulf is horn-shaped) in
Minamisanriku Town, there is a tendency for the elevation
to increase as the distance becomes greater off the coastline.
Fig. 5 Tsunami travel distance and elevation
Bulletin of the Geospatial Information Authority of Japan, Vol.59 December, 201162

Fig. 6 Relation between tsunami travel distance and tsunami travel elevation
6. 1:25,000 Tsunami flood area map
Although a "1:25,000 manuscript map" was created
since the interpretation results of the inundation area
overview map had already been filled on a 1:25,000
topographic map and turned to GIS, this draft map does not
satisfy the accuracy of 25,000 scale (for example, a
topographic map includes building numbers which are not
in the Tsunami flood area overview map) because speed
was initially prioritized in the creation process. For this
reason, the Tsunami flood area overview map was released
as a 1:100,000 scale map in order to match its accuracy with
the interpretation results.
However, since information with indications of the
tsunami flood areas on a large scale map was necessary for
the search of missing persons and recovery operations, we
have been providing "manuscript maps" to public
organizations such as the government and municipalities, on
the condition that the accuracy of the information would be
limited.
After releasing the overview map for the entire area
on April 18th, the Interpretation Team performed
interpretations once again to release the "1:25,000 Tsunami
flood area overview map" at an early stage. In addition, the
preparation of high precision elevation data by the
post-quake aerial laser survey (see 8.) was almost complete
by the end of April, which enabled us to perform checks
base on this data. Hence it was assumed that the accuracy
had improved by a certain level, and we also marked the
inundated areas with the release of "1:25,000 digital
elevation topographic map (PDF version)" created from the
high precision elevation data mentioned earlier, and started
releasing the information of Miyagi Prefecture from May
31st. Also, with the progress of the aerial laser survey, we
started releasing a series of "1:25,000 Tsunami flood area
overview maps" based on the Digital Japan Basic Map from
June (Figure 7).
Kesennuma Bay Shizugawa Bay
Assessment of Tsunami Flood Situation from the Great East Japan Earthquake 63

Fig. 7 1:25,000 Tsunami flood area overview map (Minamisanriku Area) This tsunami flood area overview map was created by using the aerial photographs captured by GSI on 12/13 March, 2011 to map the tsunami flood areas on a 1:25,000 topographic map. Since aerial photography was conducted mainly in the coastal areas that suffered great damage, some tsunami flood areas may not be covered." Also note that some tsunami flood areas could not be completely interpreted due to the clouds, etc.
7. Survey of the damages and inundation extent in flood
areas
7.1 Outline of survey
To investigate the building damages and inundation
depths, field survey was conducted from Kuji City in Iwate
to Iwanuma City in Miyagi using the Mobile Mapping
System, while we also performed checks on the Tsunami
flood area overview maps created from aerial
photointerpretation.
Mobile Mapping System is a device capable of
acquiring omnidirectional (360 degrees) image data, which
can record the damages on individual buildings and roads
by tsunami and the recovery situation such as the progress
of debris removal as digital image information at eye level
of citizens. By recording such data, we can share more
detailed information of the affect areas with municipalities
and the national organizations related to restoration work,
which is essential for community-based restoration planning.
This system allows for acquisition of accurate positional
information by GPS and such, which enables 3D
measurements (e.g. position, height) of the target on the
image. In the survey, we acquired omnidirectional data
around a highway with a total road length of approximately
700 km and measured the inundation traces left on the
buildings to investigate the building damages and
inundation depths.
7.2 Survey results on building damages and inundation
depths
With an inundation depth around 1.5 to 2 m, many
houses had retained their original shapes. When the depth
was 3 to 4 m or above, many old wooden houses were
completely destroyed. If the depth was 10 m or above,
devastating damage was seen on most buildings except for a
31 May 2011 ver.2
GSI of Japan
Tsunami flood area Photographed area
Tsunami flood area overview map
Bulletin of the Geospatial Information Authority of Japan, Vol.59 December, 201164

few robust, reinforced 4-5 storey buildings. It should also be
noted that the inundation heights and the extent of damages
on buildings vary depending the gulf shape or water depth.
7.3 Survey results on tsunami flood areas and extent
The tsunami flood areas and extent reached by
tsunami were checked on site from the situation of rubble
deposition and inundation traces on the buildings. When the
traces were unclear, we conducted hearings from the local
residents.
The results of on-site survey mostly matched with
the Tsunami flood area overview map created from aerial
photointerpretation.
8. Aerial laser survey and creation/provision of digital
elevation topographic map
As mentioned earlier, the Tohoku Pacific Coast
Earthquake caused ground subsidence in a wide area mainly
around the Pacific Coast due to crustal movements, as well
as landform changes by the tsunami. The GSI first
coordinated with Miyagi Prefecture to immediately prepare
high precision elevation data for coastal Miyagi area by
using the data from the aerial laser survey that the prefecture
conducted right after the disaster, and provided this data to
associated organizations from late April.
Also, upon the passage of the first supplementary
budget of FY 2011, we conducted aerial laser survey along
the Pacific Coast between Iwate and Chiba Prefecture from
May to obtain high precision elevation data of a large area
to be used as basic documents for recovery/restoration plans,
and then provided this data to associated organizations from
late August. In addition, we prepared a 1:25,000 digital
elevation topographic map which is the visualization of
these results (Figure 8).
As of end of 2011, digital elevation topographic
maps for which we conducted aerial laser survey in the area
from Hirono Town in Iwate to Ichinomiyama City in Chiba
along the Pacific Coast (except for some parts of Fukushima
Prefecture), have been provided in 25,000 scale maps (40
sides in A0 format) to the affected municipalities and other
associated organizations, and also released as PDF map
images (205 sides in A3 format) on the GSI website. The
A0 format maps are also scheduled to be provided in printed
forms to the associated organizations. Note that all the high
precision elevation data will soon be available to the public
as the Fundamental Geospatial Data (5 m mesh elevation).
Fig. 8 1:25,000 digital elevation topographic map (Minamisanriku Area)
Assessment of Tsunami Flood Situation from the Great East Japan Earthquake 65

9. Conclusion
The Great East Japan Earthquake was a catastrophic
disaster affecting an extremely large area, and an assessment
of the situation was needed urgently. For the fact that we
managed to grasp the damage situation by aerial
photography and interpretation immediately from the day
after the Tohoku Pacific Coast Earthquake and also provide
Tsunami flood area overview maps from the fourth day with
the cooperation of the GSI Tohoku Regional Survey
Department in spite of very limited transport/communication
infrastructures, we consider this result as an outcome of
utilizing the experiences and technical strengths
accumulated through our past disaster responses. For
disaster responses in the future, it is necessary to summarize
the experiences from this disaster while keeping up-to-date
with new technologies. In particular, the high precision
elevation data and the digital elevation topographic map
which are products of aerial laser survey, turned out to be
extremely useful for improving the interpretation accuracy
and analyzing the tsunami flood areas. It indicates that these
are also extremely effective for disaster prevention, that we
need to expand the methods to utilize and notify the local
authorities of such information.
As the Great East Japan Earthquake led to the
reacknowledgment of the effectiveness of geospatial
information in tsunami countermeasures, a budget to
conduct aerial laser surveys in areas with possible disaster
concerns such as "Chishima Trench earthquake" and
"Tokai/Tonankai/Nankai earthquake" was approved at the
third supplementary budget of FY 2011. Surveys have
already been started in Tokushima/Kochi/Ehime/Miyazaki
coastal regions where tsunami disasters by Nankai
earthquake are concerned, and the results are expected to be
available around April in 2012. For the other target regions,
we also plan to start the surveys while taking into account
the weather conditions.
In regard to the affected areas of the Great East
Japan Earthquake, it is expected of the whole nation to deal
with the recovery/restoration on a continuous basis. Also,
earthquakes are something that cannot be avoided for us
living in the seismically active Japanese Archipelago.
However, we have also learnt from the lessons in the past
that damages can be dramatically reduced by implementing
prevention measures in advance. We would like to continue
giving our best effort so that fundamental geospatial
information such as aerial photographs, maps and high
precision elevation data will be of any assistance in building
disaster-resistant, vibrant regions, as well as for the purpose
of disaster prevention/minimization.
References
GSI Website: Heisei 23 nen (2011 nen) higashi nihon
daishinsai ni kansuru jouhou teikyou (Provision of
information on the 2011 Great East Japan Earthquake
(Japanese))http://www.gsi.go.jp/BOUSAI/h23_tohoku.ht
ml (accessed 30 Nov. 2011)
GSI Website: Tsunami ni yoru shinsui hani no menseki
(gairyakuchi) ni tsuite (Tsunami flood area sizes
(approximate numbers) (Japanese)) http://www.gsi. go.
jp/kikaku/kikaku60001.html (accessed 30 Nov. 2011)
GSI Website: Tsunami shinsui hani no tochi riyou (Land use
in tsunami flood areas (Japanese)) http://www.gsi.go.jp/
chirijoho/chirijoho40022.html (accessed 30 Nov. 2011)
GSI Website: Shinsui hani no tochi riyou betsu menseki
Area sizes by land use in tsunami flood areas (Japanese)
http://www.gsi.go.jp/chirijoho/chirijoho40022.htm
(accessed 30 Nov. 2011)
GSI Website: Dejitaru hyoukou chikeizu
The Digital Elevation Topographic Map (Japanese)
http://www1.gsi.go.jp/geowww/dhmap2/
(accessed 30 Nov. 2011)
Hidetoshi NAKAJIMA, Nobuyuki WATANABE (2011):
Grasp of flood damage area by the 2011 off the Pacific
coast of Tohoku Earthquake Tsunami (Japanese), Civil
Engineering document, 53-8, 8-11
Bulletin of the Geospatial Information Authority of Japan, Vol.59 December, 201166