tsunami source of the 2011 off the pacific coast of tohoku ... · tsunami waveform inversion for...
TRANSCRIPT

LETTER Earth Planets Space, 63, 815–820, 2011
Tsunami source of the 2011 off the Pacific coast of Tohoku Earthquake
Yushiro Fujii1, Kenji Satake2, Shin’ichi Sakai2, Masanao Shinohara2, and Toshihiko Kanazawa2
1International Institute of Seismology and Earthquake Engineering (IISEE), Building Research Institute (BRI),1-3 Tachihara, Tsukuba, Ibaraki 305-0802, Japan
2Earthquake Research Institute (ERI), University of Tokyo, 1-1-1 Yayoi, Bunkyo-ku, Tokyo 113-0032, Japan
(Received April 9, 2011; Revised June 6, 2011; Accepted June 7, 2011; Online published September 27, 2011)
Tsunami waveform inversion for the 11 March, 2011, off the Pacific coast of Tohoku Earthquake (M 9.0)indicates that the source of the largest tsunami was located near the axis of the Japan trench. Ocean-bottompressure, and GPS wave, gauges recorded two-step tsunami waveforms: a gradual increase of sea level (∼2 m)followed by an impulsive tsunami wave (3 to 5 m). The slip distribution estimated from 33 coastal tide gauges,offshore GPS wave gauges and bottom-pressure gauges show that the large slip, more than 40 m, was locatedalong the trench axis. This offshore slip, similar but much larger than the 1896 Sanriku “tsunami earthquake,”is responsible for the recorded large impulsive peak. Large slip on the plate interface at southern Sanriku-oki(∼30 m) and Miyagi-oki (∼17 m) around the epicenter, a similar location with larger slip than the previouslyproposed fault model of the 869 Jogan earthquake, is responsible for the initial water-level rise and, presumably,the large tsunami inundation in Sendai plain. The interplate slip is ∼10 m in Fukushima-oki, and less than 3 min the Ibaraki-oki region. The total seismic moment is estimated as 3.8 × 10²² N m (Mw = 9.0).Key words: 2011 Tohoku Earthquake, slip distribution, tsunami waveform inversion, ocean-bottom pressuregauge, GPS wave gauge.
1. IntroductionA giant earthquake off the Pacific coast of Tohoku, Japan
(38.1035◦N, 142.861◦E, M 9.0 at 14:46:18 JST accordingto Japan Meteorological Agency) on March 11, 2011, gen-erated a huge tsunami and caused 15,729 fatalities and4,539 missing in the Hokkaido, Tohoku and Kanto regions(The National Police Agency, as of 24 Aug. 2011). TheUSGS W-phase moment tensor solution shows a shallowdipping thrust mechanism with a strike parallel to the Japantrench, indicating an interplate earthquake associated withthe subduction of the Pacific plate (Fig. 1). Continuous GPSdata revealed coastal subsidence as great as one meter alongthe coast of the Tohoku area (Geospatial Information Au-thority of Japan (GSI), 2011).
The Pacific coasts of Tohoku have suffered from largetsunamis in the past. The 1896 Sanriku earthquake causedlarge (up to 38 m of run-up height) tsunamis on the Sanrikucoast with 22,000 casualties, although the seismic shak-ing was not very strong. The source of the tsunami ofthis “tsunami earthquake” (Kanamori, 1972) was locatednear the trench axis (Tanioka and Satake, 1996b). The1933 Sanriku earthquake, a large normal-fault earthquake(Kanamori, 1971) also caused a large (up to 29 m) tsunamiwith about 3,000 casualties. The tsunami heights from theseSanriku earthquakes were less than a few meters in theSendai plain. However, the 869 Jogan earthquake produceda large tsunami inundation up to a few kilometers (Minoura
Copyright c© The Society of Geomagnetism and Earth, Planetary and Space Sci-ences (SGEPSS); The Seismological Society of Japan; The Volcanological Societyof Japan; The Geodetic Society of Japan; The Japanese Society for Planetary Sci-ences; TERRAPUB.
doi:10.5047/eps.2011.06.010
and Nakaya, 1991), which was modeled by an interplateearthquake (Satake et al., 2008).
On the basis of large historical earthquakes, The Earth-quake Research Committee (ERC) (2009) made long-termforecasts in northern, central, and southern Sanriku-oki,Miyagi-oki, Fukushima-oki and Ibaraki-oki regions, as wellas tsunami earthquakes near the trench axis. The estimatedearthquake size was M ∼ 7.7 for southern Sanriku-oki,M ∼ 7.5 for Miyagi-oki, M ∼ 7.4 for Fukushima-oki,M ∼ 6.7–7.2 for Ibaraki-oki, and M ∼ 8.2 for offshoretsunami earthquakes. The ERC also considered a multiplesegment rupture of the Miyagi-oki and southern Sanriku-oki regions with an estimated size of M ∼ 8.0.
In this paper, we estimate the tsunami source of the2011 Tohoku Earthquake by inverting tsunami waveformsrecorded at tide and wave gauges, GPS wave gauges andocean-bottom tsunami sensors.
2. Tsunami DataBecause of the severity and wide extent of the tsunami
damage, tsunami field surveys are still ongoing. Prelim-inary surveys reported tsunami run-up heights exceeding30 m (The 2011 Tohoku Earthquake Tsunami Joint SurveyGroup, 2011).
The 2011 tsunami was also recorded instrumentally atvarious gauges. Many coastal tide gauges on the Pacificcoast stopped recording after the first tsunami with >9 mamplitude, because of power failure or because the stationswere washed away by the tsunami. Three offshore gauges,one GPS wave gauge (Iwate S at ∼200 m water depth) andtwo cabled pressure-gauges (TM-2 at ∼1,000 m and TM-1at 1,600 m depth), recorded the two-stage tsunamis (Fig. 2).
815
816 Y. FUJII et al.: TSUNAMI SOURCE OF THE 2011 TOHOKU EARTHQUAKE
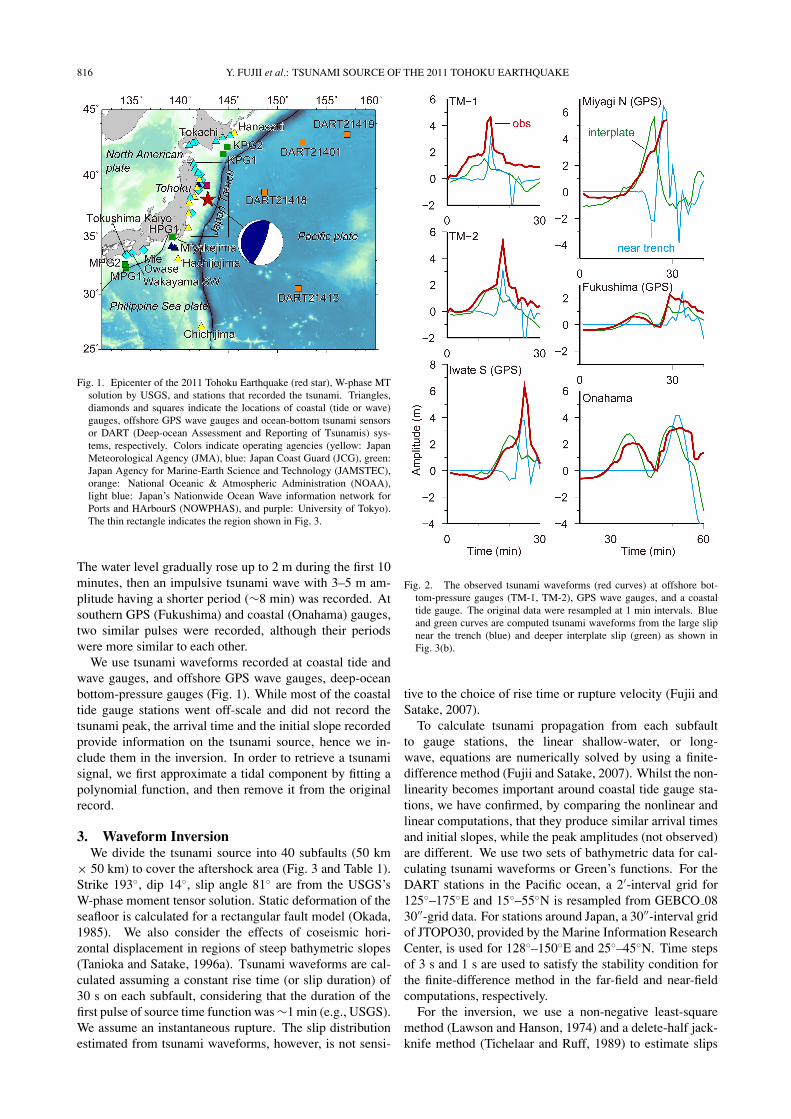
Fig. 1. Epicenter of the 2011 Tohoku Earthquake (red star), W-phase MTsolution by USGS, and stations that recorded the tsunami. Triangles,diamonds and squares indicate the locations of coastal (tide or wave)gauges, offshore GPS wave gauges and ocean-bottom tsunami sensorsor DART (Deep-ocean Assessment and Reporting of Tsunamis) sys-tems, respectively. Colors indicate operating agencies (yellow: JapanMeteorological Agency (JMA), blue: Japan Coast Guard (JCG), green:Japan Agency for Marine-Earth Science and Technology (JAMSTEC),orange: National Oceanic & Atmospheric Administration (NOAA),light blue: Japan’s Nationwide Ocean Wave information network forPorts and HArbourS (NOWPHAS), and purple: University of Tokyo).The thin rectangle indicates the region shown in Fig. 3.
The water level gradually rose up to 2 m during the first 10minutes, then an impulsive tsunami wave with 3–5 m am-plitude having a shorter period (∼8 min) was recorded. Atsouthern GPS (Fukushima) and coastal (Onahama) gauges,two similar pulses were recorded, although their periodswere more similar to each other.
We use tsunami waveforms recorded at coastal tide andwave gauges, and offshore GPS wave gauges, deep-oceanbottom-pressure gauges (Fig. 1). While most of the coastaltide gauge stations went off-scale and did not record thetsunami peak, the arrival time and the initial slope recordedprovide information on the tsunami source, hence we in-clude them in the inversion. In order to retrieve a tsunamisignal, we first approximate a tidal component by fitting apolynomial function, and then remove it from the originalrecord.
3. Waveform InversionWe divide the tsunami source into 40 subfaults (50 km
× 50 km) to cover the aftershock area (Fig. 3 and Table 1).Strike 193◦, dip 14◦, slip angle 81◦ are from the USGS’sW-phase moment tensor solution. Static deformation of theseafloor is calculated for a rectangular fault model (Okada,1985). We also consider the effects of coseismic hori-zontal displacement in regions of steep bathymetric slopes(Tanioka and Satake, 1996a). Tsunami waveforms are cal-culated assuming a constant rise time (or slip duration) of30 s on each subfault, considering that the duration of thefirst pulse of source time function was ∼1 min (e.g., USGS).We assume an instantaneous rupture. The slip distributionestimated from tsunami waveforms, however, is not sensi-
Fig. 2. The observed tsunami waveforms (red curves) at offshore bot-tom-pressure gauges (TM-1, TM-2), GPS wave gauges, and a coastaltide gauge. The original data were resampled at 1 min intervals. Blueand green curves are computed tsunami waveforms from the large slipnear the trench (blue) and deeper interplate slip (green) as shown inFig. 3(b).
tive to the choice of rise time or rupture velocity (Fujii andSatake, 2007).
To calculate tsunami propagation from each subfaultto gauge stations, the linear shallow-water, or long-wave, equations are numerically solved by using a finite-difference method (Fujii and Satake, 2007). Whilst the non-linearity becomes important around coastal tide gauge sta-tions, we have confirmed, by comparing the nonlinear andlinear computations, that they produce similar arrival timesand initial slopes, while the peak amplitudes (not observed)are different. We use two sets of bathymetric data for cal-culating tsunami waveforms or Green’s functions. For theDART stations in the Pacific ocean, a 2′-interval grid for125◦–175◦E and 15◦–55◦N is resampled from GEBCO 0830′′-grid data. For stations around Japan, a 30′′-interval gridof JTOPO30, provided by the Marine Information ResearchCenter, is used for 128◦–150◦E and 25◦–45◦N. Time stepsof 3 s and 1 s are used to satisfy the stability condition forthe finite-difference method in the far-field and near-fieldcomputations, respectively.
For the inversion, we use a non-negative least-squaremethod (Lawson and Hanson, 1974) and a delete-half jack-knife method (Tichelaar and Ruff, 1989) to estimate slips

Y. FUJII et al.: TSUNAMI SOURCE OF THE 2011 TOHOKU EARTHQUAKE 817
Fig. 3. (a) Slip distributions estimated by tsunami waveform inversion. The color bars are shown below. The subfault numbers are shown in thenorthernmost and southernmost subfaults. The star shows the mainshock epicenter. Circles indicate aftershocks within one day after the mainshock(JMA data). Dashed lines indicate regions where the probabilities and size of future subduction-zone earthquakes were estimated by the EarthquakeResearch Committee (2009). Coastal and offshore stations (the same symbol as Fig. 1) are also shown. (b) Seafloor deformation computed fromthe estimated slip distribution. The red solid contours indicate uplift with a contour interval of 1.0 m, whereas the blue dashed contours indicatesubsidence, with a contour interval of 0.5 m. The light blue and dark green frames show the subfaults with >2 m slips. The synthetic tsunamiwaveforms are computed from these two regions (near the trench axis and interplate slip) and shown in Fig. 2.
and errors, respectively. The observed tsunami waveformswere resampled at 1 min intervals, hence synthetic wave-forms are also computed at 1 min intervals. The total num-ber of data points used for the inversion is 2818. Consider-ing the different amplitude and signal durations of tsunamiwaveforms recorded on DART gauges, GPS gauges, andcoastal tide gauge data, we use variable weights so that therelative powers become similar. We weight nearby GPSgauge and bottom-pressure data 10, 20, or 30 times, andnear-source tide gauge data 2 times or 10 times, becausethe duration of these data are shorter than the far-field sta-tions. We also weight the DART data ten times, because theamplitudes are much smaller.
4. The Slip DistributionThe inversion results are shown in Fig. 3(a) and Table 1.
The result shows a tsunami source length (with >2 m slip)of about 350 km, extending from over southern Sanriku-oki,Miyagi-oki, Fukushima-oki as well as near the trench axis.The largest slips of more than 40 m are estimated along theJapan trench axis off southern Sanriku-oki (subfaults 4 and5). Around the epicenter, in the southern Sanriku region(subfaults 14 and 15), the estimated slip is 28–34 m. On the
deeper subfault in the Miyagi-oki region (subfaults 24, 25,34 and 35), the slip is 9–23 m. To the north of the epicenter,5–11 m slip is estimated in a part of central Sanriku region(subfault 13 and 23). To the south, the slip is ∼10 m inthe Fukushima-oki region (subfaults 27 and 28), and <3 min the Ibaraki-oki region (subfaults 29 and 30). The totalseismic moment is calculated from these slip distributionsas 3.8 × 10²¹ N m (Mw = 9.0) by assuming a rigidity of5.0 × 1010 N/m2 for all the subfaults. The slip distributionand the size clearly indicate that multiple segments of theERC’s long-term forecast ruptured simultaneously.
The synthetic waveforms generally agree with the ob-served ones at most stations (Fig. 4). The two-stage tsunamiobserved at offshore gauges (TM-1, TM-2, Iwate M, andIwate S) is well reproduced. The initial part of the tsunami,a small negative wave followed by a gradual increase atcoastal tide gauge stations (Miyako, Kamaishi, Ofunato andSoma) is also reproduced.
Seafloor deformation calculated from the estimated slipdistribution (Fig. 3(b)) shows a very large uplift (>10 m)near the trench axis and about 5-m uplift near the epicenter.Near the coast, subsidence up to 2 m, as observed by theGPS data (GSI, 2011) is predicted.

818 Y. FUJII et al.: TSUNAMI SOURCE OF THE 2011 TOHOKU EARTHQUAKE
Table 1. Slip distributions estimated by tsunami waveform inversion.
No. Lat. (◦N) Lon. (◦E) Depth (km) Slip and error (m)
1 39.738 144.331 0 0.00±0.23
2 39.3 144.20 0 0.00±0.15
3 38.862 144.069 0 5.66±4.85
4 38.424 143.939 0 41.15±17.14
5 37.986 143.810 0 47.93±21.49
6 37.547 143.682 0 8.44±4.25
7 37.135 143.40 0 0.00±1.81
8 36.730 143.07 0 0.00±0.87
9 36.325 142.74 0 1.89±0.75
10 35.905 142.504 0 0.63±0.97
11 39.836 143.778 12.1 0.00±0.03
12 39.398 143.651 12.1 0.81±0.44
13 38.960 143.523 12.1 10.67±6.16
14 38.522 143.397 12.1 27.84±11.09
15 38.084 143.271 12.1 33.79±18.47
16 37.646 143.146 12.1 24.11±9.30
17 37.233 142.867 12.1 0.00±2.50
18 36.828 142.540 12.1 0.00±0.32
19 36.423 142.213 12.1 0.00±0.24
20 36.003 141.979 12.1 0.00±0.91
21 39.934 143.224 24.2 0.00±0.41
22 39.496 143.100 24.2 0.00±0.27
23 39.058 142.977 24.2 4.86±3.99
24 38.620 142.853 24.2 19.56±9.68
25 38.182 142.731 24.2 23.38±12.54
26 37.744 142.609 24.2 13.13±5.81
27 37.331 142.333 24.2 11.13±5.44
28 36.926 142.009 24.2 2.23±1.66
29 36.521 141.684 24.2 2.25±2.02
30 36.101 141.454 24.2 0.54±0.31
31 40.032 142.670 36.3 0.00±0.42
32 39.594 142.549 36.3 0.00±0.17
33 39.156 142.430 36.3 0.00±0.55
34 38.718 142.309 36.3 14.64±8.98
35 38.280 142.190 36.3 9.46±4.44
36 37.842 142.071 36.3 0.00±0.00
37 37.429 141.798 36.3 0.00±1.88
38 37.024 141.477 36.3 0.00±0.07
39 36.619 141.155 36.3 0.00±0.00
40 36.199 140.928 36.3 0.00±1.22
Location (latitude [Lat.] and longitude [Lon.]) indicates the northeast corner of eachsubfault.
5. Discussions and ConclusionsThe large slip estimated near the trench axis is similar to
the 1896 Sanriku earthquake (Tanioka and Satake, 1996b),although the 2011 slip was much larger. Large offshore slipis responsible for the very large and destructive tsunami onthe Sanriku coast. To confirm this, we computed tsunamiwaveforms from the large slip near the trench axis, andcompared it with the tsunami waveforms at selected off-shore stations (Fig. 2). The computed tsunami waveformsshow later arrivals than the observed initial tsunami arrivals,but reproduce the large impulsive tsunamis.
Unlike the 1896 earthquake, large slip was also estimatedon the plate interface at a deeper depth in the southernSanriku-oki and Miyagi-oki regions. The initial gradualrise of sea level observed at some stations is due to inter-
plate slip (Fig. 2). Large tsunami inundation (>5 km) in theSendai plain may be due to such a nearshore, deeper slipon the plate interface. For the 869 Jogan tsunami, a simi-lar large inundation (a few km) estimated from the tsunamideposits was reproduced only by an interplate model. Anarrow fault near the trench axis (“tsunami earthquake”model) or an outer-rise normal fault model could not pro-duce a large inundation, because of the shorter wavelengthof seafloor deformation (Satake et al., 2008).
The inversion of available tsunami waveforms showedthat the large tsunami from the 2011 off the Pacific coast ofTohoku Earthquake was produced by both a very large dis-placement near the trench axis and a deeper interplate slipin the southern Sanriku-oki, Miyagi-oki, and Fukushima-oki regions. The former explains the largest and impul-

Y. FUJII et al.: TSUNAMI SOURCE OF THE 2011 TOHOKU EARTHQUAKE 819
Fig. 4. Comparisons of the observed (red curves) and synthetic (blue curves) tsunami waveforms computed from the estimated slip distribution. Timeranges shown by solid curves are used for the inversions; the dashed parts are not used for the inversions, but shown for comparison. Note the samevertical scales for bottom-pressure gauges (the upper left two columns), GPS wave gauges (upper central two columns) and coastal tide and wavegauges (upper right one column and bottom columns). See Figs. 1 and 3(a) for the station locations.
sive tsunami waveforms, while the latter reproduces theinitial part of the tsunami waveforms, as well as the largeinundation on the Sendai plain. The survey results ofcoastal tsunami run-up, for example >30 m near the cen-
tral Sanriku-oki region, may require additional tsunamisource(s), not revealed by available tsunami waveform data.

820 Y. FUJII et al.: TSUNAMI SOURCE OF THE 2011 TOHOKU EARTHQUAKE
Acknowledgments. JCG and JMA provided tide gauge data.Ports and Harbors Bureau (PHB) under the Ministry of Land, In-frastructure, Transport and Tourism (MLIT) and Port and AirportResearch Institute (PARI) provided tide gauge, wave gauge andGPS wave gauge data. The data of ocean-bottom tsunami sen-sors of JAMSTEC and DART of NOAA were downloaded fromtheir web sites. Most of the figures were generated using GenericMapping Tools (Wessel and Smith, 1998). This research was par-tially supported by Grants-in-Aid for Scientific Research (B) (No.21310113), Ministry of Education, Culture, Sports, Science andTechnology (MEXT).
ReferencesEarthquake Research Committee, Long-term forecast of earthquakes from
Sanriku-oki to Boso-oki (revised), Headquarters for Earthquake Re-search Promotion, 80 pp, 2009 (in Japanese).
Fujii, Y. and K. Satake, Tsunami source of the 2004 Sumatra-AndamanEarthquake inferred from tide gauge and satellite data, Bull. Seismol.Soc. Am., 97, S192–S207, 2007.
Geospatial Information Authority of Japan, The 2011 off the Pacific coastof Tohoku Earthquake: Crustal deformation and fault model (prelimi-nary), http://www.gsi.go.jp/cais/topic110313-index-e.html, 2011.
Kanamori, H., Seismological evidence for a lithospheric normal faulting—The Sanriku earthquake of 1933, Phys. Earth Planet. Inter., 4, 289–300,1971.
Kanamori, H., Mechanism of tsunami earthquake, Phys. Earth Planet.Inter., 6, 346–359, 1972.
Lawson, C. L. and R. J. Hanson, Solving Least Squares Problems, 340 pp.,Prentice-Hall, Inc., Englewood Cliffs, N.J., 1974.
Minoura, K. and S. Nakaya, Traces of tsunami preserved in inter-tidallacustrine and marsh deposits: some examples from northeast Japan, J.Geol., 99, 265–287, 1991.
Okada, Y., Surface deformation due to shear and tensile faults in a half-space, Bull. Seismol. Soc. Am., 75, 1135–1154, 1985.
Satake, K., Y. Namegaya, and S. Yamaki, Numerical simulation of the AD869 Jogan tsunami in Ishinomaki and Sendai plains, Ann. Rep. ActiveFault Paleoearthq. Res., 8, 71–89, 2008 (in Japanese with English ab-stract).
Tanioka, Y. and K. Satake, Tsunami generation by horizontal displacementof ocean bottom, Geophys. Res. Lett., 23, 861–864, 1996a.
Tanioka, Y. and K. Satake, Fault parameters of the 1896 Sanriku tsunamiearthquake estimated from numerical modeling, Geophys. Res. Lett., 23,1549–1552, 1996b.
The 2011 Tohoku Earthquake Tsunami Joint Survey Group, The 2011off the Pacific coast of Tohoku Earthquake Tsunami Information,http://www.coastal.jp/tsunami2011/, 2011.
Tichelaar, B. W. and L. J. Ruff, How good are our best models? Jack-knifing, bootstrapping, and earthquake depth, Eos Trans. AGU, 70, 593,605–606, 1989.
Wessel, P. and W. H. F. Smith, New, improved version of the GenericMapping Tools released, Eos Trans. AGU, 79, 579, 1998.
Y. Fujii (e-mail: [email protected]), K. Satake, S. Sakai, M.Shinohara, and T. Kanazawa