asce/jsce tohoku tsunami investigation of structural ...asce/jsce tohoku tsunami investigation of...
TRANSCRIPT
1
ASCE/JSCE Tohoku Tsunami Investigation of Structural Damage and Development of the ASCE 7 Tsunami Design Code for Buildings and Other Structures
by Gary Chock1
ABSTRACT ASCE has sponsored several reconnaissance teams to survey various effects of the Great East Japan Earthquake and Tohoku Tsunami. The first of these was the ASCE Tsunami Team, which traveled to Japan from April 15 to May 1 and focused on tsunami effects on coastal infrastructure including buildings, bridges, port facilities and coastal protective structures. Members of the team were from the ASCE7 subcommittee on Tsunami Loads and Effects. This committee was formed to draft a chapter on Tsunami Loads and Effects for inclusion in the 2016 edition of ASCE7, Minimum Design Loads for Buildings and Other Structures. The purpose of this ASCE tsunami reconnaissance trip has been to investigate and document the performance of buildings and other structures in Japan, with the specific intent to apply this experience in ongoing work to develop tsunami structural design provisions for the ASCE 7 Standard. KEYWORDS: Tohoku Tsunami, Great East Japan Earthquake, ASCE, structural design 1. INTRODUCTION The Tohoku Tsunami presented all loading and effects including:
Hydrostatic Forces: Buoyant forces, additional loads on elevated floors, unbalanced lateral forces Hydrodynamic Forces: Lateral and uplift pressures of tsunami bore and surge flow Debris Damming and Debris Impact Forces: External and internal debris accumulation and striking Scour Effects: Shear of cyclic inflow and outflow, and transient liquefaction due to de-pressurization during outflow.
There is great interest in the United States in studying the effects of the Tohoku Tsunami, due to the analogous threat posed by the Cascadia
subduction zone to the Pacific Northwest of North America. In 1700 it is believed that this subduction zone generated a tsunamigenic earthquake estimated to be magnitude 9. The ASCE Structural Engineering Institute has decided to incorporate tsunami design provisions in the national load standard, ASCE 7, and it dispatched the ASCE Tsunami Team led by the author to Japan a month after the Tohoku Tsunami of March 11, 2011. It was crucially important to capture contextual tsunami damage evidence quickly before they were cleared. Otherwise, it is much more difficult to recreate an understanding of the circumstances to which a particular structure was subjected. The ASCE Tsunami Reconnaissance Team conducted field surveys starting on April 16, which was the first day officially recommended by JSCE for international tsunami reconnaissance teams. The Tohoku Earthquake Tsunami Joint Survey Group has published considerable online data of the peak inundation and runup heights, compiled from the work of over 100 Japanese researchers who were in the field for at least three weeks in late March and early April (clearinghouse at http://www.coastal.jp/ttjt). Therefore, the ASCE Tsunami Team concentrated on identifying structures of interest, the local tsunami inundation depth at the site, and researching the probable flow velocities either by video analysis or by analysis of clearly defined failure mechanisms of “flow surrogate” structural elements. Having traveled throughout the area both within and outside the inundated areas, we noted that the surviving structures observed did not appear to have significant earthquake damage.
1 Chair, ASCE 7 Tsunami Loads and Effects Subcommittee; and President, Martin & Chock, Inc. Structural Engineers <[email protected]>
- 184 - - 185 -
2
Presently prepared for publication as a monograph, The ASCE Tsunami Reconnaissance Team report [1] covers the following investigative areas. In this paper, we concentrate on describing the estimation of flow velocities and evaluation of building performance. 1. Introduction 2. ASCE‐JSCE‐BRI Collaboration 3. Great East Japan Earthquake and Tohoku Tsunami 4. Pre‐Survey Preparatory Research 5. Tsunami Warning and Evacuation 6. Tsunami Flow Velocities 7. Debris Loading 8. Building Structural Performance 9. Bridge Performance 10. Breakwaters 11. Seawalls and Tsunami Barriers 12. Piers, Quays and Wharves 13. Scour Effects 14. Other Structures 15. Initial Recovery Efforts 16. Failure Mode Analyses 17. Findings and Recommendations 18. Acknowledgements 19. Appendices 20. References 2. METHODS OF ANALYSIS 2.1 Flow velocities 2.1.1 The Tohoku tsunami provided an unprecedented opportunity to analyze tsunami flow conditions based on video and field evidence. Much of this analysis has been performed remotely using only the captured videos and satellite imagery tools such as Google Earth. However, field verification of dimensions provided valuable confirmation of the assumptions made during video analysis. Field investigation was also necessary to determine flow depth which is difficult to estimate from the video evidence alone.
2.1.2 Flow surrogates
If video evidence is not available at a location of interest, it is possible to estimate the flow characteristics by reverse analysis of a “flow
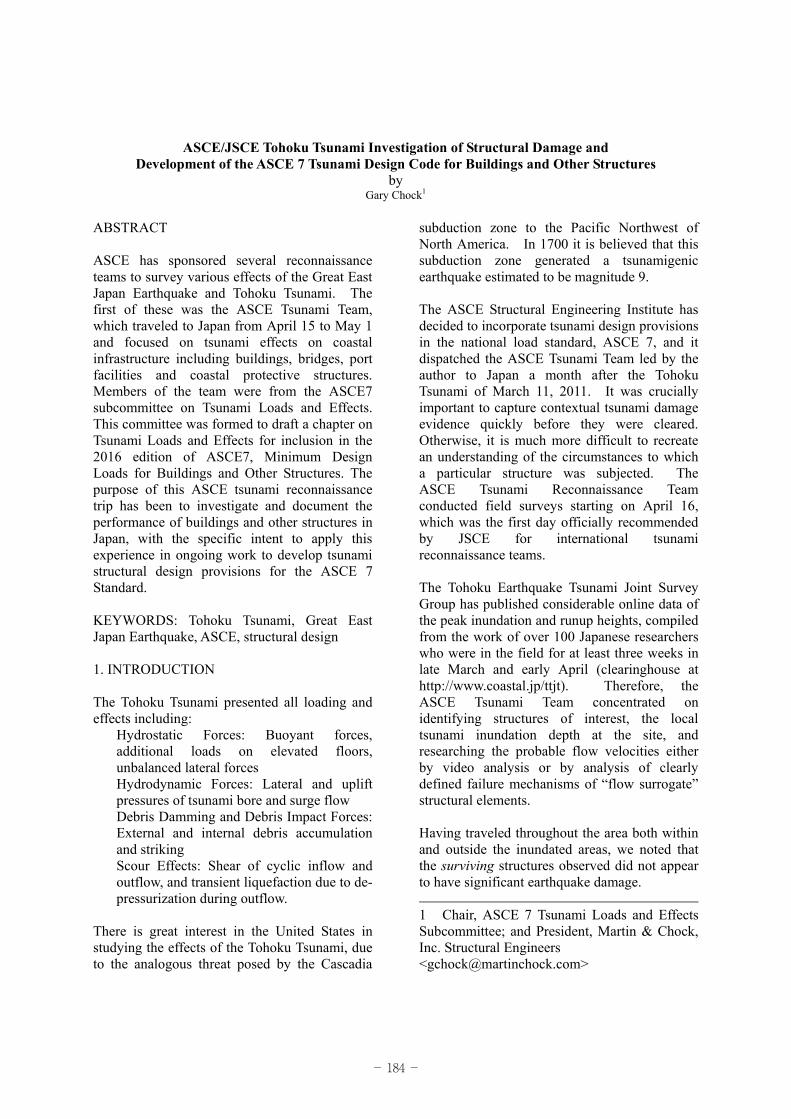
surrogate”. Figure 1 shows an example of a “flow surrogate” adjacent to a critical structural test case of a large-scale wall blowout in the Takada Matsubara building in Rikuzentakata. Table 1: Summary of flow velocities determined from video evidence
Location Wave form
Tracking object
Est. velocity
(m/s)
Natori River River bore Leading edge of bore
6.89
Sendai Airport Sheet flow surge
Leading edge of flow
3.75
Kamaishi Surge
Leading edge of flow
3.75
Surge Debris in flow 5.17
Kessenuma Surge
Debris in flow between buildings
4.74 – 5.0
Onagawa
Initial sheet flow surge
Sheet flow over port streets
2.92
Inflow at 50% inundation
Debris in flow 3.91
Outflow between Marine Pal Bldgs.
Debris in flow 7.43 –
8.19
Minamisanriku Incoming river surge
Debris in flow 5 – 8.73
Noda Tamagawa
Harbor bore
Leading edge of bore
9.78
Unbroken swell
Leading edge of swell
13.4
Kuji Port Unbroken swell
Leading edge of swell
12.33
Two large light standards stood on either side of the building. The maximum inundation depth measured by debris on the building was less than
- 184 - - 185 -
3
the elevation of the light fixture on top of the pole. Based on structural analysis, the pushover of the light standards during the 10 meter deep inflow had following sequence. Under flexural bending, an initial buckling of the thin pipe walls above the base plate stiffeners resulted in rotation of the pipe until the initially dry light fixture frame at the top of the pole was lowered into the flow and captured debris. This debris load at the top of the pole greatly increased the moment at the base and initiated much more rotation until it generated tensile rupture of the anchor bolts. A depth-averaged flow velocity of at least 7.25 m/s was determined from structural analysis of the pole in order to create the initial buckling. The bolt anchorage group had higher moment capacity than the flexural local buckling strength of the pole. In the same vicinity, the undamaged railings of a bridge were analyzed to provide an upper bound for the flow velocity of 7-3/4 m/s at this location. Thus, at this location we have estimates that bracket the estimated flow velocity to be greater than 7-1/4 m/s but less than 7-3/4 m/s.
Figure 1 Takada Matsubara Building
2.1.3 Range of velocities determined Utilizing both video and “flow surrogate” analysis, we have been able to ascertain flow velocities at numerous sites of interest. The characteristic tsunami flow velocities resulting in damage to engineered structures typically range from 5 to 8 m/s. However, there is evidence that flow velocities reached up to 10 m/s in areas of concentrated or accelerated flow.
2.2 Failure Analysis due to Fluid Forces The ASCE Tsunami Reconnaissance Team selected a number of representative cases for failure mode analysis. In this section, cases studies of hydrostatic and hydrodynamic loading are further evaluated.
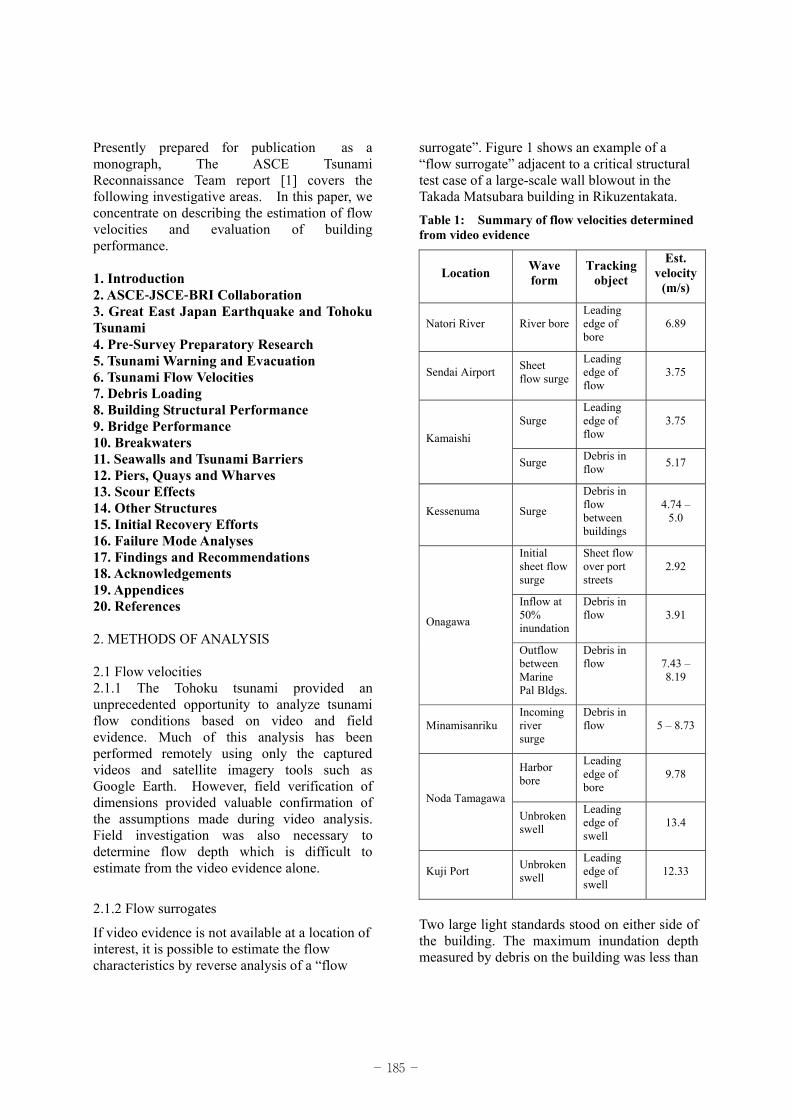
Yuriage Fish Market Concrete Wall Failures during Inflow A large morning fish market building was located directly at the wharf area at the harbor of Yuriage. The building consisted of a large 120 m long by 20 m wide steel-truss framed single story high-bay building with a smaller attached one-story single bay of reinforced concrete bearing walls and concrete roof slab. The steel-framed main building was stripped off. A reinforced concrete utility closet for equipment had its sole door opening oriented towards the incoming tsunami, and was thus subjected to the internal pressure resulting from stagnation of the flow. Reinforcing bar samples tested to be equivalent to JIS G3112 SD 390 with 400 MPa average yield strength. In order for the failues shown here to have occurred, flow velocity would have been at least 7-1/2 meters/second.
Figure 2: Wall corner joint and flexural failure by internal hydrodynamic pressurization
- 186 - - 187 -
4
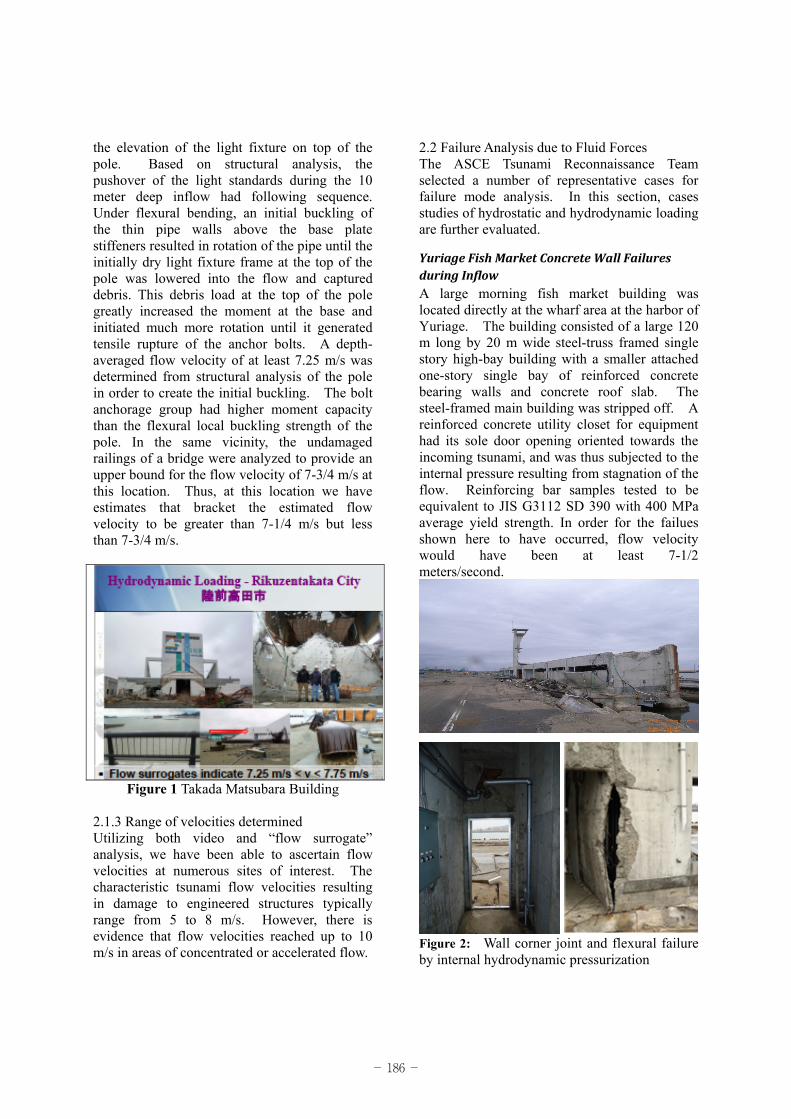
Onagawa Two‐Story Cold Storage Building Uplift The building shown in Figure 3 was lifted by hydrostatic buoyancy off of its pile foundation, which did not have tensile capacity, and carried over a low wall before being deposited about 15 meters inland from its original location. This building was approximately 22 meters by 8.7 meters by 12 meters tall. Total deadweight of the structure was 8995 kN. The refrigerated space on the ground floor was effectively sealed off from being rapidly inundated with water, leading to a neutrally buoyant condition as soon as the water inundation depth reached 7 meters. The building was lifted off its original site and carried just barely over a short wall (background of photograph on the left), and then was apparently flipped over by contact with the top of the wall that it damaged in the process. Once sideways, the buoyant displaced volume was reduced from when it was upright.
Figure 3 The ASCE Tohoku Tsunami Reconnaissance Team at the Onagawa uplifted and overturned 2-story reinforced concrete cold-storage building - Note low wall with top edge spalled (Hideyuki Kasano)
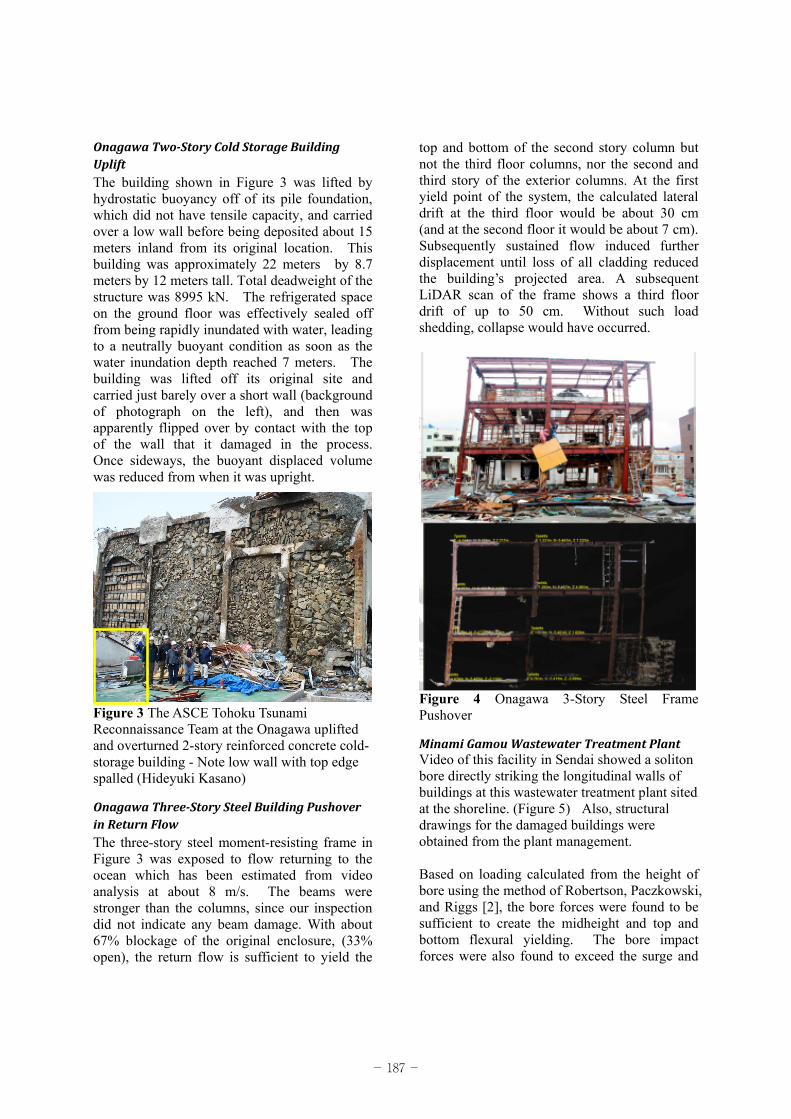
Onagawa Three‐Story Steel Building Pushover in Return Flow The three-story steel moment-resisting frame in Figure 3 was exposed to flow returning to the ocean which has been estimated from video analysis at about 8 m/s. The beams were stronger than the columns, since our inspection did not indicate any beam damage. With about 67% blockage of the original enclosure, (33% open), the return flow is sufficient to yield the
top and bottom of the second story column but not the third floor columns, nor the second and third story of the exterior columns. At the first yield point of the system, the calculated lateral drift at the third floor would be about 30 cm (and at the second floor it would be about 7 cm). Subsequently sustained flow induced further displacement until loss of all cladding reduced the building’s projected area. A subsequent LiDAR scan of the frame shows a third floor drift of up to 50 cm. Without such load shedding, collapse would have occurred.
Figure 4 Onagawa 3-Story Steel Frame Pushover
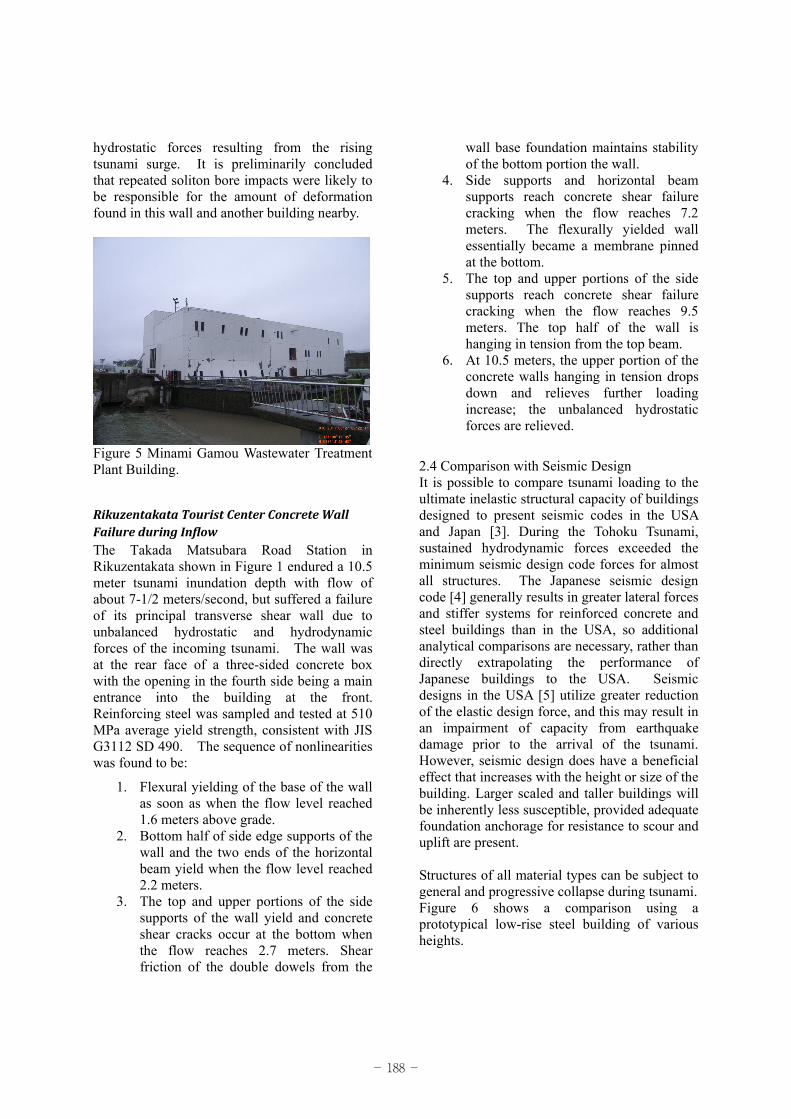
Minami Gamou Wastewater Treatment Plant Video of this facility in Sendai showed a soliton bore directly striking the longitudinal walls of buildings at this wastewater treatment plant sited at the shoreline. (Figure 5) Also, structural drawings for the damaged buildings were obtained from the plant management. Based on loading calculated from the height of bore using the method of Robertson, Paczkowski, and Riggs [2], the bore forces were found to be sufficient to create the midheight and top and bottom flexural yielding. The bore impact forces were also found to exceed the surge and
- 186 - - 187 -
5
hydrostatic forces resulting from the rising tsunami surge. It is preliminarily concluded that repeated soliton bore impacts were likely to be responsible for the amount of deformation found in this wall and another building nearby.
Figure 5 Minami Gamou Wastewater Treatment Plant Building.
Rikuzentakata Tourist Center Concrete Wall Failure during Inflow The Takada Matsubara Road Station in Rikuzentakata shown in Figure 1 endured a 10.5 meter tsunami inundation depth with flow of about 7-1/2 meters/second, but suffered a failure of its principal transverse shear wall due to unbalanced hydrostatic and hydrodynamic forces of the incoming tsunami. The wall was at the rear face of a three-sided concrete box with the opening in the fourth side being a main entrance into the building at the front. Reinforcing steel was sampled and tested at 510 MPa average yield strength, consistent with JIS G3112 SD 490. The sequence of nonlinearities was found to be:
1. Flexural yielding of the base of the wall as soon as when the flow level reached 1.6 meters above grade.
2. Bottom half of side edge supports of the wall and the two ends of the horizontal beam yield when the flow level reached 2.2 meters.
3. The top and upper portions of the side supports of the wall yield and concrete shear cracks occur at the bottom when the flow reaches 2.7 meters. Shear friction of the double dowels from the
wall base foundation maintains stability of the bottom portion the wall.
4. Side supports and horizontal beam supports reach concrete shear failure cracking when the flow reaches 7.2 meters. The flexurally yielded wall essentially became a membrane pinned at the bottom.
5. The top and upper portions of the side supports reach concrete shear failure cracking when the flow reaches 9.5 meters. The top half of the wall is hanging in tension from the top beam.
6. At 10.5 meters, the upper portion of the concrete walls hanging in tension drops down and relieves further loading increase; the unbalanced hydrostatic forces are relieved.
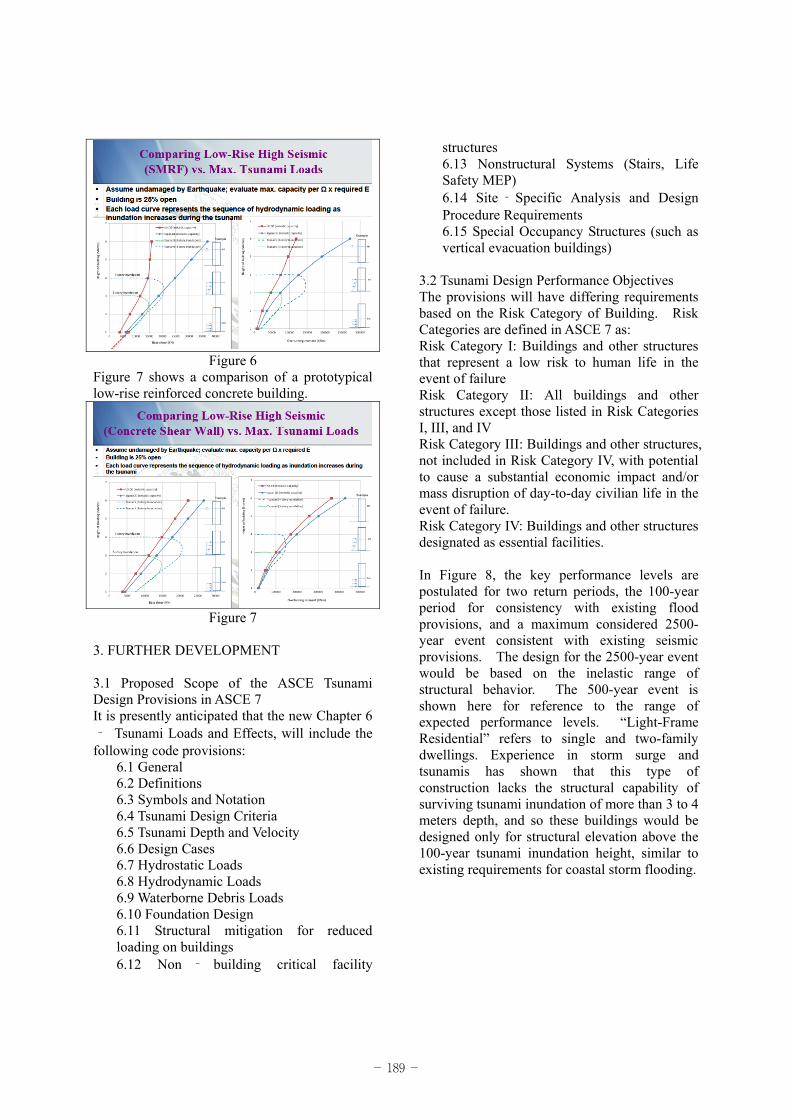
2.4 Comparison with Seismic Design It is possible to compare tsunami loading to the ultimate inelastic structural capacity of buildings designed to present seismic codes in the USA and Japan [3]. During the Tohoku Tsunami, sustained hydrodynamic forces exceeded the minimum seismic design code forces for almost all structures. The Japanese seismic design code [4] generally results in greater lateral forces and stiffer systems for reinforced concrete and steel buildings than in the USA, so additional analytical comparisons are necessary, rather than directly extrapolating the performance of Japanese buildings to the USA. Seismic designs in the USA [5] utilize greater reduction of the elastic design force, and this may result in an impairment of capacity from earthquake damage prior to the arrival of the tsunami. However, seismic design does have a beneficial effect that increases with the height or size of the building. Larger scaled and taller buildings will be inherently less susceptible, provided adequate foundation anchorage for resistance to scour and uplift are present. Structures of all material types can be subject to general and progressive collapse during tsunami. Figure 6 shows a comparison using a prototypical low-rise steel building of various heights.
- 188 - - 189 -
6
Figure 6 Figure 7 shows a comparison of a prototypical low-rise reinforced concrete building.
Figure 7 3. FURTHER DEVELOPMENT 3.1 Proposed Scope of the ASCE Tsunami Design Provisions in ASCE 7 It is presently anticipated that the new Chapter 6 ‐ Tsunami Loads and Effects, will include the following code provisions:
6.1 General 6.2 Definitions 6.3 Symbols and Notation 6.4 Tsunami Design Criteria 6.5 Tsunami Depth and Velocity 6.6 Design Cases 6.7 Hydrostatic Loads 6.8 Hydrodynamic Loads 6.9 Waterborne Debris Loads 6.10 Foundation Design 6.11 Structural mitigation for reduced loading on buildings 6.12 Non ‐ building critical facility
structures 6.13 Nonstructural Systems (Stairs, Life Safety MEP) 6.14 Site‐Specific Analysis and Design Procedure Requirements 6.15 Special Occupancy Structures (such as vertical evacuation buildings)
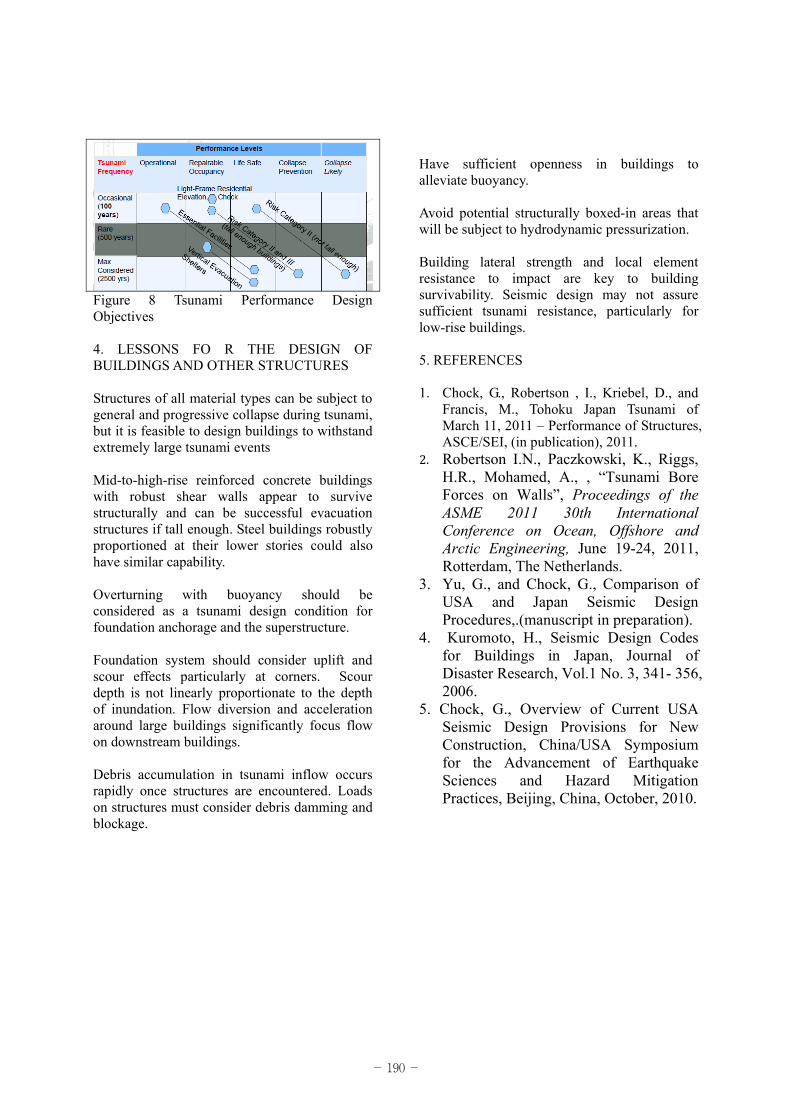
3.2 Tsunami Design Performance Objectives The provisions will have differing requirements based on the Risk Category of Building. Risk Categories are defined in ASCE 7 as: Risk Category I: Buildings and other structures that represent a low risk to human life in the event of failure Risk Category II: All buildings and other structures except those listed in Risk Categories I, III, and IV Risk Category III: Buildings and other structures, not included in Risk Category IV, with potential to cause a substantial economic impact and/or mass disruption of day-to-day civilian life in the event of failure. Risk Category IV: Buildings and other structures designated as essential facilities. In Figure 8, the key performance levels are postulated for two return periods, the 100-year period for consistency with existing flood provisions, and a maximum considered 2500-year event consistent with existing seismic provisions. The design for the 2500-year event would be based on the inelastic range of structural behavior. The 500-year event is shown here for reference to the range of expected performance levels. “Light-Frame Residential” refers to single and two-family dwellings. Experience in storm surge and tsunamis has shown that this type of construction lacks the structural capability of surviving tsunami inundation of more than 3 to 4 meters depth, and so these buildings would be designed only for structural elevation above the 100-year tsunami inundation height, similar to existing requirements for coastal storm flooding.
- 188 - - 189 -
7
Figure 8 Tsunami Performance Design Objectives 4. LESSONS FO R THE DESIGN OF BUILDINGS AND OTHER STRUCTURES Structures of all material types can be subject to general and progressive collapse during tsunami, but it is feasible to design buildings to withstand extremely large tsunami events Mid-to-high-rise reinforced concrete buildings with robust shear walls appear to survive structurally and can be successful evacuation structures if tall enough. Steel buildings robustly proportioned at their lower stories could also have similar capability. Overturning with buoyancy should be considered as a tsunami design condition for foundation anchorage and the superstructure. Foundation system should consider uplift and scour effects particularly at corners. Scour depth is not linearly proportionate to the depth of inundation. Flow diversion and acceleration around large buildings significantly focus flow on downstream buildings. Debris accumulation in tsunami inflow occurs rapidly once structures are encountered. Loads on structures must consider debris damming and blockage.
Have sufficient openness in buildings to alleviate buoyancy. Avoid potential structurally boxed-in areas that will be subject to hydrodynamic pressurization. Building lateral strength and local element resistance to impact are key to building survivability. Seismic design may not assure sufficient tsunami resistance, particularly for low-rise buildings. 5. REFERENCES 1. Chock, G., Robertson , I., Kriebel, D., and
Francis, M., Tohoku Japan Tsunami of March 11, 2011 – Performance of Structures, ASCE/SEI, (in publication), 2011.
2. Robertson I.N., Paczkowski, K., Riggs, H.R., Mohamed, A., , “Tsunami Bore Forces on Walls”, Proceedings of the ASME 2011 30th International Conference on Ocean, Offshore and Arctic Engineering, June 19-24, 2011, Rotterdam, The Netherlands.
3. Yu, G., and Chock, G., Comparison of USA and Japan Seismic Design Procedures,.(manuscript in preparation).
4. Kuromoto, H., Seismic Design Codes for Buildings in Japan, Journal of Disaster Research, Vol.1 No. 3, 341- 356, 2006.
5. Chock, G., Overview of Current USA Seismic Design Provisions for New Construction, China/USA Symposium for the Advancement of Earthquake Sciences and Hazard Mitigation Practices, Beijing, China, October, 2010.
- 190 - - 191 -