an estimate of the national cost for remediation of mtbe · pdf filethe intent of this paper...
TRANSCRIPT

AN ESTIMATE OF THE NATIONAL COST FOR REMEDIATION OF MTBE RELEASES FROM EXISTING
LEAKING UNDERGROUND STORAGE TANK SITES
July 2005
©Copyright 2005 ENSR Corporation, All Rights Reserved

©Copyright 2005 ENSR Corporation, All Rights Reserved July, 2005 Q:\mw97\Projects\04373\014\570\all.doc
Contributing Authors: Internal Peer Reviewers:
ENSR International Todd Schwendeman 2 Technology Park Drive Elizabeth Perry Westford, MA 01886 Robert Cataldo www.ensr.com Christopher Mariano Frank Sweet, P.G., Principal-in-Charge Mark Kauffman, P.E., Remediation Program Manager Tabatha Pellerin, P.E., Process Engineer David Espy, Senior Petroleum Manager Michael Mills, PhD, Statistician Expert Public Panel Discussions:
Boston, MA, June 21, 2005 Augusta, ME, June 22, 2005 Concord, NH, June 23, 2005 Contact Information:
John Petraglia, Director of Marketing and Communications www.askensr.com

©Copyright 2005 ENSR Corporation, All Rights Reserved July, 2005 iQ:\mw97\Projects\04373\014\570\all.doc
CONTENTS
EXECUTIVE SUMMARY ....................................................................................................................ES-1
1.0 INTRODUCTION..............................................................................................................................1-1
1.1 Background ............................................................................................................................1-1
1.2 Approach ................................................................................................................................1-2
1.3 Report Organization ...............................................................................................................1-3
1.4 Report Limitations ..................................................................................................................1-3
2.0 DERIVATION OF NATIONWIDE COST EQUATION (NCE)..........................................................2-1
3.0 NCE INPUT VARIABLES................................................................................................................3-1
3.1 Number of Confirmed LUST Site Releases (Parameter C)...................................................3-1
3.2 Number of LUST Site Releases with Remediation Initiated (Parameter D) ..........................3-2
3.3 Number of Closed LUST Site Releases (Parameter E).........................................................3-3
3.4 Fraction of LUST Site Releases with MTBE (Parameter K) ..................................................3-3
3.5 Remediation Cost per LUST Site Release (Parameter O) ....................................................3-4
3.6 Fraction of Remediation Cost Due to MTBE (Parameter Q) .................................................3-7
3.7 Fraction of Effort Not Yet Incurred for Ongoing LUST Remediation (Parameter AA) ...........3-9
3.8 Summary of Input Variables...................................................................................................3-9
4.0 INTERNAL ENSR DATA.................................................................................................................4-1
4.1 ENSR Trust Fund Records ....................................................................................................4-1
4.2 ENSR Project Data.................................................................................................................4-2 4.2.1 Site Information Query ................................................................................................4-2 4.2.2 Evaluation of Compiled Results ..................................................................................4-2 4.2.3 Development of Internal Cost Estimate ......................................................................4-4 4.2.4 Quality Assurance Review ..........................................................................................4-4
5.0 STATISTICAL ANALYSIS ..............................................................................................................5-1
5.1 Uncertainty Propagation.........................................................................................................5-1
5.2 Monte-Carlo Analysis .............................................................................................................5-1
5.3 Data Source Reliability and Scoring ......................................................................................5-2
5.4 Example Calculation...............................................................................................................5-2

CONTENTS (Cont’d)
©Copyright 2005 ENSR Corporation, All Rights Reserved July, 2005 iiQ:\mw97\Projects\04373\014\570\all.doc
5.5 Input Parameter Distributions.................................................................................................5-3
5.6 Output Parameter Distribution................................................................................................5-3
6.0 SENSITIVITY ANALYSIS................................................................................................................6-1
7.0 RESULTS AND DISCUSSION........................................................................................................7-1
8.0 REFERENCES.................................................................................................................................8-1

©Copyright 2005 ENSR Corporation, All Rights Reserved July, 2005 iiiQ:\mw97\Projects\04373\014\570\all.doc
LIST OF TABLES
Table 2-1 Input Variables .................................................................................................................2-2
Table 2-2 Derived Values.................................................................................................................2-2
Table 3-1 Summary of Input Variables ............................................................................................3-1
Table 3-2 Cost Data Provided by Keller (1998) ...............................................................................3-6
Table 3-3 Cost Data Provided by Keller (1998) ...............................................................................3-8
Table 3-4 Summary of Values for Input Variables .........................................................................3-10
Table 4-1 ENSR Trust Fund Records..............................................................................................4-1
Table 4-2 Summary of Internal ENSR Remediation Cost Data.......................................................4-5
Table 5-1 Reliability Index Basis ......................................................................................................5-5
Table 5-2 National Cost Summary Statistics Derived from Mid-range of Input Values...................5-9
Table 6-1 Differential Cost of MTBE Remediation (Parameter S)..................................................6-3
Table 6-2 Summary of Sensitivity Analysis......................................................................................6-3

©Copyright 2005 ENSR Corporation, All Rights Reserved July, 2005 ivQ:\mw97\Projects\04373\014\570\all.doc
LIST OF FIGURES
Figure 1-1 Trend of New LUST Site Releases..................................................................................1-5
Figure 4-1 ENSR Project Database Questionnaire...........................................................................4-3
Figure 5-1 Source Data Reliability Indices ........................................................................................5-4
Figure 5-2 Number of Confirmed LUST Site Releases (Parameter C) ............................................5-6
Figure 5-3 Number of Closed LUST Site Releases (Parameter E) ..................................................5-6
Figure 5-4 Fraction of LUST Site Releases with MTBE (Parameter K)............................................5-7
Figure 5-5 Remediation Cost per LUST Site Release (Parameter O)..............................................5-7
Figure 5-6 Fraction of Remediation Costs Due to MTBE (Parameter Q) .........................................5-8
Figure 5-7 Fraction of Effort Not Yet Incurred For Ongoing Remediation (Parameter AA)..............5-8
Figure 5-8 National Cost Distribution Derived from Mid-range of Input Values................................5-9

©Copyright 2005 ENSR Corporation, All Rights Reserved July, 2005 ES-1Q:\mw97\Projects\04373\014\570\all.doc
EXECUTIVE SUMMARY
The intent of this paper is to provide a balanced, scientific approach to estimating the national cost for remediation of methyl tertiary butyl ether (MTBE) releases from existing leaking underground storage tank (LUST) sites. A draft version of this paper was distributed to a limited number of external peer reviewers, who subsequently participated in expert panel discussions to finalize the paper. Panelists included members of state and federal regulatory agencies, including the U.S. Environmental Protection Agency, Office of Underground Storage Tanks (EPA OUST) and local professors. Through this limited peer review process, we received suggestions related to clarifying the scope and context of this study, and providing additional detail for our calculations and analysis. These suggestions are incorporated into this paper. The result is an estimated $2.0 billion for the remediation of MTBE releases from existing LUST sites. A sensitivity analysis, which was added to our research as a result of the peer review process, presents a discussion of cost variations that could result from altering our baseline assumptions.
The $2.0 billion cost estimate is based on the number of existing LUST sites maintained in published databases, and the average cost of addressing the MTBE portion of those sites. This is a total cost estimate, not adjusted for historic or future dollar values. The approach we derived for this cost estimate accounted for several factors, such as the fraction of LUST site releases that contain MTBE, and the portion of ongoing remediation that is already complete. To clarify the context of this estimate, we focused exclusively on the remediation of MTBE releases associated with LUST sites. As recorded by the EPA OUST in the database of existing LUST sites, the types of releases include tank overflows and leaks from pressure-relief valves, dispensers, piping networks, and other equipment typically associated with UST systems. The “UST site” is the area impacted by the release, including soil and groundwater in the immediate vicinity of the release, as well contaminant plumes emanating from the release. This may also include plumes that have impacted nearby water supplies, such as domestic wells or source-water aquifers. The remediation cost associated with these releases and areas encompasses costs ranging from initial site assessment to remediation and closure.
Insufficient information was available to reliably estimate and quantify potential remediation costs for new LUST site releases beyond EPA’s current database. According to annual EPA reports, the number of new confirmed LUST site releases projected in the UST Corrective Action Measures dataset has decreased between 1992 (57,641 new sites) and 2004 (7,848 new sites). It is likely that new MTBE sites will be identified as requiring remediation in the future. However, the pace of site closures will likely outpace the identification of new sites, as reflected in EPA OUST data trends.
Beyond the potential continuation of a decreasing trend for new LUST sites, the unit cost per site could also change, resulting in increased or decreased costs. Factors that could increase the unit cost per site include more aggressive regulatory standards, the reopening of previously closed sites, or inflation. Factors that could contribute to a unit-cost decrease include more rapid response, improvements in remediation strategy, compliance, and system optimization, improved zoning laws to lessen the impact

©Copyright 2005 ENSR Corporation, All Rights Reserved July, 2005 ES-2Q:\mw97\Projects\04373\014\570\all.doc
of site releases, and market consolidation to improve the efficiency of site management and remediation through economies-of-scale.
In addition to published literature on key aspects of estimating MTBE impacts from LUST site release, there is some published data on potential impacts to water supplies. EPA (2005) data indicate that less than 0.4% of community water supply systems report MTBE at concentrations greater than 5 parts per billion (ppb). As previously noted, the unit cost data compiled for our calculations may include costs for remediation of nearby water supplies, if they were impacted by a LUST site release. Regardless of a water supply’s proximity or association with a nearby LUST site release, we have not quantified a collective differential cost for water supplies that are impacted by MTBE.
An additional point of clarification is the handling of non-LUST sites in general. As described, our cost estimate includes LUST site remediation, spanning from initial reporting and assessment, to remediation and closure. Incidental releases from non-LUST systems, such as motors, salvage yards, or roadways are not included in EPA’s database of existing LUST sites (EPA OUST, 2004). Similarly, a complete inventory of LUSTs that contain heating oil, diesel, or other non-gasoline products may not be fully captured in EPA’s database. The national cost contributions from these other sources, which are expected to be minimal in comparison to reported LUST sites, were not available for us to include quantitatively in this paper.
This research yields an estimated value of $2.0 billion for the remediation of MTBE releases from existing LUST sites, across the nation. The National Cost Equation (NCE) developed through this research was used to estimate this cost. The NCE was populated with a series of input parameters obtained from a thorough review of available published data sources, supplemented by internal ENSR data. Each data source was assigned a reliability index based on the comprehensiveness of the underlying dataset. A distribution of possible results was generated using 100,000 iterations of a Monte-Carlo procedure, which consisted of the mid-range values for each data source, matched with the associated source reliability index. The statistical distribution of the mid-range values yields a median value of $2.0 billion.
To provide context, the following chart illustrates the estimated fraction of MTBE-related costs relative to the overall costs associated with existing LUST sites. Similar to the Monte-Carlo procedure implemented to estimate the MTBE-related national cost of $2.0 billion, 100,000 iterations of the Monte-Carlo procedure were used to generate a distribution of overall LUST site costs. The mid-range input values yield a median cost of $17.8 billion for the remediation of existing LUST sites, irrespective of MTBE. The $2.0 billion MTBE-related fraction accounts for approximately 11% of this national cost.

©Copyright 2005 ENSR Corporation, All Rights Reserved July, 2005 ES-3Q:\mw97\Projects\04373\014\570\all.doc
$2.0 billion (MTBE)
$15.8 billion (non-MTBE)
Remediation Costs for Existing LUST Site Releases
Assumptions contributing to the $2.0 billion national estimate are explored in the sensitivity analysis provided in the paper. As shown, by changing selected inputs into the NCE calculation, one can generate an array of associated results. We consider our baseline assumptions (resulting in the $2.0 billion median value) to be the most balanced and representative set of assumptions, based on our review of the source data. These variations are exploratory in nature, to provide practitioners with a sense of how the median value may change if key assumptions are altered.
Overall, the national cost estimated through this research relies heavily upon the available published data sources. Some uncertainties are reflected in the statistical distribution of our NCE calculation. Other limitations and uncertainties have been discussed qualitatively in this section. Despite the variability and limitations of this research topic, the methodology applied is appropriate for the wide range of reported data, and very limited datasets. This work can be expanded upon as desired, to further reduce uncertainties and continue to improve the precision of a national cost estimate.

©Copyright 2005 ENSR Corporation, All Rights Reserved July, 2005 1-1Q:\mw97\Projects\04373\014\570\all.doc
1.0 INTRODUCTION
The focus of this paper is to establish a well-documented estimate of the national cost for remediation of methyl tertiary butyl ether (MTBE) releases from existing leaking underground storage tank (LUST) sites. This cost estimate is based on the number of existing LUST sites maintained in published databases, and the average cost of addressing the MTBE portion those sites. Adjustments were necessary to account for several factors, such as the fraction of LUST site releases that contain MTBE, and the portion of ongoing remediation that is already complete. To clarify the context of this cost estimate, we considered all releases from existing LUST sites, regardless of the source of the release or the area potentially impacted. For example, the types of LUST site releases reported by the U.S. Environmental Protection Agency (EPA) Office of Underground Storage Tank (OUST) “backlog” database (EPA OUST, 2004) include: releases from tank overflows and leaks, pressure-relief valves, dispensers, piping networks, and other equipment typically associated with UST systems. The EPA database encompasses plumes that are associated with LUST site releases, which may include impacted water supplies if they are associated with an adjacent LUST site release. An additional point of clarification is use of the term “remediation.” Sources reviewed consider remediation costs to encompass site assessment and other costs associated with investigating and closing a LUST site release.
A draft version of this paper was completed on June 14, 2005 and provided to three expert panels for discussion from June 21 through 23, 2005. Panelists included members of state and federal regulatory agencies, including the EPA OUST and local professors. Through this limited peer review process, we received suggestions related to clarifying the scope and context of this study, and providing additional detail for our calculations and analysis. These suggestions are incorporated into this paper, and a sensitivity analysis (provided in Section 6.0) presents a discussion of cost variations that could result from altering our assumptions.
1.1 Background
Underground storage tanks (USTs) are typically used to store petroleum products at service stations, fueling depots, industrial facilities, commercial operations and residential properties. Releases from these tanks to the environment can occur through tank or piping leaks, overfill incidents or spills. As a result of historic releases, soil and groundwater can be impacted, creating a potential need for environmental remediation. After environmental impacts have been identified, an assessment of the necessity and degree of remediation typically begins with a comparison of chemical concentrations in the environment to regulatory standards and a risk-based evaluation (evaluating the risks associated with the presence of contaminants in the environment based on potential receptors of the contaminants). If remediation is necessary, it can be accomplished through either passive measures, such as monitored natural attenuation, or active measures, such as groundwater treatment.
©Copyright 2005 ENSR Corporation, All Rights Reserved July, 2005 1-2Q:\mw97\Projects\04373\014\570\all.doc
MTBE is an additive in gasoline that has been used as an octane booster since 1979. The Clean Air Act (CAA) in 1990 increased the use (and concentration) of MTBE in gasoline. This increase was necessary to meet the requirements for refiners to produce oxygenated gasoline with reduced ozone precursor emissions. In 1995, the federal Reformulated Gasoline (RFG) program was introduced mandating the use of oxygenated gasoline in some major metropolitan areas. According to the United States (U.S.) Energy Information Administration (U.S. Department of Energy) report of March 2005, approximately 34% of all gasoline sold in the U.S. is reformulated or oxygenated.
Understanding the potential costs and funding sources associated with MTBE releases from existing LUST sites can be a complex endeavor. According to the EPA LUST Trust Fund (2004), an estimated 4% of LUST cases have no identified responsible party, thus public funding is necessary for their assessment and remediation. The remaining 96% of LUST cases are typically paid for by potentially responsible parties (PRP), trust funds, and other funding sources.
1.2 Approach
Many technical papers and presentations that estimate factors contributing to MTBE remediation costs have been produced over the past decade, particularly during the past three years. For this particular research effort, we combined the information from these references and developed a Nationwide Cost Equation (NCE) to estimate a national cost for remediation of MTBE releases from existing LUST sites. Our equation relies on input variables (equation parameters), which were developed from published data sources and data compiled from our internal LUST project databases, and assigned reliability indices to account for the variation in quality or reliability between different data sources.
Published data sources researched for this work included public databases, regulatory and public agency sources, technical papers and presentations. Sources were evaluated to determine applicability to the input parameters used in the NCE. Those sources with pertinent information were then further screened to exclude sources published prior to 1998, thus focusing the research on the most current information. Sources were further evaluated to determine if duplicate root sources were used (sources that rely on the same data).
Most of the published data sources used in the calculations were identified by searching references listed in the web pages of the U.S. Environmental Protection Agency (EPA) and other agencies and consortiums, such as the New England Interstate Water Pollution Control Commission (NEIWPCC). Other sources of published data include ENSR’s internal library. ENSR’s internal project data was also used as described in Section 4.0.

©Copyright 2005 ENSR Corporation, All Rights Reserved July, 2005 1-3Q:\mw97\Projects\04373\014\570\all.doc
1.3 Report Organization
The remainder of this paper presents the draft findings of our research. We intend to solicit input via peer reviews and panel discussions relative to our derivation of the NCE and our selection and application of input parameters for that equation. This paper is organized as follows:
1.0 Introduction
2.0 Derivation of Nationwide Cost Equation (NCE)
3.0 NCE Input Variables
4.0 ENSR Internal Data
5.0 Statistical Analysis
6.0 Sensitivity Analysis
7.0 Results and Discussion
8.0 References
1.4 Report Limitations
To clarify the context of our research, we focused primarily on existing LUST site releases, which is consistent with EPA’s reported “backlog” database (EPA OUST, 2004). Existing LUST site releases were the focus of our research because EPA and several other entities routinely track LUST site release data, which is considered to be reliable and well-quantified. A “LUST site release” encompasses any area where environmental media is impacted. Sources of LUST site releases include tanks, pipelines, dispensers, and other potential equipment associated with UST systems. The remediation of LUST site releases includes the immediate release area, which may include impacts to adjacent properties and adjacent drinking water supplies.
As this estimate reflects the potential remediation costs for the existing backlog of LUST site releases that contain MTBE, consideration must be given to conditions that can change over time, and variables that are difficult to quantify. The following considerations are briefly discussed below:
• Potential identification of new sites in the future
• Potential changes in the cost of remediation
• Allocation of remediation funding
• Potential impacts to water supplies
• Potential releases from non-LUST sites

©Copyright 2005 ENSR Corporation, All Rights Reserved July, 2005 1-4Q:\mw97\Projects\04373\014\570\all.doc
According to annual EPA reports, the number of new confirmed LUST site releases projected in the UST Corrective Action Measures dataset has decreased between 1992 (57,641 new sites) and 2004 (7,848 new sites). It is likely that new MTBE sites will be identified as requiring remediation in the future. However, the pace of site closures will likely outpace the identification of new sites, as reflected in EPA data. The trend of new LUST sites is shown in Figure 1-1, which is based on the most recent EPA published data, reported for the period between 1992 and 2004.
Beyond the potential continuation of a decreasing trend for new LUST sites, the unit cost per site could also change, resulting in increased or decreased costs. Factors that could increase the unit cost per site include more aggressive regulatory standards, the reopening of previously closed sites, or inflation. Factors that could contribute to a unit-cost decrease include more rapid response, improvements in remediation strategy, compliance, and system optimization, improved zoning laws to lessen the impact of site releases, and market consolidation to improve the efficiency of site management and remediation through economies-of-scale.
Cost impacts to potable water supplies as a result of MTBE impacts from LUST site releases are reported in some published sources. EPA (2005) data indicate that on a nationwide basis, less than 0.4% of community water supply systems report MTBE at concentrations greater than 5 parts per billion (ppb). As previously noted, the unit cost data compiled for our calculations includes costs for remediation of adjacent drinking water supplies, if they were impacted by the LUST site release. Regardless of a water supply’s proximity or association with a nearby LUST site release, we have not quantified a collective differential cost for water supplies that are impacted by MTBE.
An additional point of clarification is the handling of non-LUST sites in general. As described, our cost estimate includes costs spanning from initial reporting and assessment, to remediation and closure. Our cost estimate also encompasses impacted media, whether at the source of the release or at a downgradient receptor. However, incidental releases from non-LUST systems, such as motors, salvage yards, or roadways are not included in EPA’s database of existing LUST sites (EPA OUST, 2004). Similarly, a complete inventory of LUSTs that contain heating oil, diesel, or other non-gasoline products may not be fully captured in EPA’s database. The national cost contributions from these other sources, which are expected to be minimal in comparison to reported LUST sites, were not available for us to include quantitatively in this paper.
Overall, the national cost estimated through this research relies heavily upon the available published data sources. Some uncertainties are reflected in the statistical distribution of our NCE calculation. Other limitations and uncertainties have been discussed qualitatively in this section. Despite the limitations outlined above, the methodology applied is appropriate for the wide range of reported data, and very limited datasets. The statistical distribution can be reduced and the precision of a final result can be improved though the inclusion of additional information as it becomes available.

©Copyright 2005 ENSR Corporation, All Rights Reserved July, 2005 1-5Q:\mw97\Projects\04373\014\570\all.doc
Figure 1-1 Trend of New LUST Site Releases
0
10,000
20,000
30,000
40,000
50,000
60,000
70,000
1990 1995 2000 2005 2010
Year
"New
" R
elea
ses

©Copyright 2005 ENSR Corporation, All Rights Reserved July, 2005 2-1Q:\mw97\Projects\04373\014\570\all.doc
2.0 DERIVATION OF NATIONWIDE COST EQUATION (NCE)
This section presents the equation used to estimate the nationwide cost for MTBE remediation. Factors contributing to remediation costs associated with LUST site releases have been estimated in a variety of published sources; however, none of the sources reviewed presents a complete set of parameters and an associated nationwide cost. In addition, the reported cost factors reviewed vary widely among the published sources. For example, some sources evaluate costs associated with LUST site remediation in only one state, which could bias the cost data. Other sources do not account for costs already incurred for completed or ongoing remediation. By recognizing the importance of these and other variables in developing a national cost of MTBE remediation of existing LUST site releases, we derived an equation that considers the key parameters necessary for cost estimation. Our equation, which we refer to as the “Nationwide Cost Equation” (NCE), is relatively simple, but requires that each input parameter be critically selected and evaluated to account for uncertainties and potential bias.
In reviewing available published data sources and ENSR internal data, we catalogued information pertaining to 27 separate parameters (labeled as “A” through “AA” during our research). The parameters ranged from the number of active USTs estimated by EPA, to the frequency of MTBE detected at LUST site releases reported by NEIWPCC. In reviewing this multitude of somewhat mismatching information, we derived the following NCE, which relies upon a set of independent input variables:
NCE = (H + G*AA) * K * S
In this equation, parameters AA and K are input variables obtained directly from source data, and are referred to as input variables. Parameters H, G, and S are derived values from combinations of other input variables (C, D, E, O and Q). The following two tables (Tables 2-1 and 2-2) provide definitions of these parameters, sorted by whether they are input variables or derived values. Further descriptions of the input variables (refer to Table 2-1), as well as data sources and selected values, are provided in Section 3.0 and summarized in Table 3-2.

©Copyright 2005 ENSR Corporation, All Rights Reserved July, 2005 2-2Q:\mw97\Projects\04373\014\570\all.doc
Table 2-1 Input Variables
Parameter Definition Parameter
Number of confirmed LUST site releases C
Number of LUST site releases with remediation initiated D
Number of closed LUST site releases E
Fraction of LUST site releases with MTBE K
Remediation cost per LUST site O
Fraction of LUST remediation costs due to MTBE Q
Fraction of effort not yet incurred for ongoing LUST remediation AA
Table 2-2 Derived Values
Parameter Definition Parameter Equation
Remediation LUST site backlog (all open LUST site releases maintained in EPA database)
F C-E
Number of LUST site releases where remediation has not been initiated (open sites, remediation not initiated)
H C-D
Number of LUST site releases where remediation is ongoing (open sites, remediation initiated)
G F-H (or D-E)
Differential MTBE remediation cost per LUST site (cost attributable to MTBE portion of remediation)
S O * Q

©Copyright 2005 ENSR Corporation, All Rights Reserved July, 2005 3-1Q:\mw97\Projects\04373\014\570\all.doc
3.0 NCE INPUT VARIABLES
As introduced in Section 2.0, the NCE we derived for cost calculation consists of seven independent input variables, which are used to quantify subsequent derived variables. For each of the input variables used in the NCE calculation, we researched information available from published data sources, as well as ENSR internal data. Table 3-1 presents the input variables (and parameter designations) defined in Section 2.0. A description of each is provided in the following subsections along with information about the data sources used to develop the parameter values.
Table 3-1 Summary of Input Variables
Input Variables (Parameter Designation)
Number of confirmed LUST site releases (Parameter C) (all open and closed sites) Number of LUST site releases with remediation initiated (Parameter D) (total of sites with remediation ongoing and sites with remediation completed) Number of closed LUST site releases (Parameter E) (sites with remediation completed) Fraction of LUST site releases with MTBE (Parameter K) (fraction of sites with MTBE) Remediation cost per LUST site (Parameter O) (total remediation cost for either MTBE or non-MTBE sites) Fraction of LUST remediation costs due to MTBE (Parameter Q) (fraction of MTBE portion of site remediation costs, for sites with MTBE) Fraction of effort not yet incurred for ongoing LUST remediation (Parameter AA) (fraction of remediation remaining for sites with remediation in progress)
3.1 Number of Confirmed LUST Site Releases (Parameter C)
This parameter represents the total number of reported LUST site releases, since reports of such incidents have been required. The intent of this category is to account for verifiable release incidents regardless of remediation status, site status (closed or open), number of tanks, or size of the release. Although reportable conditions vary by state, a “LUST site release” is typically considered to be the reported discovery of a leaking tank, failed tightness test, or the detection of petroleum constituents in drinking water, soil, air, groundwater or surface water that stems from a LUST system. The source of environmental impact can include tanks, piping, dispensers, surface spills, or other tank-related incidents. The designation of a LUST site release does not exclude impacts to adjacent receptors; however, many LUST site releases impact nearby drinking water supplies. This parameter is not

©Copyright 2005 ENSR Corporation, All Rights Reserved July, 2005 3-2Q:\mw97\Projects\04373\014\570\all.doc
adjusted for whether particular releases contain MTBE; all LUST site releases that are reported are included.
EPA OUST (2004). The U.S. Environmental Protection Agency, Office of Underground Storage Tanks issues periodic updates to a database of LUST site releases. Attachment 1 of the most recent publication, “UST Corrective Measures for the End of the Year FY2004,” provides a table of state-by-state total for several statistics as of September 30, 2004, including the “number of confirmed releases.” The value used for this parameter is 445,002, which includes all 50 U.S. states; however, it excludes U.S. territories and tribal lands.
EDR (2005). Environmental Data Research maintains a database of state-by-state inventory of reported LUST site releases, based on searches of state regulatory agency databases for each state (excluding Kentucky where there was no reported data). ENSR contracted EDR to obtain the most current database information, as of April 2005, for the 49 states with information. Summing the data reported by EDR yields a value of 539,623 existing LUST site releases.
GAO (2002). The U.S. General Accounting Office prepared a “Testimony to Congress on “MTBE Contamination from Underground Storage Tanks.” The testimony includes the following statement: “States reported to EPA that as of the end of 2001, they had completed cleanups at 64 percent (267,969) of the 416,702 known releases at tank sites and had begun some type of cleanup action for another 26 percent (109,486), as Figure 4 illustrates.” Based on this information, a value of 416,702 was used for this parameter.
ENSR Trust Fund Records (2005). ENSR submitted a questionnaire to state agency trust fund programs, for the third and fourth quarter of 2004. This questionnaire resulted in state-by-state statistics, including number of LUST site releases, which were compiled for this parameter. This yields a total value of 507,243 existing LUST site releases for this parameter.
3.2 Number of LUST Site Releases with Remediation Initiated (Parameter D)
This parameter is the number of confirmed LUST site releases where remediation has been initiated, as defined by EPA (EPA OUST, 2004). As defined by EPA, the reported value includes the following actions: management of contaminated soils, removal of non-aqueous phase liquid (NAPL), management or treatment of dissolved-phase contamination, monitoring for natural attenuation (soil or groundwater), or evaluation of site and determination by a regulatory agency that no further remediation is necessary. It is important to note that EPA defines this parameter as including sites with ongoing remediation, as well as sites that are closed (EPA OUST, 2004). EPA does not delete closed sites from this reported value.
EPA OUST (2004). Attachment 1 of this publication provides the state-by-state total of the “number of cleanups initiated,” as of September 20, 2004. The value used for this parameter (410,689) includes

©Copyright 2005 ENSR Corporation, All Rights Reserved July, 2005 3-3Q:\mw97\Projects\04373\014\570\all.doc
the total from all 50 U.S. states, excluding U.S. territories and tribal lands. No other sources of information were identified for this parameter.
3.3 Number of Closed LUST Site Releases (Parameter E)
The “number of closed LUST site releases” parameter is the number of sites where remediation has been completed. According to EPA (EPA OUST, 2004), this value represents the number of confirmed LUST site releases where remediation has been initiated and a regulatory agency has determined that no further actions are necessary to protect human health and the environment. Sites with post-closure monitoring are included in this category only if site-specific cleanup goals have been achieved. This parameter is important to ensure that closed sites are not factored into the future cost projection.
EPA OUST (2004). Attachment 1 of this publication provides a table of state-by-state total of the number of “cleanups completed” as of September 30, 2004. The value used for this parameter (316,259) includes the total from all 50 U.S. states, excluding U.S. territories and tribal lands. As a point of clarification, because the number of sites with remediation “initiated” includes sites that have been closed, the total number of sites with ongoing remediation can be calculated by subtracting this parameter (316,259) from Parameter D (410,689), yielding a value of 94,430 sites.
GAO (2002). The 2002 GAO testimony to Congress includes the following statement: “States reported to EPA that as of the end of 2001, they had completed cleanups at 64 percent (267,969) of the 416,702 known releases at tank sites and had begun some type of cleanup action for another 26 percent (109,486), as Figure 4 illustrates.” Based on this report, a value of 267,969 was selected for this parameter.
ENSR Trust Fund Records (2005). The ENSR questionnaire submitted to state agency trust fund programs in 2004 resulted in state-by-state values for the number of closed sites. Compiling the reported state data yielded a total value of 251,362 closed sites for this parameter.
3.4 Fraction of LUST Site Releases with MTBE (Parameter K)
MTBE is not detected at all LUST site releases. To determine which sites have MTBE impacts, we identified the fraction of site releases that contain MTBE in groundwater. This approach was used because of the high solubility and low adsorption properties of MTBE relative to other gasoline components, and its preference to dissolve in groundwater rather than adsorb to soil. This approach assumes that if MTBE is not present in groundwater, then that particular LUST site release does not have significant MTBE impacts requiring remediation and would not significantly alter the remediation costs. To eliminate bias and provide a more conservative (higher) value, there is no adjustment for the number of sites based on the concentration of MTBE detected. This approach simply accounts for whether MTBE was detected or not, regardless of concentration.

©Copyright 2005 ENSR Corporation, All Rights Reserved July, 2005 3-4Q:\mw97\Projects\04373\014\570\all.doc
NEIWPCC (2000). The New England Interstate Water Pollution Control Commission submitted a questionnaire to state regulatory agencies, with results provided in the following report: “Survey of State Experiences with MTBE Contamination at LUST Sites.” Question 9a of the survey asked: “Approximately how often is MTBE detected in groundwater at gasoline contaminated LUST sites?” The responses were provided in ranges of 0-20%, 20-40%, 40-60%, 60-80%, and 80-100%. A total of 45 states responded. A single weighted-average percentage was calculated for this parameter, by multiplying the mid-point of each percentage range by the number of states reporting in that range, and then dividing by the total number of states reporting (45). This resulted in an overall percentage of 52%.
NEIWPCC (2003). A NEIWPCC questionnaire was also available from 2003. The questions varied from the 2000 survey. To select a value for this parameter, responses to Question 19a were reviewed, which asked: “Out of the oxygenates that you sample and analyze in groundwater, what were the percent detections during 2002?” A total of 39 states provided responses, ranging from 3.5 to 100%. Although the question related to the fraction of samples containing MTBE, the responses were considered to be reflective of the fraction of LUST site releases that contain MTBE. A single weighted-average percentage was calculated for this parameter, by multiplying the mid-point of each percentage range by the number of states reporting in that range, and then dividing by the total number of states reporting (39). This resulted in an overall percentage of 54%, which is similar to the 52% value reported by NEIWPCC three years earlier (NEIWPCC, 2000).
ENSR US Data (2005). The ENSR US Retail Petroleum Client Database was queried for the period from May 1995 to May 2005. The query included the number of LUST site releases with and without MTBE detected in groundwater. The fraction of LUST site releases with MTBE (75%) was calculated as number of sites with MTBE detected in groundwater, divided by the total number of sites.
3.5 Remediation Cost per LUST Site Release (Parameter O)
This parameter represents the average cost for remediation of an individual LUST site release, whether or not MTBE is present. The average cost is intended to include reported costs from investigation through remediation. This parameter does not differentiate costs for oxygenates or other contaminants, which may influence remediation costs. The cost basis for this parameter is a combination of data extracted from published data sources and ENSR internal data. The reported cost data from sources reviewed inherently incorporates a wide range of state-specific regulatory standards and remedial technologies. The costs reflect actual costs incurred to implement an appropriate technology and achieve a state-specific standard.
There are two types of values used to develop this parameter: single data points and state-by-state datasets. Several published data sources provide an estimate of the remediation cost per site, which (unless otherwise specified) are assumed to represent a nationwide average unit cost. The state-by-state datasets, however, consist of average unit cost data by state. To establish a nationwide average LUST site cost for the state-specific data sets, we developed a statistical process to weight the data

©Copyright 2005 ENSR Corporation, All Rights Reserved July, 2005 3-5Q:\mw97\Projects\04373\014\570\all.doc
reported for each state. The EPA OUST backlog (confirmed releases less closed sites) reported by state was used to proportion the relative contribution of the state cost data to the nationwide cost average. This method recognizes the significance of cost variations by state, and assigns a weighted value based on the LUST backlog of sites in each state. Because multiple sources of data may report information differently, it is possible that some cost sources are not as inclusive as others. This uncertainty is further explored in the sensitivity analysis provided in Section 6.0, where we explore the impact of eliminating selected source values for this parameter.
Wilson (2002). An article entitled “Remedial Costs for MTBE in Soil and Groundwater,“ which was published by Wilson in the “Contaminated Soil Sediment and Water“ journal (Wilson, 2002) presents a table of costs for specific project types. Table 1 in the cited reference, presents the “Total Project Cost by Type of Site” for “service station/petroleum” type sites. According to Table 1, the “mean cost” for this type of site is $174,820, based on 276 sites.
GAO (2002). The GAO testimony to Congress (GAO, 2002) presents the following statement relative to this parameter: “According to the EPA-sponsored survey, 16 states reported cost increases as a result of MTBE cleanup, most less than 20 percent; 5 states reported that their costs more than doubled. States spend, on average, about $88,000 addressing releases at each tank site in fiscal year 2001.” Based on this statement, a value of $88,000 was selected for this parameter. During our peer review process, a representative from ASTSWMO believed that this was initially an ASTSWMO-based value and thus, not as representative of the more recent ASTSWMO data (refer to ASTSWMO, 2004). The impact of this information was evaluated as part of our sensitivity analysis (Section 6.0), where we eliminate the GAO and other selected values for this parameter, and recalculated the result.
ASTSWMO (2004). The Association of State and Territorial Solid Waste Management Officials presented results from a state financial assurance funds survey in June 2004. ASTSWMO records encompass a broader dataset than the other referenced sources for this parameter, because ASTSWMO includes non-gasoline LUST site data, such as releases from diesel fuel and heating oil LUST sites. As reported, information from 38 states with active trust fund programs was compiled, including the total number of LUST site releases, and the average cost per site release. The average cost was combined with the number of open sites in each state, by applying the LUST site database records (EPA OUST, 2004). Using these two factors, we calculated a weighted average cost per site of $100,217. During our peer review process, we recognized that trust fund data (such as ASTSWMO data) may not capture all remediation costs. Most state trust funds impose a one-time deductible that is not captured in the ASTSWMO data. There may also be remediation costs that have been determined to be ineligible based on program specific regulations. Potential ineligible costs include site-specific prorating based on compliance at the time of the release, initial response action costs, legal costs, and permit fees. An assessment of the impact of this potential underestimation of costs is included in the sensitivity analysis provided in this report.
Keller (1998). Keller produced a paper entitled: “An Integral Cost-Benefit Analysis of Gasoline Formulations Meeting California Phase II Reformulated Gasoline Requirements.” Table 7 in the paper,

©Copyright 2005 ENSR Corporation, All Rights Reserved July, 2005 3-6Q:\mw97\Projects\04373\014\570\all.doc
Total Groundwater Site Remediation, provides a range of costs, as well as “typical” costs, for site investigation, soil remediation, water treatment, and the total of each combined. The Keller data is based on sites with conventional gasoline, as well as gasoline with MTBE, and is summarized below:
Table 3-2 Cost Data Provided by Keller (1998)
Reported Statistic Gasoline with MTBE Conventional Gasoline
(without MTBE)
Range of Costs: $190,000 - $750,000 $97,000 - $610,000
Typical Cost: $390,000 $280,000
The paper defines “conventional gasoline” as not containing MTBE. The average of the “typical” cost reported for sites, with and without MTBE, was calculated to derive a value of $335,000 for this parameter. This assumes that there were a similar number of sites in each category, and that the typical value of each is representative of the most probable cost.
ENSR Trust Fund Records (2005). The ENSR questionnaire submitted to state LUST programs in 2004 resulted in state-by-state values for this parameter. The questionnaire asks for an average cost to clean-up sites in the particular state. Values were reported for 31 states, including low and high estimates of the average cost of remediation. Most responses provided the same value for the high and low estimate. Where these differed, the high value was used. These cost estimates were combined with the EPA’s records of the number of LUST sites in each state (EPA OUST, 2004) to calculate a weighted average cost per site of $136,069.
ENSR US Data (2005). The ENSR US Retail Petroleum Client Database was queried for the period from May 1995 to May 2005. The query included remediation costs for 133 sites in 20 states. The average reported cost was calculated for each of the 20 states. These average costs were then combined with the number of sites in each state (EPA OUST, 2004) to calculate a weighted average cost per site of $251,182.
Martinson (2000). A publication featured in “Underground Tank Technology Update,” by the University of Wisconsin (Vol. 14, No. 6, 2000) provided estimated costs for remediation. The estimate was based on theoretically applying draft California guidelines, as well as historical costs incurred, for California leaking underground fuel tank (LUFT) sites. Bar charts of projected costs were provided for five classes of sites: BTEX onsite, BTEX on/offsite, MTBE Class A, MTBE Class B, and MTBE Class C. The three MTBE classes are based on potential vulnerability of nearby water supplies. Cost estimates for each class was separated into various phases of work, including site assessment and active remediation. To use this information in our study, we interpreted cost data from the bar charts, and then calculated the per-site remediation costs by averaging the values provided for each of the five

©Copyright 2005 ENSR Corporation, All Rights Reserved July, 2005 3-7Q:\mw97\Projects\04373\014\570\all.doc
classes. The result of these calculations yields a value of $280,000. This result assumes that there are an equal number of sites in each class.
Wilson (2004). A recent article entitled “Costs and Issues Related to Remediation of Petroleum-Contaminated Sites” was presented at the National Groundwater Association (NGWA) Conference on Remediation: Site Closure and the Total Cost of Clean-up. The article provided statistical values (including minimum, maximum, mean, and median) for estimated site costs from a variety of sources, such as EPA’s Cleanup Information (CLU-IN) database and state of Kansas records. The Wilson article provided average costs for each state by multiplying the site-specific cost data with the number of sites reported for each state. Wilson used the mean reported remediation cost (not median) for each of the state datasets, and the number of sites in each dataset. We did not need to derive our own weighted average cost for this data source, because Wilson provided state-based data. The value derived from Wilson (2004) for this parameter is $199,069.
3.6 Fraction of Remediation Cost Due to MTBE (Parameter Q)
This parameter represents the fraction of site remediation costs that are attributable to MTBE impacts. This fraction was calculated differently for the available data sources, based on the information provided in each relevant source. Calculation details are provided below for each of these sources. In general, this parameter reflects the cost of MTBE remediation divided by the total remediation cost, on a per-site basis. Our research relied upon published data sources and internal ENSR data for this parameter. For those sources that provided a total remediation cost, as well as a differential cost attributable to MTBE, a fraction of costs was easily obtainable to use for this parameter. Other sources provided a fraction, without the underlying cost data.
NEIWPCC (2003). The NEIWPCC survey described previously for other parameters also included a question related to this parameter. Specifically, Question 39a/b asked: “Has MTBE had a noticeable impact on the cost of remediation in your state? If Yes, please indicate the percentage of the sites that fall into each category.” The category options included: no increased costs; small increase in cost (<20%), significant increase in cost (20-50%), very significant increase in cost (50-100%), and cost more than doubled. A total of 43 states provided responses to this question. To derive a value for this parameter, an additional data source (EPA OUST, 2004) was necessary. The mid-point of each response range was multiplied by the number of LUST sites reported by EPA (EPA OUST 2004). Then a weighted average was calculated by adding the calculated per-state values together, and dividing by the total number of states reporting (43). This yielded an overall percent increase in remediation costs due to the presence of MTBE, weighted by state. To derive this particular parameter, the calculated percent increase (13%) was divided by the associated total (1.13%) to calculate a fractional MTBE cost of 11.5%.
Keller (1998). As introduced for Parameter O, Table 7 of the Keller article provides cost estimates for sites with and without MTBE, as summarized on the following table for convenience:

©Copyright 2005 ENSR Corporation, All Rights Reserved July, 2005 3-8Q:\mw97\Projects\04373\014\570\all.doc
Table 3-3 Cost Data Provided by Keller (1998)
Reported Statistic Gasoline with MTBE Conventional Gasoline
(without MTBE)
Range of Costs: $190,000 - $750,000 $97,000 - $610,000
Typical Cost: $390,000 $280,000
The fraction of costs attributable to the presence of MTBE was calculated by dividing the difference between the two typical cost values reported ($110,000), by the average remediation cost of both categories ($335,000), yielding a value of 33%.
ENSR US Data (2005). The ENSR US Retail Petroleum Client Database query for the May 1995 to May 2005 period provided information pertaining to this parameter. The query included data for 130 sites in 20 states, with estimated remediation costs for sites with and without MTBE. For all 130 sites, the average remediation cost was $174,574 per site. For sites where MTBE in groundwater was not detected, the average remediation cost was lower, at an estimated $151,372 per site. For sites with MTBE, the average remediation cost was higher, at an estimated $191,996 per site. The fraction of costs attributable to MTBE was calculated by dividing the difference between the two cost extremes ($40,624), by the average remediation cost of both categories ($174,574), yielding a value of 23%.
Martinson (2000). The Martinson publication from the University of Wisconsin (Vol. 14, No. 6, 2000) provided estimated costs for remediation, which projected costs for sites with and without MTBE (refer to earlier Martinson discussion for Parameter O). To use this information for this particular parameter, we interpreted cost data from the bar charts provided, and then calculated the per-site remediation costs by averaging the values provided for each of the five classes presented (BTEX onsite, BTEX on/offsite, MTBE Class A, MTBE Class B, and MTBE Class C). Note that this assumes there are an equal number of sites in each class. To derive a value for this parameter, we subtracted the difference between average site costs with and without MTBE ($123,200), and divided by the average value for all site categories ($280,000), which yielded a value of 44% for the percentage of costs attributable to MTBE.
Wilson (2004). The recent Wilson article provided statistical values (including minimum, maximum, mean, and median) for estimated site costs. As previously noted for this particular data source, because Wilson provided average costs per state, we did not need to derive our own state-weighted average costs. To derive a value for this parameter, we subtracted the difference between average site costs with and without MTBE ($43,795), and divided by the average value for all site categories ($199,069), to derive a value of 22% for the percentage of costs attributable to MTBE.

©Copyright 2005 ENSR Corporation, All Rights Reserved July, 2005 3-9Q:\mw97\Projects\04373\014\570\all.doc
3.7 Fraction of Effort Not Yet Incurred for Ongoing LUST Remediation (Parameter AA)
The intent of this parameter is to recognize that a portion of remediation costs for open LUST site releases have already been incurred. This is an important concept when attempting to estimate the LUST site remediation costs “remaining” for existing LUST site releases. This was the most difficult parameter to quantify during our research, because very few published sources attempted to derive an estimate. Accordingly, several assumptions are necessary, which are described below for the two sources used. It is important to note that this parameter is used in the NCE to adjust the number of existing LUST site releases, not the cost data per LUST site.
ENSR US Data (2005). The ENSR US Retail Petroleum Client Database query for the May 1995 to May 2005 period provided information pertaining to this parameter. Of the 130 sites used from the query, 10 projects were randomly selected to closely evaluate the distribution of remediation progress. We distributed the number of sites among four schedule milestones (0-25% complete, 26-50% complete, 51-75% complete, and 76-100% complete). Then an average cost per phase was calculated for the 10-site dataset. Subtracting the average unit cost incurred to date from the total estimated unit cost per project, and dividing by the total unit cost per project, yields a value of 44% for the fraction of project work not yet incurred.
Martinson (2000). The Martinson publication from the University of Wisconsin (Vol. 14, No. 6, 2000) provided estimated costs for remediation, which included cost estimates for four phases of work (assessment, active remediation, passive remediation, and closure). To calculate a value for this parameter, we summed the reported values for similar project-phase cost data, across each of the five classes reported (refer to Martinson discussion provided for Parameter O). We then subtracted the unit cost incurred to date from the total estimated unit cost per project, and divided by the total unit cost per project, to estimate a value of 57% for the fraction of project work not yet incurred.
3.8 Summary of Input Variables
A summary of values used for the seven independent parameters in the NCE calculation is provided in Table 3-4. Two important points should be recognized when reviewing this information. First, the values shown are as-reported or calculated from the referenced published data sources or internal ENSR data. As introduced in Section 1.0, a critical aspect of our research involved assigning a reliability index to each of these values that accounts for inherent differences in reliability. Second, rather than calculating a weighted or representative value for each parameter, we compiled all values simultaneously to derive a distribution of potential results via a Monte-Carlo procedure. If we selected specific values or a mean value for each parameter, we would have introduced a level of bias. Alternatively, the Monte-Carlo approach we implemented for the NCE calculation reduces the potential for bias. Section 5.0 presents the theory and methodology used to derive an NCE distribution using all of the available values shown in Table 3-4, along with their associated reliability indices. Section 6.0 provides a sensitivity analysis to assess the impact of assumptions used in interpreting source data.

©Copyright 2005 ENSR Corporation, All Rights Reserved July, 2005 3-10Q:\mw97\Projects\04373\014\570\all.doc
Table 3-4 Summary of Values for Input Variables
Data Source/Parameter
Num
ber o
f Con
firm
ed
Rel
ease
s
Num
ber o
f LU
ST S
ite
Rel
ease
s w
ith R
emed
iatio
n In
itiat
ed
Num
ber o
f Clo
sed
LUST
Si
te R
elea
ses
Frac
tion
of L
UST
Site
R
elea
ses
Whe
re M
TBE
is
Det
ecte
d
Rem
edia
tion
Cos
t Per
LU
ST S
ite
Frac
tion
of L
UST
R
emed
iatio
n C
ost D
ue to
M
TBE
Frac
tion
of E
ffort
Not
Yet
In
curr
ed fo
r Ong
oing
R
emed
iatio
n
NCE Parameter: C D E K O Q AA NEIWPCC (2000) 52% NEIWPCC (2003) 54% 11.5% EPA OUST (2004) 445,002 410,689 316,259 EDR (2005) 539,623 Wilson (2002) $174,820 GAO (2002) 416,702 267,969 $88,000 ASTSWMO (2004) $100,217 EPA (1998)1 Keller UCSB (1998) $335,000 33% ENSR Trust Fund (2005) 507,243 251,364 $136,069 ENSR US Data (2005) 75% $251,182 27% 44% Martinson (2000) $280,000 44% 57% Wilson (2004) $199,069 22%
Notes: NCE = Nationwide Cost Equation Refer to reference list for full citations Refer to parameter discussion for full descriptions 1 Value of 39% provided for costs attributable to MTBE was based on insufficient data. Source: U.S. EPA, Office of Solid Waste and Emergency Response (OERR), January 1998, MTBE Fact Sheet #2. Remediation of MTBE Contaminated Soil and Groundwater

©Copyright 2005 ENSR Corporation, All Rights Reserved July, 2005 4-1Q:\mw97\Projects\04373\014\570\all.doc
4.0 INTERNAL ENSR DATA
Our approach to estimating the NCE for LUST site releases with MTBE included supplementing published source data with internal ENSR data. We maintain two types of datasets that were used to complement the information obtained from published data sources: trust fund records and project-specific data. The methods used to compile and apply these datasets are described in the following subsections.
4.1 ENSR Trust Fund Records
ENSR’s trust fund records are based on general trust fund information collected by our “Reimbursement Management Group,” a dedicated team whose sole business is the compilation and submittal of LUST Trust Fund reimbursement claims. The trust fund information used in our evaluation was based on responses to a January 2005 questionnaire pertaining to the 3rd and 4th quarter of calendar year 2004. Trust fund information regarding the number of active and closed LUST site releases and the average cost to closure were compiled for use in the NCE. Table 3-1 summarizes this information from ENSR trust fund records.
Table 4-1 ENSR Trust Fund Records
Parameter Value Comments
Number of Active (Registered) USTs 968,812 Based on responses from 34 states. No response from AK, HI, IA, KY, MA, MI, MS, MT, NE, NH, NJ, NY, ND, OR, SD and WY.
Number of LUST Site Releases 255,879 Based on responses from 36 states. No response from AK, HI, IA, KY, MI, MS, MT, NE, NJ, NY, ND, OR, SD and WY.
Number of Remediated (Closed) LUST Site Releases
251,364 Based on responses from 32 states. No response from AK, CT, HI, IA, KY, MA, MI, MS, MT, NE, NH, NJ, NY, ND, OR, SD, TN and WY.
Estimated Remediation Cost per LUST Site Release
$136,069 Based on weighted responses from 31 states. No response from AK, CT, HI, ID, IA, KY, MI, MS, MT, NE, NJ, NY, ND, OR, RI, SD, TN, VA, WV and WY.

©Copyright 2005 ENSR Corporation, All Rights Reserved July, 2005 4-2Q:\mw97\Projects\04373\014\570\all.doc
4.2 ENSR Project Data
ENSR provides remediation services to the petroleum industry throughout the U.S. and internationally. For this research, we compiled site data and associated costs in the project records from several of our US retail petroleum clients.
4.2.1 Site Information Query
To develop the ENSR project database for retail petroleum clients, a comprehensive list of closed LUST sites for our three largest retail petroleum clients was developed. The list included all current or former retail petroleum facilities, at which a gasoline release had been detected, and the site had been closed within the past 10 years. The query spanned a variety of gasoline-impacted LUST sites, states, and regulatory climates.
A preliminary screening was completed of the initial list to ensure that each project was associated with a LUST and that the release was attributable to gasoline. Projects eliminated during this preliminary screening included non-gasoline LUST sites, minor surface spills, dispenser collisions, and minor soil issues associated with piping upgrades. Once the final list was screened, a 25-question query was distributed to the ENSR Project Manager most familiar with each particular project. Project Managers responded to the query, and the information was uploaded into a searchable project database. The information included data for MTBE and other gasoline constituents, including benzene, toluene, ethylbenzene, and xylenes (BTEX). The questionnaire also included specific questions regarding the effect of MTBE on site closure costs. A copy of the questionnaire is provided as Figure 4-1.
4.2.2 Evaluation of Compiled Results
The compiled project database included a total of 133 sites from 20 states representing the Northeast (Maine, New Hampshire, Massachusetts, Connecticut, Rhode Island), Mid-Atlantic and Southeast (New Jersey, Delaware, Maryland, Pennsylvania, West Virginia, Virginia, North Carolina), Midwest (Illinois, Indiana, Wisconsin), Southwest (Utah, Arizona) and West Coast (California, Oregon, Washington). These states enforce a variety of regulations, including those with and without specified MTBE clean-up standards, and some which allow risk-based closures. The 133 sites spanned a range of characteristics, including sites with and without MTBE, sites that impacted nearby drinking water supplies, and sites that were closed via active or passive (i.e., monitored natural attenuation) remediation.

©Copyright 2005 ENSR Corporation, All Rights Reserved July, 2005 4-3Q:\mw97\Projects\04373\014\570\all.doc
Figure 4-1 ENSR Project Database Questionnaire

©Copyright 2005 ENSR Corporation, All Rights Reserved July, 2005 4-4Q:\mw97\Projects\04373\014\570\all.doc
4.2.3 Development of Internal Cost Estimate
For each of the 133 sites solicited for the questionnaire, an estimated site closure cost was reported by the ENSR Project Manager. This estimate included costs associated with the investigation and remediation of the documented release. After compiling the cost data, our project statistician interpreted the information by applying a log-transformation to identify statistical outliers. In general, the reported costs were well described by a lognormal probability distribution. However, the three highest reported costs (each greater than $1 million) diverged from the log-normal probability straight line fit. After discussions with those Project Managers, we determined that the costs for those three sites were driven by a combination of BTEX contamination, litigation, and third-party involvement. Based on this information and the non-linear fit relative to the other data points, we considered these values to be outliers. The remaining 130 sites were used for internal cost estimation.
Although the ENSR internal dataset is limited relative to published data sources that span a greater number of sites across the U.S., several interesting observations of our internal dataset provide some insight on MTBE remediation costs. Observations from the ENSR internal dataset are listed below, and a full cost summary is provided in Table 4-2.
• Closure costs for sites where MTBE was detected ($192K) were higher than costs at sites where MTBE was not detected ($151K). Average closure costs appear to increase with decreased MTBE concentrations (based on maximum MTBE concentrations).
• Drinking water impacts by MTBE appear to increase mean closure costs ($286K for impacted sites compared to $166K for sites with no drinking water impacts). This seems to be due to increased remediation costs since closure costs for active remediation sites with drinking water impacts ($336K) were significantly greater than for remediation sites without drinking water impacts ($201K).
• Active remediation sites had the highest closure costs, followed by risk-based closures. Closure costs for active remediation of sites with MTBE averaged $220K, compared to $203K for remediation of sites where MTBE was not detected in the groundwater. Similarly, costs for risk-based closure with MTBE averaged $119K, compared to $137K for risk-based closure where MTBE was not detected in the groundwater.
4.2.4 Quality Assurance Review
To evaluate the quality of the internal data compiled from ENSR Project Managers, we randomly selected a sample size of 25 projects from the database of 133 projects. For each of the 25 projects, our MTBE research team randomly confirmed the Project Manager responses to 11 of the 25 questions that were critical to the development of our internal cost estimate. Based on the quality assurance review, no errors warranting a re-evaluation of data were identified.

©Copyright 2005 ENSR Corporation, All Rights Reserved July, 2005 4-5Q:\mw97\Projects\04373\014\570\all.doc
Table 4-2 Summary of Internal ENSR Remediation Cost Data
State1 Minimum Arithmetic Average Median Maximum
Number of Projects
Arizona $388,508 $497,764 $497,764 $607,019 2
California $21,184 $144,658 $113,761 $418,635 16
Connecticut $154,860 $154,860 $154,860 $154,860 1
Delaware $538,581 $538,581 $538,581 $538,581 1
Illinois $65,096 $196,216 $194,223 $392,835 6
Indiana $45,063 $273,567 $183,312 $902,253 6
Massachusetts $10,400 $149,450 $93,915 $841,195 31
Maryland $21,982 $21,982 $21,982 $21,982 1
Maine $3,787 $85,719 $5,245 $802,707 12
North Carolina $259,972 $365,550 $365,550 $471,128 2
New Hampshire $19,438 $43,450 $21,030 $133,958 5
New Jersey $104,262 $208,914 $208,914 $313,565 2
Oregon $17,634 $56,570 $56,570 $95,505 2
Pennsylvania $766,743 $766,743 $766,743 $766,743 1
Rhode Island $542,375 $542,375 $542,375 $542,375 1
Utah $424,888 $424,888 $424,888 $424,888 1
Virginia $4,639 $167,085 $54,739 $594,393 14
Washington $57,078 $215,822 $138,859 $451,530 3
Wisconsin $105,449 $237,270 $200,865 $469,270 15
West Virginia $36,502 $118,727 $83,990 $366,912 8
Nationwide $3,787 $178,574 $109,018 $902,253 130
Notes: 1 This table includes U.S. states where ENSR has project sites for its retail petroleum work queried for this research; no states were specifically excluded.

©Copyright 2005 ENSR Corporation, All Rights Reserved July, 2005 5-1Q:\mw97\Projects\04373\014\570\all.doc
5.0 STATISTICAL ANALYSIS
Values for the input parameters in the Nationwide Cost Equation (NCE) presented in Section 2.0 show a variation within the group of data sources. In addition, there is a difference between the reliability of these data sources. Both factors contribute to the uncertainty in the input parameters for the NCE. Through the additions and multiplications in the NCE, this uncertainty is propagated to the final estimate of the nationwide cost.
5.1 Uncertainty Propagation
If two random variables are added, the mean value of their sum is equal to the sum of their mean values. The standard deviation of the sum is equal to the square root of the sum of the squares of the standard deviations of the two random variables. If two random variables are multiplied, the mean value of their product is equal to the product of their means. The equation for the standard deviation of the product is more complex and is given by:
)15())(( 222222 −−++= BABA BAC σσσ
Where
A = mean of random variable “a” B = mean of random variable “b” σA = standard deviation of random variable “a” σB = standard deviation of random variable “b” σC = standard deviation of the product of random variables “a” and “b” Just knowing the mean and standard deviation of the cost estimate does not allow one to specify a frequency distribution for this output variable. For example, one may want to know the probability that the cost estimate exceeds a certain value. The output variable frequency distribution will depend upon the input variable frequency distributions.
5.2 Monte-Carlo Analysis
To determine the cumulative frequency distribution of the cost estimate output variable, a Monte-Carlo analysis was performed. For each step of the Monte-Carlo procedure a set of input parameter values is chosen at random from the input parameter frequency distributions. With each set of input parameters, the cost output is calculated and saved. This procedure is repeated 100,000 times and the cost output values are sorted from lowest to highest to develop a cumulative frequency distribution of values. This Monte-Carlo analysis was performed using the @RISK software (Palisade Corporation, Version 4.5.4, Standard Edition). The software is an “add-in” to Microsoft Excel.

©Copyright 2005 ENSR Corporation, All Rights Reserved July, 2005 5-2Q:\mw97\Projects\04373\014\570\all.doc
5.3 Data Source Reliability and Scoring
To quantify the reliability of available data sources, a scoring approach was developed that assigns a relative ranking of 1 to 5 (with 5 being the most reliable) using the following data source factors:
• Number of states included in this source (29% weighting)
• Number of sites included in this source (29% weighting)
• Publication year (29% weighting)
• Author affiliation; public or private (scale of 1 to 2; 13% weighting)
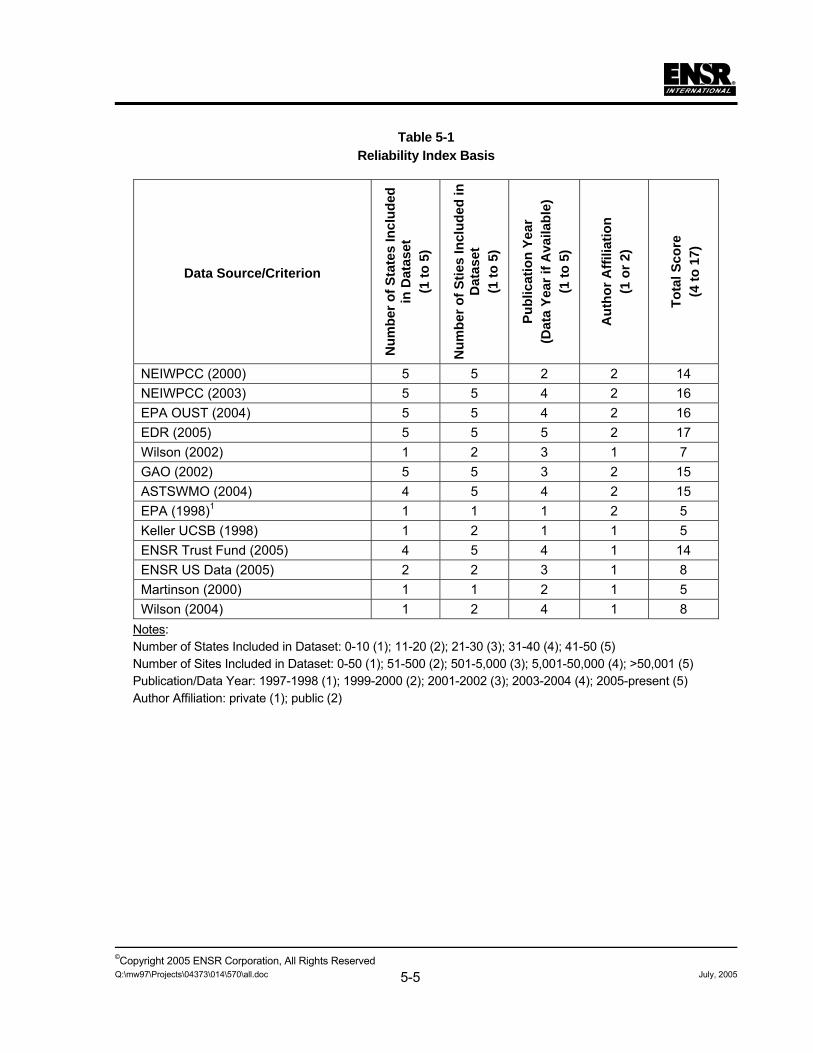
Figure 5-1 presents the relative reliability assigned to each of the 12 available data sources after applying this approach. A total score is computed for each data source. Additional detail for each source is provided in Table 5-1.
5.4 Example Calculation
As previously described, the Monte-Carlo procedure minimizes potential bias by randomly combining input variables into the NCE calculation. Based on the number of parameters in the NCE, and the number of values for each parameter, there are 2,880 possible combinations for the final result. An example of one possible combination is provided below, which is useful to see how the NCE is applied. The reliability indices dictate the probability of particular values being selected in the 100,000-iteration Monte-Carlo run. If desired, individual states could use state-specific information for the input variables to estimate the cost for remediation of existing LUST sites in a particular state.
NCE = (H + G*AA) * K * S H = C – D = 445,002 – 410,689 (EPA OUST, 2004) = 34,313 G = D – E = 410,689 – 316,259 (EPA OUST, 2004) = 94,430 AA = 57% (Martinson, 2000) K = 54% (NEIWPCC, 2003)

©Copyright 2005 ENSR Corporation, All Rights Reserved July, 2005 5-3Q:\mw97\Projects\04373\014\570\all.doc
S = O * Q = $199,069 * 22% (Wilson, 2004) = $44,230 NCE = (H + G*AA) * K * S = [34,313 + (94,430 * 0.57)] * 0.54 * $44,230 = $2.08 billion
5.5 Input Parameter Distributions
For the Monte-Carlo analysis, a discrete probability distribution was selected for each of the input parameters. For each parameter a number of values are available from among the 12 data sources. The probability of choosing one of these values during an iteration of the Monte-Carlo procedure is proportional to the reliability score discussed earlier in this section. The probability of selecting each of the possible input values is illustrated in Figures 5-2 to 5-7. Note that a distribution figure is not presented for the “Remediation Initiated” input variable because only one value was available.
5.6 Output Parameter Distribution
From 100,000 iterations of the Monte-Carlo procedure, a distribution of the cost was determined. Prior to running the procedure, it was determined that no significant correlation existed between the input parameters. Selected statistics of the generated (mid-range) cost distribution are given in Table 5-2, and a distribution graphic is provided in Figure 5-8.
As presented, the distribution generated by the Monte-Carlo procedure represents the distribution of the mid-range values for each of the input variables. A full distribution of all source data was not possible, given that none of the published data sources provided a full data range. The published data sources provided only average, mean, minimum, or maximum values, which enabled the calculation of a mid-range value, but not the calculation of a full source-data distribution.

©Copyright 2005 ENSR Corporation, All Rights Reserved July, 2005 5-4Q:\mw97\Projects\04373\014\570\all.doc
Figure 5-1 Source Data Reliability Indices
0
2
4
6
8
10
12
14
16
18
NEIWPCC (2
000)
NEIWPCC (2
003)
EPA OUST (2
004)
EDR (200
5)
Wilson (2
002)
GAO (200
2)
ASTSWMO (200
4)
EPA (199
8)
Keller
UCSB (199
8)
ENSR Trust
Fund Rec
ords (
2005
)
ENSR US D
ata (2
005)
Martinso
n (200
0)
Wilson (2
004)
Data Source
Con
fiden
ce F
acto
r
Number of States
Number of Sites
Publication Year
Author Affiliation
©Copyright 2005 ENSR Corporation, All Rights Reserved July, 2005 5-5Q:\mw97\Projects\04373\014\570\all.doc
Table 5-1 Reliability Index Basis
Data Source/Criterion
Num
ber o
f Sta
tes
Incl
uded
in
Dat
aset
(1
to 5
)
Num
ber o
f Stie
s In
clud
ed in
D
atas
et
(1 to
5)
Publ
icat
ion
Year
(D
ata
Year
if A
vaila
ble)
(1
to 5
)
Aut
hor A
ffilia
tion
(1
or 2
)
Tota
l Sco
re
(4 to
17)
NEIWPCC (2000) 5 5 2 2 14 NEIWPCC (2003) 5 5 4 2 16 EPA OUST (2004) 5 5 4 2 16 EDR (2005) 5 5 5 2 17 Wilson (2002) 1 2 3 1 7 GAO (2002) 5 5 3 2 15 ASTSWMO (2004) 4 5 4 2 15 EPA (1998)1 1 1 1 2 5 Keller UCSB (1998) 1 2 1 1 5 ENSR Trust Fund (2005) 4 5 4 1 14 ENSR US Data (2005) 2 2 3 1 8 Martinson (2000) 1 1 2 1 5 Wilson (2004) 1 2 4 1 8
Notes: Number of States Included in Dataset: 0-10 (1); 11-20 (2); 21-30 (3); 31-40 (4); 41-50 (5) Number of Sites Included in Dataset: 0-50 (1); 51-500 (2); 501-5,000 (3); 5,001-50,000 (4); >50,001 (5) Publication/Data Year: 1997-1998 (1); 1999-2000 (2); 2001-2002 (3); 2003-2004 (4); 2005-present (5) Author Affiliation: private (1); public (2)

©Copyright 2005 ENSR Corporation, All Rights Reserved July, 2005 5-6Q:\mw97\Projects\04373\014\570\all.doc
Figure 5-2 Number of Confirmed LUST Site Releases (Parameter C)
EDR (2005)
ENSR Trust Fund (2005)
EPA OUST (2004)
GAO (2002)
20%
21%
22%
23%
24%
25%
26%
27%
28%
300,000 350,000 400,000 450,000 500,000 550,000 600,000
Confirmed Releases
Sele
ctio
n Pr
obab
ility
Figure 5-3 Number of Closed LUST Site Releases (Parameter E)
EPA OUST (2004)
GAO (2002)
ENSR Trust Fund (2005)
30%
32%
34%
36%
38%
40%
200,000 220,000 240,000 260,000 280,000 300,000 320,000 340,000
Closed Sites
Sele
ctio
n Pr
obab
ility

©Copyright 2005 ENSR Corporation, All Rights Reserved July, 2005 5-7Q:\mw97\Projects\04373\014\570\all.doc
Figure 5-4 Fraction of LUST Site Releases with MTBE (Parameter K)
ENSR US Data (2005)
NEIWPCC (2003)
NEIWPCC (2000)
15%
20%
25%
30%
35%
40%
45%
50%
0% 10% 20% 30% 40% 50% 60% 70% 80%
Percent of Sites with MTBE
Sele
ctio
n Pr
obab
ility
Figure 5-5 Remediation Cost per LUST Site Release (Parameter O)
GAO (2002); ASTSWMO (2004)
ENSR Trust Fund (2005)
Wilson(2002; 2004)
ENSR Data (2005)
Martinson (2000) Keller UCSB (1998)
5%
10%
15%
20%
25%
$- $100,000 $200,000 $300,000 $400,000
Remediation Cost per Site
Sele
ctio
n Pr
obab
ility

©Copyright 2005 ENSR Corporation, All Rights Reserved July, 2005 5-8Q:\mw97\Projects\04373\014\570\all.doc
Figure 5-6 Fraction of Remediation Costs Due to MTBE (Parameter Q)
Martinson (2000)Keller UCSB (1998)
ENSR US Data (2005);Wilson (2004)
NEIWPCC (2003)
0%
5%
10%
15%
20%
25%
30%
35%
40%
0% 10% 20% 30% 40% 50%
MTBE Percent of Cost
Sele
ctio
n Pr
obab
ility
Figure 5-7 Fraction of Effort Not Yet Incurred For Ongoing Remediation (Parameter AA)
Martinson (2000)
ENSR US Data (2005)
30%
35%
40%
45%
50%
55%
60%
65%
40% 45% 50% 55% 60%
Percent Costs Not Incurred
Sele
ctio
n Pr
obab
ility

©Copyright 2005 ENSR Corporation, All Rights Reserved July, 2005 5-9Q:\mw97\Projects\04373\014\570\all.doc
Table 5-2 National Cost Summary Statistics
Derived from Mid-range of Input Values
Statistic Value (billion)
5th Percentile $0.48
Median $2.00
Mean $2.76
95th Percentile $7.70
Figure 5-8 National Cost Distribution
Derived from Mid-range of Input Values
Median:$2.00 billion
0%
5%
10%
15%
20%
25%
30%
0 2 4 6 8 10 12 14 16 18 20
National Cost of MTBE Remediation ($ billion)
Freq
uenc
y of
Res
ult (
%)

©Copyright 2005 ENSR Corporation, All Rights Reserved July, 2005 6-1Q:\mw97\Projects\04373\014\570\all.doc
6.0 SENSITIVITY ANALYSIS
When attempting to estimate a cost of this magnitude at a national scale, there are many assumptions and interpretations required. To maximize the precision of a cost estimate, it is necessary to incorporate as much publicly available information as possible. However, with the exception of our internal ENSR data, none of the available sources provide underlying datasets, or a statistical distribution of their results. With this level of uncertainty, much of the published data is subject to interpretation. For example, the basis of average remediation costs reported by different sources varied. The $88,000 unit cost reported by GAO (2002) could be dominated by LUST site releases without MTBE, whereas the Martinson (2004) unit cost of $280,000 is referenced as being inclusive of sites with MTBE. The selection of that parameter alone has an impact on the final cost result.
In addition to the variety of data sources, and clarity of the basis for the reported values, other facets of our calculations can lead to varied interpretations and results. During the peer review process, we received suggestions of items to evaluate in a sensitivity analysis. We combined these suggestions with our own observations, and selected three different scenarios to further assess. The following paragraphs present our analysis of these scenarios, and the results are summarized in Table 6-2.
Eliminate Reliability Indices
The reliability factors were selected after compilation of the available data sources. The intent of the cumulative reliability scores was to eliminate potential bias in selecting one particular source over another. This approach appeared to assign greater weight to lower values. For example, the unit costs shown in Figure 5-5 reveal lower values for GAO (2002) and ASTSWMO (2004) data, both of which received high reliability scores (15 out of a possible 17). To assess the impact of the reliability indices, we reapplied the NCE without the indices, using the same 100,000 iterations of the Monte-Carlo procedure. The result was a median value of $3.19 billion, which is higher than the result presented in this paper.
Eliminate Author Affiliation Factor
In the interest of minimizing potential bias, we gave preference to public sources over private sources. However, several comments were received during the peer review process, indicating that some of the private data sources could be equally, if not more, accurate than public data sources. The theory being that the author is more familiar with the reported data and underlying datasets. To assess the impact of the author affiliation factor, we recalculated the national cost without this factor, while still retaining the other reliability factors. We again used the same 100,000 Monte-Carlo simulations. The result was a median value of $1.98 billion, which is lower than our baseline result.
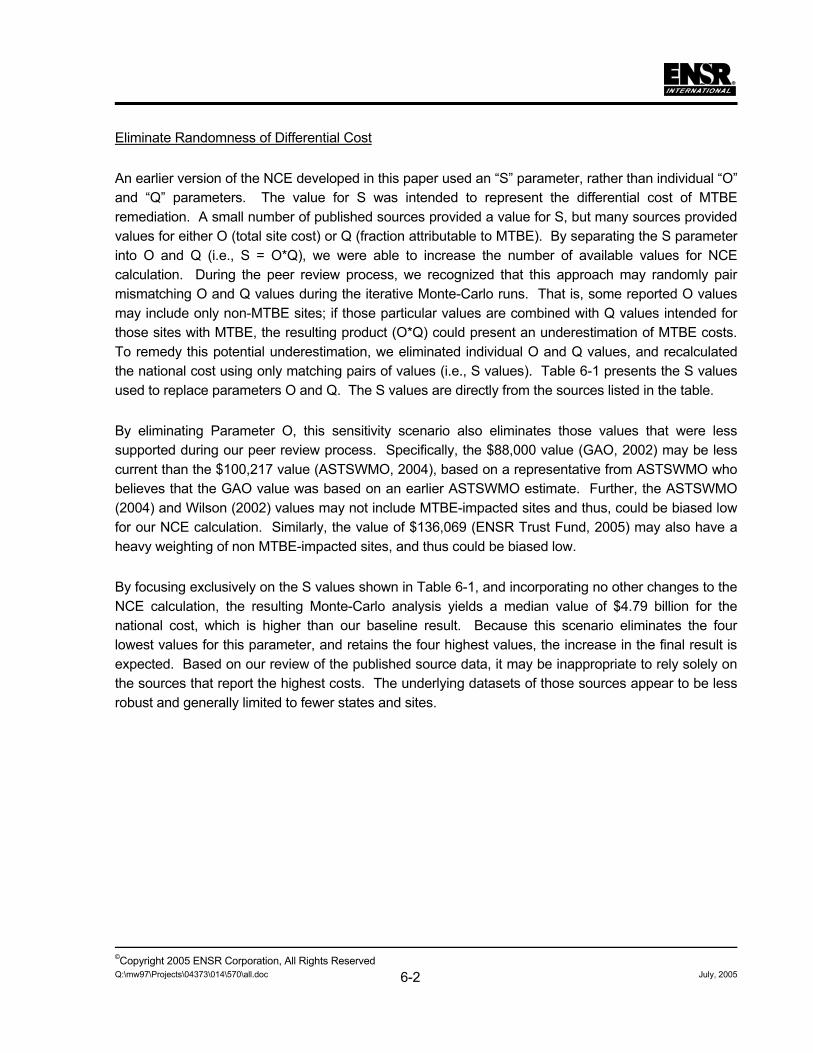
©Copyright 2005 ENSR Corporation, All Rights Reserved July, 2005 6-2Q:\mw97\Projects\04373\014\570\all.doc
Eliminate Randomness of Differential Cost
An earlier version of the NCE developed in this paper used an “S” parameter, rather than individual “O” and “Q” parameters. The value for S was intended to represent the differential cost of MTBE remediation. A small number of published sources provided a value for S, but many sources provided values for either O (total site cost) or Q (fraction attributable to MTBE). By separating the S parameter into O and Q (i.e., S = O*Q), we were able to increase the number of available values for NCE calculation. During the peer review process, we recognized that this approach may randomly pair mismatching O and Q values during the iterative Monte-Carlo runs. That is, some reported O values may include only non-MTBE sites; if those particular values are combined with Q values intended for those sites with MTBE, the resulting product (O*Q) could present an underestimation of MTBE costs. To remedy this potential underestimation, we eliminated individual O and Q values, and recalculated the national cost using only matching pairs of values (i.e., S values). Table 6-1 presents the S values used to replace parameters O and Q. The S values are directly from the sources listed in the table.
By eliminating Parameter O, this sensitivity scenario also eliminates those values that were less supported during our peer review process. Specifically, the $88,000 value (GAO, 2002) may be less current than the $100,217 value (ASTSWMO, 2004), based on a representative from ASTSWMO who believes that the GAO value was based on an earlier ASTSWMO estimate. Further, the ASTSWMO (2004) and Wilson (2002) values may not include MTBE-impacted sites and thus, could be biased low for our NCE calculation. Similarly, the value of $136,069 (ENSR Trust Fund, 2005) may also have a heavy weighting of non MTBE-impacted sites, and thus could be biased low.
By focusing exclusively on the S values shown in Table 6-1, and incorporating no other changes to the NCE calculation, the resulting Monte-Carlo analysis yields a median value of $4.79 billion for the national cost, which is higher than our baseline result. Because this scenario eliminates the four lowest values for this parameter, and retains the four highest values, the increase in the final result is expected. Based on our review of the published source data, it may be inappropriate to rely solely on the sources that report the highest costs. The underlying datasets of those sources appear to be less robust and generally limited to fewer states and sites.

©Copyright 2005 ENSR Corporation, All Rights Reserved July, 2005 6-3Q:\mw97\Projects\04373\014\570\all.doc
Table 6-1 Differential Cost of MTBE Remediation
(Parameter S)
Source
Remediation Cost per LUST Site Release
(Parameter O)
Fraction of LUST Remediation Cost
Due to MTBE (Parameter Q)
Differential Cost of MTBE Remediation
(Parameter S)
Keller UCSB (1998) $335,000 33% $110,550
ENSR US Data (2005) $251,182 23% $57,772
Martinson (2000) $280,000 44% $123,200
Wilson (2004) $199,069 22% $43,795
Table 6-2 Summary of Sensitivity Analysis
Sensitivity Factor Median Result
(billion) None (No Change) $2.00 Eliminate Reliability Indices $3.19 Eliminate Author Affiliation Factor $1.98 Eliminate Randomness in Differential Cost $4.79

©Copyright 2005 ENSR Corporation, All Rights Reserved July, 2005 7-1Q:\mw97\Projects\04373\014\570\all.doc
7.0 RESULTS AND DISCUSSION
This research yields an estimated value of $2.0 billion for the remediation of MTBE releases from existing LUST sites across the nation. The NCE developed through this research was used to estimate this national cost. The NCE was populated with a series of input parameters obtained from a thorough review of available published data sources, supplemented by internal ENSR data. Each data source was assigned a reliability index based on the comprehensiveness of the underlying dataset. A distribution of possible results was generated using 100,000 iterations of a Monte-Carlo procedure, which consisted of the mid-range values for each data source, matched with the associated source reliability index. The statistical distribution of the mid-range values yields a median value of $2.0 billion.
As clarified throughout this paper, our cost estimate is focused on remediation of MTBE releases associated with LUST sites. As recorded by EPA (EPA OUST, 2004), the types of releases include releases from tank overflows and leaks from pressure-relief valves, dispensers, piping networks, and other equipment typically associated with LUST systems. The release areas include the immediate vicinity of the release, such as soil and groundwater in the source area, as well contaminant plumes emanating from the release, which may include plumes that impact nearby water supplies, such as domestic wells or source-water aquifers. The remediation cost associated with these releases and areas encompasses costs ranging from initial site assessment to remediation and closure.
Assumptions contributing to this derived value are explored in the sensitivity analysis provided in Section 6.0. As shown, by changing selected inputs into the NCE calculation, one can generate an array of associated results. We consider our baseline assumptions (resulting in the $2.0 billion median value) to be the most balanced and representative set of assumptions, based on our review of the source data. The variations shown in Section 6.0 are exploratory in nature, to provide practitioners with a sense of how the median value may change if key assumptions are altered.
The range of the distribution presented in Section 5.0 can potentially be reduced by obtaining additional published source data to expand the available dataset, and by obtaining the full range of each data source to better quantify the underlying data distribution. Despite the variability and limitations of this research topic, the methodology applied is appropriate for the wide range of reported data, and very limited datasets. This work can be expanded upon as desired, to further reduce uncertainties, incorporate limitations discussed in Section 1.0, and continue to improve the precision of a national remediation cost estimate for LUST site releases where soil and/or groundwater has been impacted by the presence of MTBE.

©Copyright 2005 ENSR Corporation, All Rights Reserved July, 2005 8-1Q:\mw97\Projects\04373\014\570\all.doc
8.0 REFERENCES
Association of State and Territorial Solid Waste Management Officials (ASTSWMO), June 20-23, 2004, State Financial Assurance Funds Survey Results, presented to 13th Annual State Fund Administrators Conference, Providence, Rhode Island (http://www.astswmo.org/Publications/Revbkshlf.htm#Tanks)
Environmental Data Resources, Inc. (EDR), May 2005, State LUST Site Release Database
ENSR, May 2005, Trust Fund Records
ENSR, May 2005, U.S. Retail Petroleum Client Databases
Keller, A.E., Fernandez, L., Kun, H., Peterson, A., Smith, B., Yoshioka, M., November 1998, An integral cost-benefit analysis of gasoline formulations meeting California Phase II Reformulated Gasoline requirements, Health and Environmental Assessment of MTBE, Vol. II
Martinson, M., March 20-22, 2000, MTBE Regulatory Overview: Cost Implications for MTBE Remediation, presentation at 12th Annual UST/LUST National Conference, Portland, Oregon. Cited in Underground Tank Technology Update, Vol. 14 (6): 5-9, College of Engineering, University of Wisconsin, Madison
New England Interstate Water Pollution Control Commission (NEIWPCC), August 2000, Survey of State Experiences with MTBE Contamination at LUST Sites, Lowell, MA
NEIWPCC, August 2003, Survey of State Experiences with MTBE and Other Oxygenate Contamination at LUST Sites, Summary Report and Compiled Results, Lowell, MA
U.S. Department of Energy, Energy Information Administration, Petroleum Marketing Monthly Report, June 2005 U.S. Environmental Protection Agency (EPA) Office of Underground Storage Tanks (OUST), November 24, 2004, FY 2004 Semi-Annual End-of-Year Activity Report, UST Program Facts (http://www.epa.gov/OUST/index.htm)
U.S. EPA, Office of Solid Waste and Emergency Response (OERR), January 1998, MTBE Fact Sheet #2. Remediation of MTBE Contaminated Soil and Groundwater (http://www.epa.gov/OUST/mtbe epa.htm)
U.S. EPA, January 2005, UCMR List 1a Chemical Monitoring Results and Concurrently Collected Source Water Occurrence Data (http://www.epa.gov/safewater/data/ucmrgetdata.html)

©Copyright 2005 ENSR Corporation, All Rights Reserved July, 2005 8-2Q:\mw97\Projects\04373\014\570\all.doc
U.S. General Accounting Office (GAO), May 2002, MTBE Contamination from Underground Storage Tanks, GAO-02-753T, Testimony before Committee on Energy and Commerce, House of Representatives, Washington, D.C. (http://www.gao.gov/new.items/d02753t.pdf)
Wilson, B., Wilson, J., July/August 2002, "Remedial Costs for MTBE in Soil and Groundwater," AEHS Magazine, Contaminated Soil Sediment and Water (http://www.aehsmag.com/issues/2002/july_august/index.htm).
Wilson, B., Hattan, G. Kuhn, J., McKay, R., Wilson, J., “Costs and Issues Related to Remediation of Petroleum-Contaminated Sites,” presented at the 2004 NGWA Conference on Remediation: Site Closure and the Total Cost of Clean-up, November 15-16, 2004, New Orleans, LA.