occurrence of methyl tertiary-butyl ether (mtbe) in ...methyl tertiary-butyl ether (mtbe) is a...
TRANSCRIPT

Occurrence ofMethyl Tertiary-Butyl Ether
(MTBE)in Groundwater at
Leaking Underground Storage Tank Sitesin Washington
October, 2000Publication No. 00-09-054

2
ACKNOWLEDGEMENTS
Funding for this study was provided by the United States Environmental Protection Agency(USEPA) Region 10. The financial support is gratefully acknowledged.
A special thanks goes to Ben Amoah-Forson for conducting the study and producing thisreport. Contributions by Charles San Juan, Steve Robb, Hun Seak Park, and Sharon Kaplanduring the initial development and planning of this study are deeply appreciated.
Overall thanks goes to Barry Rogowski and John Wietfeld for their administrative supportthroughout all the stages of this project. The continuous assistance of Steve Bremer andCraig Rankine during the sampling phase of this project is highly recognized and appre-ciated.
Finally, for their review and comments, particular thanks are extended to Nnamdi Madakorand Michael Boatsman (Ecology), Robert Cutler and Hal White (USEPA), and James Ebbert(USGS).

3
Table of Contents
LIST OF TABLES ............................................................................................................................................... 4
LIST OF FIGURES ............................................................................................................................................. 4
EXECUTIVE SUMMARY ................................................................................................................................. 5
INTRODUCTION ............................................................................................................................................... 6
METHOD OF STUDY ........................................................................................................................................ 8
DETERMINATION OF STUDY AREA...................................................................................................................... 8SITE AND WELL SELECTION STRATEGY............................................................................................................ 10DOWNGRADIENT WELL WAS SELECTED. ............................................................................................................ 10SAMPLING PROCEDURES................................................................................................................................... 10ANALYTICAL PROCEDURE ................................................................................................................................ 10
RESULTS ........................................................................................................................................................... 11
DATA PRESENTATION ....................................................................................................................................... 11RESULTS AND DISCUSSIONS ............................................................................................................................. 11
CONCLUSIONS ................................................................................................................................................ 15
REFERENCES................................................................................................................................................... 16

4
LIST OF TABLES
Table 1. Lust Site Distribution by Regions
Table 2. Sample Density Determination
Table 3. Statistical Summary of BTEX and MTBE Concentrations and Detection
Table 4. Threshold Concentrations and Overall Probabilities of Detection
Table 5. Concentration Correlation Coefficients between BTEX and MTBE
Table 6. Conditional Probabilities of Detection
Table A-1 MTBE and BTEX Groundwater Concentrations for all Sampled Sites by Cities
Table A-2 MTBE and BTEX Groundwater Concentrations for Contaminated Sites
LIST OF FIGURES
Figure 1. Distribution of LUST Sites by Regions
Figure 2. Overall Probabilities of Detection Above Threshold Concentrations andMaximum and Average Concentrations for BTEX and MTBE

5
EXECUTIVE SUMMARY
Methyl tertiary-butyl ether (MTBE) is a volatile oxygen-containing organic compound whichis added to gasoline to promote a more complete combustion, thereby reducing air pollutionand enhancing octane rating. Widespread use of this chemical has resulted in frequent detec-tion of MTBE in groundwater throughout the United States; in some cases, it has forcedproduction wells to shut down. The majority of these contaminations comes from leakingunderground storage tanks and spills of gasoline during refining and distribution. Unlike theBTEX components of gasoline, MTBE is difficult to biodegrade, readily dissolves in water,and can move rapidly through soil and groundwater.
The United States Environmental Protection Agency (USEPA) currently considers MTBE asa possible human carcinogen, and has issued a ‘Drinking Water Advisory’ of 20-40 parts perbillion (ppb), primarily based on aesthetic considerations. There is still no national health-based drinking water standard. Most states, including the District of Columbia, now havegroundwater cleanup or action levels. Washington has proposed a cleanup level of 20 ppbfor groundwater, but information on the occurrence and distribution of MTBE in the state’sgroundwater is currently unavailable. The primary objective of this study is to assess theoccurrence and concentrations of MTBE in Washington’s groundwater, and to determine,based on the findings, whether the occurrence and concentrations are significant enough towarrant regulatory action to protect public health and the environment.
Seventy LUST sites were selected based on LUST site distribution within the state. Onemonitoring well was sampled from each of the selected sites and analyzed for MTBE,benzene, toluene, ethylbenzene, and xylenes. Eight of the 70 groundwater samples showedno detection of any petroleum hydrocarbon compound of interest. Of the 62 sites thatshowed contamination, 30 sites, or 48%, reported detectable levels of MTBE, while 26 sites,or 42%, had concentrations at or above a threshold limit of 1 µg/L. In addition, 24%reported MTBE concentrations above the proposed MTCA Method A cleanup level of20 µg/L. The highest MTBE concentration reported was 7150 µg/L. The averageconcentration of all samples, which equaled or exceeded the threshold concentration of1 µg/L, was 441 µg/L, with a median of 13 µg/L. Detection rates for the BTEX componentswere more frequent, occurring in 90%, 66%, 61%, and 68% for benzene, toluene, ethylben-zene and xylenes, respectively. Average concentrations were also higher, compared to thatof MTBE at 1992 µg/L, 3943 µg/L, 657 µg/L, and 2251 µg/L for benzene, toluene, ethyl-benzene and xylenes respectively. While a strong correlation was observed betweenbenzene, toluene, ethylbenzene, and xylene concentrations (ρ = 0.83-0.97), benzene andMTBE concentrations showed no perceptible correlation (ρ = 0.26).
Analysis of conditional probabilities of detection among the chemicals indicates that toluene,ethylbenzene, and xylenes are highly associated with benzene. The probability of detectingbenzene, given any of these compounds, is approximately 96%. The analysis also demon-strates that individual BTEX components are usually found together at the same site, withconditional probabilities ranging from 0.8 to 0.95. The conditional probability of detectingMTBE given benzene detection was 0.45; however, the conditional probability of detectingbenzene given MTBE detection was 0.96. This implies that for almost all the sites whereMTBE was detected, benzene was also present. In addition, benzene concentrations

6
exceeded those of MTBE at 15 of the 24 sites (63%) where benzene and MTBE co-occurred.This suggests that the most downgradient monitoring wells selected at each site for this studywere generally at the tail end of the MTBE plume. Thus MTBE concentrations, especiallythose from older release sites reported in this study, might not represent the actual distribu-tion of MTBE concentrations resulting from the LUST sites.
As of May 2000, Washington State has about 6000 regulated LUST sites. Among these sites,1900, or 32%, are reported to have impacted groundwater. Given an MTBE occurrence rateof 42 % at sites where petroleum hydrocarbons have impacted shallow groundwater, theremay potentially be over 800 point sources of MTBE resulting from known leaking under-ground storage tanks. This number may be significantly higher because: a) some of the sitesreported as soil only impact may also have impacted groundwater; b) MTBE plumes mayhave migrated past the monitoring well networks at some of the older sites; c) existingMTBE plumes may have been missed since only one well per site was sampled for the study,and d) higher quantitation limits (50-1000 µg/L) for MTBE were used in analyzing 15% ofthe contaminated samples, and the resulting less-than values were counted as negativedetections.
Based on the findings of this study, it is concluded that data collected was insufficient toascertain the severity of potential MTBE impact to drinking water sources from these sites;nevertheless, it clearly shows that potential risk exist. Efforts should therefore be made toensure that MTBE does not cause harm to public health or the environment.
Recommendations submitted for immediate consideration include the following: a) Testingfor MTBE should be included in all LUST site investigations and monitoring activities,including tank closures. Possible exceptions may be given when, after initial assessment ofboth soil and groundwater, it is determined that MTBE is not present in the subsurface,b) Testing for MTBE should be performed using USEPA Method 8260B, to avoid false-positive reporting, with minimum detection levels of 15 µg/kg and 5 µg/L for soil andgroundwater respectively, and c) Results must be submitted to Ecology in both hard copyform and electronically in a spreadsheet format, preferably excel.
It is also recommended that six months (2 quarters) after the implementation of the above, allMTBE data submitted to the Department of Ecology should be compiled and analyzed. Theresults may then be used to assess the severity of the problem and to determine any furtherregulatory actions.

7
INTRODUCTION
Methyl tertiary-butyl ether (MTBE) is a volatile oxygen-containing organic compoundproduced from methanol and isobutylene. MTBE was initially used in gasoline as areplacement for lead. Since late 1970s, it has been used as an octane enhancer inconventional gasoline(1). Because it promotes a more complete combustion of gasoline,MTBE is used at higher concentrations, 10 to 15 percent by volume, as a fuel oxygenate toreduce levels of carbon monoxide and ozone in the air. In 1992, several Northeast and Mid-Atlantic states began using MTBE as fuel oxygenate to meet the requirements of The CleanAir Act Amendments of 1990(2). Large-scale use of MTBE in the nation actually began in1995 with the introduction of reformulated gasoline (RFG) which contains 11-15 percentMTBE by volume(3). Ethanol (EtOH) is another commonly used oxygenate in RFG, butMTBE is favored because of its low cost and other favorable characteristics(4).
Widespread use of this chemical has resulted in frequent detection of MTBE in groundwaterthroughout the United States. In Santa Monica, California, MTBE contamination has forcedseven drinking water wells, supplying 50% of the water for the city, to be removed fromservice(5). The majority of these contaminations comes from leaking underground storagetanks (LUST) and spills of gasoline during refining and distribution. The nationwide concernover MTBE is based on its physical and chemical characteristics, which are unlike those ofother gasoline constituents such as benzene, toluene, ethylbenzene and xylenes. Because ofits relatively high mobility and high solubility, MTBE in gasoline readily dissolves in water,up to 6300 parts per million(5), and can move rapidly through soil and groundwater. Avail-able kinetic information indicates that it is resistant to microbial decomposition and may bedifficult to biodegrade(6-10).
Toxicity studies on rats and mice have reported carcinogenic effects from exposure to MTBEthrough inhalation and oral dosage(11-15). Noncarcinogenic effects on both humans andanimals from exposure to MTBE have also been reported(16-20).
Although USEPA has tentatively classified MTBE as a possible human carcinogen, there isstill no national health-based drinking water standard. USEPA however, has issued a‘Drinking Water Advisory’ concentration range of 20-40 parts per billion (ppb), primarilybased on taste and odor considerations(21). While 12 states are waiting on USEPA to set aMaximum Contaminant Level (MCL) for MTBE in drinking water, most states, including theDistrict of Columbia, now have groundwater cleanup or action levels. Three states, includingWashington, have projected to establish cleanup levels by the end of the year 2000.
Though the use of MTBE is not prohibited, the chemical has not been used as an oxygenatein Washington as extensively as it has been in other states. There is only one documenteduse of MTBE as a fuel oxygenate in Washington; however, it is likely that the chemical hasbeen used in gasoline for other purposes in the state. In the King County area, MTBE levelsabove the lower limit of the USEPA’s Drinking Water Advisory of 20 ppb were found ingroundwater at some of the lust sites that the chemical was tested for in 1998. MTBE hadalso been identified at LUST sites in Vancouver (southwest region), Yakima (central region),and in the Spokane area (eastern region). In addition, low level MTBE contamination hadbeen associated with a release from the Yellowstone Pipeline near Spokane. The WashingtonState Department of Ecology has proposed a cleanup level of 20 ppb for groundwater.

8
Nevertheless, information on the occurrence and distribution of MTBE in the state’sgroundwater is limited to the results of the United States Geological Survey (USGS) studiesin the Puget Sound basin and Central Columbia Plateau, which show that most ambientshallow groundwater aquifers contain no MTBE(22). Similar information at LUST sites,major point sources of MTBE contamination, is practically unavailable.
METHOD OF STUDY
Determination of Study Area
Study areas were selected primarily based on LUST density. These areas also tend to be themost populated areas of the state. Distribution of LUST sites by regions is shown in bothTable 1 and Figure 1.
Table 1. Lust Site Distribution by Regions
Region # of Lust Sites %of Lust Sites # of Lust Sites % of Lust SitesWith Groundwater With Groundwater
Impacted ImpactedCentral 564 9.6 171 9Eastern 670 11.4 133 7Northwest 3130 53.1 1044 55Southwest 1534 26.0 545 29TOTAL 5898 100 1893 100
Sample Density Determination.
The number of samples per study area was determined based on the total number of LUSTsites with groundwater contamination within the area. Sample densities for the selected areasare presented in Table 2.
Table 2. Sample Density Determination
Area Sites/Area % of Total Sites Samples/Area
Seattle 320 49.5 20Bellevue 55 8.5 8Mill Creek/Bothell 15 2.3 1Kirkland 30 4.6 4Federal Way 17 2.6 4Auburn 33 5.1 4Port Orchard 11 1.7 2Kent 27 4.2 6Renton 12 1.9 4Spokane Area 27 4.2 2Whatcom County 50 7.7 7Clark County 50 7.7 8TOTALS 647 100.0 70

9
Figure 1. Distribution of Lust and Groundwater Impacted Lust Sites by Regions
Distribution of Groundwater Impacted Lust Sites by Regions
Central9% Eastern
7%
Northwest55%
Southwest29%
Lust Sites Distribution by Regions
Central10%
Eastern11%
Northwest53%
Southwest26%

10
The majority of study sites are located within the Seattle Metropolitan and King Countyurban areas. As expected, these urban areas also have the highest per county density ofLUST sites.
Site and Well Selection Strategy
Sites within each study area were randomly selected from a pool of prior-screened sites.Two basic criteria were used to guide the site screening process: a) Groundwater must beimpacted at the site, with data showing contamination, especially BTEX components, and b)There must be at least three existing monitoring wells so that local groundwater flow direc-tion can be determined. Ecology LUST database and files were utilized in these efforts.Two to three times the number of required sites for each study area were selected in anticipa-tion of possible denial of access by site owners. Following the review of selected site files,the most downgradient well at each site was selected.
Sampling Procedures
All groundwater samples were collected using low-flow (purging rate < 1 L /min) samplingtechniques. In order to minimize cross-contamination, dedicated Teflon tubing was installedto the mid-point of the well-screen length for each well. All wells were slowly purged usinga peristaltic pump until field parameters (i.e., pH, conductivity, and dissolved oxygen) hadstabilized. Deeper monitoring wells were purged and sampled using disposable bailers andslow-emptying VOA dispensers.
Forty (40) ml VOA sample vials with Teflon-lined septum were used for this study. Allsample vials were prepped with 0.1 ml 1:1 hydrochloric acid (HCl) as an acid preservative toprevent biodegradation. All sample vials were held at an angle during filling to minimizeaeration of water. The sample vials were slightly overfilled to create an inverted meniscus atthe top of the vial, capped, inverted, and tapped to check for air bubbles. All samples wereimmediately placed in coolers and chilled with ice to 4° C until submitted to the laboratory.Holding times were kept under 10 days.
As an added precaution, field personnel avoided self-refueling of cars on sampling days. Anew pair of latex gloves was used with the collection of each sample. All sampling eventswere conducted between January and June, 2000.
Analytical Procedure
All groundwater samples were analyzed for BTEX and MTBE using USEPA Method 8260A.Detection limits were 1 µg/L for benzene, toluene, ethylbenzene and MTBE, and 2 µg/L forxylenes. Sample analysis was performed by the USEPA/Ecology Environmental Laboratoryin Manchester, Washington.
Quality control samples included laboratory reagent blanks, trip blanks, and spike samples.As part of the quality assurance and control, five split samples were analyzed by CentrumLaboratory in California. Relative Percent Differences (RPD) were all less than 10.

11
RESULTS
Data Presentation
Complete analytical data for the study is presented in Table A-1 in Appendix A. Althoughpetroleum hydrocarbon compounds have been detected in all the selected study sites in thepast, eight sites had no detection for all the chemicals of concern during this sampling event.Simple statistical analysis of the data was therefore based on the sixty-two sites that showed,at least, one chemical of concern at or above its corresponding threshold limit. The reviseddata is presented in Table A-2. Threshold limits are 1 µg/L for benzene, toluene, ethylben-zene and MTBE, and 2 µg/L for xylenes.
It should be noted that in analyzing highly contaminated samples, higher quantitation limitswere often used. In such cases, interfering compounds mask relatively lower MTBEconcentrations. MTBE concentrations were consequently reported as less-than values. Con-trary to the usual practice of assigning concentration values equal to one-half the reporteddetection limits for statistical analysis, less-than values were considered as negative detectionin this study. Statistical determinations regarding MTBE are therefore conservative.
Results and Discussions
Monitoring wells from 70 LUST sites, the majority being from the Seattle/King Countyareas, were selected, sampled, and analyzed for BTEX and MTBE compounds. Of the 62sites, that showed contamination, 30 sites, or 48%, reported detectable levels of MTBE,while 26 sites, or 42%, had concentrations at or above a threshold limit of 1 µg/L. Inaddition, 24% reported MTBE concentrations above the proposed MTCA Method A cleanuplevel of 20 µg/L. The highest MTBE concentration reported was 7150 µg/L. The averageconcentration of all samples, which equaled or exceeded the threshold concentration of1 µg/L, was 441 µg/L, with a median of 13 µg/L.
Table 3. Statistical Summary of BTEX and MTBE Concentrations and Detections
B T E X MTBENumber of Detections(out of 62 contaminated Sites) 59 48 47 47 30Threshold Concentrations, mg/L 1 1 1 2 1Number of Detections >=Threshold Concentration 55 41 38 42 26Average Concentrations, mg/L 1992 3,943 657 2,251 441Maximum Concentrations, mg/L 43000 68,000 6,300 22,400 7,150Median Concentrations, mg/L 151 18 86 87 13

12
Figure 2. Overall Probabilities of Detection Above Threshold Concentrations and Maximum and Average Concentrations for BTEX and MTBE
0.90
0.660.61
0.68
0.42
0.00
0.20
0.40
0.60
0.80
1.00
B T E X MTBE
Overall Probability of Detection
43000
1992
68000
39436300
657
22400
2251
7150
441
0
10000
20000
30000
40000
50000
60000
70000
Con
cent
ratio
ns, µµ µµ
g/L
B T E X MTBE
Maximum and Average Concentrations
MaximumAverage

13
Detection rates for the BTEX components at or above threshold concentrations were morefrequent, occurring in 90%, 66%, 61%, and 68% for benzene, toluene, ethylbenzene andxylenes, respectively (Table 5). Average concentrations were higher, compared to that ofMTBE, at 1992 µg/L, 3943 µg/L, 657 µg/L, and 2251 µg/L for benzene, toluene, ethylben-zene and xylenes, respectively.
Correlation between concentrations of MTBE and BTEX components was evaluated toassess the relationship between the occurrence and magnitude of the chemicals (Table 5).While a strong correlation was observed between benzene, toluene, ethylbenzene, andxylenes (ρ = 0.83-0.97), benzene and MTBE concentrations showed essentially noperceptible correlation (ρ = 0.26).
Table 4. Threshold Concentrations and Overall Probabilities of Detection Above Threshold Concentrations of Benzene, Toluene, Ethylbenzene, Xylenes and MTBE (62 of 70 Sites showing contamination)
Threshold Total Detections Probability ofCompound Concentration Above Threshold Detection Above
(µµµµg/L) Concentration ThresholdBenzene 1 56 0.90Toluene 1 41 0.66
Ethylbenzene 1 38 0.61Xylenes 2 42 0.68MTBE 1 26 0.42
These results demonstrate that while the presence of benzene may indicate the occurrence oftoluene, ethylbenzene and xylenes, it is not predictive of the presence of MTBE at a givensite.
Table 5. Concentration Correlation Coefficients Between Benzene, Toluene,Ethylbenzene, Xylenes, and MTBE
Benzene Toluene Ethylbenzene Xylenes MTBEBenzene 1.00 0.98 0.97 0.95 0.96Toluene 0.97 1.00 0.92 0.83 0.54Ethylbenzene 0.83 0.85 1.00 0.83 0.42Xylenes 0.88 0.90 0.89 1.00 0.54MTBE 0.26 -0.06 -0.10 0.12 1.00
In addition to evaluating correlation between concentrations, the nature of co-occurrence ofbenzene and MTBE at individual sites was assessed by examining conditional probabilitiesof detection above the stated threshold concentrations (Table 6).
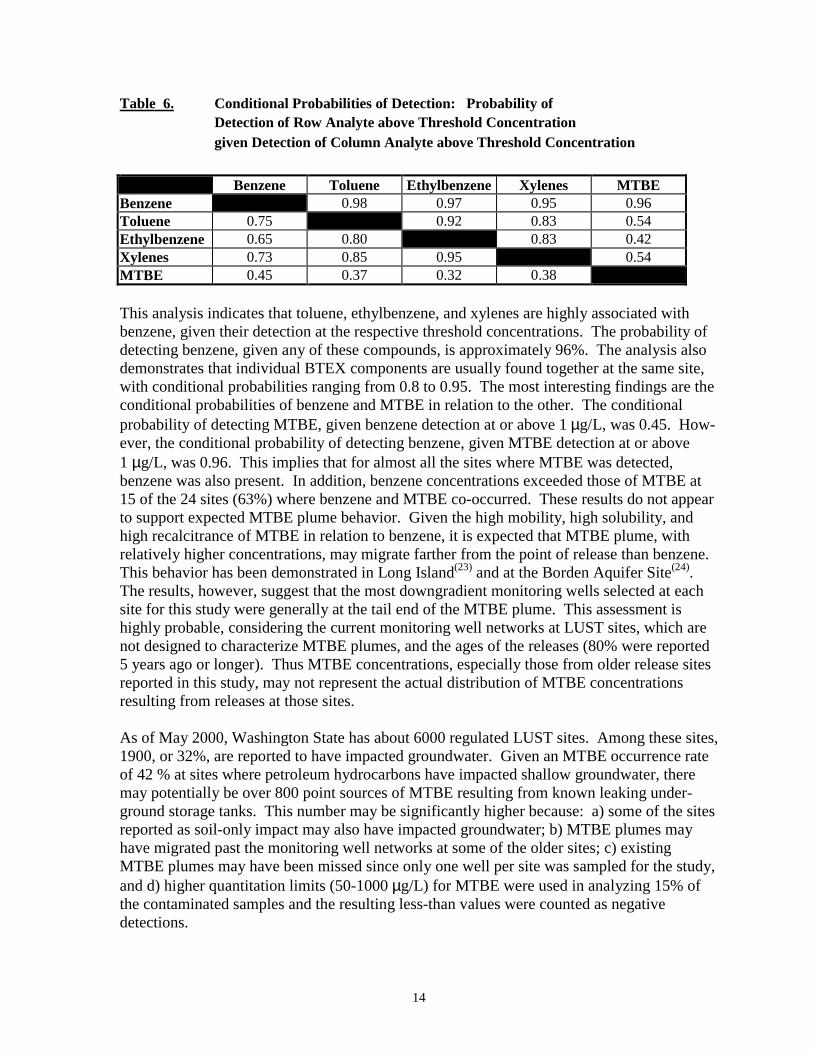
14
Table 6. Conditional Probabilities of Detection: Probability ofDetection of Row Analyte above Threshold Concentrationgiven Detection of Column Analyte above Threshold Concentration
Benzene Toluene Ethylbenzene Xylenes MTBEBenzene 0.98 0.97 0.95 0.96Toluene 0.75 0.92 0.83 0.54Ethylbenzene 0.65 0.80 0.83 0.42Xylenes 0.73 0.85 0.95 0.54MTBE 0.45 0.37 0.32 0.38
This analysis indicates that toluene, ethylbenzene, and xylenes are highly associated withbenzene, given their detection at the respective threshold concentrations. The probability ofdetecting benzene, given any of these compounds, is approximately 96%. The analysis alsodemonstrates that individual BTEX components are usually found together at the same site,with conditional probabilities ranging from 0.8 to 0.95. The most interesting findings are theconditional probabilities of benzene and MTBE in relation to the other. The conditionalprobability of detecting MTBE, given benzene detection at or above 1 µg/L, was 0.45. How-ever, the conditional probability of detecting benzene, given MTBE detection at or above1 µg/L, was 0.96. This implies that for almost all the sites where MTBE was detected,benzene was also present. In addition, benzene concentrations exceeded those of MTBE at15 of the 24 sites (63%) where benzene and MTBE co-occurred. These results do not appearto support expected MTBE plume behavior. Given the high mobility, high solubility, andhigh recalcitrance of MTBE in relation to benzene, it is expected that MTBE plume, withrelatively higher concentrations, may migrate farther from the point of release than benzene.This behavior has been demonstrated in Long Island(23) and at the Borden Aquifer Site(24).The results, however, suggest that the most downgradient monitoring wells selected at eachsite for this study were generally at the tail end of the MTBE plume. This assessment ishighly probable, considering the current monitoring well networks at LUST sites, which arenot designed to characterize MTBE plumes, and the ages of the releases (80% were reported5 years ago or longer). Thus MTBE concentrations, especially those from older release sitesreported in this study, may not represent the actual distribution of MTBE concentrationsresulting from releases at those sites.
As of May 2000, Washington State has about 6000 regulated LUST sites. Among these sites,1900, or 32%, are reported to have impacted groundwater. Given an MTBE occurrence rateof 42 % at sites where petroleum hydrocarbons have impacted shallow groundwater, theremay potentially be over 800 point sources of MTBE resulting from known leaking under-ground storage tanks. This number may be significantly higher because: a) some of the sitesreported as soil-only impact may also have impacted groundwater; b) MTBE plumes mayhave migrated past the monitoring well networks at some of the older sites; c) existingMTBE plumes may have been missed since only one well per site was sampled for the study,and d) higher quantitation limits (50-1000 µg/L) for MTBE were used in analyzing 15% ofthe contaminated samples and the resulting less-than values were counted as negativedetections.

15
MTBE concentrations reported in this study are relatively low compared to reported values instates like California(25), Iowa(26), and Idaho(27) where concentrations above 15,000 µg/L havebeen reported. When interpreting or comparing MTBE concentrations of groundwater atLUST sites, several factors need to be considered. Given the high solubility and highmobility of MTBE, and spatially limited monitoring well networks at LUST sites, date ofrelease becomes the most important factor. Monitoring well networks at LUST sites arelikely to adequately characterize MTBE plumes from a relatively new release. This isevident in the case of Site No. 61 and Site No. 62, where release reporting dates and MTBEconcentrations are 1998; 5150 µg/L and 1999; 7150 µg/L, respectively. MTBE concentra-tions also exceed those of benzene in both cases. This trend was not generally observed inthe data form the older sites. Furthermore, only one of five older sites, which havepreviously reported MTBE contamination in 1998, showed any detection during this study.
The generally low MTBE concentrations observed in this study may be due to the age of thereleases at the selected sites (80% were reported between 1995 and 1989). These concentra-tions may represent MTBE concentrations at the tail end of plumes as suggested by theconditional probability analysis. They do not therefore necessarily minimize potential risksposed to drinking water sources from LUST sites.
CONCLUSIONS
MTBE was detected above a threshold concentration of 1 µg/L in groundwater atapproximately 42% of LUST sites tested. Nearly 25% of these sites exceeded the proposedMTCA Method A cleanup standard of 20 µg/L. These percentages indicate that there may bepotentially over 800 point sources of MTBE resulting from known LUST sites in the state.This number may be significantly higher because: a) some of the sites reported as soil-onlyimpact may also have impacted groundwater; b) MTBE plumes may have migrated past themonitoring well networks at some of the older sites; c) existing MTBE plumes may havebeen missed since only one well per site was sampled for the study, and d) higher quantita-tion limits (50-1000 µg/L) for MTBE were used in analyzing 15% of the contaminatedsamples, and the resulting less-than values were counted as negative detections.
MTBE concentrations reported were generally low. The low concentrations, however, do notminimize the potential risk to drinking water sources. Given the limited size of most LUSTsites, and the high solubility, mobility, and recalcitrance of MTBE, many MTBE plumes maycompletely migrate off-site without degradation, and may eventually attenuate throughdilution with their masses remaining practically constant. MTBE masses from multipleplumes in high LUST density areas therefore, may cumulatively impact a major drinkingwater source. This means water sources in regions with high LUST density, like the PugetSound area, are at the greatest risk. In addition, analysis of the data in relation to thepresence and magnitude of benzene concentrations suggests the possibility of higher MTBEconcentrations.
Data collected was insufficient to ascertain the severity of potential impact to drinking watersources from these sites. Nevertheless, it clearly shows that potential risks exist. Effortsshould therefore be made to ensure that MTBE does not cause harm to public health or theenvironment.

16
Based on the findings of this study, the following recommendations are being submitted forimmediate consideration:
• Testing for MTBE should be included in all LUST site investigations and monitoringactivities, including tank closures. Possible exceptions may be given when, after initialassessment of both soil and groundwater, it is determined that MTBE is not present in thesubsurface.
• Testing for MTBE should be performed using USEPA Method 8260B, to avoid false-positive reporting, with minimum detection levels of 15 µg/kg and 5 µg/L, for soil andgroundwater, respectively.
• Results must be submitted to Ecology in both hard copy form and electronically(spreadsheet format, preferably Excel).
It is also recommended that six months (2 quarters) after implementation of the above, allMTBE data submitted to the Department of Ecology should be compiled and analyzed. Theresults may then be used to assess the severity of the problem and to determine any furtherregulatory actions.
References
(1) U.S. Environmental Protection Agency. Use and Distribution of MTBE and Ethanol.Office of Underground Storage Tanks: Washington DC, January 1998, EPA 510-F-97-016
(2) Clean Air Act Amendments of 1990, Title II, Part A, Section 211(3) Wiggleswort, T. Chem. Ind. 10: 408, 1999(4) Zogorski, J.S., et al. Fuel Oxygenates and Water Quality, Interagency Assessment of
Oxygenated Fuels. Washington D.C., Office of Science Technology Policy,Executive Office of the President. 20, 1997
(5) Johnson, R., et al. MTBE: To What Extent Will Past Releases ContaminateCommunity Water Supply Wells? Environ. Sci. & Techn. News. 3A-9A, May 1, 2000
(6) Fujiwara, T.; Kinoshita, T.; et al. 1984. Biodegradation and bioconcentration of Alkylethers. Yukagaku 33: 111-114(7) Jensen, H.M. and E Arvin. Contaminated Soils '90. F. Arndt, M. Hinsenveld and W, I. van den Brink, Eds; Kluwer Academic Publishers: Dordrecht, The Netherlands, 445- 448, 1990(8) Mormile, M.R., S. Liu, and J.M. Sulflita. Anaerobic biodegradation of gasoline oxygenates: extrapolation of information to multiple sites and redox conditions.
Environ. Sci. Tech., 28:1727-1732, 1994(9) Suflita, J.M. and M.K. Mormile. Anaerobic biodegradation of known and potential
gasoline oxygenates in the terrestrial subsurface. Environ. Sci. Tech. 27: 976-978,1993
(10) Yeh, C.K. and J.T. Novak. Anaerobic Biodegradation of Gasoline Oxygenates inSoils. Water Environmental Research 66(5): 744-752, 1994

17
(11) Belpoggi, F., Softriff, M., Maltoni, C. Methyl tertiary-Butyl Ether (MtBE) - aGasoline Additive - Muses Testicular and Lymphohaematopoietic Cancers in Rats.Toxicol. Ind. Health. 11(2): 119-149. 1995
(12) Belpoggi, F., Softriff, M., Filippini, F., Maltoni, C., 1997. Results of Long-termExperimental Studies on the Carcinogenicity of Methyl tertiary-Butyl Ether. AnnalsNY Acad. Sci. 837:77-95
(13) Belpoggi, F., Soffriti, M., Maltoni, C. Pathological Characterization of TesticularTumors and Lymphomas-Leukaemias, and of Their Precursors Observed in Sprague-Dawley Rats Exposed to Methyl tertiary-Butyl Ether (MTBE). Eur. J. Oncol.3(3):201-206. 1998
(14) Bird, M.G., Burleigh-Flayer, H.D., Chun, J.S., Douglas, J.F., Kneiss, J.J., Andrews,.L.S., 1997
(15) Chun, J.S., Burleigh-Flayer, H.D., Kintigh, W.J. Methyl tertiary-butyl ether: vaporinhalation oncogenicity study in Fisher 344 rats. Bushy Run Research Center ReportNo. 91N0013B. November 13. Union Carbide Chemicals and Plastics Company,Inc., submitted to the U.S. EPA under TSA Section 4 Testing Consent Order 40 CFR799.5000 with cover letter dated November 19, 1992. EPA/OPTS#442098. Export,PA: Bushy Run Research Center
(16) Tyl, R.W., Neeper-Bradley, T.L. Developmental toxicity study on inhaledMethyl tertiary-butyl ether (MTBE) in CD-1 mice. Final Report. July 20. Bushy RunResearch Center Report No. 51-266. Submitted to the U.S. EPA with cover letterdated July 26, 1989. TSCATS/403186. EPA/OTS/M0-8913432. No. FYI-OTS-0889-0689. Export, PA: Bushy Run Research Center
(17) Moser, G.J., Wolf, D.C., Sar, M., Gaido, K.W., Janszen, D., Goldsworthy, T.L.,Methyl tertiary-Butyl Ether-Induced Endocrine Alterations in Mice Are Not MediatedThrough The Estrogen Receptor. Toxicol. Sci. 41(1): 77-87. 1998
(18) Daughtrey, W.C., Gill, M.W., Pritts, I.M., Douglas, J.F., Kneiss, J.l., Andrews, L.S.Nenrotoxicological Evaluation of Methyl tertiary-Butyl Ether in Rats. J. Appl. Toxicol.17(S1) S57-S64. 1997
(19) Bevan, C., Tyl, R.W., Neeper-Bradley, T.L, Fischer, L.C., pansen, R.D., Douglas, J.F.,Andrews, L.S.,. Developmental Toxicity Evaluation of Methyl tertiary-Butyl Ether (MTBE) byInhalation in Mice and Rabbits. J. Appl. Toxicol. 17(S1): S21-S29. 1997b
(20) Begley, Ronald, and Rotman, David. Health Complaints Fuel Federal Concerns Over MTBE.Chemical Week. (152) 10, 7. 1993
(21) U.S. Environmental Protection Agency. Drinking Water Advisory- ConsumerAcceptability Advice and Health Effects Analysis on Methyl Tertiary-Butyl Ether.Washington, D.C., Office of Water, EPA-822-F-97-009. 1997
(22) Ebbert, Jim., Chief Puget Sound Basin NAWQA, USGS, Personal Communication,2000
(23) Weaver, J.W., Haas, J.E., Sosik, C.B. Characteristics of Gasoline Releases in theWater Table Aquifer of Long Island. Presented at the National Ground WaterAssociation/American Petroleum Institute conference, 1999 Petroleum HydrocarbonsConference and Exposition, Nov.17-19, Houston, Texas
(24) Hubbard, C.E.; Barker, J.F.; O'Hannesin, S.F.; Vandegriendt, M.; and R.W. Gillham.Transport and Fate of Dissolved Methanol Methyl-Tertiary-Butyl-Ether, andMonoaromatic Hydrocarbons in a Shallow Sand Aquifer. AP1 Publication Number4601; American Petroleum Institute, Health and Environmental Science Department:Washington, D.C., 1994

18
(25) Happel, A.M., Bechenbach, E.H, and R.U. Halden. An Evaluation of MTBEImpacts to California Groundwater Resources. Report submitted to the CaliforniaState Water Resources Control Board, 43-63, June 11, 1998
(26) Iowa Department of Natural Resources, Underground Storage Tank Section.Methyl tertiary-Butyl Ether (MTBE) Occurrence in Iowa. A Report for the 2000Session of the Seventy-Eighth General Assembly. February 2000
(27) Idaho Division of Environmental Quality, Watershed and Aquifer protectionBureau. An Evaluation of Methyl Tert-Butyl Ether (MTBE) in Groundwater atLeaking Underground Storage Tank Sites. Groundwater Quality Report, February,1999

19
APPENDIX A.

20
Table A-1. MTBE and BTEX Groundwater Concentrations for all Sampled Sites by Cities.
SiteNo.
Latitude Longitude City Site ID B T E X MTBE Release
Degrees Degrees ug/l ug/l ug/l ug/l ug/l ReportDate
1 47 36' 36" N 122 12' 23" W Bellevue 5100 5720 13,900 2,350 10,200 <500 02/15/912 47 35' 43" N 122 11' 51" W Bellevue 5258 7530 18,400 3,330 16,200 <1000 05/03/933 47 37' 2" N 122 10' 52" W Bellevue 100678 26500 40,400 3,620 16,200 <1000 06/07/904 47 37' 3" N 122 12' 14" W Bellevue 9557 1560 1,330 314 1,080 8 11/22/895 47 37' 51" N 122 9' 13" W Bellevue 8679 409 29 145 215 0.45 11/30/946 47 37' 2" N 122 11" 5" W Bellevue 8739 2 0.25 0.95 3.7 16 08/09/897 47 36' 30" N 122 8' 35" W Bellevue 9561 194 2 3 0.2 0.14 11/09/908 47 36' 4" N 122 13' 36" W Bellevue 9560 59 8 130 205 <5 08/07/89
1 47 42' 31" N 122 10' 38" W Kirkland 6895 44 2 <5 <10 3.3 08/17/902 47 42' 13" N 122 10' 36" W Kirkland 9556 43 6 407 72 0.6 12/23/913 47 42' 14" N 122 12' 37" W Kirkland 10144 34 26 374 1540 <10 01/13/934 47 40' 45" N 122 10' 52" W Kirkland 10142 358 1.6 44 115 <1 01/15/93
1 47 18' 1" N 122 13' 21" W Auburn 6900 <1 <1 <1 <2 <1 04/20/902 47 23' 16" N 122 13' 50" W Kent 10145 4,530 3,540 984 3,690 <1000 04/20/943 47 19' 14" N 122 17' 8" W Auburn 9510 2.9 2.8 2.3 13 <1 04/05/914 47 20' 35" N 122 13' 19" W Auburn 6888 692 <50 <50 <100 126 10/10/955 47 19' 35" N 122 13' 16" W Auburn 97606 330 669 1850 5950 <100 12/04/90
1 47 32' 2" N 122 34' 39" W Port Orchard 10883 34 57 32 51 <1 01/31/892 47 31' 52" N 122 40' 8" W Port Orchard 4012 0.5 0.5 0.5 1 0.5 01/29/98
1 48 43' 53" N 122 28' 26" W Bellingham 8394 <1 <1 <1 <1 <1 08/19/982 48 44' 41" N 122 27' 51" W Bellingham 10850 <1 <1 <1 <2 <1 09/03/973 48 57' 48" N 122 43' 47" W Blaine 435 <1 <1 <1 <2 <1 06/07/914 48 59' 53" N 122 44' 16" W Blaine 8472 200 16 <50 <50 455 06/21/905 48 53' 31" N 122 29' 8" W Linden 1447 3.2 38 243 639 1 01/25/906 48 50' 37" N 122 17' 17" W Everson 9910 7 1.2 0.4 2.3 <1 01/05/957 48 59' 13" N 123 4' 2" W Point Robert 100646 1260 1380 324 1950 105 03/29/94
1 47 37' 6" N 122 21' 12" W Seattle 8421 1.3 0.55 0.35 0.85 37 06/21/892 47 31' 12" N 122 15' 49" W Seattle 8701 13 <1 <1 <2 <1 06/26/893 47 40' 51" N 122 15' 48" W Seattle 8668 265 1.4 4.4 2.8 <1 07/24/954 47 40' 23" N 122 23' 15" W Seattle 8666 1 <1 <1 <2 1 12/01/955 47 32' 16" N 122 16' 54" W Seattle 97593 264 4.6 86 3.8 <1 09/09/986 47 35' 1" N 122 19' 43" W Seattle 8746 6.7 <10 0.72 <20 364 02/10/937 47 42' 18" N 122 20' 39" W Seattle 8776 <1 <1 <1 <2 <1 06/08/898 47 42' 29" N 122 19' 2" W Seattle 1498 6.2 <5 <5 <10 128 10/02/899 47 33' 45" N 122 22' 48" W Seattle 10140 503 31 164 42 <100 01/13/93
10 47 39' 47" N 122 18' 50" w Seattle 5046 176 66 44 102 <5 01/04/9011 47 38' 19" N 122 18' 5" W Seattle 403305 0.17 <1 <1 0.22 <1 01/21/9712 47 31' 2" N 122 22' 10" W Seattle 9516 14 0.27 1.1 <2 <1 10/04/9113 47 42' 30" N 122 19' 53" W Seattle 9563 170 67 3860 1260 0.61 10/07/9114 47 29' 7" N 122 15' 20" W Seattle 9554 676 1740 310 1020 <10 10/22/9115 47 41' 23" N 122 20' 39" W Seattle 9502 <1 <1 <1 26 <1 11/27/9116 47 28' 16" N 122 20' 3" W Seattle 9574 550 1 0.94 2 <1 04/13/9217 47 32' 16" N 122 16' 54" W Seattle 9524 234 46 216 47 <100 11/27/91

21
Table A-1. MTBE and BTEX Groundwater Concentrations for all Sampled Sites by Cities.
SiteNo.
Latitude Longitude City Site ID B T E X MTBE Release
Degrees Degrees ug/l Ug/l ug/l ug/l ug/l ReportDate
18 47 37' 26" N 122 20' 17" W Seattle 8463 0.12 0.32 <1 <2 0.22 05/01/8019 47 34' 22" N 122 20' 1" W Seattle 8459 33 <5 <5 3.4 9.4 09/12/9020 47 45' 28" N 122 18' 32" W Seattle 9577 658 28 110 162 164 08/18/89
1 47 30' 38" N 122 17' 35" W Tukwila 101796 85 <10 <10 <10 22 03/28/912 47 28' 12" N 122 13' 14" W Renton 5256 9.5 <1 <1 <2 31 04/05/913 47 28' 30" N 122 12' 54" W Renton 6890 185 1.2 0.57 4.5 4.6 04/12/914 47 30' 13" N 122 9' 48" W Renton 9546 0.85 <1 2.2 4.2 3.4 11/14/91
1 47 23' 12" N 122 9' 58" W Kent 8696 9.8 18 2.9 22 <1 01/10/922 47 23' 17" N 122 14' 52" W Kent 8693 <1 1.2 0.1 0.6 <1 06/28/963 47 22' 39" N 122 13' 51" W Kent 8709 10 0.9 8.3 12 <1 12/14/954 47 22' 21" N 122 12' 7" W Kent 8748 28 1.3 5.4 0.91 6.9 02/23/895 47 22' 5" N 122 18' 13" W Kent 200791 63 0.4 0.34 2 47 07/28/89
1 47 18' 59" N 122 18' 46" W Federal Way 8779 93 168 1020 3640 <50 06/24/932 47 18' 54" N 122 18' 8" W Federal Way 10147 19 2 0.9 2.3 <1 04/15/923 47 18' 7" N 122 21' 37" W Federal Way 10148 1970 1310 231 785 <1 06/06/944 47 17' 23" N 122 18' 59" W Federal Way 5080 5620 13400 1620 8090 <100 05/02/89
1 47 49' 15" N 122 18' 56" W Lynnwood 8745 43000 68000 6300 22400 <100 12/15/89
1 45 40' 27" N 122 36' 10" W Vancouver 10175 5680 6470 927 6540 5.5 07/22/932 45 43' 4" N 122 39' 27" W Vancouver 2157 340 7.5 60 1900 36 10/03/913 45 41' 9" N 122 37' 29" W Vancouver 5988 1.9 1.6 41 120 112 05/09/954 45 54' 27" N 122 44' 41" W Woodland 5981 4000 22000 1700 3700 113 11/03/975 45 40' 55" N 122 39' 41" W Hazel Dell 101491 <1 <1 <1 <2 0.3 03/18/966 45 43' 0" N 122 39' 6" W Hazel Dell 200274 <1 <1 <1 <2 <1 07/20/887 45 40' 42" N 122 39' 56" W Hazel Dell 5095 <1 <1 <1 <2 <1 06/09/908 45 40' 43" N 122 39' 42" W Hazel Dell 10160 11 0.4 10 3.6 1.5 11/01/86
1 47 26' 59" N 117 7' 55"W Rockford(1) 11600 151 0.25 0.25 0.5 5150 02/16/992 47 39' 14" N 118 8' 56"W Davenport(1) 6678 3170 33.1 12.5 25 7150 11/16/98
1. Sampling independently conducted by site owner

22
Table A-2. MTBE and BTEX Groundwater Concentrations for Contaminated Sites.
Site No. Latitude Longitude City Site ID B T E X MTBE ReleaseDegrees Degrees ug/l ug/l ug/l ug/l ug/l Report
Date
1 47 36' 36" N 122 12' 23" W Bellevue 5100 5720 13,900 2,350 10,200 <500 02/15/912 47 35' 43" N 122 11' 51" W Bellevue 5258 7530 18,400 3,330 16,200 <1000 05/03/933 47 37' 2" N 122 10' 52" W Bellevue 100678 26500 40,400 3,620 16,200 <1000 06/07/904 47 37' 3" N 122 12' 14" W Bellevue 9557 1560 1,330 314 1,080 8 11/22/895 47 37' 51" N 122 9' 13" W Bellevue 8679 409 29 145 215 0.45 11/30/946 47 37' 2" N 122 11" 5" W Bellevue 8739 2 0.25 0.95 3.7 16 08/09/897 47 36' 30" N 122 8' 35" W Bellevue 9561 194 2 3 0.2 0.14 11/09/908 47 36' 4" N 122 13' 36" W Bellevue 9560 59 8 130 205 <5 08/07/899 47 42' 31" N 122 10' 38" W Kirkland 6895 44 2 <5 <10 3.3 08/17/90
10 47 42' 13" N 122 10' 36" W Kirkland 9556 43 6 407 72 0.6 12/23/9111 47 42' 14" N 122 12' 37" W Kirkland 10144 34 26 374 1540 <10 01/13/9312 47 40' 45" N 122 10' 52" W Kirkland 10142 358 1.6 44 115 <1 01/15/93
13 47 23' 16" N 122 13' 50" W Kent 10145 4530 3,540 984 3,690 <1000 04/20/9414 47 19' 14" N 122 17' 8" W Auburn 9510 2.9 2.8 2.3 13 <1 04/05/9115 47 20' 35" N 122 13' 19" W Auburn 6888 692 <50 <50 <100 126 10/10/9516 47 19' 35" N 122 13' 16" W Auburn 97606 330 669 1850 5950 <100 12/04/9017 47 32' 2" N 122 34' 39" W Port Orchard 10883 34 57 32 51 <1 01/31/8918 48 59' 53" N 122 44' 16" W Blaine 8472 200 16 <50 <50 455 06/21/9019 48 53' 31" N 122 29' 8" W Linden 1447 3.2 38 243 639 1 01/25/9020 48 50' 37" N 122 17' 17" W Everson 9910 7 1.2 0.4 2.3 <1 01/05/9521 48 59' 13" N 123 4' 2" W Point Robert 100646 1260 1380 324 1950 105 03/29/9422 47 37' 6" N 122 21' 12" W Seattle 8421 1.3 0.55 0.35 0.85 37 06/21/8923 47 31' 12" N 122 15' 49" W Seattle 8701 13 <1 <1 <2 <1 06/26/8924 47 40' 51" N 122 15' 48" W Seattle 8668 265 1.4 4.4 2.8 <1 07/24/9525 47 40' 23" N 122 23' 15" W Seattle 8666 0.8 <1 <1 <2 1 12/01/9526 47 32' 16" N 122 16' 54" W Seattle 97593 264 4.6 86 3.8 <1 09/09/9827 47 35' 1" N 122 19' 43" W Seattle 8746 7 <10 0.72 <20 364 02/10/9328 47 42' 29" N 122 19' 2" W Seattle 1498 6 <5 <5 <10 128 10/02/8929 47 33' 45" N 122 22' 48" W Seattle 10140 503 31 164 42 <100 01/13/9330 47 39' 47" N 122 18' 50" w Seattle 5046 176 66 44 102 <5 01/04/9031 47 38' 19" N 122 18' 5" W Seattle 403305 0.2 <1 <1 0.22 <1 01/21/9732 47 31' 2" N 122 22' 10" W Seattle 9516 14 0.27 1.1 <2 <1 10/04/9133 47 42' 30" N 122 19' 53" W Seattle 9563 170 67 3860 1260 0.61 10/07/9134 47 29' 7" N 122 15' 20" W Seattle 9554 676 1740 310 1020 <10 10/22/9135 47 41' 23" N 122 20' 39" W Seattle 9502 <1 <1 <1 26 <1 11/27/9136 47 28' 16" N 122 20' 3" W Seattle 9574 550 1 0.94 2 <1 04/13/9237 47 32' 16" N 122 16' 54" W Seattle 9524 234 46 216 47 <100 11/27/9138 47 37' 26" N 122 20' 17" W Seattle 8463 0.1 0.32 <1 <2 0.22 05/01/8039 47 34' 22" N 122 20' 1" W Seattle 8459 33 <5 <5 3.4 9.4 09/12/9040 47 45' 28" N 122 18' 32" W Seattle 9577 658 28 110 162 164 08/18/8941 47 30' 38" N 122 17' 35" W Tukwila 101796 85 <10 <10 <10 22 03/28/9142 47 28' 12" N 122 13' 14" W Renton 5256 9.5 <1 <1 <2 31 04/05/9143 47 28' 30" N 122 12' 54" W Renton 6890 185 1.2 0.57 4.5 4.6 04/12/9144 47 30' 13" N 122 9' 48" W Renton 9546 0.9 <1 2.2 4.2 3.4 11/14/9145 47 23' 12" N 122 9' 58" W Kent 8696 10 18 2.9 22 <1 01/10/92

23
Table A-2. MTBE and BTEX Groundwater Concentrations for Contaminated Sites.
Site No. Latitude Longitude City Site ID B T E X MTBE ReleaseDegrees Degrees ug/l ug/l ug/l ug/l ug/l Report
Date
46 47 23' 17" N 122 14' 52" W Kent 8693 <1 1.2 0.1 0.6 <1 06/28/9647 47 22' 39" N 122 13' 51" W Kent 8709 10 0.9 8.3 12 <1 12/14/9548 47 22' 21" N 122 12' 7" W Kent 8748 28 1.3 5.4 0.91 6.9 02/23/8949 47 22' 5" N 122 18' 13" W Kent 200791 63 0.4 0.34 2 47 07/28/8950 47 18' 59" N 122 18' 46" W Federal Way 8779 93 168 1020 3640 <50 06/24/9351 47 18' 54" N 122 18' 8" W Federal Way 10147 19 2 0.9 2.3 <1 04/15/9252 47 18' 7" N 122 21' 37" W Federal Way 10148 1970 1310 231 785 <1 06/06/9453 47 17' 23" N 122 18' 59" W Federal Way 5080 5620 13400 1620 8090 <100 05/02/8954 47 49' 15" N 122 18' 56" W Lynnwood 8745 43000 68000 6300 22400 <100 12/15/8955 45 40' 27" N 122 36' 10" W Vancouver 10175 5680 6470 927 6540 5.5 07/22/9356 45 43' 4" N 122 39' 27" W Vancouver 2157 340 7.5 60 1900 36 10/03/9157 45 41' 9" N 122 37' 29" W Vancouver 5988 2 1.6 41 120 112 05/09/9558 45 54' 27" N 122 44' 41" W Woodland 5981 4000 22000 1700 3700 113 11/03/9759 45 40' 55" N 122 39' 41" W Hazel Dell 101491 <1 <1 <1 <2 0.3 03/18/9660 45 40' 43" N 122 39' 42" W Hazel Dell 10160 11 0.4 10 3.6 1.5 11/01/8661 47 26' 59" N 117 7' 55"W Rockford(1) 11600 151 0.25 0.25 0.5 5150 02/16/9962 47 39' 14" N 118 8' 56"W Davenport(1) 6678 3170 33.1 12.5 25 7150 11/16/98
1. Sampling conducted independently by site owner