ami market opportunities & challenges in asia pacific (2010 global electric power tech)
TRANSCRIPT

AMI Market Opportunities & Challenges in Asia Pacific
Presented atWorld Smart Grids Seminar 2010
Seoul, South Korea
19 May 2010
Presented bySubbu BettadapuraAssociate Director – Energy & PowerFrost & Sullivan

22
AMI Technology Trends & Evolution
Agenda
1
2
3
APAC Market Size and Cost breakdown
Key Industry Challenges4
5
AMI Benefits & Features
AMI Introduction and Value Chain
Key Growth Countries and Market Dynamics6

3
Utility Metering
Utility
Legacy System vs AMI Systems
Consumer
Electricity Meter
Cannot communicate
to/from consumer
One-way communication
Utility
AMI
RF MESHPLCBPL
RF MESHPLCBPL
MDMS
Utility MDMS WAN LAN MeteringConsumer
CDMAGSM
CDMAGSM
HAN
In home Display
Two-way communication
Smart Meter

4
AMI Value chain
MDMS
Process and store meter dataMajor PlayersItron, eMeter, SAP
Wide Area Network (WAN) Public/Private
Network
Local Area Network (LAN)
RF mesh, PLC, BPL, WiMax, GPRS
Home Area
Network (HAN) Zigbee, Home plug
WiFi, Z-Wave, Wavenis,
DigitalstromMajor Players
GridConnect, Freescale, MicroChip
Smart Meter
Data collection & storage
Major PlayersGE, Landis+Gyr, PRI,
Elster
System Integrators
Consultants
Installation Contractors
Source: Frost & Sullivan
Major PlayersItron, Elster, SSN, EKA
Systems, Trilliant
Meter Vendors Communication Vendors IT Vendors

5
AMI Technology UpdateIT systems
(GPRS, GSM, EDGE,RF,Power line)
NetworkCommunication
& application servers
Data Management Server( Outage,
Tariffs, Geography)
Meter Management Meter Data Management
Source: Frost & Sullivan

6
Advanced Metering Benefits
Reduced meter reading errors
Reduced billing errorsReduced meter reading costs
Prepayment option
Physical privacy for consumers
Half Hourly usage data
Reduced Energy bills

7
AMI Operational Benefits
Avoided meter reading costs and field services are the two main benefits of AMI
Source: Rochester Gas and Electric Corporation, New York State Electric and Gas Company

8
AMI Features
22
33
44
55
66
77
11
Remote reading and also ability to manually readRemote reading and also ability to manually read
Remote connection and disconnectionRemote connection and disconnection
Two-way communication and Communication path to in-home displayTwo-way communication and Communication path to in-home display
Visual display on meterVisual display on meter
Meter settings reconfiguration (remote)Meter settings reconfiguration (remote)
Tamper detectionTamper detection
Record at least Hourly Usage of dataRecord at least Hourly Usage of data
88
99
1010
1111
Outage notificationOutage notification
Prepayment optionPrepayment option
Time of useTime of use
Load ControlLoad Control
1212 Measurement of active/reactive energy flow (To allow for distributed
generation)
Measurement of active/reactive energy flow (To allow for distributed
generation)

9
2011 2012 20132010 2014
AMI Technology Evolution
2015 2016 2017 2018 2019 2020
Source: Frost & Sullivan.Source: Frost & Sullivan.
Remote Meter Configuration
In-Home Display
Time of use
Demand Response
Energy Management
Systems
Real time communication
Outage Notification
Remote Connect/ Disconnect
Remote meter reading

10
AMI – Communication Technology Options
Communication Options
Communication Options
GPRS, GSM, SMS, WIMAX, UMTS
GPRS, GSM, SMS, WIMAX, UMTS
RF Mesh NetworkRF Mesh Network WIFI, DSLWIFI, DSLPower Line
CarriersPower Line
Carriers
Communication is a vital factor for smart meters
Source: Frost & Sullivan
Wavenis Open
Source Alliance

11
Technology Trends – Communication Technology Penetration
AMI Technologies
AMI Technologies
WiMAXWiMAX
GPRSGPRS
RFRF
2010 2015 2020
PLCPLC
Low Medium High
Source: Frost & Sullivan

12
Lack of Standard Protocols and Interoperability
Initial upfront cost and cost recovery
Advanced Metering - Industry Challenges
Risk on information security clouding consumers judgment
Fear of losing power over load control by the utilities
Source: Frost & Sullivan
Issue of ”Stranded Assets” and evolving technology

13
AMI – Roll out Cost breakdown for Projects
Smart Meter and its installation form the majority of cost involved in AMI implementation
Source: Frost & Sullivan

14
Asia Pacific AMI Market Size
• Total APAC AMI market is expected to generate a cumulative demand of 41 million meter units by 2017
• The market is estimated to generate revenues of about US$12.5 billion from 2009 through 2017
• The market is estimated to have a CAGR of 69.32% for the period from 2009-2017
• The growth will be fuelled by AMI activity in Australia, New Zealand, South Korea, Japan and Taiwan
Source: Frost & Sullivan
Asia Pacific AMI Market size (USD million)
0.00
500.00
1000.00
1500.00
2000.00
2500.00
Year
US
D m
illi
on
0.00%100.00%200.00%300.00%400.00%500.00%600.00%700.00%
% g
row
th
Asia Pacif ic AMI Market Size (USD millions) % grow th

15
20102010 20152015 20202020
DriversDrivers
High Medium Low High Medium Low
ImpactImpact
Drivers and Restraints - Australia
Government Mandate
20102010 20152015 20202020
Rapidly changingtechnology
Restraints
Lack of standards
Rising cost to consumers
Enhanced Customer information
Operational Efficiency
Source: Frost & Sullivan.Source: Frost & Sullivan.
16
Australia
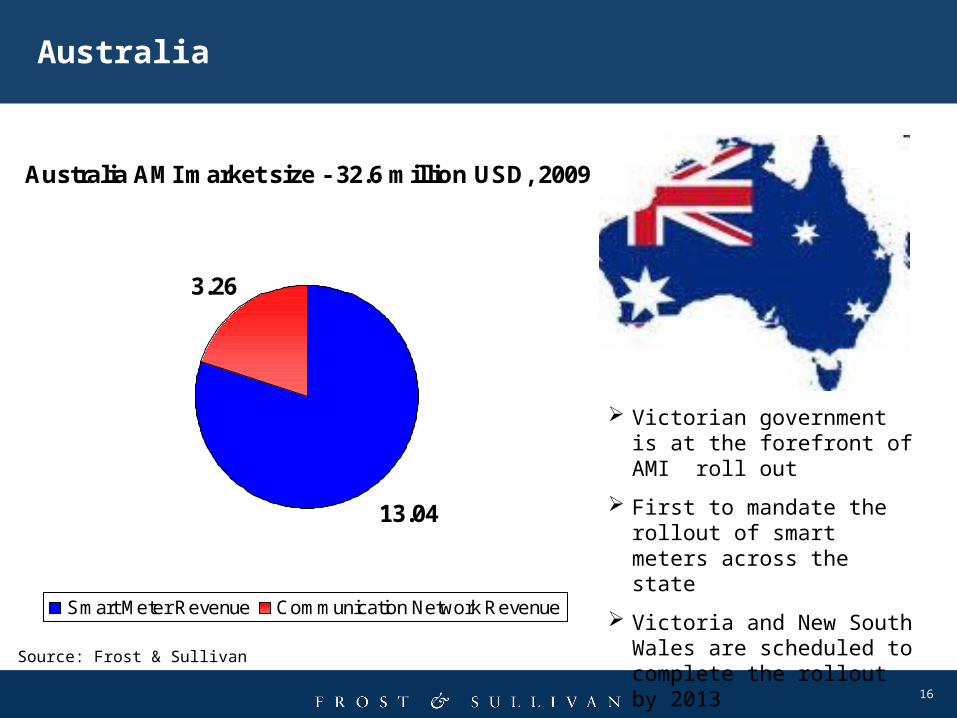
Victorian government is at the forefront of AMI roll out
First to mandate the rollout of smart meters across the state
Victoria and New South Wales are scheduled to complete the rollout by 2013
Source: Frost & Sullivan
Australia AMI market size - 32.6 million USD, 2009
13.04
3.26
Smart Meter Revenue Communication Network Revenue

17
20102010 20152015 20202020
DriversDrivers
High Medium Low High Medium Low
ImpactImpact
Drivers and Restraints – New Zealand
Demand side participation
20102010 20152015 20202020
Rapidly changingtechnology
Restraints
Lack of standards
Ageing workforce
Compliance deadline of 2015
Highly competitive &Deregulated market
Source: Frost & Sullivan.Source: Frost & Sullivan.

18
New Zealand
New Zealand AMI market size - 35 million USD, 2009
14
3.5
Smart Meter Revenue Communication Network Revenue
AMI rollout not regulated by the government
An aggressive market-led rollout
The main network technologies being deployed are RF mesh and GPRS
Source: Frost & Sullivan
19
20102010 20152015 20202020
DriversDrivers
High Medium Low High Medium Low
ImpactImpact
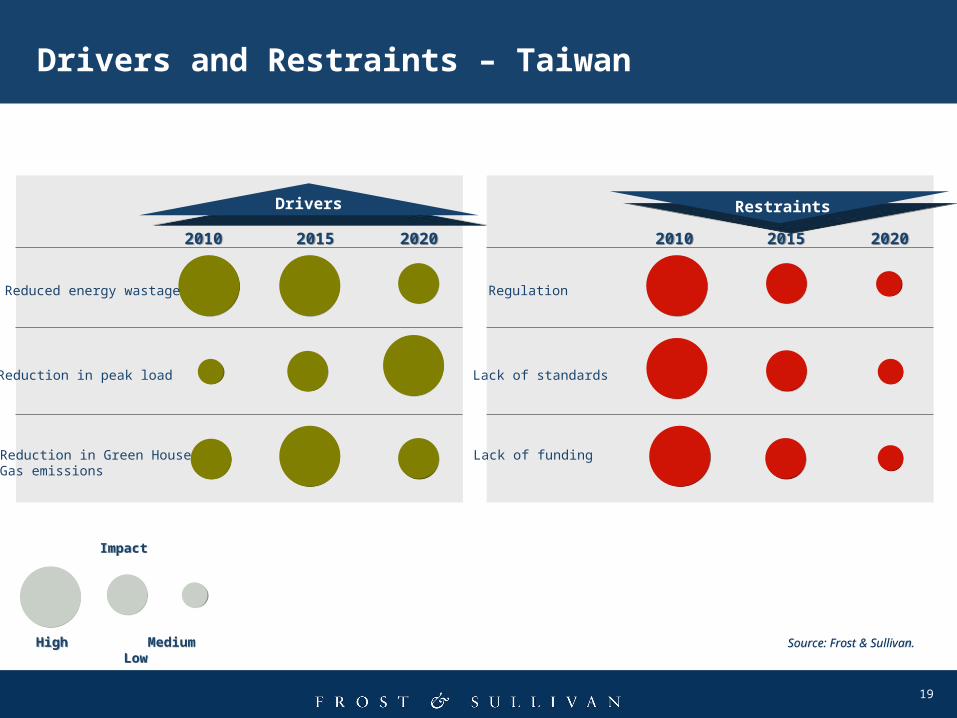
Drivers and Restraints – Taiwan
Reduced energy wastage
20102010 20152015 20202020
Regulation
Restraints
Lack of standards
Lack of funding
Reduction in peak load
Reduction in Green HouseGas emissions
Source: Frost & Sullivan.Source: Frost & Sullivan.

20
Taiwan
Taiwan moving at a fast pace for smart meters and related components
Plans to enter the international market with its products in the next 3-4 years
AMI is in its pilot stage in Taiwan currently
Taiwan AMI market size - 0.25 million USD, 2009
0.1
0.03
Smart Meter Revenue Communication Network Revenue
Source: Frost & Sullivan

21
20102010 20152015 20202020
DriversDrivers
High Medium Low High Medium Low
ImpactImpact
Drivers and Restraints – South Korea
Energy Security
20102010 20152015 20202020
Rapidly changingtechnology
Restraints
Lack of standards
Lack of private funding
Boosting technology export
Smart grid implementation
Source: Frost & Sullivan.Source: Frost & Sullivan.

22
South Korea
South Korea plans to start installing smart meters nationwide by 2012
Lagging behind other developed nations in smart meter deployment (only 4% penetration)
Power Line Carrier (PLC) is the main technology being deployed
South Korea AMI market size - 25 million, 2009
10
2.5
Smart Meter Revenue Communication Network Revenue
Source: Frost & Sullivan

23
20102010 20152015 20202020
DriversDrivers
High Medium Low High Medium Low
ImpactImpact
Drivers and Restraints – Japan
Infrastructure for EVs
20102010 20152015 20202020
No clarity on technology to deploy
Restraints
Efficient grid
Vertically integrated power suppliers
Developing new industries and enhanced services
Integration of renewable energy into grid
Source: Frost & Sullivan.Source: Frost & Sullivan.

24
Japan
AMI activity is just beginning in Japan
Kansai Electric has just started a planned 12 million smart meter rollout
Tokyo Electric is doing a pilot for 90,000 meters
Other utilities in the early stages of pilots/planning
Japan AMI market size 16 million USD , 2009
6.4
1.6
Smart Meter Revenue Communication Network Revenue
Source: Frost & Sullivan

25
Key Growth Markets – SEA/NA & Pacific
Australia
Market size of 4.02 billion USD over the next 9 years
CAGR of 70.45% from 2009-2017
New Zealand
Market size of 525 million USD over the next 9 years
CAGR of 35% from 2009-2017
South Korea
Market size of 3.15 billion USD over the next 9 years
CAGR of 71% from 2009-2017
Japan
Market size of 4.16 billion USD over the next 9 years
CAGR of 85% from 2009-2017
Taiwan
Market size of 600 million USD over the next 9 years
CAGR of 137% from 2009-2017
Source: Frost & Sullivan

26
Summary of Key Findings
The Asia Pacific advanced metering industry is in a nascent stage with rollouts expected to begin around 2011-2012The Asia Pacific advanced metering industry is in a nascent stage with rollouts expected to begin around 2011-2012
The Asia Pacific AMI market will be worth US$12.5 billion through 2017 and is likely to grow at at a CAGR of 69.3%
(2009-2017)The Asia Pacific AMI market will be worth US$12.5 billion through 2017 and is likely to grow at at a CAGR of 69.3%
(2009-2017)
Thailand , Malaysia and Philippines are currently focused only on automated meter reading capabilities for
commercial & industrial consumers. No plans yet for a large scale residential roll outThailand , Malaysia and Philippines are currently focused only on automated meter reading capabilities for
commercial & industrial consumers. No plans yet for a large scale residential roll out
Singapore is expected to begin rollout of AMI around 2015, with basic smart meter functionalitySingapore is expected to begin rollout of AMI around 2015, with basic smart meter functionality
Some of the key drivers for AMI in Asia Pacific include regulatory mandates, choice for customers, technology
upgrades, energy management and a move towards smart grids architectureSome of the key drivers for AMI in Asia Pacific include regulatory mandates, choice for customers, technology
upgrades, energy management and a move towards smart grids architecture
The growth in AMI is fuelled by Australia/New Zealand in the short term & Korea, Japan and Taiwan in the long termThe growth in AMI is fuelled by Australia/New Zealand in the short term & Korea, Japan and Taiwan in the long term
Major market restraints include financing issues, interoperability and lack of standards, limited experience &
reference instatallation s for the technology, and justifying the cost-benefit of AMI roll outMajor market restraints include financing issues, interoperability and lack of standards, limited experience &
reference instatallation s for the technology, and justifying the cost-benefit of AMI roll out

27
Thank YouQ&A