2019-20 equality and diversity information report
TRANSCRIPT

2019-20 Equality and Diversity Information Report University of Cambridge [email protected] Published January 2021

E&D Information Report 2019-20 Page 2 of 21
1. Foreword The Equality and Diversity Information Report 2019-20 provides an overview of equality information on our staff and student communities. The data contained in this report are used to inform the University’s efforts to ensure an inclusive environment for work and study and to measure the impact of equality and inclusion initiatives. The report is presented mindful of guidance regarding our obligations under equality law which covers the protected characteristics of age, disability, gender reassignment, marriage (and civil partnership), pregnancy and maternity, race, religion and belief, sex and sexual orientation. This Report has been prepared for publication by our Equality Diversity and Inclusion Section, which is part of the University’s Human Resources Division. It is governed by the University’s Equality Diversity and Inclusion Committee. Professor Eilís Ferran FBA Pro-Vice-Chancellor for Institutional and International Relations Chair of Equality Diversity and Inclusion Committee

E&D Information Report 2019-20 Page 3 of 21
2. Staff overview This section presents equality and diversity information for the academic year 2019-20 at the University of Cambridge for staff. Please refer to the notes and definitions in Appendix 1 for a detailed explanation of the data provided. At 31 March 2020 the University had 12,698 employees in four University staff groups (Table 1). Table 1: Count by staff group
Staff Group Number of employees (headcount) Percentage of employees
Academic 1,788 14.1%
Academic-Related 2,631 20.7%
Assistant 4,061 32.0%
Researcher 4,218 33.2%
Total 12,698 100.0%
The gender breakdown in the University was 52.7% women
91.3% employees had a known disclosed ethnic background. Of these staff, 15.0% were Black, Asian and Minority Ethnic (BAME)
4.1% (519) of all employees disclosed having a disability
Women comprised 22.8% of all Professors, and 8.8% of Professors were BAME.
3. Diversity of leadership Within the University of Cambridge decision making is centred in the University’s influential main committees and Councils of the Schools. Committees are comprised of appointed, elected and ex officio members and therefore individuals often sat on more than one committee. Women made up 34.6% of the Council (38.5% in 2019), which is the principal executive and policy-making body of the University. Members who disclosed their ethnicity as BAME comprised at most 5.0% of members on three committees. However, we do not currently collect diversity data on external committee members, with ethnicity data not recorded for over a third of committee members (Table 2). 26.1% of Heads of Departments were women, and 4.3% had disclosed their ethnicity as BAME. Table 2: Diversity of members sitting on University governance committees and Councils of Schools
Committee Percentage of Women Percentage of BAME
Council 34.6% 4.5%
General Board of the Faculties 37.5% 0.0%
Arts and Humanities 33.3% 0.0%
Biological Sciences 42.1% 5.0%
Clinical Medicine 31.6% 0.0%
Humanities and Social Sciences 33.3% 0.0%
Physical Sciences 12.5% 0.0%
Technology 21.1% 5.0%
E&D Information Report 2019-20 Page 4 of 21
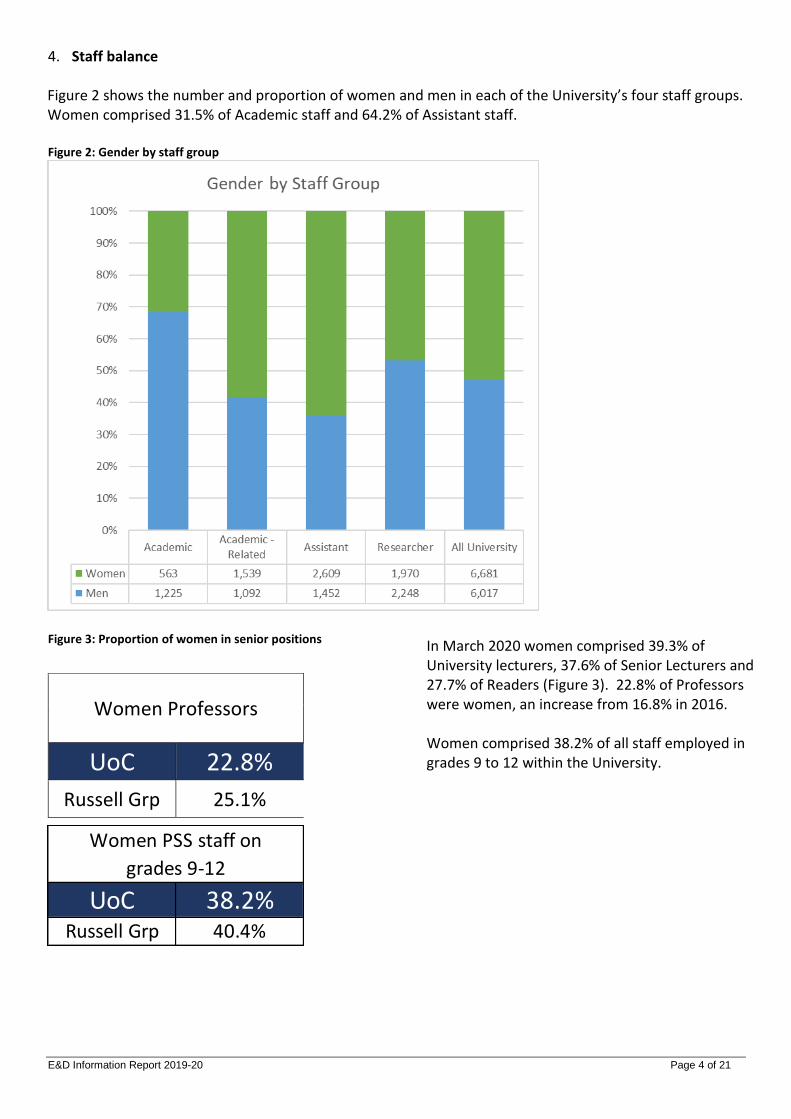
4. Staff balance Figure 2 shows the number and proportion of women and men in each of the University’s four staff groups. Women comprised 31.5% of Academic staff and 64.2% of Assistant staff. Figure 2: Gender by staff group
Figure 3: Proportion of women in senior positions
UoC 38.2%Russell Grp 40.4%
UoC 22.8%Russell Grp 24.5%
Women PSS staff on
grades 9-12
Women ProfessorsWomen Professors
UoC 22.8%
Russell Grp 25.1%
In March 2020 women comprised 39.3% of University lecturers, 37.6% of Senior Lecturers and 27.7% of Readers (Figure 3). 22.8% of Professors were women, an increase from 16.8% in 2016. Women comprised 38.2% of all staff employed in grades 9 to 12 within the University.
E&D Information Report 2019-20 Page 5 of 21
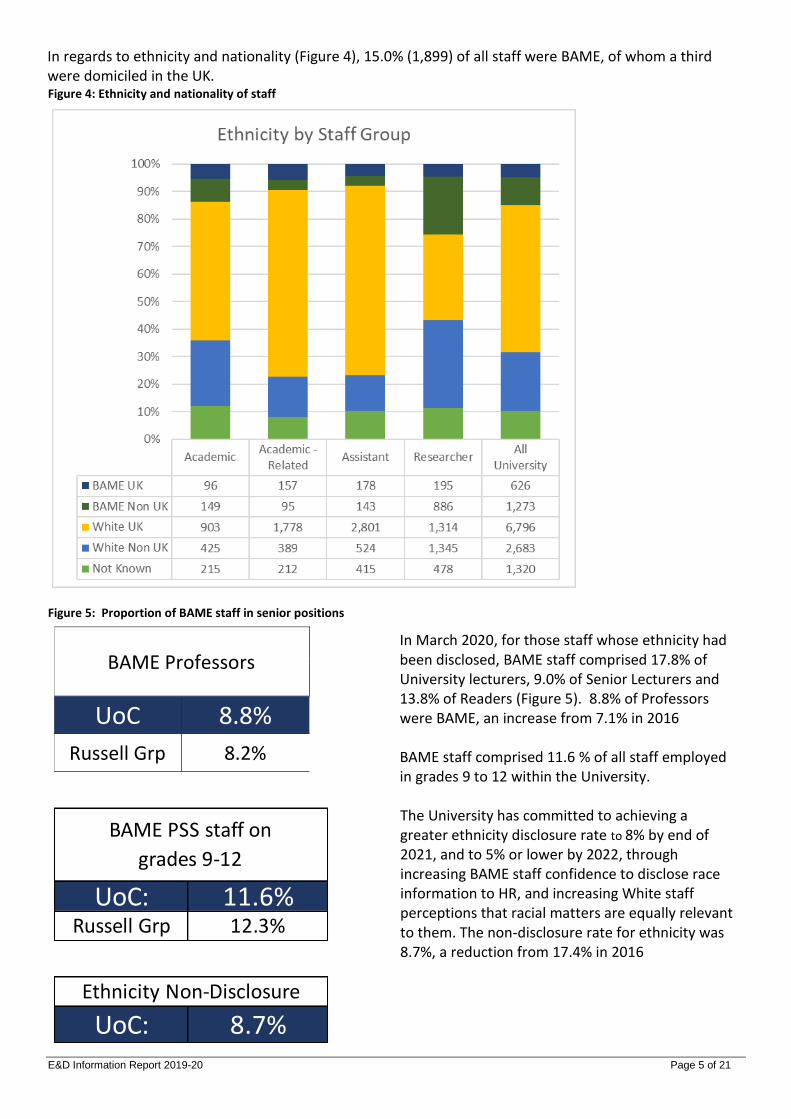
In regards to ethnicity and nationality (Figure 4), 15.0% (1,899) of all staff were BAME, of whom a third were domiciled in the UK. Figure 4: Ethnicity and nationality of staff
Figure 5: Proportion of BAME staff in senior positions
Ethnicity Non-Disclosure
UoC: 8.7%
BAME PSS staff on
grades 9-12
UoC: 11.6%Russell Grp 12.3%
BAME Professors
UoC: 8.8%Russell Grp 11.0%
In March 2020, for those staff whose ethnicity had been disclosed, BAME staff comprised 17.8% of University lecturers, 9.0% of Senior Lecturers and 13.8% of Readers (Figure 5). 8.8% of Professors were BAME, an increase from 7.1% in 2016 BAME staff comprised 11.6 % of all staff employed in grades 9 to 12 within the University. The University has committed to achieving a greater ethnicity disclosure rate to 8% by end of 2021, and to 5% or lower by 2022, through increasing BAME staff confidence to disclose race information to HR, and increasing White staff perceptions that racial matters are equally relevant to them. The non-disclosure rate for ethnicity was 8.7%, a reduction from 17.4% in 2016
BAME Professors
UoC 8.8%
Russell Grp 8.2%
E&D Information Report 2019-20 Page 6 of 21
5. Staff Recruitment During the period 1 April 2019 to 31 March 2020 the University offered 3,456 positions to applicants, from over 57,000 applicants. Increasing recruitment of women and BAME staff into Academic roles is a strategic goal of the University, articulated in the institution’s Athena Swan Silver, and Race Equality Charter, action plans1. The University has committed to increasing the proportion of women and BAME applications by more than 5% by the end of 2021. Of the posts filled, 4.3% were for Academic roles, 43.5% Researcher and the remainder, 52.2%, for professional and support roles – Academic-related and Assistant posts (Figure 8).. Recruitment by gender For all staff groups, women comprised a higher percentage of those offered posts, compared to the proportion of applications. Over this period, women comprised 32% of all applicants to Academic roles, and 43% of those offered a post (Figure 8). This represents an increase from 2018 where women made up only 33.1% of those offered Academic positions.
1 https://www.equality.admin.cam.ac.uk/files/institutional_athena_swan_silver_application_nov_2018.pdf https://www.race-equality.admin.cam.ac.uk/strategic-initiatives-overview/race-equality-charter
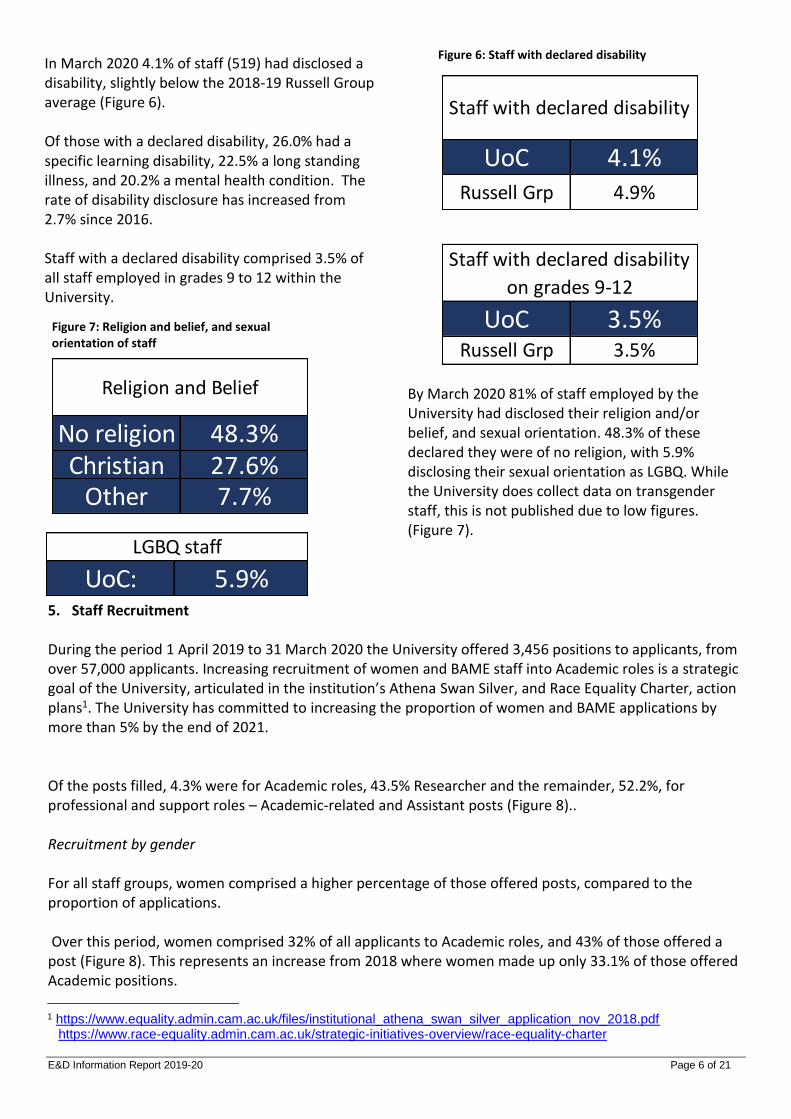
LGBQ staff
UoC: 5.9%
No religion
Other
48.3%Christian 27.6%
7.7%
Religion and Belief
UoC 3.5%Russell Grp 3.5%
UoC 4.1%Russell Grp 4.9%
Staff with declared disability
on grades 9-12
Staff with declared disability
In March 2020 4.1% of staff (519) had disclosed a disability, slightly below the 2018-19 Russell Group average (Figure 6). Of those with a declared disability, 26.0% had a specific learning disability, 22.5% a long standing illness, and 20.2% a mental health condition. The rate of disability disclosure has increased from 2.7% since 2016. Staff with a declared disability comprised 3.5% of all staff employed in grades 9 to 12 within the University.
Figure 6: Staff with declared disability
Figure 7: Religion and belief, and sexual orientation of staff
By March 2020 81% of staff employed by the University had disclosed their religion and/or belief, and sexual orientation. 48.3% of these declared they were of no religion, with 5.9% disclosing their sexual orientation as LGBQ. While the University does collect data on transgender staff, this is not published due to low figures. (Figure 7).

E&D Information Report 2019-20 Page 7 of 21
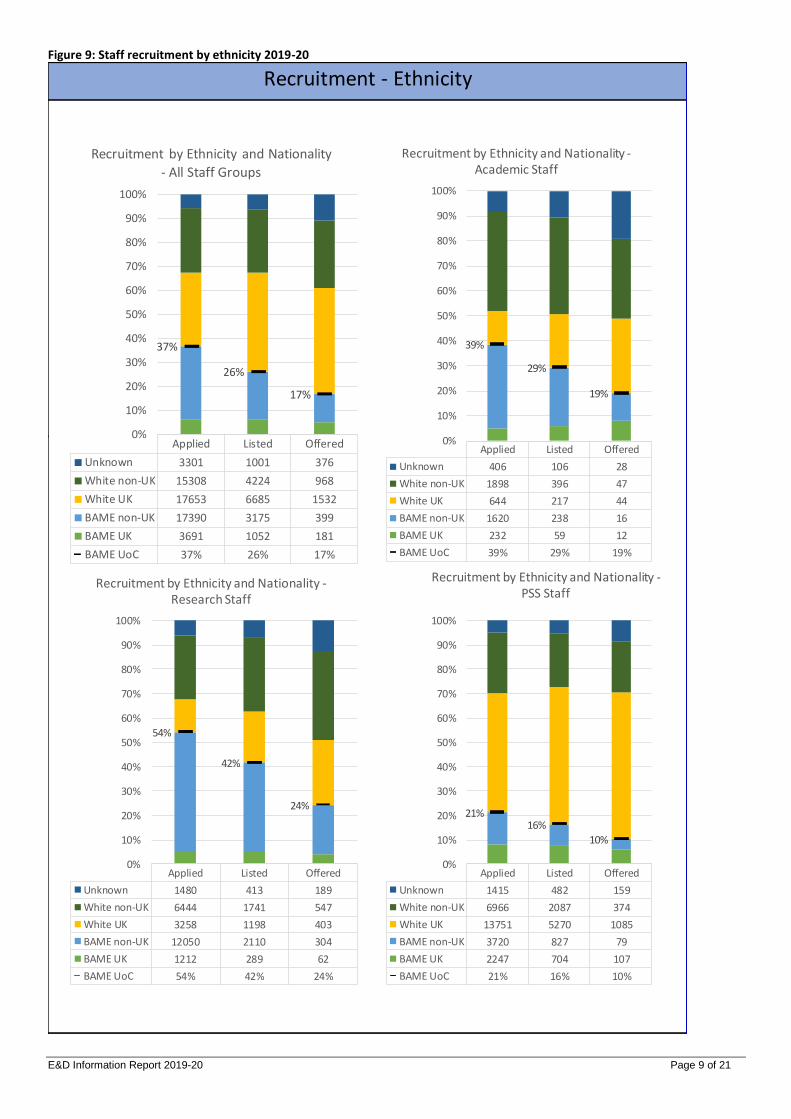
These data also indicate that during this year success rate (the proportion of those offered compared to applications) differed by gender, with 4.1% of women Academic applicants receiving an offer compared to 2.6% of men. Recruitment by ethnicity Recruitment data has been disaggregated by ethnicity and nationality as the University receives a significant number of applications from individuals domiciled abroad – 57% (Figure 9). BAME applicants comprised 37% of all applications and 17% of those who received offers. However when we consider nationality, individuals with British nationality comprised 17.5% of all BAME applications but 31.2% of BAME individuals offered a post at the University. These data also indicate that during this year success rate (the proportion of those offered compared to applications) differed by ethnicity, with 3.6% of White applicants receiving an offer compared to 1.5% of those from a BAME background. As highlighted above, increasing the recruitment of those who identify as BAME is a strategic goal. The Race Equality Charter action plan committed to an increase in BAME UK applications for academic and research posts to 8% (above the national benchmark of BAME UK academics – 6.7%) by December 2022, and an increase in BAME applications for PSS roles from 21% to 30% by December 2022. In 2019-20, 4.8% and 4.9% of applications for Academic and Research positions, respectively, were from UK BAME applicants. 8.1% of those offered Academic posts were UK BAME, and 4.1% of those offered Research posts. Those identifying as BAME comprised 21% of all PSS applications, and 10% of those offered positions.

E&D Information Report 2019-20 Page 8 of 21
Figure 8: Staff recruitment by gender 2019-20
E&D Information Report 2019-20 Page 9 of 21
Figure 9: Staff recruitment by ethnicity 2019-20
Recruitment - Ethnicity
Applied Listed Offered
Unknown 1480 413 189
White non-UK 6444 1741 547
White UK 3258 1198 403
BAME non-UK 12050 2110 304
BAME UK 1212 289 62
BAME UoC 54% 42% 24%
54%
42%
24%
0%
10%
20%
30%
40%
50%
60%
70%
80%
90%
100%
Recruitment by Ethnicity and Nationality -Research Staff
Applied Listed Offered
Unknown 1415 482 159
White non-UK 6966 2087 374
White UK 13751 5270 1085
BAME non-UK 3720 827 79
BAME UK 2247 704 107
BAME UoC 21% 16% 10%
21%16%
10%
0%
10%
20%
30%
40%
50%
60%
70%
80%
90%
100%
Recruitment by Ethnicity and Nationality -PSS Staff
Applied Listed Offered
Unknown 3301 1001 376
White non-UK 15308 4224 968
White UK 17653 6685 1532
BAME non-UK 17390 3175 399
BAME UK 3691 1052 181
BAME UoC 37% 26% 17%
37%
26%
17%
0%
10%
20%
30%
40%
50%
60%
70%
80%
90%
100%
Recruitment by Ethnicity and Nationality
- All Staff Groups
Applied Listed Offered
Unknown 406 106 28
White non-UK 1898 396 47
White UK 644 217 44
BAME non-UK 1620 238 16
BAME UK 232 59 12
BAME UoC 39% 29% 19%
39%
29%
19%
0%
10%
20%
30%
40%
50%
60%
70%
80%
90%
100%
Recruitment by Ethnicity and Nationality -Academic Staff
E&D Information Report 2019-20 Page 10 of 21
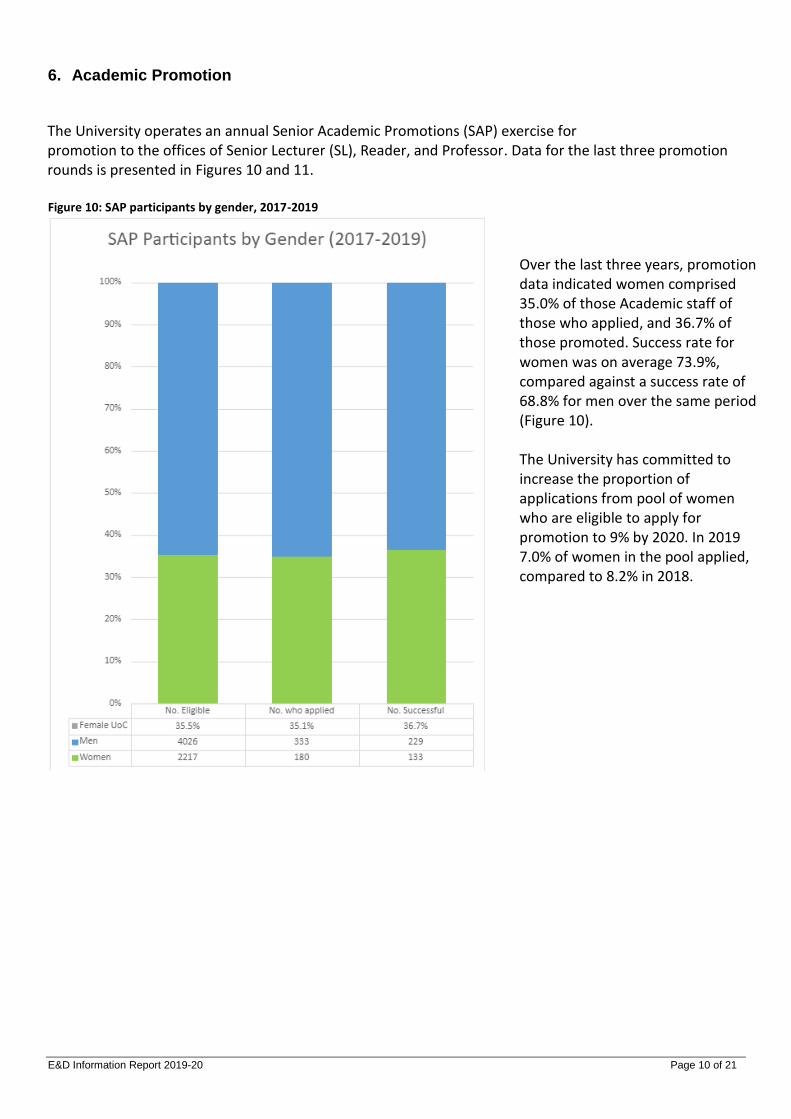
6. Academic Promotion The University operates an annual Senior Academic Promotions (SAP) exercise for promotion to the offices of Senior Lecturer (SL), Reader, and Professor. Data for the last three promotion rounds is presented in Figures 10 and 11. Figure 10: SAP participants by gender, 2017-2019
Over the last three years, promotion data indicated women comprised 35.0% of those Academic staff of those who applied, and 36.7% of those promoted. Success rate for women was on average 73.9%, compared against a success rate of 68.8% for men over the same period (Figure 10). The University has committed to increase the proportion of applications from pool of women who are eligible to apply for promotion to 9% by 2020. In 2019 7.0% of women in the pool applied, compared to 8.2% in 2018.

E&D Information Report 2019-20 Page 11 of 21
Figure 11 : SAP participants by ethnicity 2017-2019
Over the last three years, promotion data has shown staff who identify as BAME comprised 11.3 % of those eligible to seek promotion, 11.3% of those who applied and 12.4% of those promoted. The success rate for BAME Academics was on average 80.0%, compared against a success rate of 71.8% for White Academics over the same period (Figure 11). The University’s REC action plan has committed to an increase in BAME applicants for Reader and Professorship roles to at least match proportions of BAME eligible pools by 2022. In the 2019-20 SAP round, BAME Academics comprised 12.6% of those eligible to apply for Professorships, and 3.3% of applicants. For Readerships, 13% of the eligible pool and 10.3% of applications.

E&D Information Report 2019-20 Page 12 of 21
7. Student overview The following information is a summary of student figures sourced from holders of student data across the University. Comparative data are sourced from HESA via the Higher Education Information Database for Institutions 8. Student Numbers Student Numbers by gender Figure 12 Student numbers by gender 2019-20
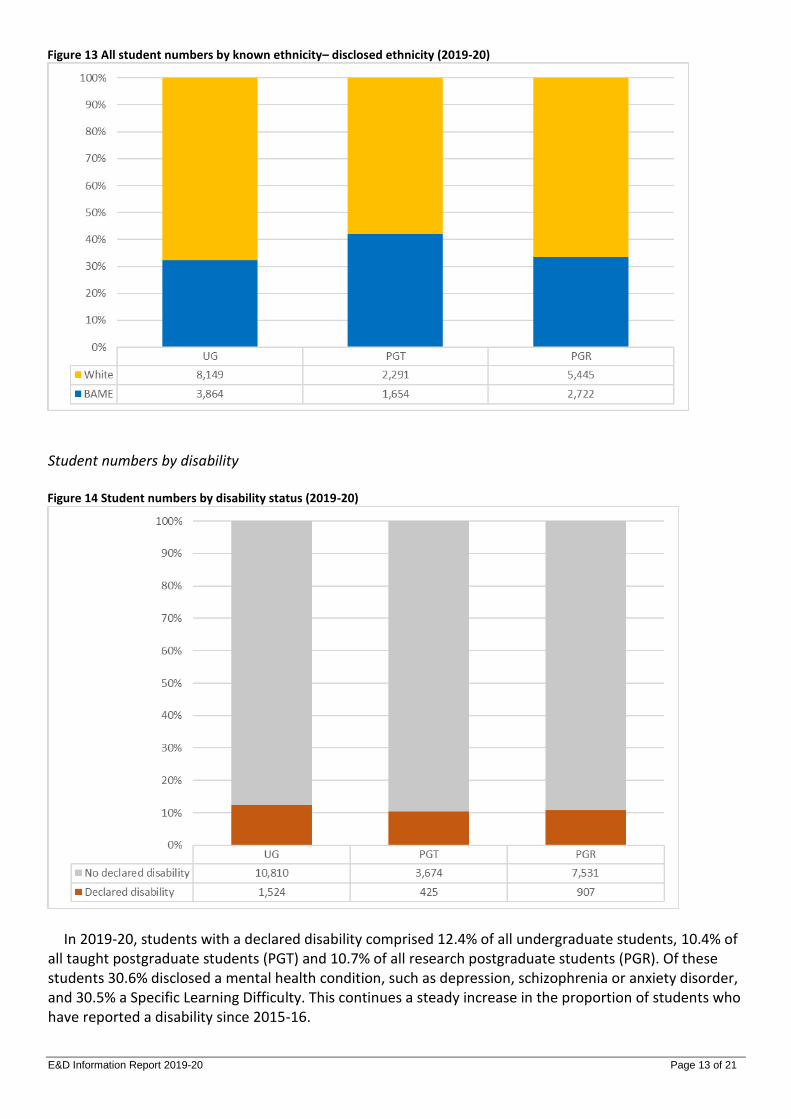
In 2019-20, women students comprised 47.7% of all undergraduate students, 47.5% of all taught postgraduate students (PGT) and 44.7% of all research postgraduate students (PGR) (Figure 12). These proportions have been consistent over a number of years at the University. This compares against a Russell Group average of 54.2% and 60.8% of all taught postgraduate students (PGT) and 47.5% of all research postgraduate students (PGR) in 2018-19. Student numbers by ethnicity Figure 13 shows that students from a BAME background made up 32.2% of all undergraduate students who disclosed their ethnicity, 41.9% of Taught postgraduates and 33.3% of Research postgraduate students had disclosed their ethnicity as BAME in 2019-20. Of students domiciled in the UK, 24.7% of UG students, 24.1% of PGT and 18.2% of PGR were BAME. This compares against a Russell Group average of 17.2% UK BAME, 9.3% of all taught postgraduate students (PGT) and 9.0% of all research postgraduate students (PGR) in 2018-19.
E&D Information Report 2019-20 Page 13 of 21
Figure 13 All student numbers by known ethnicity– disclosed ethnicity (2019-20)
Student numbers by disability Figure 14 Student numbers by disability status (2019-20)
In 2019-20, students with a declared disability comprised 12.4% of all undergraduate students, 10.4% of all taught postgraduate students (PGT) and 10.7% of all research postgraduate students (PGR). Of these students 30.6% disclosed a mental health condition, such as depression, schizophrenia or anxiety disorder, and 30.5% a Specific Learning Difficulty. This continues a steady increase in the proportion of students who have reported a disability since 2015-16.
E&D Information Report 2019-20 Page 14 of 21
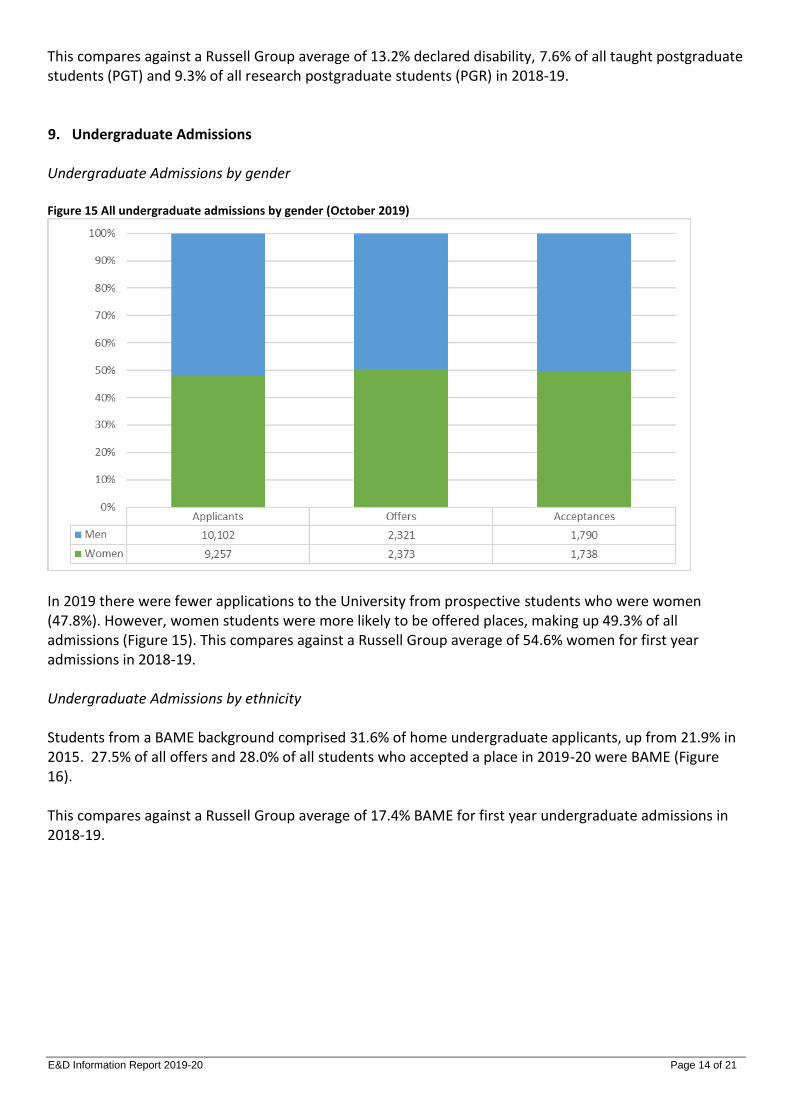
This compares against a Russell Group average of 13.2% declared disability, 7.6% of all taught postgraduate students (PGT) and 9.3% of all research postgraduate students (PGR) in 2018-19. 9. Undergraduate Admissions Undergraduate Admissions by gender Figure 15 All undergraduate admissions by gender (October 2019)
In 2019 there were fewer applications to the University from prospective students who were women (47.8%). However, women students were more likely to be offered places, making up 49.3% of all admissions (Figure 15). This compares against a Russell Group average of 54.6% women for first year admissions in 2018-19. Undergraduate Admissions by ethnicity Students from a BAME background comprised 31.6% of home undergraduate applicants, up from 21.9% in 2015. 27.5% of all offers and 28.0% of all students who accepted a place in 2019-20 were BAME (Figure 16). This compares against a Russell Group average of 17.4% BAME for first year undergraduate admissions in 2018-19.

E&D Information Report 2019-20 Page 15 of 21
Figure 16 Home undergraduate admissions by ethnicity (October 2019)
Undergraduate Admissions by disability Figure 17 Undergraduate admissions by declared disability (October 2019)
There were 1,499 applicants with a declared disability (7.8% of all undergraduate student applicants – an increase from 6.6% in 2017); of these 355 were accepted (7.6% of total undergraduate acceptances). This compares against a Russell Group average of 11.4% declared disability for first year undergraduate admissions in 2018-19.
E&D Information Report 2019-20 Page 16 of 21
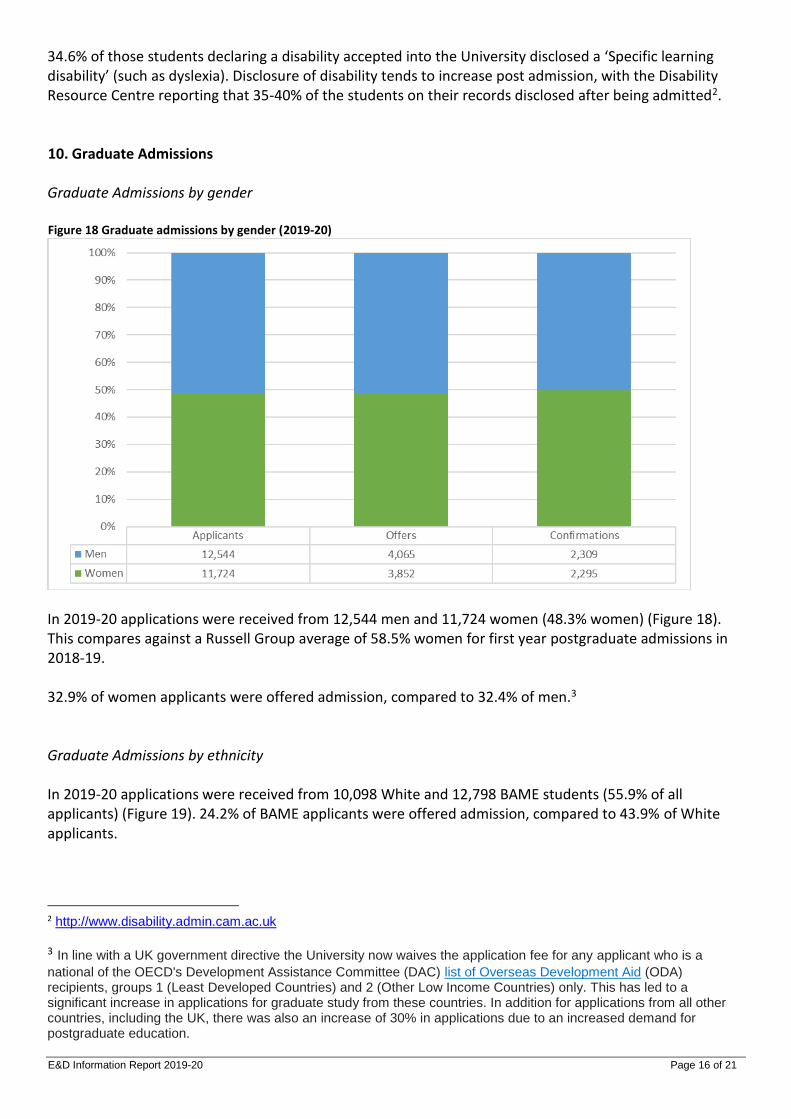
34.6% of those students declaring a disability accepted into the University disclosed a ‘Specific learning disability’ (such as dyslexia). Disclosure of disability tends to increase post admission, with the Disability Resource Centre reporting that 35-40% of the students on their records disclosed after being admitted2. 10. Graduate Admissions Graduate Admissions by gender Figure 18 Graduate admissions by gender (2019-20)
In 2019-20 applications were received from 12,544 men and 11,724 women (48.3% women) (Figure 18). This compares against a Russell Group average of 58.5% women for first year postgraduate admissions in 2018-19. 32.9% of women applicants were offered admission, compared to 32.4% of men.3 Graduate Admissions by ethnicity In 2019-20 applications were received from 10,098 White and 12,798 BAME students (55.9% of all applicants) (Figure 19). 24.2% of BAME applicants were offered admission, compared to 43.9% of White applicants.
2 http://www.disability.admin.cam.ac.uk
3 In line with a UK government directive the University now waives the application fee for any applicant who is a
national of the OECD's Development Assistance Committee (DAC) list of Overseas Development Aid (ODA) recipients, groups 1 (Least Developed Countries) and 2 (Other Low Income Countries) only. This has led to a significant increase in applications for graduate study from these countries. In addition for applications from all other countries, including the UK, there was also an increase of 30% in applications due to an increased demand for postgraduate education.

E&D Information Report 2019-20 Page 17 of 21
This compares against a Russell Group average of 8.0% BAME for first year postgraduate admissions in 2018-19. Figure 19 Total graduate admissions by ethnicity 2018-19
Graduate Admissions by disability Figure 20 Graduate admissions by declared disability
In 2019-20 applications were received from 2,000 students with a declared disability (8.2% of total student applications (Figure 20). Of those who accepted offers from the University, 510 were disabled. The success rates for students receiving offers varied considerably by disability from 30 to 48%, compared to 32% for those without a disability.

E&D Information Report 2019-20 Page 18 of 21
This compares against a Russell Group average of 7.2% declared disability for first year postgraduate admissions in 2018-19.
11. Undergraduate degree attainment Note, due to the disruption caused to examinations by the Covid pandemic, these data are for students in the last year of their degrees only. Undergraduate degree attainment by gender Table 3 UK domiciled students - undergraduate examination results by gender 2019-20.
Class I Class II Division I Class II Division II and lower
Men 49.1% 46.8% 4.1%
Women 47.0% 51.2% 1.8%
The percentage of women gaining first class examination results was 47.0% compared with 49.1% of males, a gender awarding gap of 2.1% (Table 3). This gender gap was reversed for ‘good degrees’ with 95.9% of men and 98.2% of women receiving an examination classification of 2:1 or above. This compares against a Russell Group average gender awarding gap of 0.1% in favour of men receiving first class honours in 2018-19. Undergraduate degree attainment by ethnicity Table 4 UK domiciled students - undergraduate examination results by ethnicity 2019-20
Class I Class II Division I Class II Division II and lower
White 49.4% 48.4% 2.2%
BAME 42.7% 51.7% 5.5%
The percentage of White students gaining first class examination results was 49.4% compared with 42.7% of BAME students, an ethnicity awarding gap of 6.7% (Table 4). This gap reduced for ‘good degrees’ with 94.5% of BAME and 97.8% of White students receiving an examination classification of 2:1 or above. This compares against a Russell Group average ethnicity awarding gap of 7.0% in favour of White students receiving first class honours in 2018-19. Undergraduate degree attainment by disability Table 5 UK domiciled students - undergraduate examination results by disability 2019-20
Class I Class II Division I Class II Division II and lower
No Disability 48.7% 48.5% 2.8%
Declared Disability
44.4% 51.7% 3.9%
Table 5 shows that the percentage of students with no disability gaining first class examination results was 48.7% compared with 44.4% of students who had declared a disability, an attainment gap of 4.3%. This gap reduced for ‘good degrees’ with 97.2% of students with no declared disability and 96.1% of declared disabled students receiving an examination classification of 2:1 or above. Analysis of this data to a more granular level is complicated by small numbers.

E&D Information Report 2019-20 Page 19 of 21
This compares against a Russell Group average disability awarding gap of 3.4% in favour of students with no disability receiving first class honours in 2018-19.

E&D Information Report 2019-20 Page 20 of 21
Appendix 1 Staff - Definitions and notes This E&D Information Report is derived from the HR CHRIS4 system at a 31 March 2020 census date, with the exception of the recruitment data which covers the period 1 April 2019 to 31 March 2020. Any person who holds a University office or post and has a University contract of employment is considered to be an employee. Employees are categorised as Academic, Academic-related, Assistant or Researcher on the basis of the main duties of their post. Academic roles are further disaggregated into Academic staff type, namely University Lecturer, Senior Lecturer, Reader and Professor. The staff numbers presented are of individual staff members (headcount) rather than full time equivalent (FTE). Full-time staff are defined for the purpose of this report as being employed at 1 FTE (full-time equivalent). Part-time staff are defined as being employed at less than 1 FTE. Where staff had multiple contracts or in cases where contracts involve more than one activity, a set rule was applied for non-Academic staff. The individual was assigned to the position with the highest FTE, or if the FTEs were identical, the staff member was assigned to the position that they had held for the longest period of time. In cases where Academic staff held both an Academic and Research post, they were assigned to their Academic role. Positions held in association with a substantive full-time appointment, including Associate Lectureships, Heads of Department and Chairs of Faculty Boards, were not counted. Each post is assigned to a specific grade within the grading structure 1–125. The grades overlap with staff groups so members of different staff groups can be employed on the same grade, but with different core roles and responsibilities. Staff are defined as having either permanent (open-ended) or fixed contracts. Those on fixed contracts are employed for a fixed term period or have an end date on their contract of employment due to limited funding available. Where staff information categories would include numbers of less than five, information has not been included in accordance with Higher Education Statistics Agency (HESA) policy in order to protect the confidentiality of individuals6. Due to rounding to one decimal place, some total percentages may not equal 100%. No statistical testing has been conducted due to the small number of staff in many of the categories and protected groups. Disability (staff) Disability is recorded within the CHRIS system using the HESA staff categories7. HESA has a number of disability fields for staff disclosure at either recruitment or during employment at the University. Ethnicity (staff) Ethnicity data has been combined for easier comparison. Staff or applicants who disclosed their ethnicity as the following have been aggregated as Black, Asian and Minority Ethnic (BAME):
Arab
4 Cambridge Human Resources Information System 5 http://www.hr.admin.cam.ac.uk/pay-benefits/salary-scales 6 http://www.hesa.ac.uk/index.php 7 For details on all HESA staff categories go to http://www.hesa.ac.uk/dox/datacoll/C11025/11025.pdf?v=d41d8cd98f00b204e9800998ecf8427e
E&D Information Report 2019-20 Page 21 of 21
Asian or Asian British - Bangladeshi
Asian or Asian British - Indian
Asian or Asian British - Pakistani
Black or Black British African
Black or Black British Caribbean
Chinese
Mixed Ethnicity
Other Asian Background
Other Black Background
Other ethnic background The University records White – British, White – Irish and White – Other, which for the purposes of this data has been aggregated as White. Staff and applicant data on nationality have been aggregated into Non-UK and UK. Benchmarking Where useful, data from the other Russell Group universities has been provided for benchmarking purposes. These data have been sourced from HESA via the Higher Education Information Database for Institutions (HEIDI) online tool. The latest available information was for 2018-19 year. Students - Definitions and notes The enclosed student figures are a summary of information sourced from reports and publications produced by the Student Statistics Office, Graduate Admissions and Cambridge Admissions Office. Further detailed information for all students is available from these sections. The information has been presented in line with the requirements of the Equality Act 2010 public sector equality duty which obliges higher education institutions to publish information about the people affected by its policies and practices; in this case students. No significance testing has been performed due to the low numbers of students in many of the protected groups. All student figures are the latest available and in most cases are for the academic year 2019-20 unless otherwise specified. For full information and definitions on student figures please refer to the CamDATA website: www.admin.cam.ac.uk/univ/camdata/. Please note that due to rounding to one decimal place, some total percentages may not equal 100%