2014.05.20_oecd-eclac-pse forum_dosi
TRANSCRIPT

Innovation, Globalization, and the Sustainability of the European Model(s)
Europe – Latin America economic forumGlobal change, labour market dynamics and the sectoral structure of production
May 20, 2014 Paris
Giovanni DosiScuola Superiore S.Anna, Pisa
Mauro Sylos LabiniUniversità di Pisa

• Some structural European weakness well before the crisis in research, innovation and production

1. A broad look at the patterns of innovation internationally…
Japan11%
Korea5%
US32%
EU 1522%
China17%
Others13%
Gross expenditure on R&D 2012
Note: shares are on world total.Source: elaborations on OECD data.

Gross expenditure on R&D as % of GDP
0.5
1
1.5
2
2.5
3
3.5
4
4.5
1981 1986 1991 1996 2001 2006 2011
Japan Korea United States EU 15 China
Source: elaborations on OECD data.
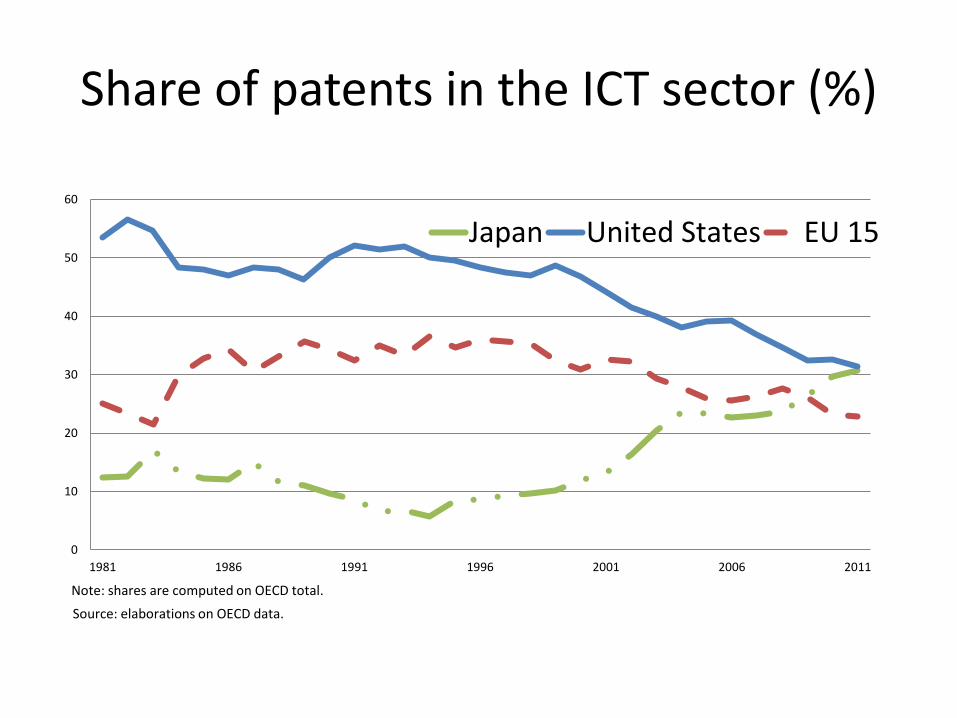
Share of patents in the ICT sector (%)
0
10
20
30
40
50
60
1981 1986 1991 1996 2001 2006 2011
Japan United States EU 15
Source: elaborations on OECD data.
Note: shares are computed on OECD total.

Share (%) of patents in the biotech sector
0
10
20
30
40
50
60
70
1981 1986 1991 1996 2001 2006 2011
Japan United States EU 15
Source: elaborations o OECD data.
Note: shares are computed on OECD total.
A broad look at the patterns of innovation… (cont.)
• The evidence pinpoints to a continuing US leadership especially in ICT and newer technological paradigms and fast catch-up by Far Eastern countries

At the roots of the US technological leadership
• “The American paranoia on communism and cancer” (K. Pavitt)
– The legacy of big mission-oriented programs (military, space,…)
– Massive public founded research in life science
– Rich variety of industrial policies (without calling them as such!)

Conversely, at the roots of European weaknesses
– Weak mission oriented commitments (after all, the whole Europe lost WWII…)
– Half-hearted commitment to catching up policies (… success with Airbus but massive failure in ICT…)
– The scourge of “diffusion-oriented”, “market-friendly” policies…

And also in Science Europe is lagging behind

Share of Nobel prizes in science (%, by affiliation of the recipient)
0
10
20
30
40
50
60
70
80
90
100
1900/10 1910/20 1920/30 1930/40 1940/50 1950/60 1960/70 1970/80 1980/90 1990/00 2000/10 2010/13
USA EU 15 Japan
Source: elaborations on Nobel Foundation data.
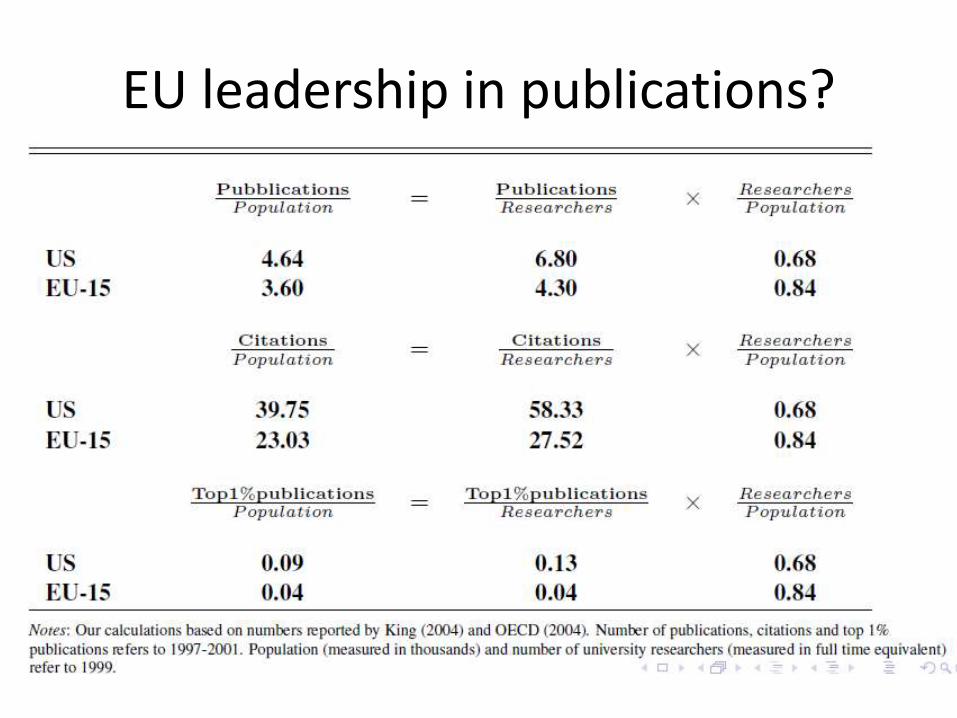
EU leadership in publications?

Universities in the “Shanghai ranking” (number of top 100)
0
10
20
30
40
50
60
2004 2005 2006 2007 2008 2009 2010 2011 2012 2013
Japan United States UE 15
Source: elaborations on ARWU (Shangai) ranking.

Innovation (and science) still largely non-globalized, but occurring in highly globalized economies

2 Globalization and its consequences
• Financial globalization and the weakening of policy setting power of States

Gross international financial assets of advanced countries
0
20000000
40000000
60000000
80000000
100000000
120000000
140000000
160000000
1970 1975 1980 1985 1990 1995 2000 2005
(millions of current US dollars)
DEBT FDI Equity
Derivatives Total GDP
Source: updated and extended version of the database developed by Lane and Milesi-Ferretti (2007).

Globalization and the real economy
• Obviously, increasing shares of trade and current accounts on GDP
• But also lower “equilibrium” rates of growthconsistent with foreign trade balances
• The weakening of the manufacturing base in the US and Europe

Imports and exports in goods and services
(% of GDP)
1995 2000 2005 2008 2009
Japan30 28 31 38 30
United States21 24 24 28 23
EU 2721 20 26 33 27
Germany 58 51 70 88 73
France 55 46 59 69 55
United Kingdom 54 51 58 66 53
Italy 44 39 55 66 51
Source: elaborations on OECD data.

Balance of trade
(% of GDP)
1995 2000 2005 2008 2009
Japan3 2 2 0 0
United States-1 -4 -6 -5 -3
EU 272 0 1 0 1
Germany 1 0 6 7 6
France 2 1 -1 -3 -2
United Kingdom 0 -2 -4 -3 -2
Italy 4 1 0 -1 0
Source: elaboration on OECD data.

Current account balance
-8
-6
-4
-2
0
2
4
6
1980 1985 1990 1995 2000 2005 2010
(% on GDP)
Japan United States EU 27
Source: IMF

The balance of payment (consistent with) equilibrium growth rate
• Assume X=M
• In a growing economy gx=gm
• If (among other things) import demand is a function of domestic income M=𝑌ᴨ(where ᴨisthe income elasticity of demand for imports)
• The «balanced» rate of growth becomes
– gy=gx/ᴨ

GDP growth and “feasible” growth rates from the Harrod Trade Multiplier, 1979=100
United States
Source: authors’ calculations on IMF data.
80
100
120
140
160
180
200
220
240
1979 1984 1989 1994 1999 2004 2009
GDP "balanced"
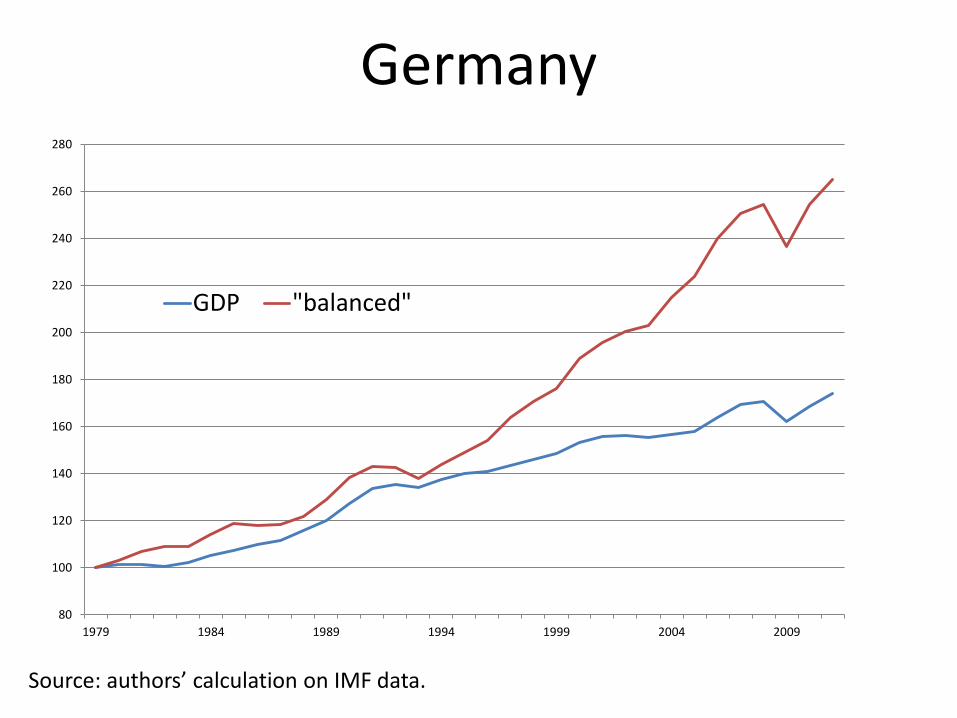
Germany
Source: authors’ calculation on IMF data.
80
100
120
140
160
180
200
220
240
260
280
1979 1984 1989 1994 1999 2004 2009
GDP "balanced"

France
Source: authors’ calculations on IMF data.
80
100
120
140
160
180
200
1979 1984 1989 1994 1999 2004 2009
GDP "balanced"

United Kingdom
Source: authors’ calculations on IMF data.
80
100
120
140
160
180
200
220
240
19
79
19
80
19
81
19
82
19
83
19
84
19
85
19
86
19
87
19
88
19
89
19
90
19
91
19
92
19
93
19
94
19
95
19
96
19
97
19
98
19
99
20
00
20
01
20
02
20
03
20
04
20
05
20
06
20
07
20
08
20
09
20
10
20
11
GDP "balanced"

Italy
Source: authors’ calculations on IMF data.
80
90
100
110
120
130
140
150
160
170
1979 1984 1989 1994 1999 2004 2009
GDP "balanced"

Japan
Source: authors’ calculations on IMF data.
80
130
180
230
280
330
1979 1984 1989 1994 1999 2004 2009
GDP "balanced"

Manufacturing value added
0
5
10
15
20
25
30
35
1980 1985 1990 1995 2000 2005 2010
EU 27 China United States Japan
(% of world v.a. in manufacturing)
Source: elaboration on UN data.

Manufacturing Value added(% growth rates, constant 2005 prices in US $)
2011
annual
averagescumulate
annual
averagescumulate
annual
averag
es
cumulateannual
averagescumulate
China 9,5 143,3 9,7 149,1 14,0 266,8 12,8 231,3 9,7
WORLD 3,5 40,7 2,9 32,8 2,8 32,1 3,2 35,4 3,8
United States 1,8 18,0 2,6 28,0 3,9 45,5 2,0 19,7 2,2
Japan 4,4 52,5 4,8 59,9 0,9 8,6 1,7 13,8 -4,1
Germany 1,8 18,3 1,7 18,3 0,8 7,5 1,6 11,3 8,3
EU 27 3,1 35,0 2,0 21,1 1,7 17,8 1,0 8,2 4,6
France 3,4 39,4 1,1 11,6 2,2 23,5 0,1 0,7 0,8
Spain 4,8 58,4 2,2 23,9 2,4 25,8 -0,5 -6,0 2,9
United Kingdom 1,3 12,5 2,0 20,7 0,9 9,3 -0,8 -8,3 2,1
Italy 6,3 81,6 2,2 24,3 1,3 13,7 -0,7 -8,9 1,2
Source: United Nations.
1970's 1980's 1990's 2000's

What is so special about manufacturing?
• Innovation opportunities
• Dynamic increasing returns
• Large base of decent jobs and the relatively egalitarian and inclusive society
• Crucial contribution to foreign accounts

Most R&D activity is in manufacturing
% R&D
manufacturing
% VA
manifacturing
R&D intesity
manufacturing
Germany 89 23 8
Japan 87 18 11
Italy 70 16 3
United States 70 13 11
France 59 12 10
Spain 44 13 3
United Kingdom 39 12 7
Source: OECD
(2009)

The Wal-Mart archetype
De-location of production to
(e.g.) China
Destruction of good jobs in
the US
Creation of «cheap» jobs
in China
Increase US Imports
Lower prices for US consumers
(who, however, have less income)
Higher Wal-Mart profits

The Wal-Mart archetype
• 1.3 mln employees (largest retailer in the US) • over 15% of U.S. imports of consumer goods
from China• political involvement to reduce trade barriers • each Wal-Mart worker replaces 1.4 retail
workers (-2.7% reduction in retail employment) • Wal-Mart store openings lead to declines in
county-level retail earnings of about 1.5%• NB: all this, net of the effects on US
manufacturing employment

One of the consequences of the patterns of technical change, globalization, de-industrialization, and financialization:
• Growing inequalities

Growing unequal(Gini coefficient, total population after taxes and transfers)
0.15
0.2
0.25
0.3
0.35
0.4
mid-70s mid-80s around 1990 mid-90s around 2000 mid-2000s late-2000s
France Germany Japan
United Kingdom United States OECD Total
Source: OECD

Globalization and inequality in the US• The ratio of redistribution-to-efficiency gains (calculations
based on standard economic assumptions!): a move to (complete) free trade would reshuffle more than $50 of income among different groups for every $1 of net gain (Rodrik, 2012)
• A ten percent increase in occupational exposure to import competition is associated with nearly a 3 percent decline in real wages for workers who perform routine tasks (Ebensteinet al. 2013)
• Rising Chinese import competition between 1990 and 2007 explains one-quarter of the contemporaneous aggregate decline in U.S. manufacturing employment (Autor and Dorn, 2012)
Scenarios and policy options
• (a) Business as usual
– Further weakening of the manufacturing base
– Low rate of growth
– Increasing inequalities
• at best a 2/3 Vs 1/3 society

Scenarios and policy options
• (b) Managing globalization– Science policy– Industrial policy
• Mission oriented programs (equivalent to Apollo/ military space programs)• Pragmatic use of competition policy• Strengthening European ventures such as EADS/Airbus (…Eurofighter Vs F35…)
– Heavy taxation on financial rents (including, but not only Tobin tax)– Heavy progressive taxation in general – Stop a race-to-the-bottom in European fiscal polices
• Examples: FIAT in London!

(US)


Scenarios and policy options
• (c) Shielding Europe from wild globalization
– (b) plus
– Managed trade
• Pragmatic use of tariffs and quotas – It would also help the expansion of Chinese internal market
and Chinese wages…
• A pollution-related tax
• Tariffs modulated on differential union protection of workers

And things to avoid al all costs
• The Transatlantic Trade & Investment Partnership (TTIP).
…With its dominance of the interests of private investors over any political and social concerns (e.g. the right to a healthy life and protection of the environment…)