2013.11.15_oecd-eclac regional consultation_nora lusting
TRANSCRIPT

Inequality in Latin America is high… …but declining since around 2000Decline is pervasive and significant• Larger than the rise in inequality in
1990s• Important contribution to the decline
in poverty• In countries with high growth & low
growth• In countries with left and nonleft
governments• In commodity exporters and importers2
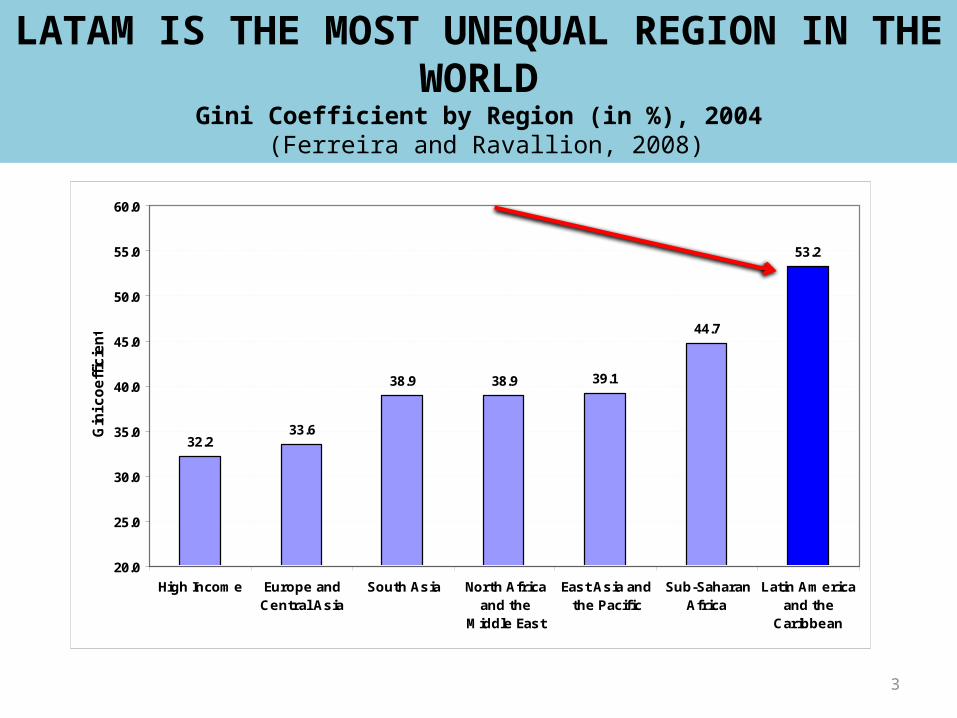
LATAM IS THE MOST UNEQUAL REGION IN THE WORLD
Gini Coefficient by Region (in %), 2004 (Ferreira and Ravallion, 2008)
32.233.6
38.9 38.9 39.1
44.7
53.2
20.0
25.0
30.0
35.0
40.0
45.0
50.0
55.0
60.0
High Income Europe andCentral Asia
South Asia North Africaand the
Middle East
East Asia andthe Pacific
Sub-SaharanAfrica
Latin Americaand the
Caribbean
Gin
i co
eff
icie
nt
3
4
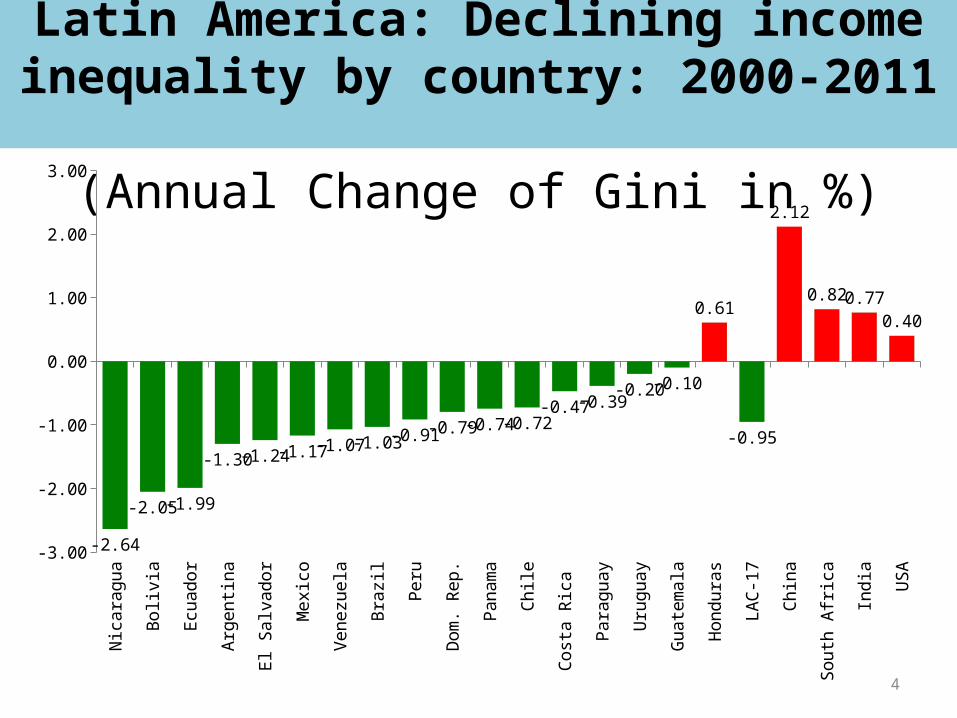
Latin America: Declining income inequality by country: 2000-2011
(Annual Change of Gini in %)N
icar
agu
a
Bol
ivia
Ecu
ador
Arg
enti
na
El S
alva
dor
Mex
ico
Ven
ezu
ela
Bra
zil
Per
u
Dom
. Rep
.
Pan
ama
Chile
Cos
ta R
ica
Par
aguay
Uru
guay
Guat
emal
a
Hon
dura
s
LA
C-1
7
Chin
a
Sou
th A
fric
a
Ind
ia
US
A
-3.00
-2.00
-1.00
0.00
1.00
2.00
3.00
-2.64
-2.05-1.99
-1.30-1.24-1.17-1.07-1.03-0.91-0.79-0.74-0.72-0.47-0.39
-0.20-0.10
0.61
-0.95
2.12
0.820.770.40
5
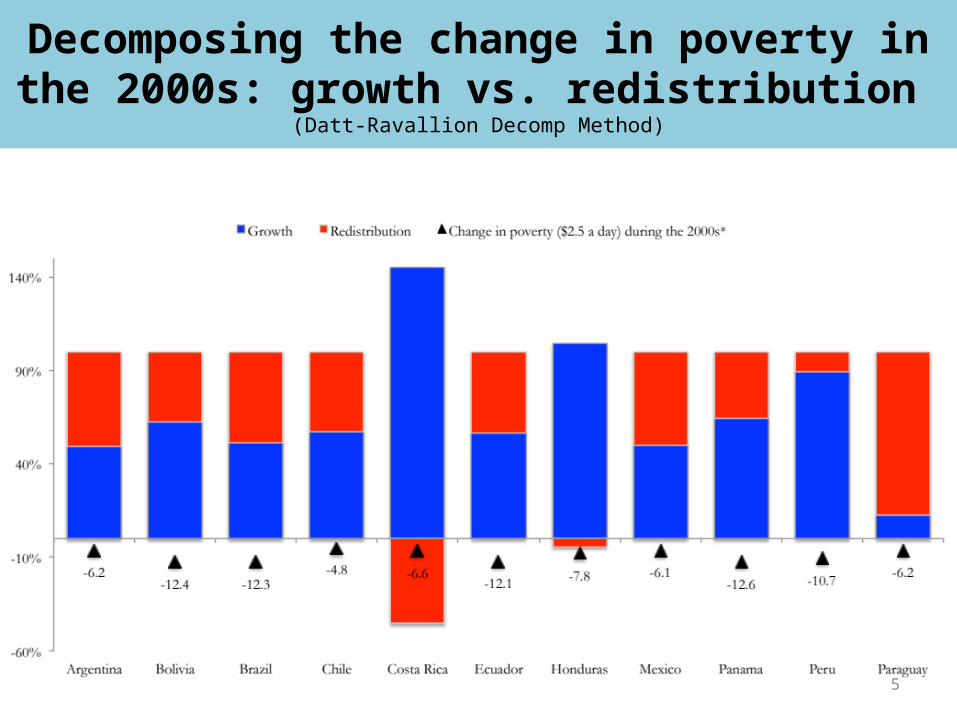
Decomposing the change in poverty in the 2000s: growth vs. redistribution
(Datt-Ravallion Decomp Method)

• Determinants:–Declining inequality of hourly labor income–Larger and more progressive transfers–Lower dependency ratios
6

7
Decomposing Decline in InequalityLabor (red); Transfers (Green);
Demog (Blue) (Azevedo et al. 2012)

Changes in returns to education: 2000-2010 (vis a vis incomplete primary or no education)
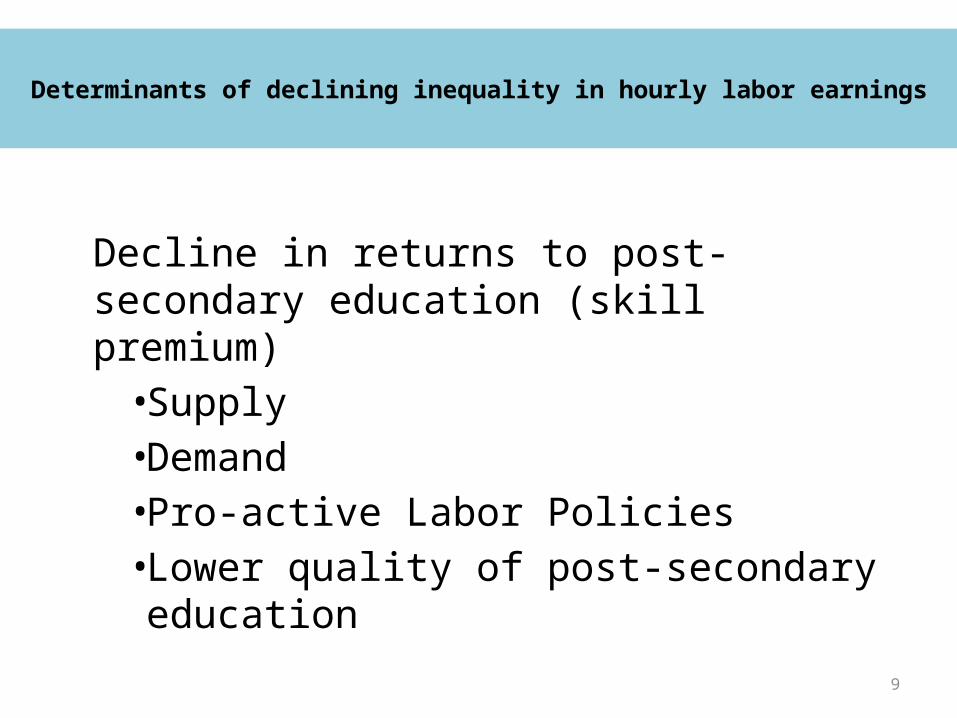
Determinants of declining inequality in hourly labor earnings
Decline in returns to post-secondary education (skill premium)•Supply•Demand• Pro-active Labor Policies• Lower quality of post-secondary education
9

Wage Premium: Supply (blue) vs Demand (demand)

Argentina, Brazil and Mexico
• Argentina: – High growth due to post-2002 recovery– Devaluation in early 2000s => increase in relative demand of low-
skilled workers – Very pro-active labor market policies
• Brazil: – Low growth during most of the period – Increase in relative supply of skilled workers– Increase in relative demand of low-skilled workers– Pro-active labor market policies
• Mexico: – low growth – Increase in relative supply of skilled workers– No pro-active labor market policies
11

How redistributive are Latin American governments?
• Decomposition of changes in inequality by income source show that transfers is, on average, the second most important proximate determinant of decline in overall inequality
• Benefit and tax incidence analysis for 12 countries
• www.commitmentoequity.org
12

13
Commitment to Equity (CEQ), joint project of Tulane University and Inter-American Dialogue. www.commitmentoequity.org

14
Size of States(Primary and Social Spending as %
of GDP)
15
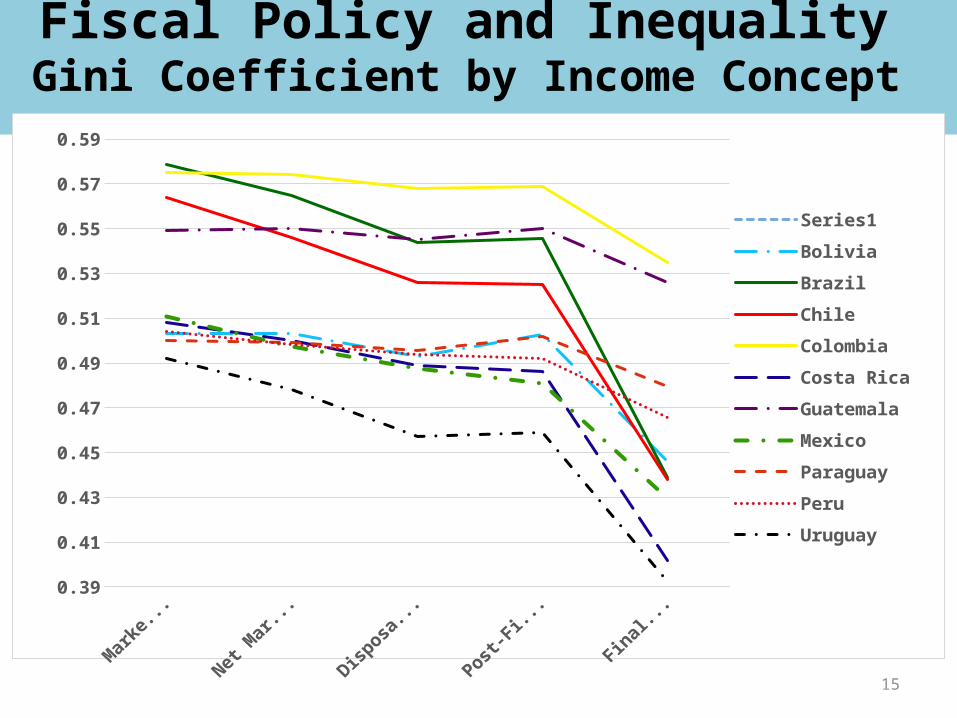
Fiscal Policy and Inequality Gini Coefficient by Income Concept
Market Income
Net Market Income
Disposable Income
Post-Fiscal Income
Final Income
0.39
0.41
0.43
0.45
0.47
0.49
0.51
0.53
0.55
0.57
0.59
Series1
Bolivia
Brazil
Chile
Colombia
Costa Rica
Guatemala
Mexico
Paraguay
Peru
Uruguay

16
Fiscal Policy and Inequality (Gini before and after direct taxes and cash
transfers 2009 or 2010)
Market Income After Direct Taxes After Direct Taxes&Transf0.45
0.47
0.49
0.51
0.53
0.55
0.57
BoliviaBrazilChileColombiaCosta RicaGuatemalaMexicoParaguayPeruUruguay

17
Inequality Reduction by Direct Taxes and Transfers: Brazil, Europe and US
Bra
zil
Gre
ece
Unit
ed S
tate
s
Italy
Port
ugal
Spain
Neth
erl
ands
France
Aust
ria
Germ
any
Sw
eden
Luxe
mbourg
Belg
ium
UK
Finla
nd
Denm
ark
Irela
nd
-0.18-0.16-0.14-0.12-0.1
-0.08-0.06-0.04-0.02
0
Change between Market and Disposable Income Ginis
Source: Higgins et al. (2013) for Brazil and US; Immervoll et al. (2009) for Europe
18
Cash Transfers and Poverty
• Cash transfers reduce extreme poverty by more than 60 percent in Uruguay and Argentina…
….but only by 7 percent in Peru, which spends too little on cash transfers to achieve much poverty reduction

19
Headcount: Before and After Cash Transfers

20
Poverty after Consumption Taxes(Headcount with US$2.50ppp/day)
Market Income
Net Market Income
Disposable Income
Post-Fiscal Income
20.0%
22.0%
24.0%
26.0%
28.0%
30.0%
32.0%
Brazil (2009)
Mexico (2010)
Peru (2009)
21

22
Mexico: Social SpendingInequality Reduction 1996 and 2010
Net Market Income
Disposable Income
Final Income0.42
0.44
0.46
0.48
0.5
0.52
0.54
0.52
0.52
0.490.50
0.49
0.45
19962010G
ini

23
Mexico still less redistributive than peers

24
Thank you!