2014.05.20_oecd-eclac-pse forum_mojon
TRANSCRIPT

Euro area 2014 monetary policy challenges
Benoit MojonBanque de France
Europe and Latin America in an ever-changing global economy
OECD Headquarters ,20 Mai 2014
2
European challenges & global interactions
I’ll focus on the Euro Zone :
1. Where we come from: main stress is behind
2. Where we are: slow and fragile recovery with too low inflation
3. Where we are headed: resolute monetary policy =>
neither deflation
nor too low inflation for too long
0
1
2
3
4
5
6
7
2007m1 2009m1 2011m1 2013m1
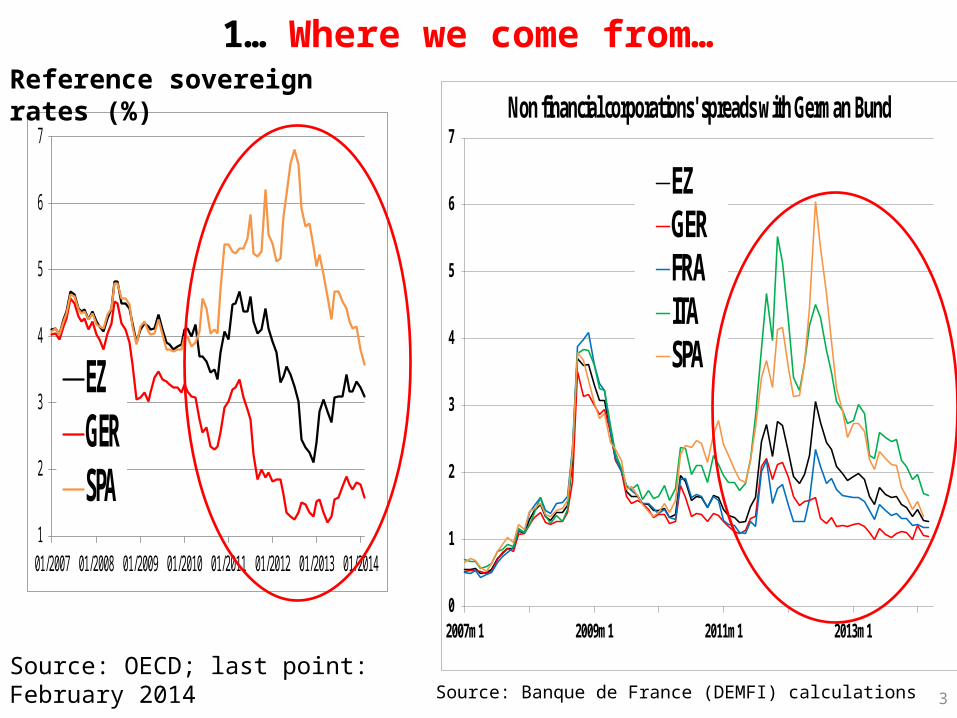
Non financial corporations' spreads with German Bund
EZGERFRAITASPA
Source: Banque de France (DEMFI) calculations
1… Where we come from…
3
Source: OECD; last point: February 2014
1
2
3
4
5
6
7
01/2007 01/2008 01/2009 01/2010 01/2011 01/2012 01/2013 01/2014
EZGERSPA
Reference sovereign rates (%)
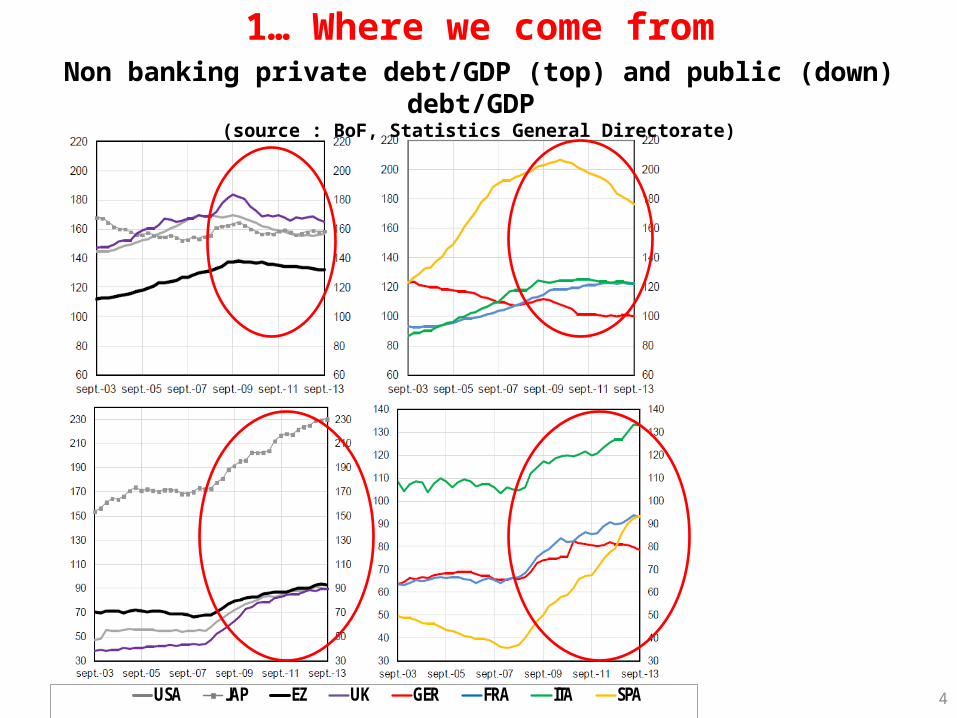
1… Where we come from
4
Non banking private debt/GDP (top) and public (down) debt/GDP (source : BoF, Statistics General Directorate)
0123456789
janv.-00 janv.-00 janv.-00
USA JAP EZ UK GER FRA ITA SPA
5
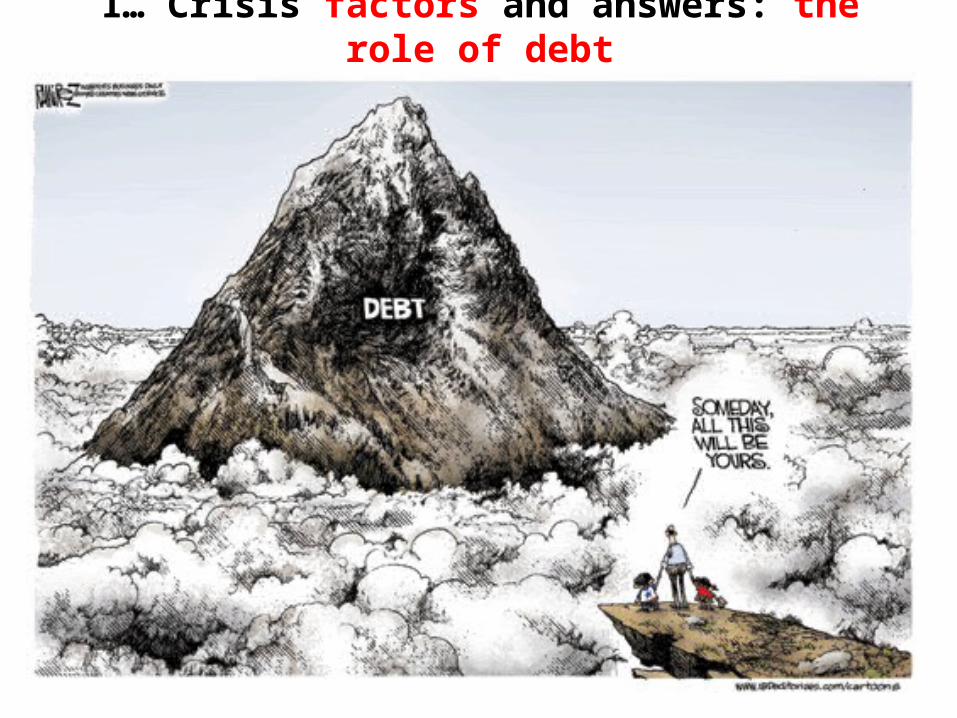
1… Crisis factors and answers: the role of debt
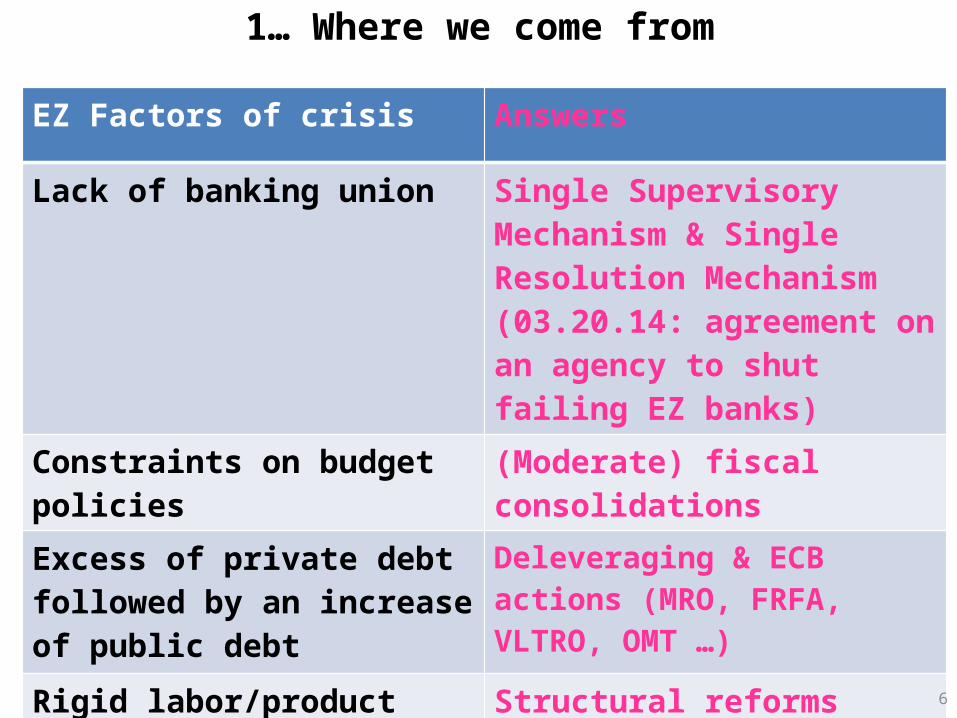
1… Where we come from
EZ Factors of crisis Answers
Lack of banking union Single Supervisory Mechanism & Single Resolution Mechanism (03.20.14: agreement on an agency to shut failing EZ banks)
Constraints on budget policies (Moderate) fiscal consolidations
Excess of private debt followed by an increase of public debt
Deleveraging & ECB actions (MRO, FRFA, VLTRO, OMT …)
Rigid labor/product markets Structural reforms (increase of flexisecurity: Spain, France …)
6

7
2... Where we are: slow and fragile recoveryGDP growth projections (source: IMF WEO, April 2014)
-5
-4
-3
-2
-1
0
1
2
3
4
2006 2007 2008 2009 2010 2011 2012 2013 2014 2015
United States
Eurozone
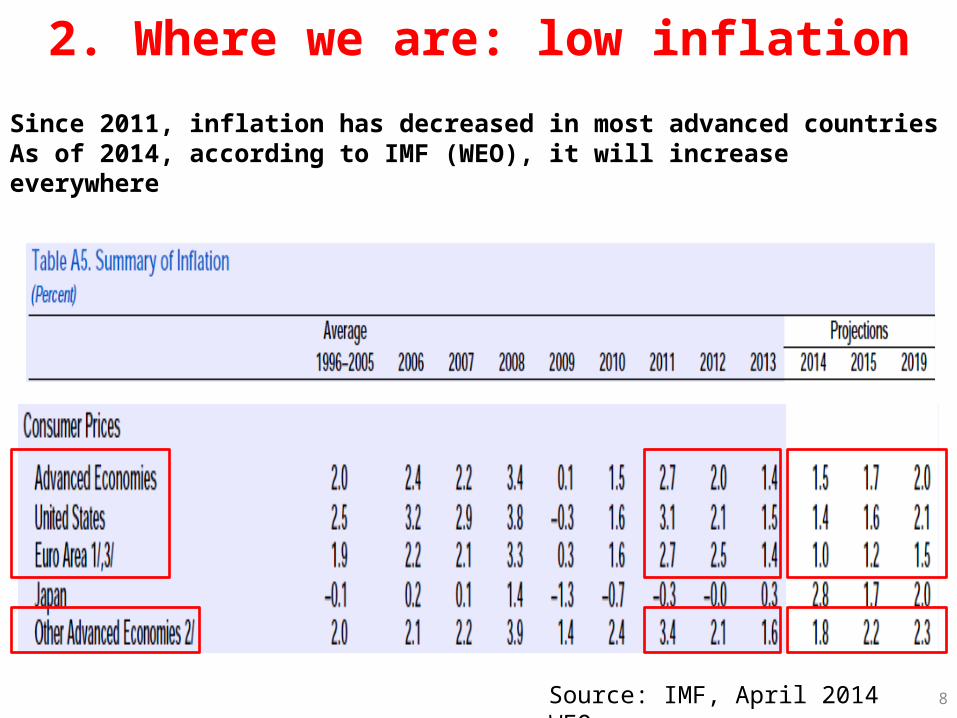
2. Where we are: low inflation
Since 2011, inflation has decreased in most advanced countriesAs of 2014, according to IMF (WEO), it will increase everywhere
8Source: IMF, April 2014 WEO
-4
-2
0
2
4
6
8
-4
-2
0
2
4
6
8
2007 2008 2009 2010 2011 2012 2013 2014
ZEDEFRITESMINMAX
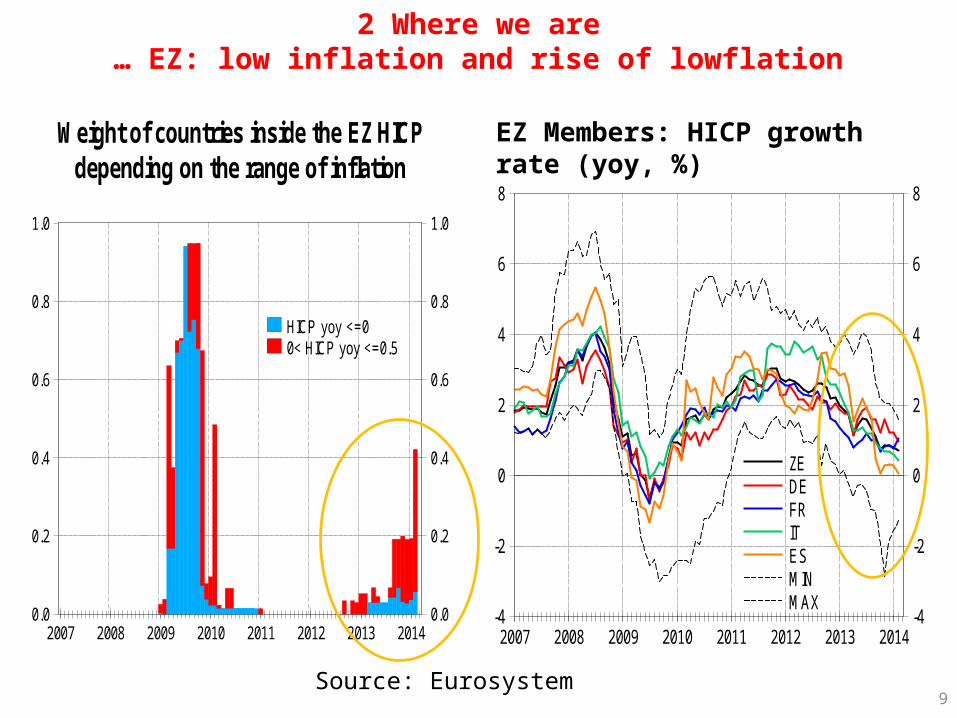
2 Where we are… EZ: low inflation and rise of lowflation
9
0.0
0.2
0.4
0.6
0.8
1.0
0.0
0.2
0.4
0.6
0.8
1.0
2007 2008 2009 2010 2011 2012 2013 2014
HICP yoy <=00< HICP yoy <=0.5
Weight of countries inside the EZ HICPdepending on the range of inflation
Source: Eurosystem
EZ Members: HICP growth rate (yoy, %)
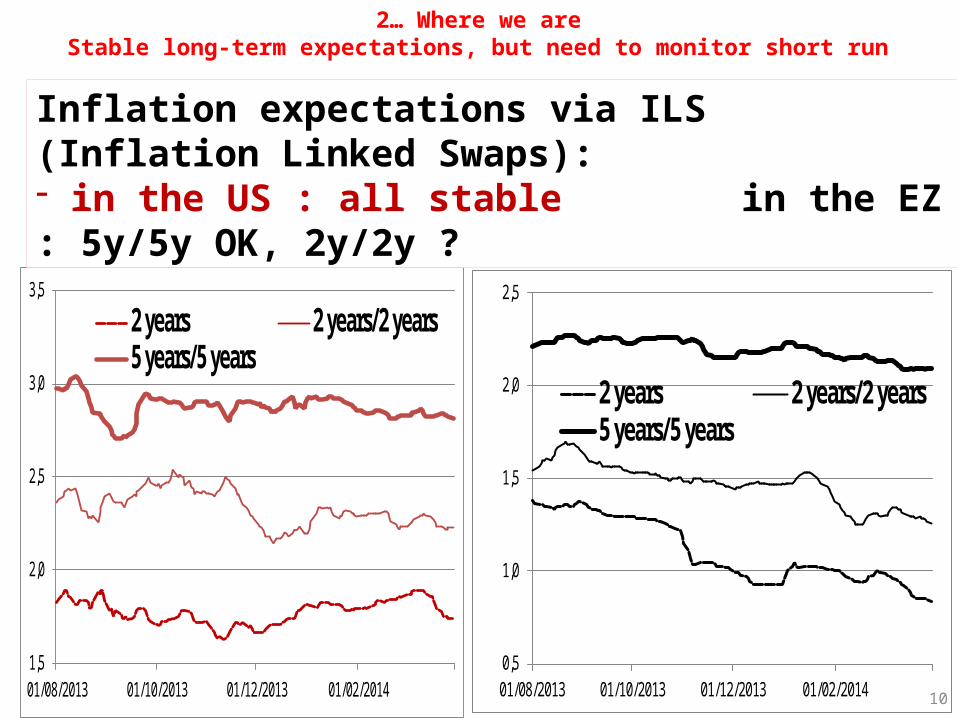
2… Where we areStable long-term expectations, but need to monitor short run
0,5
1,0
1,5
2,0
2,5
01/08/2013 01/10/2013 01/12/2013 01/02/2014
2 years 2 years/2 years5 years/5 years
1,5
2,0
2,5
3,0
3,5
01/08/2013 01/10/2013 01/12/2013 01/02/2014
2 years 2 years/2 years5 years/5 years
10
Inflation expectations via ILS (Inflation Linked Swaps):- in the US : all stable in the EZ : 5y/5y OK, 2y/2y ?
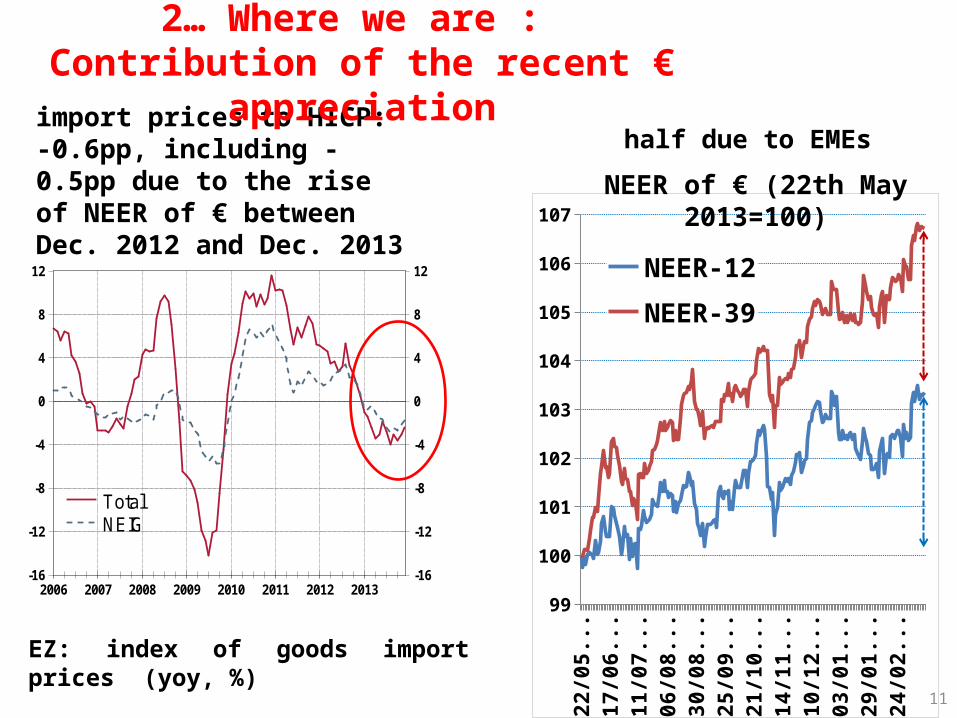
half due to EMEs
11
May
-13
Jun-
13Ju
n-13
Jul-1
3Au
g-13
Aug-
13Se
p-13
Oct
-13
Oct
-13
Nov
-13
Nov
-13
Dec-
13Ja
n-14
Jan-
14Fe
b-14
Mar
-14
99
100
101
102
103
104
105
106
107
NEER-12
NEER-39
NEER of € (22th May 2013=100)
EZ: index of goods import prices (yoy, %)
-16
-12
-8
-4
0
4
8
12
-16
-12
-8
-4
0
4
8
12
2006 2007 2008 2009 2010 2011 2012 2013
TotalNEIG
import prices to HICP:-0.6pp, including -0.5pp due to the rise of NEER of € between Dec. 2012 and Dec. 2013
2… Where we are : Contribution of the recent € appreciation
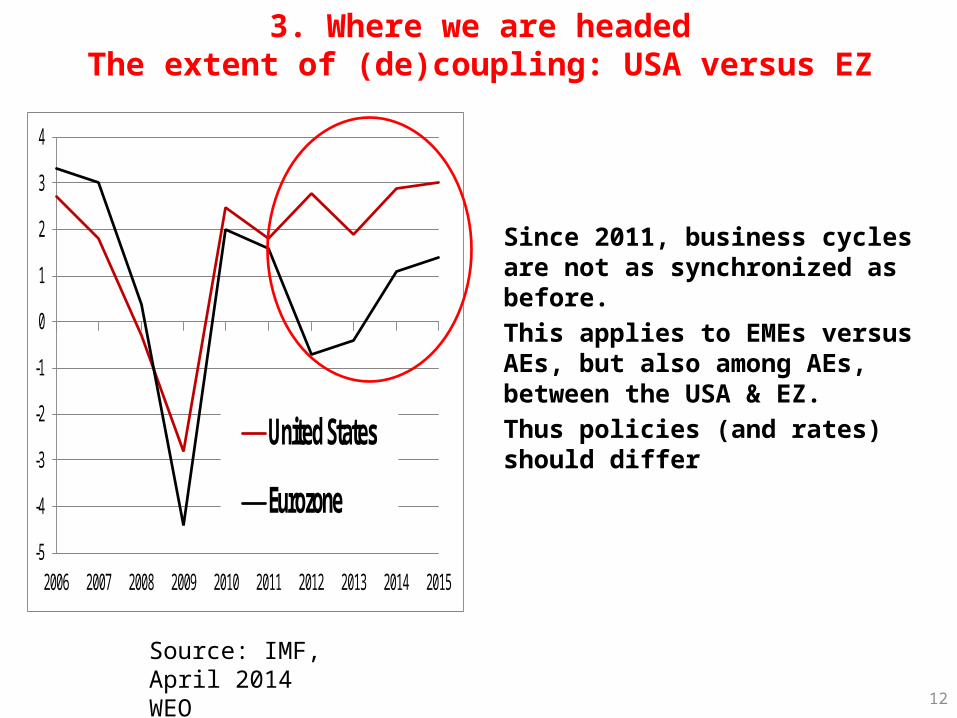
3. Where we are headedThe extent of (de)coupling: USA versus EZ
Since 2011, business cycles are not as synchronized as before.This applies to EMEs versus AEs, but also among AEs, between the USA & EZ. Thus policies (and rates) should differ
12
Source: IMF, April 2014 WEO
-5
-4
-3
-2
-1
0
1
2
3
4
2006 2007 2008 2009 2010 2011 2012 2013 2014 2015
United States
Eurozone
Banque de France Direction générale des Études et des Relations internationales
3. Global (de)coupling versus spillovers
14
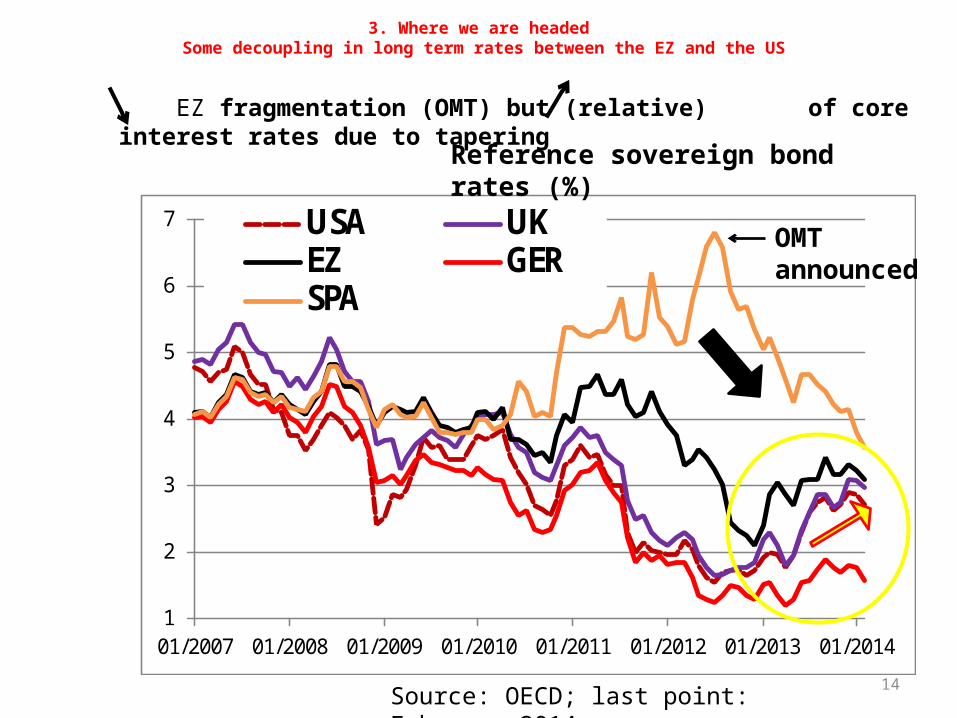
3. Where we are headed Some decoupling in long term rates between the EZ and the US
1
2
3
4
5
6
7
01/2007 01/2008 01/2009 01/2010 01/2011 01/2012 01/2013 01/2014
USA UKEZ GERSPA
EZ fragmentation (OMT) but (relative) of core interest rates due to tapering
Source: OECD; last point: February 2014
OMT announced
Reference sovereign bond rates (%)
3M 6M 1Y 2Y 3Y 4Y 5Y 6Y 7Y 8Y 9Y 10Y-1
0
1
2
3
4
June '13Jul'13 - Feb'14
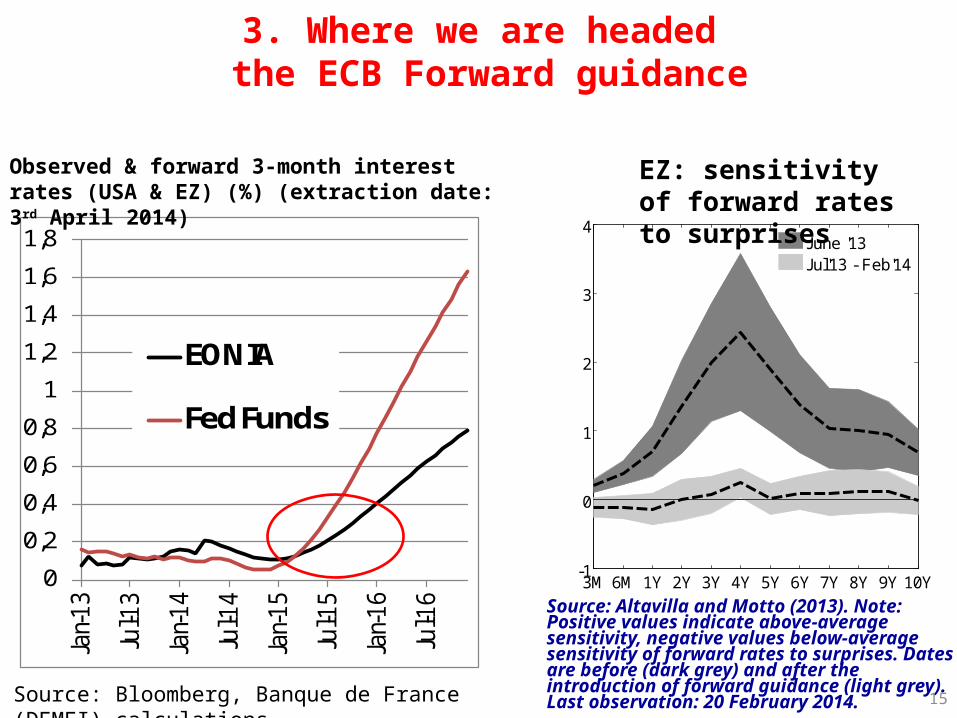
Source: Altavilla and Motto (2013). Note: Positive values indicate above-average sensitivity, negative values below-average sensitivity of forward rates to surprises. Dates are before (dark grey) and after the introduction of forward guidance (light grey). Last observation: 20 February 2014.
15
3. Where we are headed the ECB Forward guidance
0
0,2
0,4
0,6
0,8
1
1,2
1,4
1,6
1,8
Jan-
13
Jul-1
3
Jan-
14
Jul-1
4
Jan-
15
Jul-1
5
Jan-
16
Jul-1
6
EONIA
Fed Funds
Source: Bloomberg, Banque de France (DEMFI) calculations
Observed & forward 3-month interest rates (USA & EZ) (%) (extraction date: 3rd April 2014)
EZ: sensitivity of forward rates to surprises
16
Conclusion
The European recovery is under way
Current low inflation should be transitory and does not mean deflation
ECB policy is focused on delivering price stability and it will, whatever happens to US interest rates

17
RESERVE SLIDES

18
Fiscal consolidation but keeping in mind growth
Source: IMF, April 2014 WEO
19
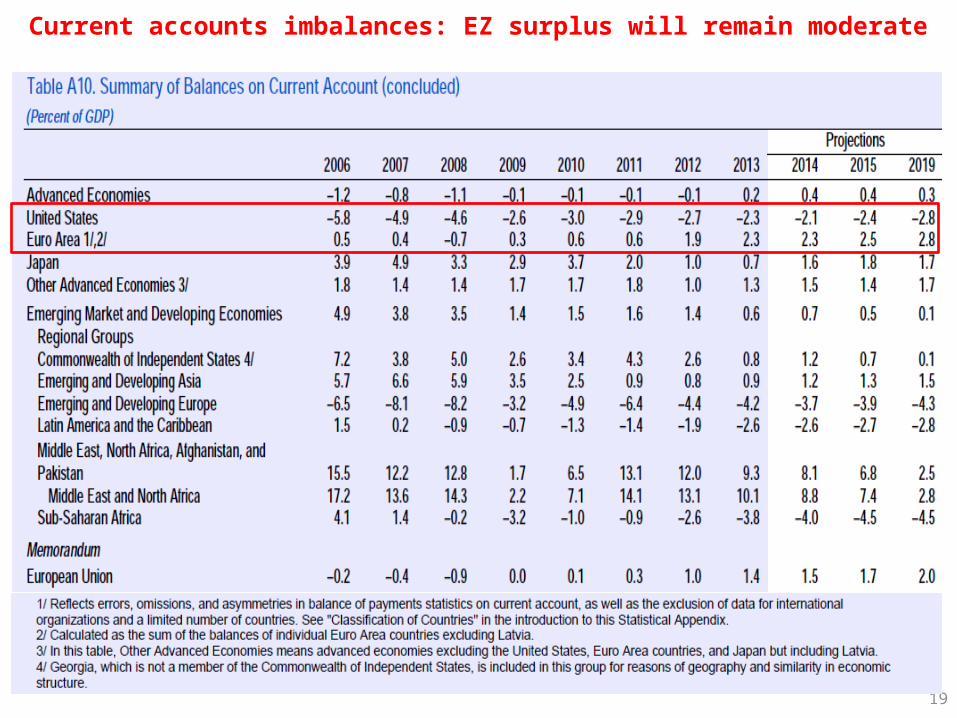
Current accounts imbalances: EZ surplus will remain moderate
20
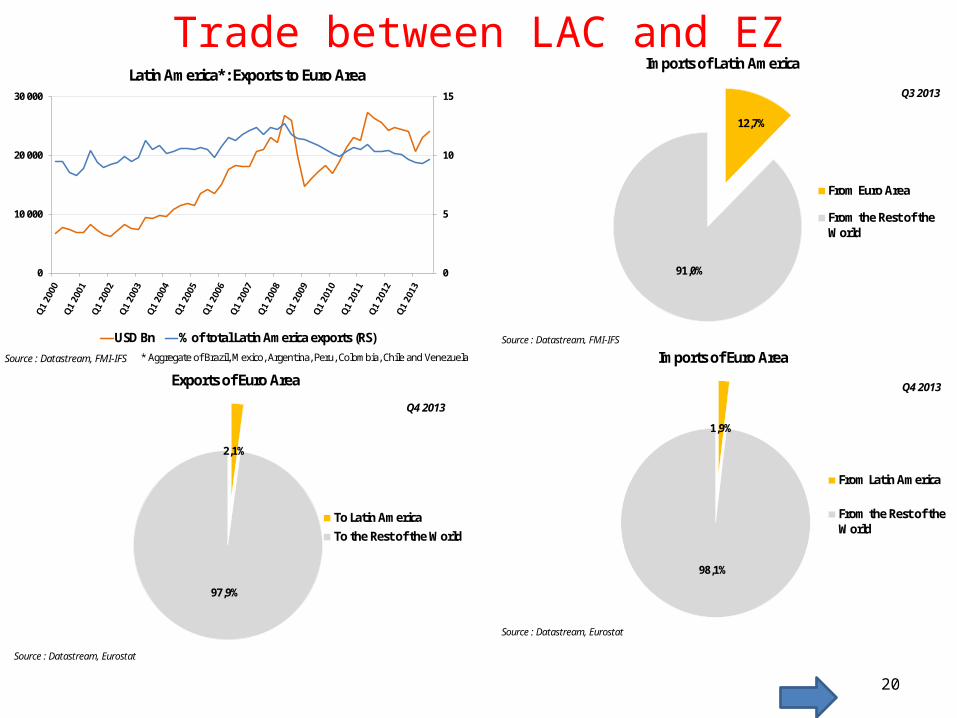
12,7%
91,0%
Imports of Latin America
From Euro Area
From the Rest of theWorld
Source : Datastream, FMI-IFS
Q3 2013
2,1%
97,9%
Exports of Euro Area
To Latin AmericaTo the Rest of the World
Source : Datastream, Eurostat
Q4 2013
1,9%
98,1%
Imports of Euro Area
From Latin America
From the Rest of theWorld
Source : Datastream, Eurostat
Q4 2013
Trade between LAC and EZ
0
5
10
15
0
10 000
20 000
30 000
Latin America*: Exports to Euro Area
USD Bn % of total Latin America exports (RS)
Source : Datastream, FMI-IFS * Aggregate of Brazil, Mexico, Argentina, Peru, Colombia, Chile and Venezuela
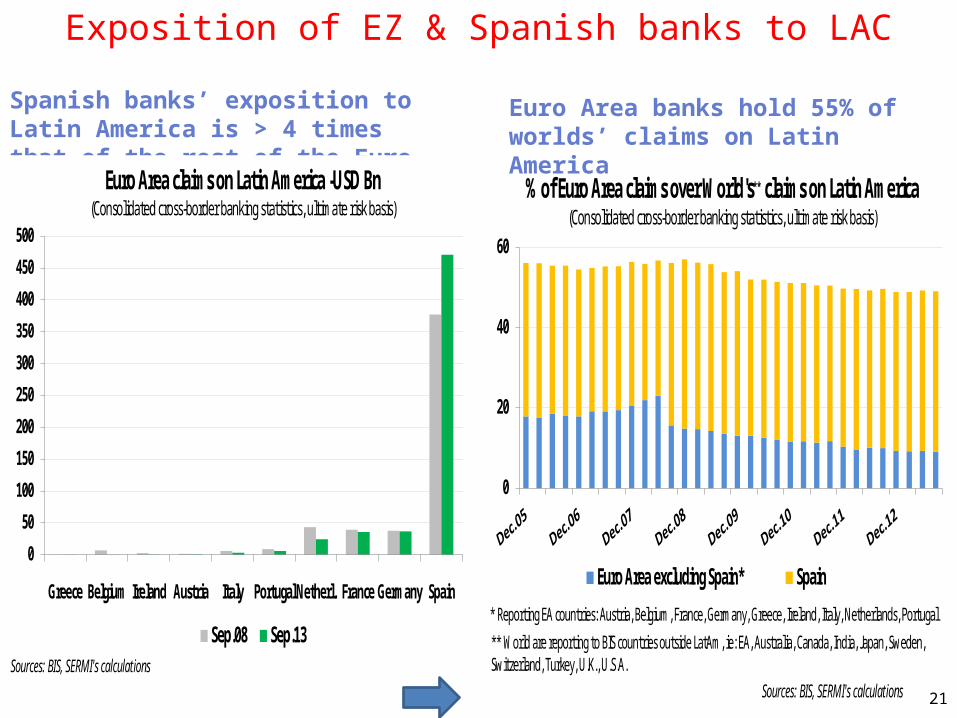
Spanish banks’ exposition to Latin America is > 4 times that of the rest of the Euro Area
0
50
100
150
200
250
300
350
400
450
500
Greece Belgium Ireland Austria Italy Portugal Netherl. France Germany Spain
Sep.08 Sep.13
Euro Area claims on Latin America -USD Bn(Consolidated cross-border banking statistics, ultimate risk basis)
Sources: BIS, SERMI's calculations
0
20
40
60
Euro Area excluding Spain* Spain
% of Euro Area claims over World's** claims on Latin America (Consolidated cross-border banking statistics, ultimate risk basis)
Sources: BIS, SERMI's calculations
* Reporting EA countries: Austria, Belgium, France, Germany, Greece, Ireland, Italy, Netherlands, Portugal
** World are reporting to BIS countries outside LatAm, ie: EA, Australia, Canada, India, Japan, Sweden, Switzerland, Turkey, U.K., U.S.A.
Euro Area banks hold 55% of worlds’ claims on Latin America
21
Exposition of EZ & Spanish banks to LAC