2014.05.20_oecd-eclac-pse forum_miotti
TRANSCRIPT

DIVERSIFICATION PRODUCTIVE :
SCIENCE, TECHNOLOGIE, INNOVATION
… ÉDUCATION?
Egidio Luis Miotti
Université de Paris Nord (CEPN-CNRS)Directeur Scientifique (Adj.) –
Ministère de l’Enseignement Supérieur et de la Recherche
(MESR)Direction générale de la recherche et de l’innovation
– Politiques d'incitation à la R&D des entreprises
02 Session : Global change, labour market dynamics and the sectoral
structure of production
Europe and Latin America in the wake on global paradigm shifts and
new trends in the world economy
Paris, OCDE Headquarters, 20-21 May 2014

LA PROBLEMATIQUE
o Most countries in Europe and Latin America and the Caribbean
have been very much affected by competition from emerging
Asian countries in manufacturing. This raises the following
questions: What policies can governments adopt to reduce
vulnerability and improve the competitiveness of their
economies in this new scenario? To want extent have these
global trends redefined production and technological leads and
lags and created imbalances?
o The optimal policy emphasis might not be on industry per se, but
more generally on the diversification of the sectoral structure of
production …

Science, technologie, production
LOCALISATION DES ACTIVITÉS

LOCALISATION DES ACTIVITÉS PRODUCTIVES(AVANTAGES COMPARATIVES RÉVÉLÉS – 2009)

SIMILARITÉS DES SPÉCIALISATIONS SCIENTIFIQUES (2011)

BREVETS ET PUBLICATIONS SCIENTIFIQUES(AXES 1 ET 2 – ANALYSE EN COMPOSANTES PRINCIPALES)

BREVETS ET PUBLICATIONS SCIENTIFIQUES(VAGUES SCIENTIFIQUES ET TECHNOLOGIQUES ET PAYS CONCERNÉS)

DEMANDES DE BREVETS AUPRÈS D’EPO(1978-2013, NOMBRE ET %0)
1978-1990 1990-2000 2000-2013 TOTAL 1978-1990 1990-2000 2000-2013 TOTAL
MONDE 493 643 811 031 1 426 021 2 730 695 1 000.000 1 000.000 1 000.000 1 000.000
Argentine 57 249 454 760 0.115 0.307 0.318 0.278
Brésil 177 538 2 023 2 738 0.359 0.663 1.419 1.003
Chili 14 44 296 354 0.028 0.054 0.208 0.130
Colombie 21 28 103 152 0.043 0.035 0.072 0.056
Mexico 60 181 582 823 0.122 0.223 0.408 0.301
Pérou 2 3 14 19 0.004 0.004 0.010 0.007
Amérique Latine 374 1 165 3 568 5 107 0.758 1.436 2.502 1.870
Australie 4 099 5 804 10 664 20 567 8.304 7.156 7.478 7.532
Canada 4 502 10 548 23 463 38 513 9.120 13.006 16.453 14.104
Nouvelle Zélande 428 822 1 872 3 122 0.867 1.014 1.313 1.143
Corée du Sud 199 5 620 46 038 51 857 0.403 6.929 32.284 18.990
Taiwan 54 324 8 156 8 534 0.109 0.399 5.719 3.125

DEMANDES DE BREVETS AUPRÈS D’EPO (NOMBRE)
-
500
1,000
1,500
2,000
2,500
3,000
19
78
19
79
19
80
19
81
19
82
19
83
19
84
19
85
19
86
19
87
19
88
19
89
19
90
19
91
19
92
19
93
19
94
19
95
19
96
19
97
19
98
19
99
20
00
20
01
20
02
20
03
20
04
20
05
20
06
20
07
20
08
20
09
20
10
Amérique Latine Australie Canada
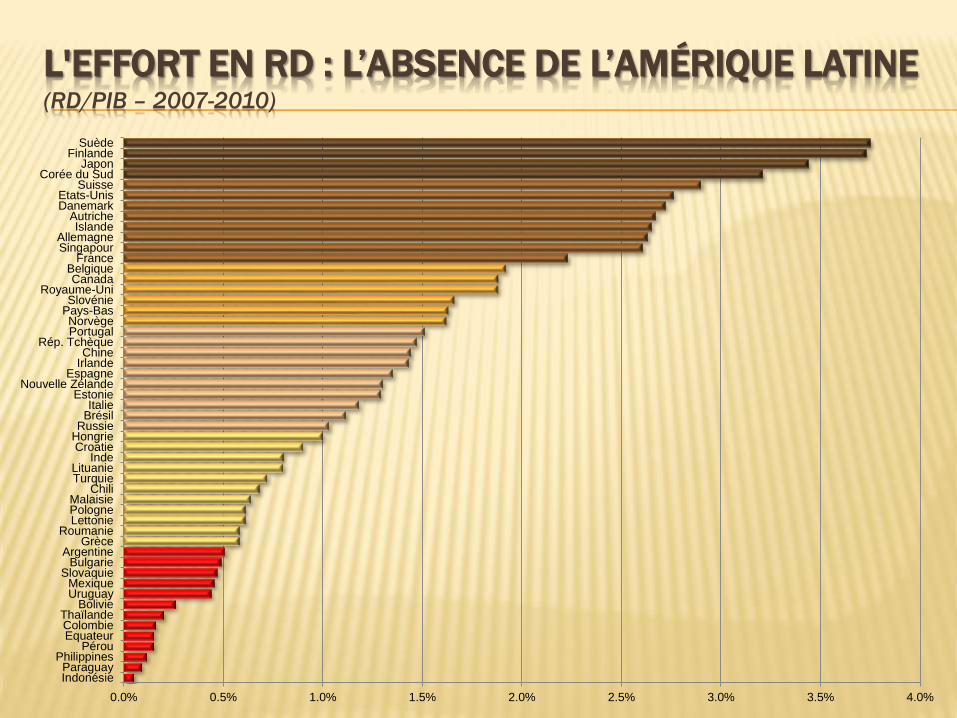
L'EFFORT EN RD : L’ABSENCE DE L’AMÉRIQUE LATINE (RD/PIB – 2007-2010)
0.0% 0.5% 1.0% 1.5% 2.0% 2.5% 3.0% 3.5% 4.0%
IndonésieParaguay
PhilippinesPérou
EquateurColombieThaïlande
BolivieUruguayMexique
SlovaquieBulgarie
ArgentineGrèce
RoumanieLettoniePologneMalaisie
ChiliTurquieLituanie
IndeCroatieHongrieRussieBrésilItalie
EstonieNouvelle Zélande
EspagneIrlandeChine
Rép. TchèquePortugalNorvège
Pays-BasSlovénie
Royaume-UniCanada
BelgiqueFrance
SingapourAllemagne
IslandeAutriche
DanemarkEtats-Unis
SuisseCorée du Sud
JaponFinlande
Suède

L’INNOVATION COMME MODELE DE CATCHING-UP

L’ÉVOLUTION DES POLITIQUES STRUCTURELLES
Période Légitimité Ampleur InstrumentsHiérarchie des politiques
structurelles
1950-1970Monde fermé avec rareté dans la disponibilité des devises
Sectoriel Droits de douane Politiques industrielles
Guerre froide Verticales Politiques fiscales/subventions Politiques de la concurrence
Régimes de croissance autocentrés Infrastructure (parcs industriels)
Grands programmes (Nucléaire, Aéronautique, Télécommunications, Industrie lourde)
1980-1990 Perte de légitimité Démantèlement des procédures et barrières Politiques de la concurrence
Globalisation commerciale et financière
Politiques de compétitivité
1990-2000Nouvelle légitimité dans les politiques d'innovation
Globales Politiques fiscales/subventions Politiques de la concurrence
"Nouvelle économie" Horizontales Infrastructure (pôles technologiques) Politiques de compétitivité
Industries et services
Politiques scientifiques et technologiques
2010 - … Accélération des délocalisations .. Secteurs émergents Politiques fiscales/subventionsPolitiques scientifiques et technologiques
Ré-industrialisation ? …Le retour des Grands programmes ? (Santé, Economie verte, dénucléarisation, …)
Politiques de compétitivité
Politiques de la concurrence

LES RISQUES DE L’INTERVENTION
o Il ne s’agit pas uniquement d’un problème d’évaluation d’impact des politiquespubliques, même si celui-ci est un sujet d’importance cruciale. Il s’agit deminimiser les risques que telle politique peut engendrer en termes declientélisme, corruption et de recherche des rentes (Rodrick, 2004).
o Tel que signalé par Rodrick et Hausmann (2003), l’une des grandes différencesentre les politiques industrielles asiatiques et latino-américaines est que lespremières ont utilisé tant le bâton que la carotte, tandis que les dernières ontprivilégié uniquement la carotte. Ainsi, en Amérique latine, à côté de quelquesrares “champions”, on trouve un grand nombre de choix qui se sont avérésinefficaces, donnant lieu à l’idée du “protectionnisme frivole” de Fanjnzylber(1983).
o En effet, l’idée de base est que la véritable difficulté de la mise en œuvre d’unepolitique structurelle d’intervention ne se trouve pas dans la détection de“champions” (tout en demeurant difficile pour certains, impossible pour d’autres),sinon dans la capacité d’abandonner, plus ou moins rapidement, les perdants,en évitant des transferts inutiles (coûts sociaux et d’opportunité pour lesressources publiques) et l’inefficacité en termes productifs.

LES POLITIQUES D’INCITATION À LA R&D

POURQUOI FAUT IL UNE POLITIQUE D’INCITATION À LA
R&D ?
Firms cannot fully appropriate the benefits of their R&D investments: Patents
are circumvented in different ways, and valuable process and product
innovations are emulated more or less quickly. Even when intellectual property
rights are enforced effectively, R&D generates positive externalities that spill
over to other firms and benefit the economy at large. Firms thus tend to invest
less in R&D projects than they should since they know that other firms will
capture part of the returns, or they tend to wait for other firms to engage in R&D
projects rather than doing so themselves. As a result firms will normally tend to
increase their R&D expenditures to the size where their expected private
returns and marginal costs will match, but they will not increase them further to
the level that would equalize marginal social costs and marginal social returns
and maximize economic efficiency and social welfare. This market failure can
be corrected by direct public funding of research activities performed by public
research organizations and universities and by economic policies supporting
private R&D.
Damien Ientile et Jacques Mairesse - 2009

POURQUOI VOULOIR INTERVENIR?
• The closer an economy is to the world technology frontier, the higher the
relative importance of innovation relative to imitation as a source of
productivity growth.
• Because the selection of high-skill entrepreneurs and firms is more
important for innovation than for adoption, firms in countries that are far from
the technology frontier pursue an investment-based strategy, which features
long-term relationships, high average size and age of firms, large
investments, but little selection.
• Closer to the technology frontier, there is less room for copying and adoption
of well-established technologies; consequently, there is an equilibrium
switch to an innovation-based strategy with short-term relationships,
younger firms, less investment, and better selection of entrepreneurs.

POURQUOI VOULOIR INTERVENIR?
• We showed that economies may switch out of the investment-based
strategy too soon or too late. A standard appropriability effect, resulting from
the fact that firms do not internalize the greater consumer surplus they
create by investing more, implies that the switch may occur too soon.
• In contrast, the presence of retained earnings that incumbent entrepreneurs
can use to shield themselves from competition makes the investment-based
strategy persist for too long.
• When the switch is too soon, government intervention in the form of policies
limiting product market competition or providing subsidies to investment may
be useful because it encourages the investment-based strategy.
• Nevertheless, anticompetitive policies can also lead to a non convergence
trap whereby the economy never switches out of the investment-based
strategy and fails to converge to the world technology frontier.
Daron Acemoglu (MIT) Philippe Aghion (Harvard) Fabrizio Zilibotti (IIES) - 2006

COMMENT INTERVENIR?
o Les subventions à la R&D et les aides fiscales de type crédit d'impôt recherche (CIR)
sont deux modes privilégiés d’aides qui sont supposés complémentaires. La
combinaison de ces outils est cependant hétérogène.
o La popularité croissante des systèmes fiscaux d’aide à la R&D repose d’une part sur
leur généralité, d’autre part sur leur malléabilité. En théorie, toutes les entreprises
peuvent bénéficier d’un tel système, quelles que soient leurs caractéristiques. Dans la
pratique, les aides fiscales à la R&D peuvent être ciblées sur des groupes spécifiques
d'entreprises selon leur secteur, leur taille, leur âge, leur emplacement, leurs liens avec
les laboratoires universitaires et leur technologie (voir Lhuillery, 1996; OCDE, 2010).
o L'attractivité des régimes fiscaux à la R&D repose également sur leur facilité de mise
en œuvre, de modification ou de suppression. Contrairement aux subventions, ils ne
rencontrent pas les problèmes liés au manque d'information sur les innovateurs, les
coûts de procédures bureaucratiques ou de suppression, ou les pressions potentielles
de lobbying. En revanche, les subventions à la R&D peuvent être préférées aux crédits
d'impôt recherche en raison de la possible discrimination entre projets et l’opportunité
de financer uniquement les entreprises les plus innovantes, celles dont l’impact sur le
bien-être social est supérieur. En outre, les subventions à la R&D semblent plus
appropriées que les crédits d'impôt, en particulier ceux en accroissement, pour contrer
les cycles économiques et leurs effets, en particulier dans la phase de ralentissement
(lorsque les entreprises ayant des contraintes budgétaires sévères coupent dans leur
budget de R&D).

DIRECT GOVERNMENT FUNDING OF BERD (2011, EN % DU PIB)
0.00 0.04 0.08 0.12 0.16 0.20 0.24 0.28 0.32 0.36 0.40
MexicoChile (2010)
Australia (2010)Poland
Switzerland (2008)Slovak Republic
TurkeyJapan
PortugalLuxembourg (2009)
ItalySouth Africa (2009)
NetherlandsCanada
China (2009)Denmark
Ireland (2010)New Zealand
FinlandNorway
GermanyUnited KingdomBelgium (2010)
EstoniaBrazil (2010)
AustriaHungarySweden
Spain (2010)France
Czech RepublicIsrael (2010)
KoreaUnited States
SloveniaRussian Federation

INDIRECT GOVERNMENT SUPPORT THROUGH R&D
TAX INCENTIVES (2011, EN % DU PIB)
0.00 0.04 0.08 0.12 0.16 0.20 0.24 0.28
MexicoPoland
Switzerland (2008)Luxembourg (2009)
New ZealandFinland
GermanyEstoniaSweden
Slovak RepublicChile (2010)
ItalySouth Africa (2009)Russian Federation
Spain (2010)Turkey
China (2009)Denmark
NorwayBrazil (2010)
Czech RepublicUnited States
SloveniaJapan
United KingdomHungaryPortugal
Australia (2010)Austria
Ireland (2010)Netherlands
Belgium (2010)Korea
CanadaFrance

TOTAL GOVERNMENT SUPPORT (DIRECT AND TAX) TO
BUSINESS R&D (2011, EN % DU PIB)
0.00 0.04 0.08 0.12 0.16 0.20 0.24 0.28 0.32 0.36 0.40 0.44
MexicoChile (2010)
PolandSwitzerland (2008)
Slovak RepublicLuxembourg (2009)
ItalySouth Africa (2009)
TurkeyNew Zealand
FinlandGermany
JapanChina (2009)
DenmarkEstonia
PortugalSweden
Australia (2010)Norway
Spain (2010)Brazil (2010)
United KingdomNetherlands
Ireland (2010)Hungary
Czech RepublicAustria
CanadaBelgium (2010)
United StatesSloveniaFranceKorea
Russian Federation
Direct government funding of BERD
Indirect government support through R&D tax incentives

MAIS …
o Le problème de l’opportunité de passer à un modèle intensif en
technologie n’est pas de facile …
o … sur tout en présence des comportements rentiers et absence relative
d’entrepreneurs schumpetériens …
o … ou de fortes volatilités macroéconomiques
o Pas toute R&D / innovation est à la portée de tout le monde.
o Exemple des nanotechnologies qui se trouvent très concentrées du
point de vue géographique

DEUX EXEMPLES DE STRATÉGIES OPPOSÉES
o Mexique (R&D/PIB = 0.34) : localisation de segments productifs
intensifs en main d’œuvre et en économies d’échelle d’entreprises
américaines (maquila).
o Corée du Sud (R&D/PIB = 2.50) : «remontée de filière» et système
endogène d’apprentissage technologique. (Voir : Miotti L. et F. Sachwald,
"Foreign Direct Investment as a Technology Sourcing Strategy. The Case of Korean
Multinationals", En Robert Lipsey and Jean-Louis Mucchielli (eds), Multinational Firms'
Strategies, Edward Elgar, 2001.)
23

0
2500
5000
7500
10000
12500
15000
17500
20000
22500
25000
19
60
19
62
19
64
19
66
19
68
19
70
19
72
19
74
19
76
19
78
19
80
19
82
19
84
19
86
19
88
19
90
19
92
19
94
19
96
19
98
20
00
20
02
20
04
20
06
20
08
Mexique Corée du Sud
CORÉE ET MEXIQUE : PERFORMANCES COMPARÉESPIB PAR HABITANT, U$ CONSTANTS EN PPA
Bas salaires contre intensité en technologie

DEMANDES DE BREVETS AUPRÈS D’EPO (NOMBRE)
-
1,000
2,000
3,000
4,000
5,000
6,000
19
78
19
79
19
80
19
81
19
82
19
83
19
84
19
85
19
86
19
87
19
88
19
89
19
90
19
91
19
92
19
93
19
94
19
95
19
96
19
97
19
98
19
99
20
00
20
01
20
02
20
03
20
04
20
05
20
06
20
07
20
08
20
09
20
10
20
11
Mexique Corée du Sud Taiwan
Argentine, Mexique, Brésil, Espagne, France et Suisse
UNE ANALYSE MICROÉCONOMIQUE
COMPARATIVE DE 6 PAYS

STATISTIQUES DESCRIPTIVES
Variables Argentine Mexique Brésil Espagne Suisse France
Surveyed period 1998-2001 1999-2000 1998-2000 2002-2004 1998-2001 1998-2000
Observations 1 308 1 515 6 840 3 559 925 4 618
Internal R&D engagement 29.1% 18.1% 30.5% 64.7% 54.7% 44.7%
Innovator 63.3% 34.4% 68.6% 75.3% 79.4% 54.3%
Product innovator 51.8% 27.3% 33.8% 59.4% 72.1% 47.3%
Process innovator 53.7% 23.8% 48.5% 58.8% 59.4% 32.9%
Exporter 57.3% 57.2% 46.5% 80.9% 78.8% 84.1%
Exports share 12.4% 16.4% 8.7% 25.2% 36.9% 22.8%
Public funding 2.0% 1.3% 8.6% 24.6% 5.3% 17.7%
Cooperating with national partner 9.9% 6.7% 10.1% 29.6% 3.8% 22.5%
Cooperating with international partner 8.2% 4.8% 5.1% 13.8% 13.9% 17.6%

R&D ENGAGEMENT AND EXPORTS(SHARE IN TOTAL SAMPLE)
29.1%
18.1%
30.5%
64.7%
54.7%
44.7%
57.3% 57.2%
46.5%
80.9%78.8%
84.1%
0%
10%
20%
30%
40%
50%
60%
70%
80%
90%
Argentina Mexico Brazil Spain Switzerland France
Internal R&D engagement
Exporter

R&D ENGAGEMENT AND EXPORTS SHARE
29.1%
18.1%
30.5%
64.7%
54.7%
44.7%
12.4%
16.4%
8.7%
25.2%
36.9%
22.8%
0%
10%
20%
30%
40%
50%
60%
70%
Argentina Mexico Brazil Spain Switzerland France
Internal R&D engagement
Exports share

COOPERATION EN R&D / INNOVATION
9.9%
6.7%
10.1%
29.6%
3.8%
22.5%
8.2%
4.8% 5.1%
13.8% 13.9%
17.6%
0%
5%
10%
15%
20%
25%
30%
35%
Argentine Mexique Brésil Espagne Suisse France
Coopération avecpartenaires nationaux
Coopération avecpartenaires étrangers

LA CAPACITÉ DES SNI A CRÉER DES RÉSEAUX
0%
3%
6%
9%
12%
15%
18%
21%
0% 5% 10% 15% 20% 25% 30%
Co
op
éra
tio
n a
ve
c d
es
pa
rte
na
ire
s
étr
an
ge
rs
Coopération avec des partenaires nationaux
France
Espagne
Suisse
Argentine
BrésilMexique
SNI avec faible développement de la coopération pour l’innovation
La taille des bulles représente la part d’entreprises qui s’engagent dans des activités de R&D

LES RÉSULTATS
o We find evidences revealing structural differences between regions,
but also presence of heterogeneity within regions. In particular,
firms tend to face innovation activities to achieve a better economic
performance in similar terms along regions, but their interaction
with national systems and environments is weaker in
developing countries. A heterogeneous effect of MNEs is found
regarding innovativity whereas it induces better productivity in
every country.
« Innovation, productivité et exportation : une comparaison entre pays européens et latino-
américains » Fernando Freitas, Stéphane Lhuillery, João Alberto De Negri, Luis Miotti,
Julio Raffo. (Avril 2011)
« Innovativity in Northern and Southern countries: A comparison across European and
Latin-American countries ». LHUILLERY, Stéphane (EPFL); MIOTTI, Luis (MESR,CEPN)
and RAFFO, Julio (EPFL, CEPN) (2008)

LES RÉSULTATS (CONT.)
o A main conclusion is that there are difficulties for firms in developing countries to buildworking innovative systems where information and knowledge help them to invest intoR&D. A particular difficulty seems to be the link between academic research and industrywhereas some dynamics seems to occur in Brazil. Our results suggest that the lack ofR&D networking and especially interactions with academics may be a problem forinnovativity in these countries.
o It may however encounter some counterbalancing effects: a first one is the role of foreignMNEs being that a positive impact is found for innovativity in Brazil.
o Our results suggest that the bottleneck for developing countries seems to be theinnovativity stage considering that the productivity stage is found capable in the developingcountries to transform technological innovation into productivity and even exports. Ofcourse, investments and education are found important factors for performances. But still,our paper provides evidences that intermediate countries such as Argentina, Brazil andMexico are responsive to technological innovations.
o Last, public support stimulates developing country firms into engaging in innovativeactivities but the limited extent of policies – as in the cases of Argentina and Mexico –seems to prevent it from having an effect on the innovative intensity. Both results suggestthat there is still plenty of scope for policies stimulating firms’ innovative behavior and itsinteraction with the academic sector.

ET L’ÉDUCATION ?
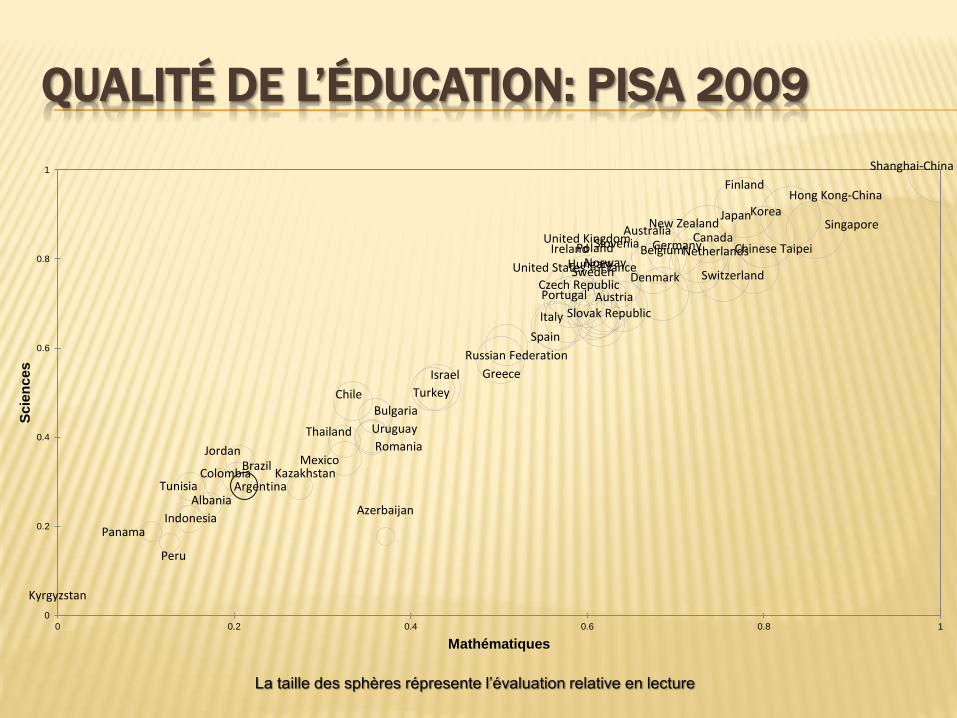
QUALITÉ DE L’ÉDUCATION: PISA 2009
Shanghai-China
Korea
FinlandHong Kong-China
SingaporeCanada
New ZealandJapan
Australia
NetherlandsBelgiumNorway
Switzerland
Poland
United StatesSweden
GermanyIreland
France
Chinese Taipei
Denmark
United Kingdom
Hungary
Portugal
Italy
Slovenia
Greece
Spain
Czech Republic
Slovak Republic
Israel
Austria
Turkey
Russian Federation
ChileBulgaria
Uruguay
MexicoRomania
Thailand
ColombiaBrazil
Jordan
Tunisia
Indonesia
ArgentinaKazakhstan
Albania
Panama
Peru
Azerbaijan
Kyrgyzstan
0
0.2
0.4
0.6
0.8
1
0 0.2 0.4 0.6 0.8 1
Sc
ien
ce
s
Mathématiques
La taille des sphères répresente l’évaluation relative en lecture
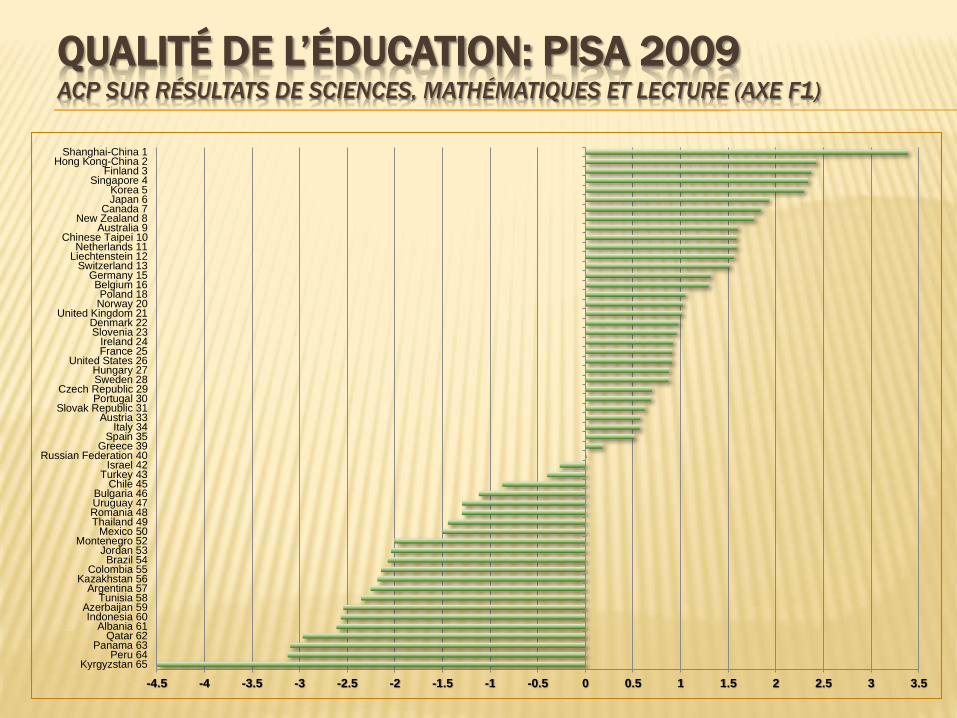
QUALITÉ DE L’ÉDUCATION: PISA 2009ACP SUR RÉSULTATS DE SCIENCES, MATHÉMATIQUES ET LECTURE (AXE F1)
-4.5 -4 -3.5 -3 -2.5 -2 -1.5 -1 -0.5 0 0.5 1 1.5 2 2.5 3 3.5
Kyrgyzstan 65Peru 64
Panama 63Qatar 62
Albania 61Indonesia 60
Azerbaijan 59Tunisia 58
Argentina 57Kazakhstan 56
Colombia 55Brazil 54
Jordan 53Montenegro 52
Mexico 50Thailand 49Romania 48Uruguay 47Bulgaria 46
Chile 45Turkey 43
Israel 42Russian Federation 40
Greece 39Spain 35
Italy 34Austria 33
Slovak Republic 31Portugal 30
Czech Republic 29Sweden 28Hungary 27
United States 26France 25Ireland 24
Slovenia 23Denmark 22
United Kingdom 21Norway 20Poland 18
Belgium 16Germany 15
Switzerland 13Liechtenstein 12Netherlands 11
Chinese Taipei 10Australia 9
New Zealand 8Canada 7
Japan 6Korea 5
Singapore 4Finland 3
Hong Kong-China 2Shanghai-China 1

CONCLUSION

CONCLUSION
o Maitrise de la rente, stabilité macroéconomique et bonne gouvernance sont
clé pour la mise en place des politiques structurelles.
o Et si l’unique politique industrielle possible était une politique structurelle
fondée sur l’éducation à tout niveaux?