2013.11.15_oecd-eclac regional consultation_alain de serres
TRANSCRIPT
Inclusive Growth:
A framework for linking living standards to policies
Alain de SerresOECD Economics Department
15 November 2013ECLAC-OECD joint workshopSantiago, Chile
2
IG: F
ram
ewo
rk f
or
linki
ng
to p
olic
ies
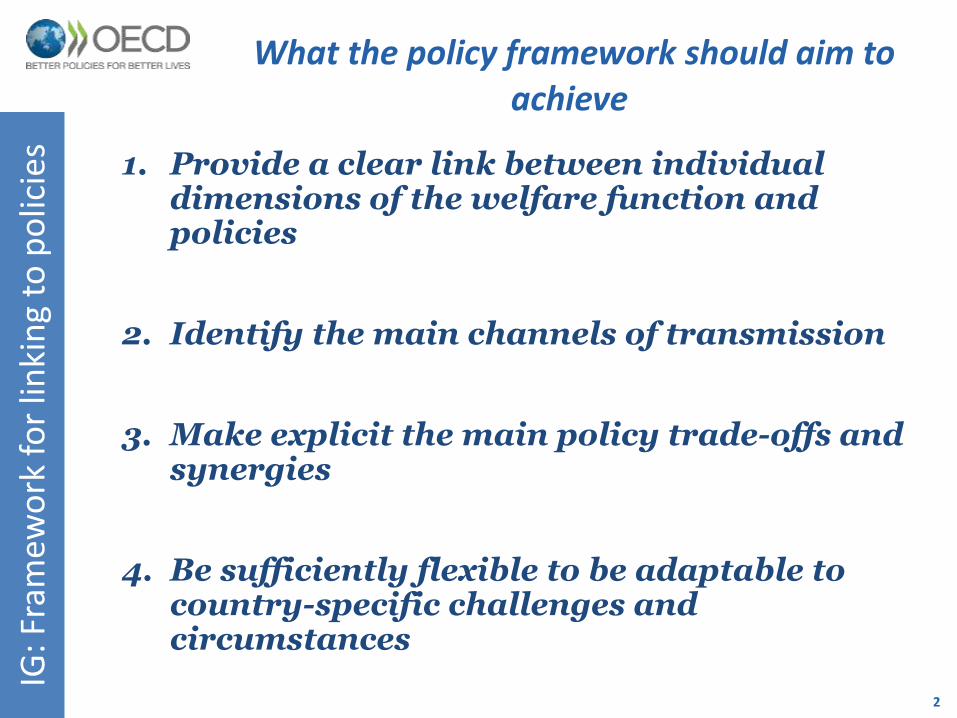
What the policy framework should aim to achieve
1. Provide a clear link between individual dimensions of the welfare function and policies
2. Identify the main channels of transmission
3. Make explicit the main policy trade-offs and synergies
4. Be sufficiently flexible to be adaptable to country-specific challenges and circumstances
3
IG: F
ram
ewo
rk f
or
linki
ng
to p
olic
ies
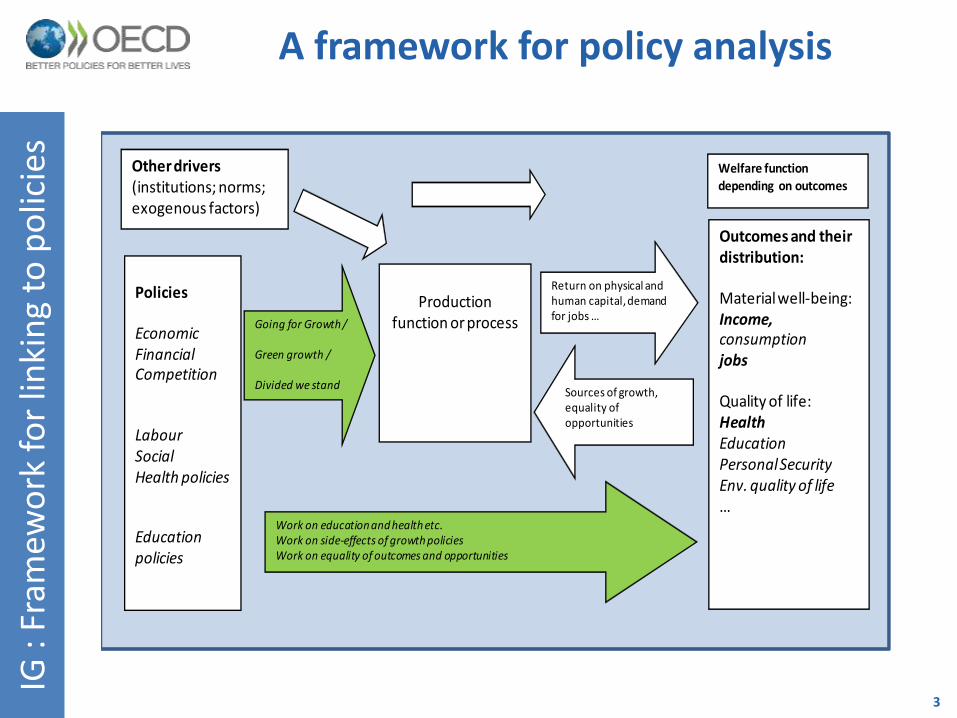
A framework for policy analysis
Outcomes and their distribution:
Material well-being: Income, consumptionjobs
Quality of life: HealthEducationPersonal SecurityEnv. quality of life…
Welfare function
depending on outcomes
Production function or process
Policies
EconomicFinancialCompetition
LabourSocialHealth policies
Education policies
Return on physical and human capital, demand for jobs …
Other drivers(institutions; norms; exogenous factors)
Sources of growth, equality of opportunities
Going for Growth /
Green growth /
Divided we stand
Work on education and health etc.Work on side-effects of growth policiesWork on equality of outcomes and opportunities
4
IG :
Fram
ewo
rk f
or
linki
ng
to p
olic
ies
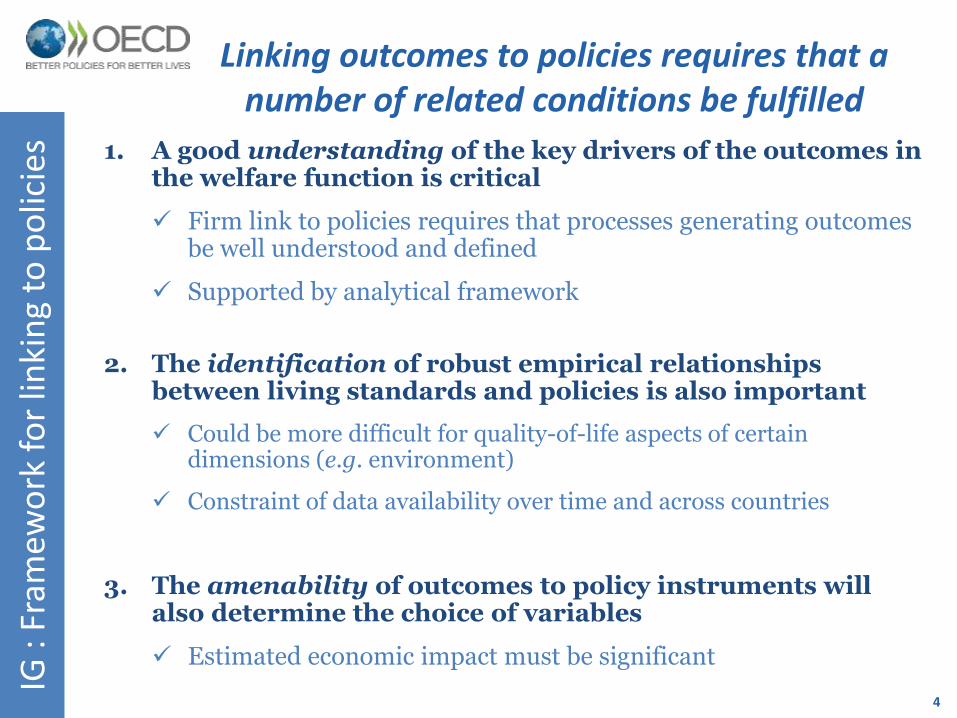
Linking outcomes to policies requires that a number of related conditions be fulfilled
1. A good understanding of the key drivers of the outcomes in the welfare function is critical
Firm link to policies requires that processes generating outcomes be well understood and defined
Supported by analytical framework
2. The identification of robust empirical relationships between living standards and policies is also important
Could be more difficult for quality-of-life aspects of certain dimensions (e.g. environment)
Constraint of data availability over time and across countries
3. The amenability of outcomes to policy instruments will also determine the choice of variables
Estimated economic impact must be significant

5
IG: F
ram
ewo
rkThe case of income and health status
1. Income generation (material living standards)
Measured by mean household disposable income…
… but link to policies anchored in growth accounting framework (drivers of GDP per capita)
2. Health status (non-material dimension)
Proxied by life expectancy
Matters for both material and non-material living standards
3. Income distribution
How aggregate income trickles down across various parts of the distribution
Mean, median, lower part of the distribution

6
IG: F
ram
ewo
rk 1. Income generation (material living standards)

7
IG :
Inco
me
gen
erat
ion
Large differences in GDP per capita in middle-income
countries are mostly accounted for by productivity gaps
Except for Turkey and South Africa.
Percentage difference in
labour productivity3
Percentage GDP per capita difference
compared with upper half of OECD
countries1
Percentage difference in labour
resource utilisation2
-100 -80 -60 -40 -20 0 20
India
Indonesia
China
South Africa
Brazil
Turkey
Mexico
Chile
Russia
Lower half of OECD
countries
OECD average
-100 -80 -60 -40 -20 0 20 -100 -80 -60 -40 -20 0 20
India
Indonesia
China
South Africa
Brazil
Turkey
Mexico
Chile
Russia
Lower half of OECD
countries
OECD average
2012 2008
8
IG :
Inco
me
gen
erat
ion
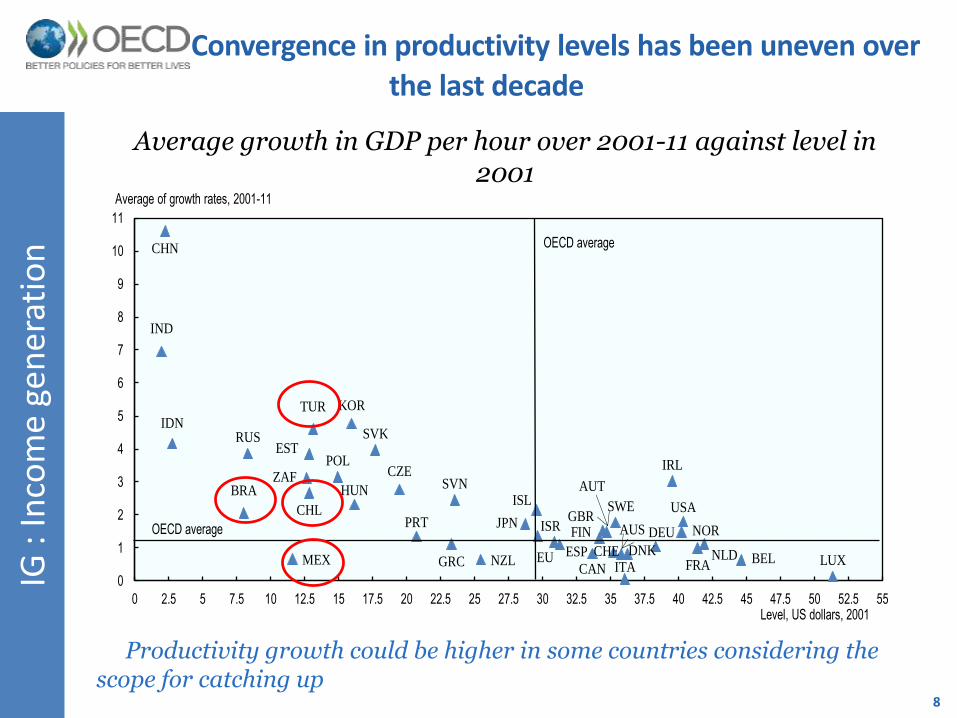
Convergence in productivity levels has been uneven over
the last decade
Productivity growth could be higher in some countries considering the scope for catching up
Average growth in GDP per hour over 2001-11 against level in 2001
AUS
AUT
BELCAN
CHL
CZE
DNK
EST
FIN
FRA
DEU
GRC
HUNISL
IRL
ISR
ITA
JPN
KOR
LUXMEX NLDNZL
NOR
POL
PRT
SVK
SVN
ESP
SWE
CHE
TUR
GBRUSA
RUS
BRA
CHN
IND
IDN
ZAF
EU
0
1
2
3
4
5
6
7
8
9
10
11
0 2.5 5 7.5 10 12.5 15 17.5 20 22.5 25 27.5 30 32.5 35 37.5 40 42.5 45 47.5 50 52.5 55Level, US dollars, 2001
Average of growth rates, 2001-11
OECD average
OECD average
9
IG: I
nco
me
gen
erat
ion
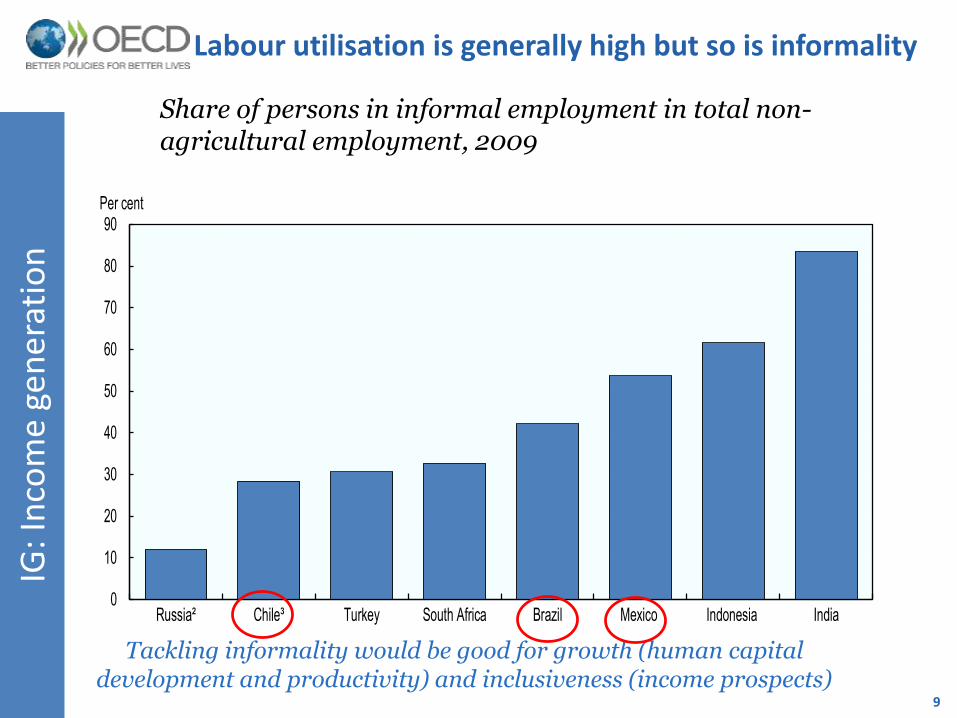
Labour utilisation is generally high but so is informality
Tackling informality would be good for growth (human capital development and productivity) and inclusiveness (income prospects)
Share of persons in informal employment in total non-agricultural employment, 2009
0
10
20
30
40
50
60
70
80
90
Russia² Chile³ Turkey South Africa Brazil Mexico Indonesia India
Per cent

10
IG :
Inco
me
gen
erat
ion
Low female participation limits labour force participation
in some LACs
Particularly low relative to total participation in Mexico, Turkey but also low in Chile.
Labour force participation rates, 2011
0
10
20
30
40
50
60
70
80
90Per cent
Women Total
11
IG :
Inco
me
gen
erat
ion
Quality and equity of education are also
fundamental for inclusive growth
Argentina
Germany
TurkeyChile
United Kingdom
Brazil
PortugalSpain
Mexico
United StatesFrance
Shanghai-China
Australia Japan
Italy
FinlandCanada
Korea
Indonesia
300
350
400
450
500
550
600
051015202530
Mea
n
sco
re, O
ECD
ave
rage
= 5
00
Percentage of variance in performance explained by the PISA index of economic, social
and cultural status (r-squared x 100)
Strength of the relationship between performance and socio-economic background above the OECD average impact
Strength of the relationship between performance and socio-economic background not statistically significantly different from the OECD average impact
Strength of the relationship between performance and socio-economic background below the OECD average impact
Above-average reading performanceBelow-average impact of socio-economic
background
Below-average reading performanceBelow-average impact of socio-economic
background
Below-average reading performanceAbove-average impact of socio-economic background
Above-average reading performanceAbove-average impact of socio-economic background
OEC
D
12
IG :
Inco
me
gen
erat
ion
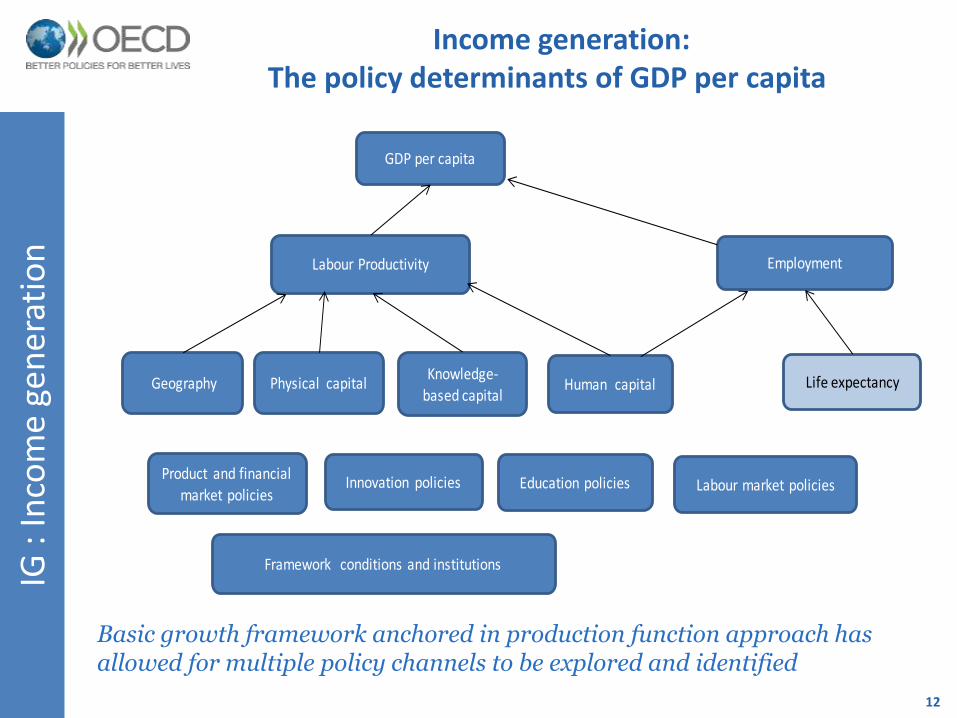
Income generation: The policy determinants of GDP per capita
Basic growth framework anchored in production function approach has allowed for multiple policy channels to be explored and identified
GDP per capita
EmploymentLabour Productivity
Geography
Framework conditions and institutions
Education policies
Human capital
Innovation policies
Knowledge-based capital
Product and financial market policies
Physical capital Life expectancy
Labour market policies

13
IG: F
ram
ewo
rk 2. Health outcomes (non-material dimension)
14
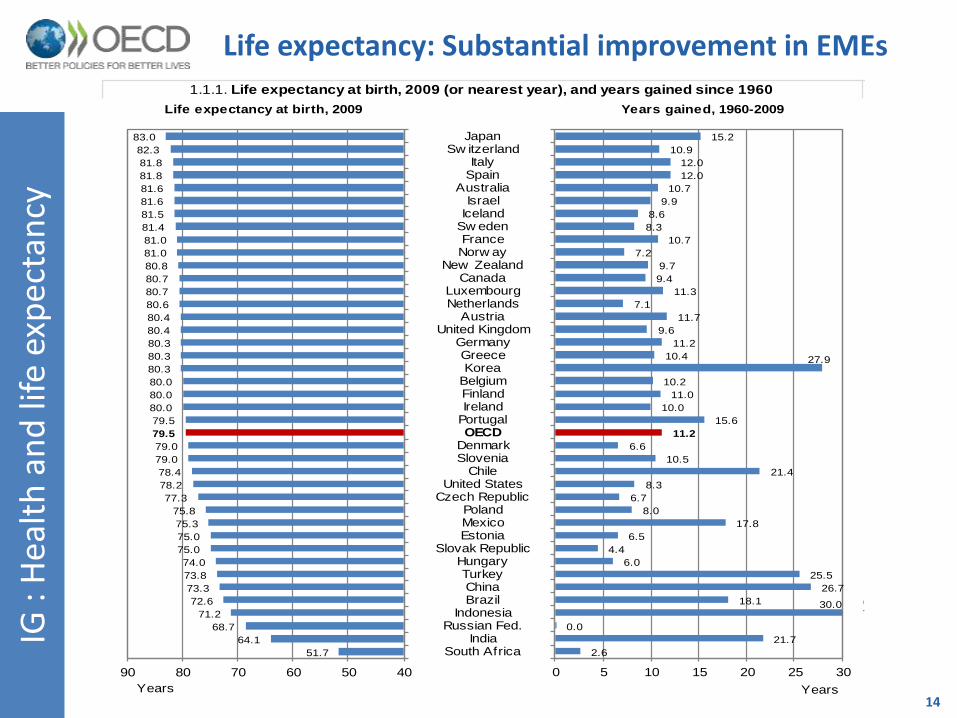
IG :
Hea
lth
an
d li
fe e
xpec
tan
cyLife expectancy: Substantial improvement in EMEs
Vast majority of OECD countries experienced a significant reduction in the ratio of bottom to middle incomes amid diverging trends in overall income inequality
1.1.1. Life expectancy at birth, 2009 (or nearest year), and years gained since 1960
JapanSw itzerland
ItalySpain
Australia
Life expectancy at birth, 2009 Years gained, 1960-2009
United KingdomGermanyGreeceKorea
IsraelIceland
Sw edenFranceNorw ay
New Zealand
PolandMexicoEstonia
Slovak Republic
CanadaLuxembourg
OECDDenmark
NetherlandsAustria
BelgiumFinlandIreland
Portugal
ChinaBrazil
SloveniaChile
United StatesCzech Republic
IndonesiaRussian Fed.
IndiaSouth Africa
HungaryTurkey
83.0
82.3
81.8
81.8
81.6
81.6
81.5
81.4
81.0
81.0
80.8
80.7
80.7
80.6
80.4
80.4
80.3
80.3
80.3
80.0
80.0
80.0
79.5
79.5
79.0
79.0
78.4
78.2
77.3
75.8
75.3
75.0
75.0
74.0
73.8
73.3
72.6
71.2
68.7
64.1
51.7
405060708090
Years
15.2
10.9
12.0
12.0
10.7
9.9
8.6
8.3
10.7
7.2
9.7
9.4
11.3
7.1
11.7
9.6
11.2
10.4 27.9
10.2
11.0
10.0
15.6
11.2
6.6
10.5
21.4
8.3
6.7
8.0
17.8
6.5
4.4
6.0
25.5
26.7
18.1 30.0
0.0
21.7
2.6
0 5 10 15 20 25 30
Years

15
IG :
Hea
lth
an
d li
fe e
xpec
tan
cyHealth status the policy determinants of health
outcomes
Missing determinants such as poverty, exclusion, discrimination and job insecurity. Less of a problem if they correlate with income inequality
Health care
provisionsPollution
Life Expectancy
Education Life style
Environmental policies
Productionactivites (pro-
growth policies)
Educationalpolicies
Health policies:SpendingEfficiency
Household income

16
IG: F
ram
ewo
rk 3. Income distribution

17
IG :
Inco
me
dis
trib
uti
on
Chile and Mexico saw notable contractions in inequality
(Gini coefficient)
OECD countries have experienced what could be referred to as a form of cross-country “convergence”
Changes in inequality against initial level, mid-1990s to late 2000s
AUSAUT
BEL
CAN
CZE
DNK
FIN
FRADEU
GRC
HUN
IRL
ITA
JPNLUX
MEX
NLD
NZL
NOR
PRTESP
SWE
TUR
GBR
USA
CHL
ISR
-0.1
-0.075
-0.05
-0.025
0
0.025
0.05
0.075
0.2 0.225 0.25 0.275 0.3 0.325 0.35 0.375 0.4 0.425 0.45 0.475 0.5 0.525 0.55
A. InequalityChange
Initial level
Correlation coefficient= -0.76

18
IG :
Inco
me
dis
trib
uti
on
Income distribution: Beyond the Gini
Chile has done better in the lower half of the distribution
Vast majority of OECD countries experienced a significant reduction in the ratio of bottom to middle incomes amid diverging trends in overall income inequality
AUSAUT
BEL
CAN
CZE
DNK FIN
FRADEU
GRC
HUN
IRL
ITA
JPNLUX
MEX
NLDNZL
NOR
PRT
ESP
SWE
TUR
GBR
USA
CHL
ISR
-0.1
-0.08
-0.06
-0.04
-0.02
0
0.02
0.04
0.06
0.08
0.1
-0.3 -0.25 -0.2 -0.15 -0.1 -0.05 0 0.05 0.1 0.15 0.2 0.25 0.3 0.35 0.4 0.45 0.5 0.55 0.6 0.65 0.7
''Overall'' income inequality
A. Developments in the lower half of the income distribution and in "overall" inequality
Increased overall inequality but decreased inequality in the lower half of the income distribution
Increased overall inequality as well as in the lower half of the income distribution
Decreased overall inequality but increased inequality in the lower half of the income
Decreased overall inequality as well as in the lower half of the income distribution
Inequality in the lower half of the income distribution

19
IG :
Inco
me
dis
trib
uti
on
Mild decline in the Gini in Spain but falling income at
the low end of the distribution
Relative advantage for the middle class, combined with losses for the poor in absolute terms
-10
0
10
20
30
40
50
60
70
80
90
100
-10 -8 -6 -4 -2 0 2 4 6 8 10 12
Bottom to top-sensitive income standards
Percentage growth of income standard
Mean income
Growth in income standards between the mid-1990s and late-2000s
20
IG :
Inco
me
dis
trib
uti
on
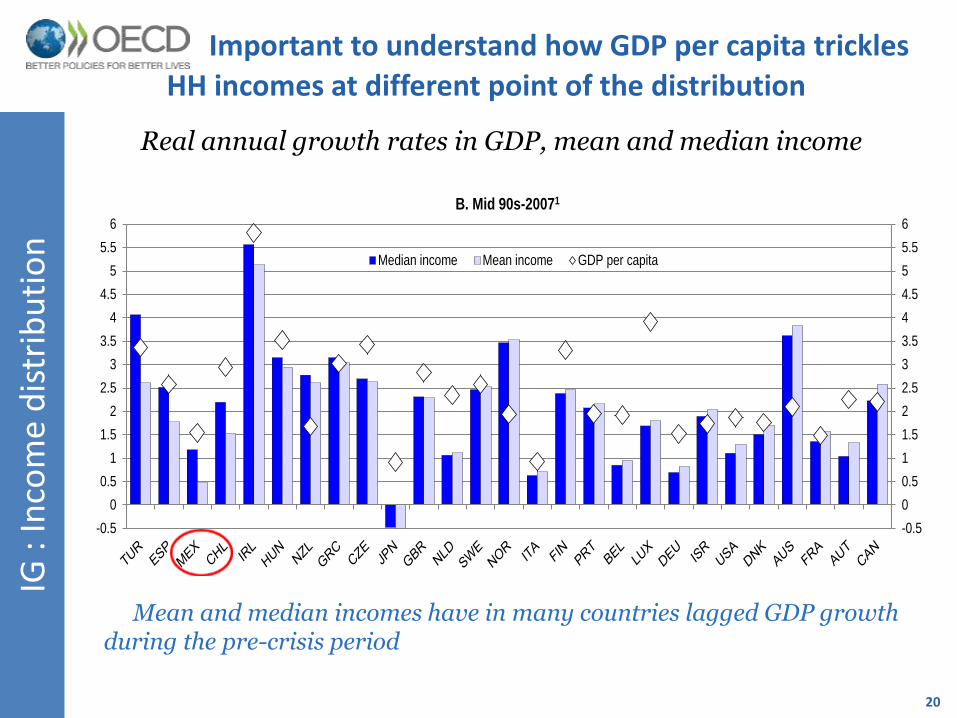
Important to understand how GDP per capita trickles
HH incomes at different point of the distribution
Mean and median incomes have in many countries lagged GDP growth during the pre-crisis period
Real annual growth rates in GDP, mean and median income
-0.5
0
0.5
1
1.5
2
2.5
3
3.5
4
4.5
5
5.5
6
-0.5
0
0.5
1
1.5
2
2.5
3
3.5
4
4.5
5
5.5
6
B. Mid 90s-20071
Median income Mean income GDP per capita

21
IG :
Fram
ewo
rkLinking policies to outcomes: The case of household
income and life expectancy
Moving from GDP to household income is not a problem from a measurement perspective but less straightforward from the point of view of linking to policies to incomes
Living standards
Household Income Life Expectancy
MedianMean Bottom
GDP per capita Income generation
Income distribution

22
IG: F
ram
ewo
rkPotential policy trade-offs
1. Growth policies
May raise incomes for a majority but also entail higher air or water pollution : unclear net effect health and living standards
2. Environmental policies
May lower GDP per capita and household disposable income but still improve living standards through better health
3. Health policies
Higher spending on health can raise life expectancy but could also crowd-out other types of public or private investment (or consumption)
Higher life expectancy may lead to higher employment and GDP but only if working life is adjusted in proportion

23
IG :
Gro
wth
po
licie
sGrowth policy priorities for Brazil, Chile and Mexico
Brazil Chile Mexico
Enhance outcomes and equity in education (X)
X X X
Ease EPL for regular workers (X) / extend UI benefits (Y)
X / Y X
Lower labour tax wedge (X) X
Promote labour force participation of women (X) / older workers (Y)
Y X
Lower barriers to entry and competition (X) / investment in infrastructure (Y) / to FDI (Z)
X / Y X / Z
Strengthen competition law X
Improve efficiency of financial markets X
Improve rule of law X

24
IG: F
ram
ewo
rk
Thank you !