ycn breast educational meeting 2015-ccgs commissioning and cancer -helen lewis
TRANSCRIPT
Helen Lewis – Head of Acute
Provider Commissioning,
Leeds CCGs
A CCG commissioner’s
perspective – what you might
want to know about us, and what
we need to know about you!

Commissioners • Clinical commissioning groups
• NHS England specialised commissioning
• NHS England local area team
• Providers as leads for a network
• Local authority public health teams
• Public health England
Much in the national Cancer Strategy about how we can work better
together - see page 64 for proposals about who is responsible for what –
interestingly it doesn’t show public health responsibility despite the
emphasis on it earlier in the document
What do commissioners do? Try to optimise the health of the population within the allocated resources
Try to reduce inequalities of health within a population
What does our population need? How do we set priorities within a fixed resource?
How do we deliver it?
What does it cost?
What did we do this year/last year?
What impact did it have?
What should we do better next year?
In practiceWhat did we spend last year?
Can we afford it?
Is there anything we can stop doing?
Is there anything more we should be doing?
What is likely to be different next year? (Provider capacity, provider behaviour,
GP behaviour, National campaigns, public awareness)
[Ideally would also ask: Did what we do this year do any good?
What can we/should we change for next year?
Are there inequalities we could be addressing? And if so how?]

How does Cancer fit into the
overall picture for a CCG?

2014/15 NHS Leeds West CCG spend by care setting
(pop c. 367,000 – 66,000 over 60s
£191.9
£50.3
£47.1
£43.1
£15.8
£15.3
£10.0£11.4
£7.7 £3.3
NHS Leeds West CCG 2014/15 spend (£m) by care setting
Acute, IS & AQP Care
Primary Care Prescribing
Mental Health & LD
Leeds Community Healthcare
Continuing Care
Urgent Care
Other
Citywide Transformation
Running Costs
Local Primary Care
For information – Value of Primary Care Contracts - £42.485m

2014/15 Point of Delivery split of Acute,
Independent Sector & AQP/GPwSI contracts
- Total 14/15 Acute spend was £191.1m compared to £185.0m in 2013/14
£47.9
£44.5£33.5
£14.4
£10.0
£9.2
£8.9
£7.6£4.3
Point of Delivery spend split - Acute, Independent Sector & AQP/GPwSI providers
Non-Elective
Elective
Outpatient
Maternity
High Cost Drugs & Devices
A&E
Imaging/Pathology
Other (including CQUIN)
Critical Care

So what do we spend
on Cancer?
The input data we have is activity based, and specialty based; plus data
on clinical coding of inpatients/day cases and diagnostic radiology only
We do have programme budget data, but it’s for inpatient services only –
doesn’t capture information on outpatients, public health, community
services etc.
When we look at costs, often need to look at it from the ‘bottom up’ for
individual pathways
Rarely link what we spend with what we gain from that spend – tend to
look at outcomes and quality in separate forums from spend

Breast cancer spend
Leeds West CCG at LTHT
£2 million - about half inpatient and half outpatient
About 4,000 first appointments, and 2,000 MDT discussions, around 400 inpatient/day case admissions; around 400 outpatient procedures
Doesn’t include radiology, pathology or oncology spend nor any high cost drugs or drugs in primary care
We don’t commission by pathways or programme currently - just by inputs. No outpatient coding; no mapping of pathology costs to pathways that is externally visible
NB can’t really split out cancer from non-cancer but most of the work within the breast surgery treatment function relates to cancer

What data do
commissioners look
at?• Performance
• Activity
• Demand and referral variation
• Outcomes – mortality data/screening uptake,
emergency presentations
• Staging data
• Patient experience questionnaire responses
• Business cases for investment/service change

CCGs are responsible for and measured against 5 ‘domains’ –
the one most relevant to Cancer is: Domain1: Preventing
people from dying prematurely
Reducing premature mortality from major causes of death -
Measures include:
• Under 75 mortality from cancer
• One year survival for all cancers
• One year survival from breast, lung and colorectal cancers
• Cancer: diagnosis via emergency routes
• Cancer: record of stage at diagnosis
• Cancer: early detection
• Lung cancer: record of stage at diagnosis
• Breast cancer mortality
Data often only available with considerable time-lags
Overarching measure: potential years of life lost from causes considered amenable to healthcare

Generally look more at waiting
time Performance
Monthly Target Jun'15 Jul'15 Jun'15 Jul'15
2 week GP referral to 1st outpatient
(suspected cancer)93.0% 92.6% 94.7% 92.5% 94.3%
2 week GP referral to 1st outpatient (breast
symptoms)93.0% 95.1% 91.7% 96.8% 91.9%
Leeds West LTHT Total
Performance against 62 day standard overall and by tumour type
(usually well over 95% for Breast)
Breast cancer screening uptake data
But also look at the factors that are behind the performance, specifically
demand, and the level of conversion by tumour type and by GP practice,
referral rates per thousand population etc
Focus on inequality of access and outcome – do some GPs refer a lot
more/fewer patients.
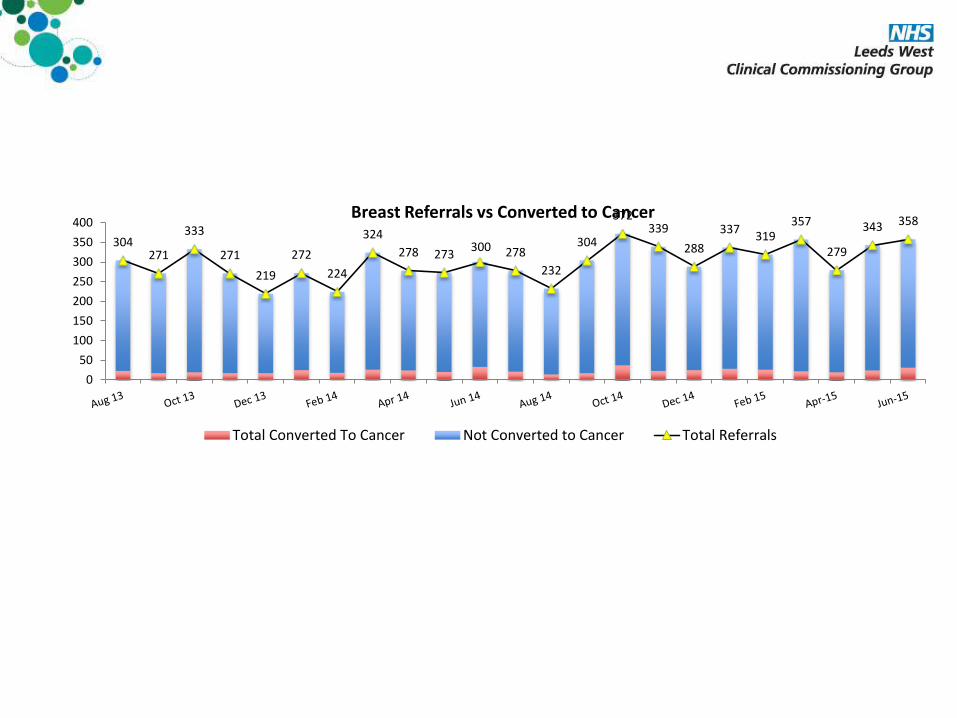
304271
333
271
219
272
224
324
278 273300 278
232
304
372339
288
337319
357
279
343 358
0
50
100
150
200
250
300
350
400Breast Referrals vs Converted to Cancer
Total Converted To Cancer Not Converted to Cancer Total Referrals

Directly age-standardised rate per 100, 000 population by route
Bordered cells indicate 3 SD outliers on respective funnel plotsPercentage by Route
Female Breast Cancer
Scre
en
dete
cte
d
Man
ag
ed
Em
erg
en
cy
pre
sen
tati
on
Oth
er
Nu
mb
er
of
cases
Scre
en
dete
cte
d
Man
ag
ed
Em
erg
en
cy
pre
sen
tati
on
Oth
er
England
38.4 71.2 3.9 6.0
191,120
28% 62% 5% 5%
Confidence interval 38.1 38.7 70.8 71.6 3.8 4.0 5.9 6.1
28% 29% 62% 62% 5% 5% 5% 5%
NHS Leeds West CCG
38.3 68.4 5.1 5.1
959
28% 62% 6% 4%
Confidence interval 33.7 42.9 62.9 73.9 3.8 6.4 3.5 6.7
25% 31% 59% 65% 5% 8% 3% 6%
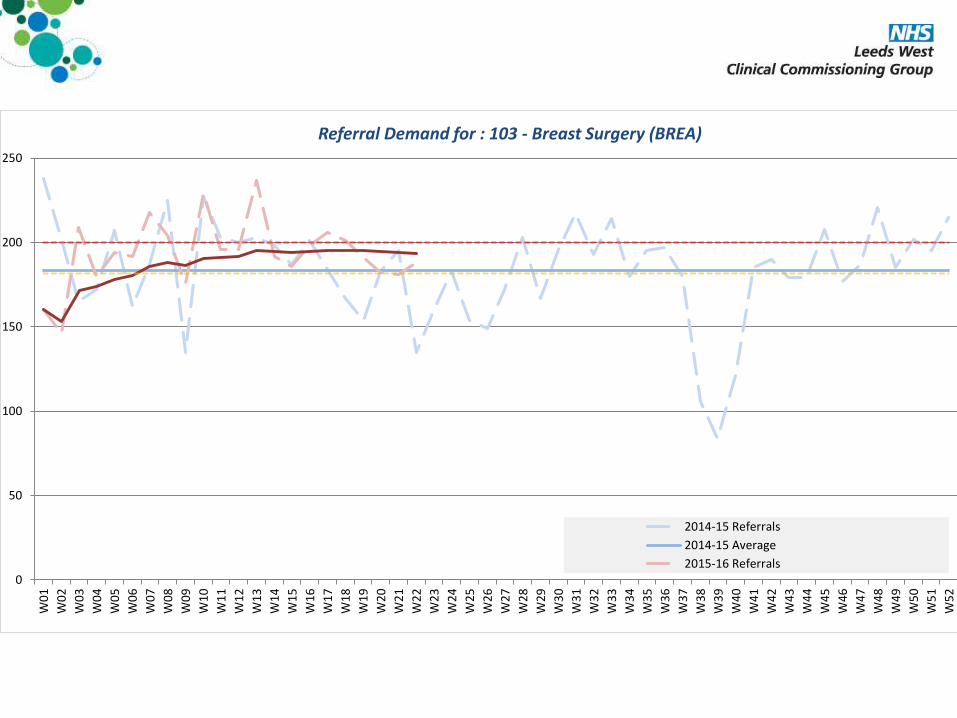
Increasingly also looking at data
for planning
• Demand for care: impact of new guidance
• Numbers of referrals, but also understanding the resources each patient needs;
• Modelling of numbers and types of test, how many ultrasounds, mammograms,
biopsies
• What is resource required?
• Can it be organised differently?
• Resource planning for treatments
• Resource planning for aftercare
0
50
100
150
200
250
W0
1
W0
2
W0
3
W0
4
W0
5
W0
6
W0
7
W0
8
W0
9
W1
0
W1
1
W1
2
W1
3
W1
4
W1
5
W1
6
W1
7
W1
8
W1
9
W2
0
W2
1
W2
2
W2
3
W2
4
W2
5
W2
6
W2
7
W2
8
W2
9
W3
0
W3
1
W3
2
W3
3
W3
4
W3
5
W3
6
W3
7
W3
8
W3
9
W4
0
W4
1
W4
2
W4
3
W4
4
W4
5
W4
6
W4
7
W4
8
W4
9
W5
0
W5
1
W5
2
Referral Demand for : 103 - Breast Surgery (BREA)
2014-15 Referrals
2014-15 Average
2015-16 Referrals
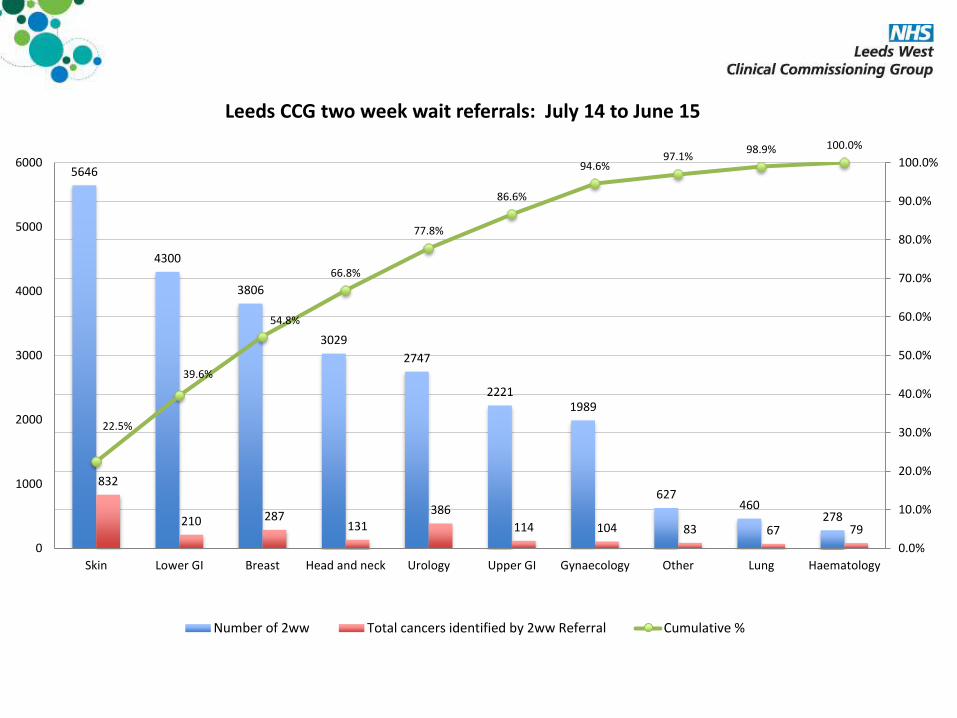
5646
4300
3806
3029
2747
22211989
627460
278
832
210 287131
386
114 104 83 67 79
22.5%
39.6%
54.8%
66.8%
77.8%
86.6%
94.6%97.1%
98.9% 100.0%
0.0%
10.0%
20.0%
30.0%
40.0%
50.0%
60.0%
70.0%
80.0%
90.0%
100.0%
0
1000
2000
3000
4000
5000
6000
Skin Lower GI Breast Head and neck Urology Upper GI Gynaecology Other Lung Haematology
Leeds CCG two week wait referrals: July 14 to June 15
Number of 2ww Total cancers identified by 2ww Referral Cumulative %
Responsible for
outcomes, not inputs
but………….Rely on national guidance, NICE guidance, pathways etc
Rely on providers compliance with NICE and assurance
Peer Review
Patient feedback
We can and should do more but there is a LOT of data
How to move to commissioning for outcomes?

Achieving World-Class Cancer
Outcomes – A strategy for
England 2015-20 • Even greater emphasis on earlier referral at lower levels of
suspicion
• Specifies new dashboard
• More nationally determined and collected metrics
• Patient reported outcome measures
• More focus on aftercare
• Management of patients with comorbidities as they age
• Relationship between primary and secondary care not only
on diagnosis but also on after care, case reviews, survivorship
Resource is a big problemMultiple specialties
Within each specialty, multiple pathways
Tend to have to focus on the areas which are:
Very costly
Failing on performance
Assessed as clinically problematic by regulators/external reviewers
Areas where there is new guidance
Areas of growing demand
Don’t have service specifications for every pathway we commission – just not practical – but
we could/should do better!
How do we work with providers to provide that assurance for us; so we are confident that YOU
have systems to:
Review clinical outcomes; untoward events; complication rates; deaths within 30 days of
treatment; recurrence rates, patient feedback
