the knowledge effect - excess returns of highly innovative companies - approved
TRANSCRIPT
1
Executive Summary
I n this paper, we identify the Knowledge Effect, the tendency of stocks of highly innovative compa-
nies to experience excess returns. It results from investors’ systematic errors in evaluating compa-
nies that invest large sums of money in producing knowledge.
The origins of the Knowledge Effect can be traced to two factors:
1. A surge in the pace of knowledge production catalyzed by the release of the first commercially
available semiconductor in 1971. Due to the cumulative nature of knowledge, this acceleration
has resulted in an exponential increase in humankind’s total knowledge.
2. A mandate by the US Financial Accounting Standards Board in 1974 which ruled that companies
must expense knowledge investments in the period incurred. This deprived investors of relevant
financial information on corporate knowledge spending at the dawn of this massive surge in the
pace of knowledge production.
The Knowledge Effect is grounded in academic literature. It was first discovered in a series of studies
in the 1990s where NYU’s Baruch Lev analyzed 20 years of financial data and discovered an associ-
ation between a firm’s level of knowledge capital and its subsequent stock performance. Further re-
search advanced the findings, and in 2005, Lev proved the existence of a market inefficiency attribut-
able to missing information about corporate knowledge investments. This phenomenon leads highly
innovative companies to deliver persistent abnormal returns.
Gavekal Capital captures the Knowledge Effect using a proprietary process designed to overcome
the informational shortcomings of traditional financial statements. Our methodology capitalizes corpo-
rate knowledge investments, measures firm performance on a knowledge-adjusted basis, and selects
investments on the basis of knowledge intensity.
Introduction
What drives stock returns? Answering this question has been a goal of investors ever since Harry
Markowitz introduced his Modern Portfolio Theory in the 1950s. Later, William Sharpe’s Capital Asset
Pricing Model illustrated that the market itself is the first and foremost element in explaining a stock’s
performance. However, empirical research over the past several decades has identified many other
effects beyond simply the market that exhibit a strong explanatory power of stock returns. These ef-
fects are persistent over time and apply to a broad range of stocks. Some of the more widely known
are the small-cap effect, the value effect, and the momentum effect. In this paper, we identify a new
anomaly, the Knowledge Effect. The Knowledge Effect is a pricing anomaly that leads to persistent
excess returns among highly innovative companies.
The Knowledge Effect: Excess Returns of Highly Innovative Companies
By Steven Vannelli, CFA, and Eric Bush, CFA
2
The Knowledge Effect can be traced to two important roots. First, with introduction of the semiconduc-
tor, humankind was able to radically accelerate its knowledge production. The semiconductor has en-
abled humankind to multiply its intellectual strength in a similar way that the steam engine and electric
motor enabled humankind to multiply its physical strength. Knowledge production takes the form of
corporate investment in research and development (R&D), advertising and employee training. Corpo-
rations spend more on knowledge than they do on property, plant and equipment. The second im-
portant root for the Knowledge Effect is the dearth of information about corporate knowledge activities
that has been amplified by the poorly timed implementation of conservative accounting practices at
the start of the greatest period of knowledge production in human history. This information deficiency
has led investors to make a systematic error in the way they assess the prospects of companies that
invest significantly in knowledge. Ultimately, this systematic error is reflected in a persistent risk pre-
mium, or excess return, for companies that invest significantly in knowledge.
The Knowledge Effect was originally discovered by academic researchers, spearheaded by Baruch
Lev, who studied 20 years of financial data and discovered an important association between a firm’s
level of knowledge capital and its subsequent stock returns. Further research advanced the original
findings and in 2005 Lev, building on his own earlier research as well as that of others, proved the
existence of a market inefficiency traceable to missing information about corporate knowledge invest-
ments. This inefficiency has led highly innovative companies to deliver persistently positive abnormal
returns in the stock market.
Gavekal Capital has developed the Knowledge Leaders Indexes as the broadest, longest running,
real-time test of the Knowledge Effect. We have developed a proprietary process designed to over-
come the informational shortcomings that afflict most investors. Our results suggest that there is an
enormous opportunity for investors to capitalize on the Knowledge Effect in both developed and
emerging markets.
Two Views On the Drivers of Stock Returns
There are generally two views regarding the factors that drive stock returns: an efficient market hy-
pothesis view and a behavioral view.
The efficient market hypothesis asserts that all market participants are rational and asset prices im-
mediately incorporate all relevant information. Based on this foundation, the rate of return earned is
determined by the systematic risk, or market risk, of the stock. This concept was illustrated by William
Sharpe in his Capital Asset Pricing Model (CAPM) which showed that a stock’s expected return is de-
termined by the risk-free rate plus the systematic risk associated with the stock. The CAPM folded
neatly into Modern Portfolio Theory (MPT) since according to MPT an investor is compensated only
for taking on market risk, which cannot be diversified away, and is not compensated for the idiosyn-
cratic risk of the stock, which can be diversified away. Any perceived excess return of a stock is simp-
ly due to a higher overall level of systematic risk. As we will see later on in the paper, the academic
research on the Knowledge Effect identified this as one of the early possible explanations for the per-
sistent abnormal returns of highly innovative companies.
3
The behavioral view of what drives stock returns begins with the hypothesis that investors make sys-
tematic errors. Investors have behavioral biases that lead to these errors. For example, rational in-
vestors may be deprived of information about a company’s knowledge investments and under-react
or over-react to news about the company’s growth prospects. Therefore, in addition to the systematic
risk of a stock, an investor is also compensated for the systematic errors created by other investors.
These systematic errors can create abnormal returns in certain groups of stocks. It is consensus
among the academic community that deficient information regarding corporate knowledge production
is at the heart of the observed abnormal returns generated by knowledge intensive companies. In
other words, the Knowledge Effect is in part a function of insufficient information regarding corporate
knowledge investments.
Knowledge Is About Creating Recipes
Economic growth occurs when people deliberately combine resources according to some recipe pro-
ducing a final good of greater value than the ingredients that went into it. Economic development is
the continuous process of combining resources in highly valuable ways. There are billions of different
ways to combine resources and much of economic growth is the process of testing these combina-
tions to satisfy human needs or wants. Stanford Economist Paul Romer offers an interesting thought
experiment to illustrate the opportunities for discovery. There are roughly 100 different atoms on the
periodic table of elements. Imagine the task of combining four of these atoms, in equal proportion, to
form a final compound. There would be (100*99*98*97) 94,000,000 different combinations to test.
Next, if each ingredient could be used in a proportion on a scale of 1-10 parts, using only whole num-
bers, then the number of possible recipes goes to (3,500*94,000,000) 330 billion. All these possible
recipes stem from just four basic ingredients! The testing of various recipes—picture Thomas Edison
in his lab churning through thousands of possible lightbulb filaments—is the creation of knowledge. In
1957, Robert Solow, looking back on US economic growth between 1909 and 1949 concluded that
87% of economic growth was a result of technological innovation, or the successful creation and ap-
plication of recipes.
General Purpose Technologies Are Engines of Growth
In any given period in time, there is a core technology that performs some basic function upon which
many applications are built. Historically this core technology, or general purpose technology, forms
the basis of economic development for decades or centuries.
Looking back on the first and second industrial revolutions, it is easy to see the impact of general pur-
pose technologies. Work can be defined as an energy transformation, converting raw materials into
some finished product. The clothes we wear begin as raw cotton that needs to be processed into
thread, woven into cloth and then formed into shapes. All along this production process energy,
whether human, animal or mechanical, must be applied to convert the raw cotton into a series of in-
termediate goods and then ultimately into a finished good. In the seventeenth century the manufac-
ture of clothing was terribly expensive, employing huge amounts of human energy. By the eighteenth
century the manufacture of clothing had been revolutionized by the adoption of the steam engine.
4
Manufacturers figured out that a very particular type of energy transformation was needed to create
clothes—continuous rotary motion—and that this energy could be produced in huge quantities by the
steam engine. Of course clothing wasn’t the only industry to figure out how to employ the generic
function of continuous rotary motion. As more and more industries harnessed the power of the steam
engine to perform work, economic growth exploded on the back of this huge productivity increase.
The first industrial revolution, which fundamentally changed the trajectory of human development was
simply the result of the adoption and diffusion of a general purpose technology—the steam engine—
that supplied a generic function in quantities unfathomable before its advent.
In the second industrial revolution, the electric motor supplanted the steam engine as the general pur-
pose technology, performing continuous rotary motion in much greater quantities, and at much cheap-
er prices. Importantly, the electric motor also allowed for the fractionalization of energy output and
hence work. Factories driven by a steam engine needed to be organized vertically because all power
was derived from a main shaft. However, this vertical organization made it very difficult to move raw
materials into the factory, move intermediate goods along the manufacturing line and to move finished
goods out of the factory. The electric motor, with its fractionalized power output, opened up the possi-
bility to reorganize the factory horizontally. In 1900, the electric motor accounted for less than 5% of
the total manufacturing horsepower in the US. By 1930, the electric motor was providing 80% of total
manufacturing horsepower. While the 1930s stand out in US economic history as one of the worst
decades of economic growth and high unemployment, the 1930s was also the decade where the US
recorded its highest rate of labor productivity ever. As factories reorganized around the electric mo-
tor, productivity surged.
In 1971 Intel released the model 4004, the first commercially available integrated semiconductor. The
semiconductor performed a new general purpose form of work—continuous binary logic. The 4-bit
central processing unit (CPU) was the first ever monolithic CPU fully integrated into a single chip.
Today, the 3rd generation Intel core processor has 1.4 billion transistors or approximately 609,000x
more transistors than the Intel 4004. The operating speed of the 3rd generation Intel Core processor
is approximately 27,000x faster than the Intel 4004.
While the steam engine and then the electric motor expanded humankind’s physical capacity, the
semiconductor has expanded humankind’s mental capacity. The raw materials we have to work with
in the world haven’t changed since the dawn of time, but as a result of trial and error, the recipes we
have created to combine these raw materials have changed dramatically. The production of
knowledge is the development of new and better recipes for combining resources. The utilization of
the semiconductor and its continuous binary logic has accelerated the production of knowledge as we
have been able to test more and more ways of combining resources.
The essence of R&D spending is the testing of new recipes. Drug companies spend billions every
year testing new chemical compounds, seeking the right molecular combination with a beneficial im-
pact on disease. Researchers rely on the existing stock of human knowledge and semiconductors to
discover new knowledge. As the performance of semiconductors improves, the rate at which new
discoveries can be uncovered accelerates. Similarly, as the stock of human knowledge increases,
5
the rate at which new discoveries can be found accelerates. When the inventory of human
knowledge increases and the rate of semiconductor performance improves, the rate of new discover-
ies moves into what inventor Ray Kurzweil describes as a double exponential rate. Thanks to the
continuous binary logic processing of the semiconductor, we are living in a time of accelerating new
discovery.
Forty-four years into the semiconductor era, it is easy to see how pervasive the general purpose tech-
nology has become. In the health care industry, innovations like DNA sequencing and the genomic
revolution are leading to huge improvements in patient quality of living and longevity. In the technolo-
gy industry, smart phones and mobile communications have transformed how we interact and how
business is structured. In the manufacturing industry, sensors, robotics and automation have led to
massive increases in industrial productivity and quality. The energy industry has been revolutionized
by 3D seismic and computer controlled fracking technologies. Retailing and entertainment has been
upended by digital distribution technologies. At the heart of all these new products and processes is
the semiconductor, the engine of growth for the last half century.
Accounting for Knowledge Production Turns Conservative
From an economic perspective, companies produce knowledge in a variety of ways. They engage in
scientific R&D to discover and commercialize new technologies or applications. They perform non-
scientific R&D to conceive and produce artistic work. They inform the marketplace about their prod-
ucts via advertising. They promote their brand, in an effort to gain customer trust. They educate and
train their employees to produce products, sell them and service them. They codify company specific
information about customers, markets and competitors.
The whole purpose of accounting conventions is to standardize corporate information disclosures
about financial and operating performance. Accounting standards themselves are a recipe of sorts—
they prescribe a specific combination of financial information collected together in a set of structured
financial statements. In theory, financial statements should be a reflection of reality in the sense that
they should convey information relevant to investors in such a way to reflect the underlying economic
realities of businesses. This information is essential for investors to allocate capital efficiently. The
absence of information can lead investors to make errors in assessing the health and growth pro-
spects of companies.
Given the role knowledge production plays in economic development, it makes sense to expect that
we have a highly developed accounting standard to measure it. Unfortunately, this is not the case.
Current accounting standards do a terrible job measuring knowledge production. Since 1974, ac-
counting standards in the US have mandated that not only must companies expense all knowledge
spending, they are not required to provide any information about their knowledge production. Accord-
ing to the Financial Accounting Standards Board (FASB) the information is “not sufficiently objective,
is confidential in nature, or is beyond the scope of financial accounting.”
As a result, corporate investments in R&D, advertising, brand development, employee training and
firm specific resources must all be expensed. When spending is capitalized, it is not charged against
6
current period revenues and a company records an asset on its balance sheet reflecting the invest-
ment. When spending is expensed, the company must deduct the charge from current revenues and
does not record any asset reflecting the spending. In theory, any investment that creates long-term
value for a company should be capitalized and recorded as an asset regardless of whether the asset
is tangible, like a piece of machinery, or intangible, like some new recipe. By forcing companies to
expense these knowledge investments, FASB is depriving investors of information central to measur-
ing corporate knowledge production. This has not always been the case.
The first mention of the accounting treatment of R&D was in a 1917 Federal Reserve Board (FRB)
bulletin. The FRB accepted that R&D should be categorized as a deferred charge in published finan-
cial statements. This is another way of saying that R&D spending should be capitalized rather than
being expensed immediately. The deferral treatment of R&D was supported throughout the 1920s,
1930’s, and 1940’s by a variety of financial institutions including the National Association of Cost Ac-
countants (NACA), the Internal Revenue Service (IRS) and again by the FRB.
In the mid-1950s, tax legislation allowed companies to deduct the cost of R&D from taxes. The IRS
set the precedent that companies could keep, in effect, two sets of books--one for internal purposes
where they capitalized R&D investments and another for tax purposes, where they could deduct the
investment. This accounting duality was the best of both worlds for companies because they could
lower their tax bills and still count R&D investments as assets. The tax legislation that allowed R&D
spending to be immediately expensed for tax accounting purposes was presumably intended to spur
R&D investment. Instead it began the distortion of corporate knowledge production.
For the next two decades, there wasn’t a uniform treatment of R&D from an accounting standpoint in
the United States. That changed in 1974 when the FASB came out with the Statement of Financial
Accounting Standards (SFAS) No. 2 which mandated a direct write-off of R&D expenses. Companies
no longer had a choice of how they wanted to treat R&D costs. R&D spending had to be completely
expensed in the period it was incurred. Ironically, the FASB put this rule into effect just three years
after Intel’s 1971 launch of the Intel 4004 chip that would spark the greatest period of knowledge pro-
duction in the history of humankind. In this one decision, the FASB would deprive investors of rele-
vant information about corporate innovative activities for decades.
The FASB actually considered four different methods of accounting for corporate R&D when they
changed the rule in 1974. They considered: 1) charge all costs when incurred 2) capitalize all costs
when incurred 3) capitalize some costs when incurred if those costs met certain specified conditions
4) accumulate all costs in a special category until the future benefits could be determined. In the end,
the FASB took the most conservative approach by deciding that all R&D spending must immediately
be expensed. The reasons behind the FASB decision to take the most severe approach are shocking
and poorly conceived.
The FASB took a myopic viewpoint in determining whether or not the future benefits of R&D could be
determined and consequently, whether it should be capitalized as an asset on a company’s balance
sheet. They were concerned about the riskiness of individual R&D projects. In their view, there was a
7
very high degree of uncertainty because they believed individual projects had a high rate of failure.
However, they completely overlooked the fact that a portfolio of R&D projects can have a much lower
aggregate level of risk than any individual project. On a collective basis, an individual R&D project can
offset a portion of another R&D project’s risk. Investors are quite aware of this interaction between
risky endeavors as this is one of the bedrock principles of MPT. Just like a diversified portfolio of
stocks has a lower level of risk than any individual security, a diversified portfolio of R&D projects has
a lower level of risk than any single project.
In the years immediately after SFAS No. 2 was put into effect, criticisms of the rule began to emerge.
In 1975, academics like Bierman and Dukes feared that the result of immediately expensing R&D
would “distort corporate decision making” and could lead to “faulty measurement of income and
changes in income through time.” Because “business firms do not generally begin new product or
process development projects until the principal technical uncertainties have been resolved,” they be-
lieved that the FASB overstated the riskiness of individual R&D projects. The other main criticism by
the academic community was that the FASB did an inadequate amount of research into the issues
surrounding R&D. In the SFAS No. 2 ruling itself, the FASB admits that it “did not undertake a major
research effort for the project. The FASB staff interviewed a limited number of selected financial ana-
lysts and commercials banks and reviewed a substantial number of published financial statements.”
As we will see in the next section, not all R&D investments are equal and for those companies that
follow an innovation strategy the lack of information about R&D spending in financial statements leads
to a vast information deficiency among investors. Since 1974, the FASB has been starving the mar-
ket of information regarding knowledge production. As we will show shortly, this has led investors to
make systematic errors when assessing the prospects of highly innovative companies.
Knowledge Intensive Companies Generate Abnormal Returns
Milton Friedman once said the only theory in which economists are in universal agreement is that the
value of an asset is determined by the expected benefits it will generate. In its controversial SFAS #2
decision, the FASB raised questions about the reliability, objectivity and value relevance of knowledge
production when it stated “a direct relationship between research and development costs and specific
future revenue generally has not been demonstrated.” The FASB insisted on looking at individual
R&D projects, rather than consider the aggregate corporate portfolio of knowledge production. In par-
agraph 52 of SFAS #2, the FASB stated “For accounting purposes the expectation of future benefits
generally is not evaluated in relation to broad categories of expenditures on an enterprise-wide basis
but rather in relation to individual or related transactions or projects.” Institutional rigidities aside, on a
conceptual level it comes down to this: if a relationship can be identified between knowledge invest-
ments and future benefits, then these knowledge investments should be capitalized and recorded as
assets. If, on the other hand, there is no relationship between knowledge investments and subse-
quent operating or stock performance, then expensing is the proper approach.
Corporate managements deploy capital into a portfolio of R&D projects with the expectation that in
aggregate the portfolio will lead to future sales and earnings. No corporate manager would be held to
8
the standard that every single project must in isolation be a success. That just isn’t the way decisions
are made in the real world. Given the portfolio approach to knowledge investments that companies
take, it makes more practical sense to evaluate whether there is a relationship between a portfolio of
knowledge investments and subsequent operating and stock price performance.
In 1996, Baruch Lev and his colleagues from the NYU Stern School of Business challenged the validi-
ty of SFAS #2 in a study “The Capitalization, Amortization, and Value-Relevance of R&D.” They did
two things: 1) They capitalized R&D investments, adjusting current reported earnings and book value,
and compared these adjusted values to future stock returns; 2) They measured whether R&D capital
over time is related to subsequent stock returns. They found that earnings and book value adjusted
by capitalizing R&D were positively associated with future stock prices and returns. They also found
that the level of R&D capital within a firm is positively related to subsequent stock returns. These
finding indicate that the process of capitalizing R&D yields value-relevant information. In concluding
remarks the authors declare, “Taken together, these findings suggest that R&D capitalization yields
statistically significantly reliable and economically relevant information, contradicting a major tenet of
FASB Statement No. 2: ‘a direct relationship between research and development cost and specific
future revenue generally has not been demonstrated.’”
Lev also determined that there were two possible reasons for the above average stock market returns
of R&D-intensive companies. His first hypothesis, which he believed to be the more credible, was that
the above average returns were driven by a “systematic mispricing of shares of R&D-intensive com-
panies.” Because of the dearth of information regarding innovative activities caused by the implemen-
tation of SFAS No. 2, investors incorrectly react to R&D activities. The market is slow to recognize the
future benefits of R&D, but is fully aware of the negative impact expensing R&D has on current net
profits, heavily discounting the stock price. This leads to a catch-up period as stock prices rise and
analysts quickly move up earnings estimates in future periods as the fruits of R&D investments are
borne out. This in turn leads to abnormal stock market returns for R&D-intensive companies. This hy-
pothesis can be viewed through the lens of the behavioral view where real-world investors commit
systematic errors. In the spirit of open debate, he also offered an alternative hypothesis consistent
with efficient market theory that the perceived abnormal returns were actually just additional compen-
sation for an “extra-market risk factor associated with R&D.” In other words because R&D is risky,
investors in these companies are taking on a hidden risk and the abnormal returns are simply the ad-
ditional compensation investors need to take on the additional risk. This hypothesis is consistent with
the efficient market view of abnormal returns.
In 2002, siding with Lev’s alternative hypothesis, Dennis Chambers, from University of Illinois, wrote
in “Excess Returns to R&D-intensive Firms” that the “positive association between R&D levels and
excess returns” was most likely due to a compensation for hidden risks than from systematic mispric-
ing. In his study, in which he looked at a large sample of public firms, he found evidence which is con-
sistent with the risk explanation, or the efficient market explanation. Taking a shot at Lev, he conclud-
ed that “the positive association between excess returns and R&D investment levels reported in previ-
ous studies is more likely to result from failure to control adequately for risk than from accounting-
induced mispricing.”
9
Also in 2002, Allen Eberhart of Georgetown University, in a nod to Baruch Lev, wrote “An Examina-
tion of Long-Term Abnormal Returns and Operating Performance Following R&D Increases.” In it he
asks “Do R&D increases lead to better-than-expected operating performance, and is the market slow
to recognize this benefit?” He found that “For the five-year period following their R&D increases, we
find consistently strong evidence that firms experience significantly positive abnormal operating per-
formance. We also find consistent evidence that shareholders experience significantly positive abnor-
mal stock returns for the five year period following their firm’s R&D increase. Our results provide
strong evidence investors systematically underreact to the benefits of an R&D increase.” At this point
the score is 2-1 in favor of the behavioral view over the efficient markets view.
In December 2005, Lev and his colleagues delivered the knock-out blow with their seminal study,
“The Stock Market Valuation of R&D Leaders” that took the R&D discussion one step further. If the
abnormal returns of highly innovative companies as a whole are due to incomplete risk adjustment,
then it would stand to reason that the most innovative companies should possess the most incom-
plete risk adjustment. In other words, the biggest spenders on knowledge production should have the
highest risk—in the form of subsequent earnings and stock price volatility.
Lev recognized that not all R&D spending is the same. In every industry, you have two groups of
companies: Knowledge Leaders and Knowledge Followers. On the one hand you have Knowledge
Leaders “who introduce new and innovative products.” While on the other hand, you have Knowledge
Followers “who mimic or react to the products of the Leaders.” Knowledge Leaders are pushing inno-
vation forward, while Knowledge Followers are just trying to keep up with the innovational spill-over
effects created by Knowledge Leaders. If R&D is equally risky for Knowledge Leaders and Knowledge
Followers, then the expected future abnormal returns should be similar to both. Also Knowledge
Leaders, who are more R&D-intensive than Knowledge Followers, should in theory produce a higher
but constant level of future abnormal returns to compensate for bearing more risk due to their more
intensive R&D investment strategy. In the end, Lev found Knowledge Leaders had higher “future mar-
ket share, future sales growth and future return on assets” than Followers which suggests that
“[Knowledge] Leaders have sustained future profitability” due to their innovation strategies. He also
found that stock return volatility and earnings variability, two measures of risk, were lower for
Knowledge Leaders than for Knowledge Followers.
The results were the exact opposite of what one would have expected based on a simple extrapola-
tion of the incomplete risk control perspective of Chambers. If more R&D-intensive companies are
actually less risky than lower R&D-intensive companies, then abnormal returns must be attributed to a
systematic mispricing of corporate innovation activities. Lev and his colleagues were able to empiri-
cally show that there is a market inefficiency in the shares of highly innovative companies, leading to
abnormal returns, directly related to conservative accounting treatment of corporate R&D activities.
Their research, the definitive body of work on the subject, rejected the efficient market hypothesis
view that R&D-intensive companies produce abnormal returns due to a greater level of systematic
risk.
10
Gavekal Knowledge Leaders Indexes Confirm Knowledge Effect
Building on the work of Lev, Chambers, Eberhart and many others, Gavekal Capital has created the
Knowledge Leaders Indexes. These indexes are designed to isolate the Knowledge Effect through a
multi-step quantitative, rules based selection process. They are the most comprehensive, longest
running, broadest indexes of highly innovative companies that exist. The results demonstrate that
companies that choose to pursue a knowledge-centric innovation strategy generate abnormal returns.
The effect is consistent across time and broadly applicable to a large universe of stocks.
In the Gavekal Knowledge Leaders Developed World Index (KNLGX, total return index) we begin with
all companies located in the 22 traditional developed countries, converting all financial data into US
Dollars. In each country we select the companies commensurate with capturing 85% of the market
capitalization of the entire country stock index. We eliminate all stocks in the US less than $1. We
next impose a liquidity constraint and will eliminate the 10% of companies with the lowest trading li-
quidity (shares traded * share price). At this point, there are roughly 2,000 companies in our raw se-
lection universe.
Next we transform the financials for all 2,000 companies by capitalizing all of their knowledge invest-
ments. We remove from the income statement all knowledge investments such as R&D, advertising,
employee training and the production of firm-specific resources. We capture these investments in the
investing section of the statement of cash flows, similar to how investments in property, plant and
equipment are treated. We then create an asset on company balance sheets to reflect the knowledge
investment. We maintain an asset on company balance sheets reflecting the gross cumulative invest-
ment in knowledge, the cumulative depreciation and the net cumulative investment in knowledge.
Each year, we add a non-cash charge to company income statements to reflect depreciation of their
knowledge capital. All knowledge that shows up on company balance sheets is assumed to be 100%
equity financed as its balancing counterpart is cumulative retained earnings.
With our knowledge-adjusted financial history of 2,000, we run through all the companies through a
screen we have developed to isolate on the most innovative companies. Companies passing the
screen must: 1) spend at least 5% of sales on knowledge investments or have at least 5% of assets
represented by knowledge, 2) generate over 20% gross margins, 3) have less than 3x gross financial
leverage 4) have less than 50% net debt as a percent of capital, 5) have a positive trailing seven year
average return on invested capital, 6) have at least a 10% operating cash flow margin on average
over the last seven years and 7) have a positive trailing seven year average free cash flow. There
are roughly 680 companies from 22 countries that pass our screen and constitute the Gavekal
Knowledge Leaders Developed World Index.
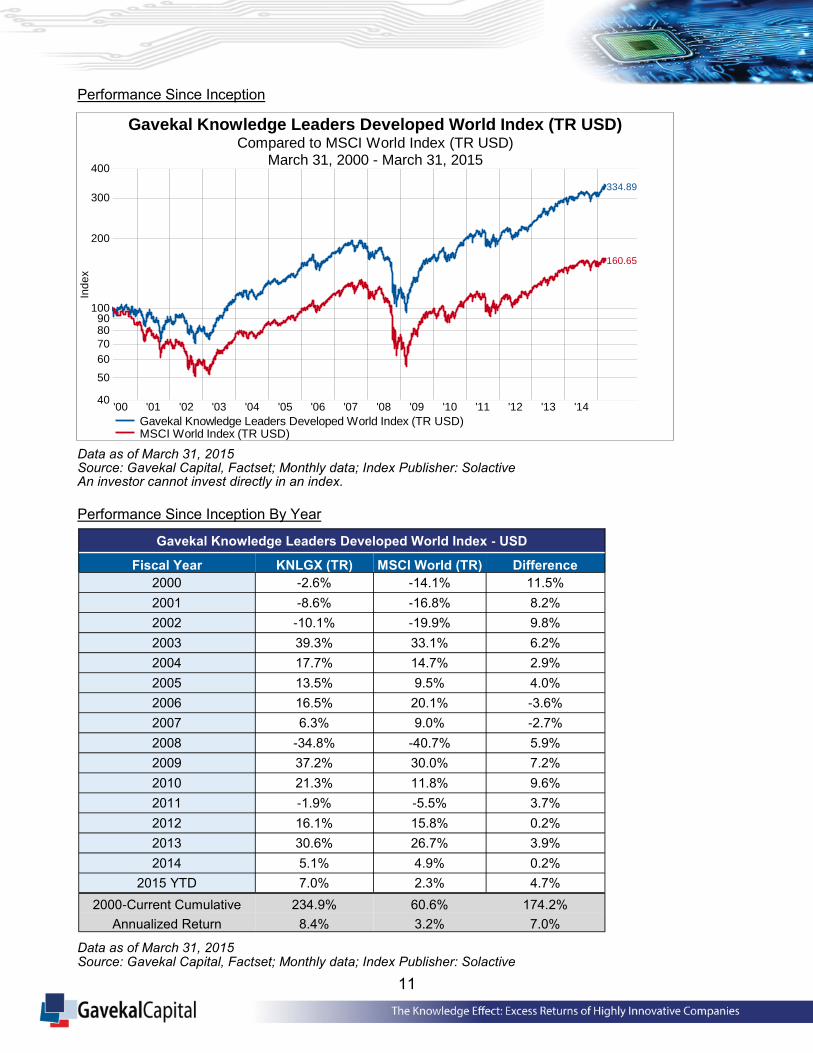
The index is equal-weighted, rebalanced twice a year and data begins on March 31, 2000. In the
chart and tables below, we show annual performance and risk metrics of the index compared to the
MSCI World Index. Since inception the Gavekal Knowledge Leaders Developed World Index is up a
cumulative 234.9% compared to the MSCI World Index, which was up 60.6% over the same period.
On an annualized rate, the KNLGX was up 8.4% while the MSCI World Index was up 3.2%.
11
Performance Since Inception
Data as of March 31, 2015 Source: Gavekal Capital, Factset; Monthly data; Index Publisher: Solactive An investor cannot invest directly in an index.
Performance Since Inception By Year
Data as of March 31, 2015 Source: Gavekal Capital, Factset; Monthly data; Index Publisher: Solactive
'00 '01 '02 '03 '04 '05 '06 '07 '08 '09 '10 '11 '12 '13 '1440
50
60
70
8090
100
200
300
400
Ind
ex
160.65
334.89
Gavekal Knowledge Leaders Developed World Index (TR USD)Compared to MSCI World Index (TR USD)
March 31, 2000 - March 31, 2015
Gavekal Knowledge Leaders Developed World Index (TR USD) MSCI World Index (TR USD)
Gavekal Knowledge Leaders Developed World Index - USD
Fiscal Year KNLGX (TR) MSCI World (TR) Difference
2000 -2.6% -14.1% 11.5%
2001 -8.6% -16.8% 8.2%
2002 -10.1% -19.9% 9.8%
2003 39.3% 33.1% 6.2%
2004 17.7% 14.7% 2.9%
2005 13.5% 9.5% 4.0%
2006 16.5% 20.1% -3.6%
2007 6.3% 9.0% -2.7%
2008 -34.8% -40.7% 5.9%
2009 37.2% 30.0% 7.2%
2010 21.3% 11.8% 9.6%
2011 -1.9% -5.5% 3.7%
2012 16.1% 15.8% 0.2%
2013 30.6% 26.7% 3.9%
2014 5.1% 4.9% 0.2%
2015 YTD 7.0% 2.3% 4.7%
2000-Current Cumulative 234.9% 60.6% 174.2%
Annualized Return 8.4% 3.2% 7.0%
12
In thirteen out of the last fifteen years the KNLGX index outperformed the MSCI World Index. The
only two years of underperformance were 2006 and 2007, at the height of the financial and commodi-
ty bubble that preceded the Great Financial Crisis of 2008-2009. Of particular note is how the index
performed during the last two 50% drawdowns in stocks. In the 2000-2003 period, the MSCI World
index fell 50% from peak to trough. The KNLGX index was down roughly 32% from peak to trough
and then rebounded in 2003 returning 37% vs the MSCI World Index return of 30%. In the 2007-2009
period, both the KNLGX and MSCI World Index were down about 50%, but KNLGX rebounded in
2009 returning 34% while the MSCI World Index returned only 27%.
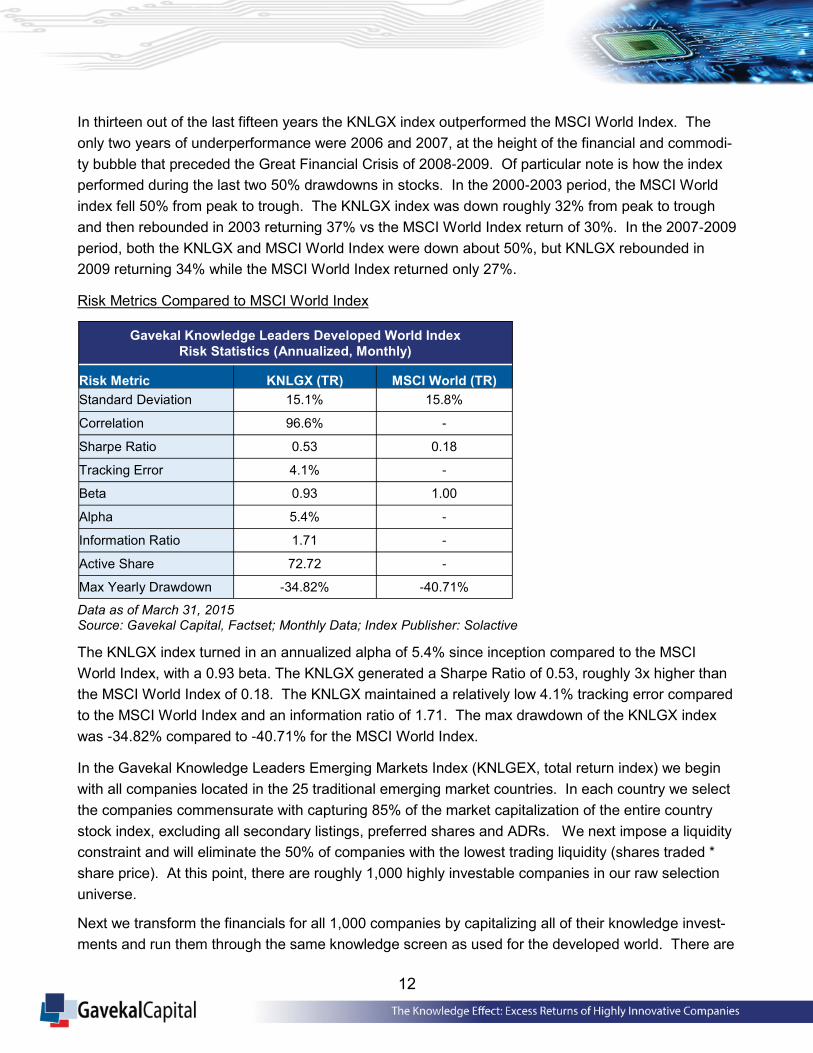
Risk Metrics Compared to MSCI World Index
Data as of March 31, 2015 Source: Gavekal Capital, Factset; Monthly Data; Index Publisher: Solactive
The KNLGX index turned in an annualized alpha of 5.4% since inception compared to the MSCI
World Index, with a 0.93 beta. The KNLGX generated a Sharpe Ratio of 0.53, roughly 3x higher than
the MSCI World Index of 0.18. The KNLGX maintained a relatively low 4.1% tracking error compared
to the MSCI World Index and an information ratio of 1.71. The max drawdown of the KNLGX index
was -34.82% compared to -40.71% for the MSCI World Index.
In the Gavekal Knowledge Leaders Emerging Markets Index (KNLGEX, total return index) we begin
with all companies located in the 25 traditional emerging market countries. In each country we select
the companies commensurate with capturing 85% of the market capitalization of the entire country
stock index, excluding all secondary listings, preferred shares and ADRs. We next impose a liquidity
constraint and will eliminate the 50% of companies with the lowest trading liquidity (shares traded *
share price). At this point, there are roughly 1,000 highly investable companies in our raw selection
universe.
Next we transform the financials for all 1,000 companies by capitalizing all of their knowledge invest-
ments and run them through the same knowledge screen as used for the developed world. There are
Gavekal Knowledge Leaders Developed World Index
Risk Statistics (Annualized, Monthly)
Risk Metric KNLGX (TR) MSCI World (TR)
Standard Deviation 15.1% 15.8%
Correlation 96.6% -
Sharpe Ratio 0.53 0.18
Tracking Error 4.1% -
Beta 0.93 1.00
Alpha 5.4% -
Information Ratio 1.71 -
Active Share 72.72 -
Max Yearly Drawdown -34.82% -40.71%
13
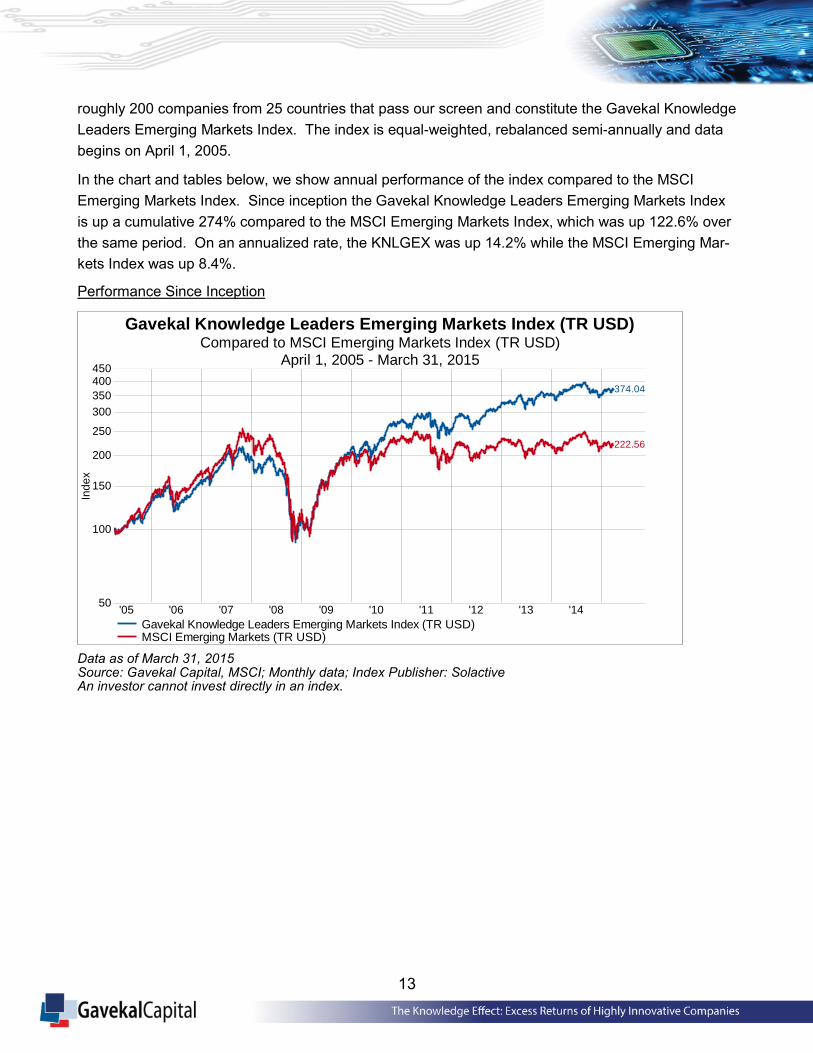
roughly 200 companies from 25 countries that pass our screen and constitute the Gavekal Knowledge
Leaders Emerging Markets Index. The index is equal-weighted, rebalanced semi-annually and data
begins on April 1, 2005.
In the chart and tables below, we show annual performance of the index compared to the MSCI
Emerging Markets Index. Since inception the Gavekal Knowledge Leaders Emerging Markets Index
is up a cumulative 274% compared to the MSCI Emerging Markets Index, which was up 122.6% over
the same period. On an annualized rate, the KNLGEX was up 14.2% while the MSCI Emerging Mar-
kets Index was up 8.4%.
Performance Since Inception
Data as of March 31, 2015 Source: Gavekal Capital, MSCI; Monthly data; Index Publisher: Solactive An investor cannot invest directly in an index.
'05 '06 '07 '08 '09 '10 '11 '12 '13 '1450
100
150
200
250
300
350
400450
Ind
ex
222.56
374.04
Gavekal Knowledge Leaders Emerging Markets Index (TR USD)Compared to MSCI Emerging Markets Index (TR USD)
April 1, 2005 - March 31, 2015
Gavekal Knowledge Leaders Emerging Markets Index (TR USD) MSCI Emerging Markets (TR USD)
14
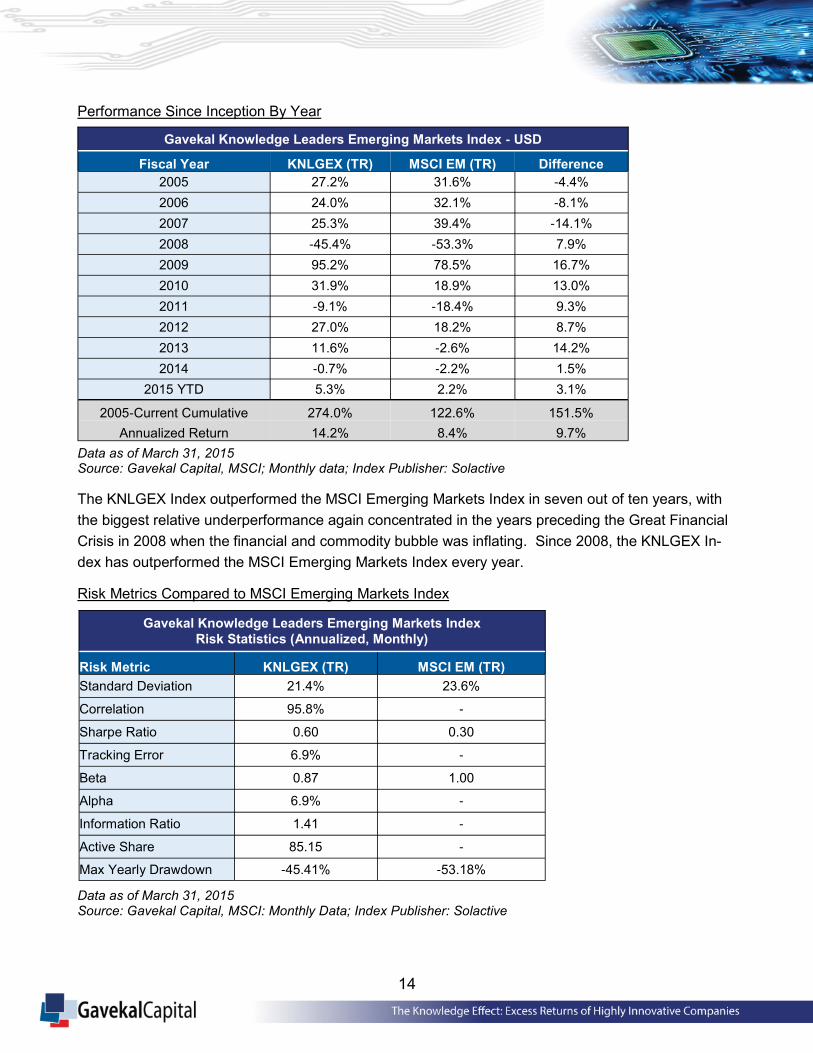
Performance Since Inception By Year
Data as of March 31, 2015 Source: Gavekal Capital, MSCI; Monthly data; Index Publisher: Solactive
The KNLGEX Index outperformed the MSCI Emerging Markets Index in seven out of ten years, with
the biggest relative underperformance again concentrated in the years preceding the Great Financial
Crisis in 2008 when the financial and commodity bubble was inflating. Since 2008, the KNLGEX In-
dex has outperformed the MSCI Emerging Markets Index every year.
Risk Metrics Compared to MSCI Emerging Markets Index
Data as of March 31, 2015 Source: Gavekal Capital, MSCI: Monthly Data; Index Publisher: Solactive
Gavekal Knowledge Leaders Emerging Markets Index - USD
Fiscal Year KNLGEX (TR) MSCI EM (TR) Difference
2005 27.2% 31.6% -4.4%
2006 24.0% 32.1% -8.1%
2007 25.3% 39.4% -14.1%
2008 -45.4% -53.3% 7.9%
2009 95.2% 78.5% 16.7%
2010 31.9% 18.9% 13.0%
2011 -9.1% -18.4% 9.3%
2012 27.0% 18.2% 8.7%
2013 11.6% -2.6% 14.2%
2014 -0.7% -2.2% 1.5%
2015 YTD 5.3% 2.2% 3.1%
2005-Current Cumulative 274.0% 122.6% 151.5%
Annualized Return 14.2% 8.4% 9.7%
Gavekal Knowledge Leaders Emerging Markets Index
Risk Statistics (Annualized, Monthly)
Risk Metric KNLGEX (TR) MSCI EM (TR)
Standard Deviation 21.4% 23.6%
Correlation 95.8% -
Sharpe Ratio 0.60 0.30
Tracking Error 6.9% -
Beta 0.87 1.00
Alpha 6.9% -
Information Ratio 1.41 -
Active Share 85.15 -
Max Yearly Drawdown -45.41% -53.18%
15
Turning to risk metrics, the KNLGEX index had a beta of 0.87 since inception compared to the MSCI
Emerging Markets Index, and generated an annualized alpha of 6.9%. The 0.60 Sharpe Ratio of the
KNLGEX index is 2x higher than the 0.30 of the MSCI Emerging Markets Index. The tracking error of
the KNLGEX index is 6.9% and the information ratio is 1.41. The KNLGEX index experienced a
-45.41% max drawdown while the MSCI Emerging Markets Index experienced a -53.18% max draw-
down.
The results of both of our indexes indicate that knowledge intensive companies experience significant
abnormal returns. Our findings suggest that the Knowledge Effect exists in the developed markets
and the emerging markets. The persistence and applicability of the Knowledge Effect demonstrate its
statistical significance.
Conclusion
In “Thinking, Fast and Slow” Daniel Kahneman, a Nobel Prize-winning behavioral economist, de-
scribes two mental processes we employ when making decisions. All humans have a System-1, as
he calls it, our instinctual brain, where we process emotions, avoid danger and process information on
a reactionary basis. We also have a System-2 where we process rational thought, weigh options, de-
cide in a very deliberate fashion what to do. Many times our System-1 and System-2 conflict, and the
decisions we make reflect this conflict. One well-known conflict in economics is called “myopic loss
aversion” which arises because our System-1 is instinctively very risk averse. It is so risk averse, that
people sometimes behave in such a way to avoid a financial loss that seems to contradict logic. Peo-
ple experience greater unhappiness losing $1 than they experience happiness making $1, so they
behave in ways that reflect this asymmetry. This systematic error is at the crux of many stock market
effects, including the Knowledge Effect.
System-2 has difficulty appreciating just what exponential growth truly means. In 2010, then-CEO of
Google, Eric Schmidt offered an astounding statistic on information creation at the Techonomy con-
ference in Lake Tahoe, CA. He said that in just two days the world creates as much information as
humankind did from the dawn of civilization to 2003. And this was five years ago. The speed at which
information is created has only sped up, dramatically increasing the raw ingredients of knowledge.
Semiconductors are rapidly being integrated in everyday objects. This integration is commonly re-
ferred to as the Internet of Things (IoT). Semiconductors allow objects now to “speak” to one another
by transferring data without any human interaction. A decade ago the idea that semiconductors could
be used in combination with a bracelet to provide detailed analytics to the user about their activity lev-
els, their sleep patterns, and provide caller ID for your phone (i.e. Fitbit) probably seemed somewhat
ludicrous. However, change can occur quickly as the roughly $4.5 billion wearable technology indus-
try is now projected to have revenues of around $53 billion by 2019.
In their 2013 piece, “Is the Information Technology Revolution Over,” Federal Reserve researchers
David Bryne, David Oliner and Daniel Sichel, suggest that not only is the information technology revo-
lution not over, we could be on the cusp of second wave. They “present evidence that innovation for
semiconductors continues to proceed at a rapid pace, raising the possibility of a second wave in the
IT revolution.” Before the semiconductor wave is over, many industries will be created and disrupted.
16
Knowledge-intensive companies will be at the heart of this creation destruction, making it increasingly
necessary for investors to understand innovative companies. Investors that can take advantage of
systematic errors can convert the abnormal returns of highly innovative companies into portfolio al-
pha.
So, what drives stock returns? History and practice suggest there is no single answer to this question.
Fifty years ago, simply the relationship to the broader equity market seemed to be the best answer. A
couple of decades later, academics had the breakthrough that there are multiple, some yet to be iden-
tified, factors that drive stock performance. In this paper, we propose a new effect that explains stock
returns—the Knowledge Effect—that derives from the explosion in knowledge production and the ab-
sence of information on corporate innovation. We have created the Gavekal Knowledge Leaders
Indexes to measure and capture the Knowledge Effect.
17
Sources
Abrahams, Tony and Baljit K. Sidhu. “The Role of R&D Capitalisations in Firm Valuation and Perfor-
mance Measurement.” Australian Journal of Management, Vol. 23, No. 2, December 1998.
Ai, Hengjie. “Intangible Capital and the Value Premium”. Working paper, January 2010.
Amir, Eli, Yanling Guan, and Gilad Livne. “The Association between the Uncertainty of Future Eco-
nomics Benefits and Current R&D and Capital Expenditures: Industry and Intertemporal Analysis.”
Cass Business School Research Paper, June 2005.
Ballester, Marta, Manuel Garcia-Ayuso, and Joshua Livnat. “The Economic Value of the R&D Intangi-
ble Asset.” European Accounting Review, Vol. 12, No. 4, February 2003.
Benartzi, Schlomo and Richard Thaler. “Myopic Loss Aversion and the Equity Premium Puzzle.”
Working Paper, May 1993.
Bender, Jennifer, Remy Briand, Dimitris Melas, and Raman Aylur Subramanian. “Foundations of Fac-
tor Investing.” MSCI, December 2013.
Bender, Jennifer, Remy Briand, Dimitris Melas, Raman Aylur Subramanian, and Madhu Subramani-
an. “Deploying Multi-Factor Index Allocations in Institutional Portfolios.” MSCI, December 2013.
Bresnahan, Timothy F., and Manual Trajtenberg. “General Purpose Technologies: Engines of
Growth?” Working paper, August 1992.
Byrne, David M., Stephen D. Oliner, and Daniel E. Sichel. “How Fast Are Semiconductor Prices Fall-
ing?” Working paper, December 2014.
Byrne, David M., Stephen D. Oliner, and Daniel E. Sichel. “Is The Information Technology Revolution
Over?” Working paper, March 2013.
Chambers, Dennis, Ross Jennings and Robert B. Thompson II. “Excess Returns to R&D-Intensive
Firms.” Working paper, January 2002.
Chan, Louis K.C., Josef Lakonishok, and Theodore Sougiannis. “The Stock Market valuation of Re-
search and Development Expenditures.” Working paper, July 1999.
Corrado, Carol A., and Charles R. Hulten. “How Do You Measure A ‘Technological Revolution’?” Con-
ference Board, January 2010.
Eberhart, Allan C., William F. Maxwell, and Akhtar R. Siddique. “An Examination of Long-Term Abnor-
mal Stock Returns and Operating Performance Following R&D Increases.” Journal of Finance, Vol.
59, No. 2 (December 2002), pp. 623-650.
Field, Alexander J. A Great Leap Forward. 2011.
Financial Accounting Standards Board. “Statement of Financial Accounting Standards No. 2.” October
1974.
Gave, Louis-Vincent. Our Brave New World. 2006.
18
Helpman, Elhanan, and Manual Trajtenberg. “Diffusion of General Purpose Technologies.” Working
paper, September 1996.
Jiang, Yi, Yiming Qian, and Tong Yao. “R&D and Stock Returns: Is There a Spill-Over Effect?” Work-
ing paper, July 2014.
Kothari, S.P., Ted E. Laguerre, and Andrew J. Leone. “Capitalization versus Expensing: Evidence on
the Uncertainty of Future Earnings from Capital Expenditures versus R&D Outlays.” Review of Ac-
counting Studies, (November 2000), pp 355-382.
Kurzweil, Ray. “The Law of Accelerating Returns.” Kurzweil Accelerating Intelligence, March 2001.
Lev, Baruch. “New Accounting for the New Economy.” Working paper, May 2000.
Lev, Baruch, Doron Nissim, and Jacob Thomas. “On The Informational Usefulness of R&D Capitaliza-
tion and Amortization.” Working paper, April 2005.
Lev, Baruch, Suresh Radhakrishnan, and Mustafa Ciftci. “The Stock Market Valuation OF R&D Lead-
ers.” Working paper, December 2005.
Lev, Baruch, Theodore Sougiannis. “The Capitalization, Amortization, and Value-Relevance of R&D”.
Journal of Accounting and Economics, Vol 21 (1996), pp 107-138.
Kahneman, Daniel. Thinking, Fast and Slow. April 2013.
Nix, Paul E., and David E. Nix. “A Historical Review of the Accounting Treatment of Research and
Development Costs.” The Accounting Historians Journal, Vol. 19, No. 1 (June 1992), pp 51-78.
Peters, Ryan H., and Lucian A. Taylor. “Intangible Capital and the Investment-q Relation.” Working
paper, September 2013.
Romer, Paul. “Economic Growth.” The Concise Encyclopedia of Economics. 2007.
Romer, Paul. “Endogenous Technological Change.” Journal of Political Economics, Vol. 98, No. 5
(2007).
Siegler, MG. "Eric Schmidt: Every 2 Days We Create As Much Information As We Did Up To 2003."
TechCrunch. Accessed April 1, 2015. http://techcrunch.com/2010/08/04/schmidt-data/.
Solow, Robert M. “Technical Change and the Aggregate Production Function.” The Review of Eco-
nomics and Statistics, Vol. 39, No. 3 (August 1957), pp. 312-320.
"Smart Wearables Market to Generate $53bn Hardware Revenues by 2019." Juniper Research. Ac-
cessed April 1, 2015. http://www.juniperresearch.com/press/press-releases/smart-wearables-market-
to-generate-$53bn-hardware.
"The Story of the Intel® 4004." Intel. Accessed April 1, 2015. http://www.intel.com/content/www/us/en/
history/museum-story-of-intel-4004.html.
19
Definitions
Alpha is a measure of the portfolio’s risk adjusted performance. When compared to the portfolio’s be-
ta, a positive alpha indicates better-than-expected portfolio performance and a negative alpha worse-
than-expected portfolio performance.
Beta is a measure of the funds sensitivity to market movements. A portfolio with a beta greater than 1
is more volatile than the market and a portfolio with a beta less than 1 is less volatile than the market.
Downside Capture is used to evaluate how well or poorly an investment manager performed relative
to an index during periods when the index has dropped.
Max Drawdown is the maximum single period loss incurred over the interval being measured.
The MSCI World Index is a free float-adjusted market capitalization weighted index that is designed to
measure the equity market performance of developed markets.
Sharpe Ratio uses a fund’s standard deviation and its excess return (the difference between the
fund’s return and the risk‐free return of 90‐day Treasury Bills) to determine reward per unit of risk.
Standard deviation is a calculation used to measure variability of a portfolio’s performance.
Tracking Error is a measure of how closely a portfolio follows the index to which it is benchmarked.
Upside Capture is used to evaluate how well an investment manager performed relative to an index
during periods when that index has risen.
An investor cannot invest directly in an index.
Disclaimer
This document does not constitute an offer of services in jurisdictions where Gavekal Capital, LLC is
not authorized to conduct business. All information provided herein by Gavekal Capital is impersonal
and not tailored to the needs of any person, entity or group of persons. Past performance of an index
is not a guarantee of future results. It is not possible to invest directly in an index. Exposure to
an asset class represented by an index is available through investable instruments based on that in-
dex. Gavekal Capital makes no assurance that investment products based on the index will accurate-
ly track index performance or provide positive investment returns. A decision to invest in any such
investment fund or other investment vehicle should not be made in reliance on any of the statements
set forth in this document. Prospective investors are advised to make an investment in any such fund
or other vehicle only after carefully considering the risks associated with investing in such funds, as
detailed in an offering memorandum or similar document that is prepared by or on behalf of the issuer
of the investment fund or other vehicle. Inclusion of a security within an index is not a recommenda-
tion by Gavekal Capital to buy, sell or hold such a security, nor is it considered to be investment ad-
vice. Closing prices for the Gavekal Knowledge Leaders Indexes are calculated by Solactive AG
based on the closing price of the individual constituents of the index as set by their primary exchange.
These materials have been prepared solely for informational purposes based upon information gener-
ally available to the public from sources believed to be reliable. No content contained in these materi-
20
als (including index data, ratings, credit-related analyses and data, model, software or other applica-
tion or output therefrom) or any part there of (Content) may be modified, reverse-engineered, repro-
duced or distributed in any form by any means, or stored in a database or retrieval system, without
the prior written permission of Gavekal Capital. The Content shall not be used for any unlawful or un-
authorized purposes. Gavekal Capital and its third-party data providers and licensors do not guaran-
tee the accuracy, completeness, timeliness or availability of the Content. Gavekal Capital Parties are
not responsible for any errors or omissions, regardless of the cause, for the results obtained from the
use of the Content. The Content is provided on an “as is” basis.
The Gavekal Knowledge Leaders Developed World Index and the Gavekal Knowledge Leaders
Emerging Markets Index (Indexes) claim to be the longest running, real time test of the innovation
leaders. This claim was determined via an internal search of all indexes offered by the following list of
index providers, which we believe to be comprehensive: S&P Dow Jones Indices, MSCI, FTSE,
FTSE/TMX Canada, Solactive, Research Affiliates, NASDAQ OMB Global Indices, Morningstar, Rus-
sell Investments, Auspice eBeta Enhanced Indices, BNY Mellon Indices, CME Group/Dow Jones,
Barclays Capital Indices, Zacks Investment Research, Alphashares, Cohen & Steers and Sustainable
Wealth Management. None of these providers offer indexes compiling global innovation leader stocks
nor do they offer indexes that have a quantitative process to measure a company’s innovation.
Gavekal will continue to monitor the above mentioned landscape with the goal of provide accurate
and non-misleading information.
The Indexes are calculated and published by Solactive AG. Solactive AG uses its best efforts to en-
sure that the Indexes are calculated correctly. Irrespective of its obligations towards Gavekal Capital,
Solactive AG has no obligation to point out errors in the Indexes to third parties including but not lim-
ited to investors and/or financial intermediaries of the financial instrument. Neither publication of the
Indexes by Solactive AG nor the licensing of the Indexes or Indexes trademark for the purpose of use
in connection with the financial instrument constitutes a recommendation by Solactive AG to invest
capital in said financial instrument nor does it in any way represent an assurance or opinion of Solac-
tive AG with regard to any investment in any financial instrument.
For full information including any named holdings that may have been mentioned in the document as
well as additional policies and full disclosures on the Advisor, please visit our website gavekalcapi-
tal.com.