the determinants of european banks' capital structure: is
TRANSCRIPT
The Determinants of European Banks’ CapitalStructure: Is There a Difference between Public
and Private Banks?∗
Vitor Oliveiraa,b and Clara Raposob,c
aBanco de PortugalbISEG – Lisbon School of Economics and Management,
Universidade de LisboacADVANCE/CSG
In this paper we examine whether the determinants ofEuropean banks’ capital structure depend on the type of theinstitution (private or public). Using an international sampleof 586 banks from 21 European countries for the period of2000 to 2016, we find that when compared with private banks,the determinants of public banks’ capital structure are moreclosely aligned with those that affect nonfinancial firms. Fur-thermore, this paper provides evidence that these differencescan result in certain consequences with regards to the accessto the market, which implies that public banks are more sub-ject to market discipline. This is a very topical question, par-ticularly when studied in the context of the introduction ofmore demanding capital requirements through Basel III and,in particular, in the context of the new resolution regime whichimposes additional capital requirements, where banks’ accessto equity and debt markets plays a pivotal role.
JEL Codes: G21; G32.
∗The authors acknowledge helpful comments and suggestions from AntonioAntunes, Diana Bonfim, Hugo Reis, Miguel Ferreira, Olivier De Jonghe, RaquelGaspar, Sudipto Karmakar, Teodora Paligorova, and the two anonymous referees.Clara Raposo gratefully acknowledges financial support from FCT - Fundacaopara a Ciencia e Tecnologia (Portugal), national funding through research grant(UID/SOC/04521/2013). Clara Raposo also acknowledges the support of FCTgrant PTDC/EGE-OGE/28603/2017. The views expressed in this article arethose of the authors and do not necessarily reflect the views of the Bancode Portugal or the Eurosystem. Author e-mails: [email protected] [email protected].
155
156 International Journal of Central Banking September 2021
1. Introduction
According to modern financial literature, the study of capital struc-ture began with Modigliani and Miller (1958), who stated that ina frictionless world with full information and complete markets, thevalue of firms is independent of their capital structure (Santos 2001),leaving room for further research regarding the impact of disregard-ing the “frictionless assumption,” i.e., by adding taxes, costs of finan-cial distress, imperfections in the product market, transactions costs,asymmetry of information, and agency costs.
The study of the above-mentioned frictions has originated sev-eral theories, such as the trade-off theory, the pecking order theory,and the market timing theory (Flannery and Rangan 2006).
The great majority of the published empirical evidence over thelast decades which is dedicated to the topic of capital structurewas developed for nonfinancial firms. For instance, Rajan and Zin-gales (1995) justify the exclusion of financial firms from their sam-ple, because their leverage would be strongly influenced by explicit(or implicit) investor insurance schemes, such as deposit insurance.Furthermore, regulation such as minimum capital requirements candirectly affect the capital structure of financial firms.
Nevertheless, more recent empirical research regarding bank cap-ital structure has contributed evidence which supports that theattributes that affect bank capital structure are not very differentfrom those that influence the capital structure of nonfinancial firms.Studies by Flannery (1994), Flannery and Rangan (2008), and Allen,Carletti, and Marquez (2011) have shown that market discipline(carried out by subordinated creditors, or even by depositors) hasplayed an important role in banks’ capital structure. By the sametoken, other empirical papers published on this matter, such as Bar-ber and Lyon (1997), Brewer Iii, Kaufman, and Wall (2008), Groppand Heider (2010), and De Jonghe and Oztekin (2015), have foundthat bank-specific indicators also explain, to a large extent, bankcapital structure, i.e., most banks seem to optimize their capitalstructure in much the same way as firms, except when their capitalratios are close to the regulatory minimum.
Nevertheless, most of the empirical studies developed so farregarding banks’ capital structure are focused on large, public banks(Gropp and Heider 2010) and also on the main determinants of
Vol. 17 No. 3 The Determinants of European Banks’ Capital 157
the speed of adjustment toward the banks’ target capital ratio (DeJonghe and Oztekin 2015), tending to omit an analysis of the rela-tionship between the type of banks and their behavior regardingcapital structure decisions. It is exactly this gap that we aim to fillwith this paper.
Accordingly, we attempt to empirically answer the followingquestion: Are the determinants of banks’ capital structure differentin public versus private banks? For the purpose of this paper, publicbanks are considered to be those that are quoted/listed in capitalmarkets, whereas private banks are those that are not quoted/listedin capital markets.
The answer to this question is relevant from an empirical aswell as a policy point of view. From an empirical point of view, itis important to challenge the conclusions drawn from the above-mentioned studies, which use samples that comprise only large andpublic banks—which are subject to a different intensity of mar-ket discipline and/or use a pooled data set of banks, extrapolatingthe results for the whole sample, which in turn could hide somenon-negligible differences regarding the determinants of the capitalstructure of public and private banks.
From a policy point of view, when examined in the context of therequirements for additional capital, which has led to banks increas-ingly having to resort to own funds through the issue of, amongothers, equity or debt instruments with certain specific characteris-tics (e.g., subordinated debt) where the access to the market playsa pivotal role, it is important to investigate how the determinants ofbanks’ capital structure have influenced banks’ access to the market(which is represented by the share of subordinated debt for totalassets).1
Using an international sample of 586 banks from 21 Euro-pean countries for the period of 2000 to 2016, our results for the
1Beyond the new capital requirements encompassing the new capital buffers—namely the conservation capital buffer, countercyclical capital buffer, and system-ically important institutions buffer (introduced with the Basel III framework)—the Directive on Banking Recovery and Resolution that entered into force in 2016implies banks’ compliance with the additional capital requirements so-called min-imum requirement for own funds and eligible liabilities (MREL) which shouldequal 2 × (pillar 1 requirements + pillar 2 requirements and the combined bufferrequirement) – 125 basis points.
158 International Journal of Central Banking September 2021
whole sample confirm, to some extent, those of Gropp and Heider(2010), where size is positively related with leverage, whereas profits,market-to-book value, and risk all have a negative impact on lever-age, which is broadly consistent with the pecking order and markettiming theories.
Furthermore, considering the argument that banks manage theircapital or leverage ratios based on achieving a target, we show thatthe speed of adjustment is material in banks, which enables theseinstitutions to converge toward their long-run target.
Interestingly, our results have identified important differencesbetween public and private banks. Whereas the determinants of thecapital structure of public banks present a set of similarities withnonfinancial firms (which is in line with the results presented byGropp and Heider 2010), for private banks we find that those deter-minants which are typical of the market timing and pecking ordertheories fail to evidence the same relevance as in the case of publicbanks.
Besides the higher asymmetry of information which characterizesprivate firms, including financial ones, this paper provides empiricalevidence that those banks whose capital structure has been drivenby the determinants envisaged in the literature (public banks) havebeen subjected to more market discipline (which is represented bythe share of funding through subordinated debt).
The consequences of the above-mentioned differences observedbetween public and private banks for both the empirical literatureand financial stability are twofold. From an empirical point of view,this is the first study which shows that “one size does not fit all,”i.e., that the determinants of banks’ capital structure vary betweenprivate and public banks. From a financial stability point of view,during an initial phase, the differences observed in this paper couldnegatively affect the access of private banks to capital and debt mar-kets and thus compound the difficulties in complying with the moredemanding capital requirements envisaged in Basel III, as well asin the new resolution regime—which implies the issuance of bail-in-able instruments. However, in the long term, it is expected thatthe implications of the new resolution regime (such as the issuanceof MREL, composed of bail-in-able instruments, such as subordi-nated debt) will contribute to broadening market discipline to alltypes of banks and to the alignment of the determinants of their
Vol. 17 No. 3 The Determinants of European Banks’ Capital 159
capital structure. Additionally, the supervisors and regulators maywell be able to reap the benefits of a wider market discipline—whichis detailed below in this paper.
The remainder of the paper is organized as follows: Section 2presents a literature review, which is focused on capital structuredeterminants (in general for nonfinancial firms, and specifically forbanks). Section 3 develops hypotheses about how the determinantsof capital structure in nonfinancial firms play a role in the caseof banks. Section 4 introduces the data set, including descriptivestatistics for bank-specific indicators and a cross-country analysis.The methodological approach is discussed in section 5. Section 6reports the results and robustness tests, and the main conclusionsare presented in section 7.
2. Literature Review
2.1 The Determinants of Capital Structure
Modern capital structure theory began with Modigliani and Miller(1958), advocating that the value of firms is independent of itscapital structure in a frictionless world with full information andcomplete markets (Santos 2001), leaving room to exploit certainfrictions.
To this end, Berger, Herring, and Szego (1995) summarize thatthe main frictions that cause capital decisions to depart fromModigliani and Miller (1958) are (i) taxes—as interest paymentsare tax deductible, whereas dividends are not, and that by sub-stituting debt for equity, firms are able to pass on larger returnsto investors by reducing payments to the government, and, there-fore, all else being equal, shareholders prefer to fund firms almostentirely with debt; (ii) financial distress—where more leverage canlead to an increase in the likelihood of incurring the costs of finan-cial distress; (iii) asymmetric information—which stems from thefact that managers generally have access to more information abouttheir own earnings prospects and financial condition than the mar-ket; (iv) transactions costs of new issues—which when combinedwith asymmetric information can also influence the relative costs ofinternal versus external finance, and the relative costs of debt versus
160 International Journal of Central Banking September 2021
equity, and; (v) agency costs between shareholders and creditors orbetween the former and managers (Jensen and Meckling 1976).
A sizable amount of research has been carried out since then,which can be summarized into three main theories (Flannery andRangan 2006): the trade-off theory, the pecking order theory, andthe market timing theory. According to the trade-off theory, firmsselect target debt-equity ratios to trade off the costs and benefitsof leverage, contradicting the unrealistic assumption that firms arealways at their equilibrium leverage (Oztekin and Flannery 2012).The benefits of leverage include the tax deductibility of the debtservice (the well-known “interest tax shield”) and the agency ben-efits of debt associated with conflicts of interest between managersand stockholders. The costs of debt can be identified as costs ofbankruptcy or financial distress, agency costs due to misalignmentof interests between stockholders and creditors, and trading costs(according to Oztekin 2015, if a country’s characteristics make theissuance of debt and equity expensive, firms tend to exhibit sloweradjustment speeds). The pecking order theory, which was first sug-gested by Myers and Majluf (1984), is based on the assumptionthat information asymmetries between insiders and outsiders canlead managers to perceive that the uninformed market would gen-erally underprice their firm’s equity—and for this reason, managershave a preference for investments to be financed first with internalfunds, second with secured debt, and lastly with equity—which isonly used as a last resort. This order of preference between internalversus external funds, and between debt versus equity, is a justifi-cation for firms to maintain a certain financial slack, particularlythose firms that operate in industries which are particularly opaqueand are subject to asymmetry of information between insiders andoutsiders. The market timing theory argues that a firm’s leveragereflects its cumulative ability to sell overpriced equity shares, i.e.,share prices fluctuate around their “true” value, and managers tendto issue shares when the firm’s market-to-book value is high. There-fore, by exploiting asymmetric information, firms increase the wealthof their current shareholders.
Recent research on capital structure has been developed aroundthese three competing, but not necessarily mutually exclusive, the-ories. Many empirical studies have tried to identify the correctmeasures for characterizing the attributes present in these theories.

Vol. 17 No. 3 The Determinants of European Banks’ Capital 161
Amongst the main studies of interest in this context, we highlightTitman and Wessels (1988), Rajan and Zingales (1995), Flanneryand Rangan (2006), Lemmon, Roberts, and Zender (2008), andFrank and Goyal (2009). The measures used in these papers comprise(i) collateral, which is defined as being the sum of liquid assets andfixed assets; (ii) firm size, which is represented by total assets; (iii)market-to-book ratio, which is defined as being the ratio between themarket value of assets and the book value of total assets; (iv) firmrisk, which is usually computed as the standard deviation of a firm’smarket stock returns; and (v) profits. Collateral and firm asset riskcan be included in the trade-off theory, whereas profits and market-to-book value are more easily aligned with the pecking order the-ory and market timing, respectively. To this end, Harris and Raviv(1991) showed that leverage increases with fixed assets (collateral),as well as with nondebt tax shields, growth opportunities, and firmsize, and that it decreases with volatility, advertising expenditures,bankruptcy probability, and the uniqueness of the products.
With regards to the relationship between the above-mentionedvariables and firms’ capital structure, Rajan and Zingales (1995)concluded that (i) the relationship between the ratio of fixed assetsto total assets and leverage is positive—the rationale underlying thisfactor being that tangible assets are easy to collateralize and theythus reduce the agency costs of debt; (ii) leverage is negatively cor-related with market-to-book value for two reasons: first, in theory,firms with high market-to-book ratios have higher costs of finan-cial distress and, second, this negative correlation stems from firms’tendency to issue stock when their stock price is high in relationto earnings or book value (which thus supports the assumptionsunderlying the market timing theory); (iii) size is positively corre-lated with leverage, as, in theory, larger firms are better diversifiedand have a lower probability of being in financial distress; and (iv)profitability is negatively correlated with leverage (which supportsthe pecking order theory). To a large extent, these results are con-sistent with those obtained by Frank and Goyal (2009), who used adifferent sample of firms as well as a different time span.
Flannery and Rangan (2006), Lemmon, Roberts, and Zender(2008), Oztekin and Flannery (2012), and Oztekin (2015) all focusedon testing firms’ willingness to move toward their target leverageratio, and found that firms converge toward their long-run targets
162 International Journal of Central Banking September 2021
at a rate of more than 30 percent per year, which depends, to alarger extent, on the institutional environment. An example is thosecountries which ease the issuance of debt and/or equity contributeto accelerate the speed of adjustment toward the optimal leverageratio (Oztekin and Flannery 2012 and Oztekin 2015).
2.2 The Special Case of Banks
In many ways, banks are different from nonfinancial firms, whichare able to induce differences in their capital structure decisions.Cocris and Ungureanu (2007) surmise that the main differences arethat a high proportion of bank failures lead to negative externalities;agency problems are enhanced by the inefficient monitoring of banksby depositors and other stakeholders; information flow is complex,due to the opaque environment in which banks operate; banks areheavily regulated; sometimes the regulator itself is a bank stake-holder; the diversification of activities within a bank conglomerateintensifies agency problems between corporate insiders and smallshareholders; in general, banks have a more concentrated equityownership than nonfinancial firms, which makes it more difficultfor small equity holders to exert influence over the management ofbanks; there is less competition regarding financial products andtakeover activity; and banks have a safety net available, which affectsthe stakeholders’ incentives to monitor banks. In addition, Harding,Liang, and Ross (2013) highlight the high levels of leverage whichcharacterizes banks’ capital structure, which was arguably respon-sible for the failure of the majority of investment banks during therecent global financial crisis.
To some extent, the identification of these special features ofthe banking sector are shared by Berger, Herring, and Szego (1995)and Santos (2001), who both mention that the main frictions in thebanking sector which can justify the departure from Modigliani andMiller (1958) are the following: the existence of a safety net—whichis defined as all government actions which are devised to improvethe safety and soundness of the banking system and thus shieldbanks’ creditors (mainly depositors) from the full consequences ofbank risk-taking; and the capital requirements stated by the regu-lators to protect themselves against the costs of financial distress,
Vol. 17 No. 3 The Determinants of European Banks’ Capital 163
agency problems, the reduction in market discipline (caused by thesafety net), and the systemic risk posed by the banking sector.
These characteristics explain why the majority of the empiricalresearch on firm capital structure was carried out with nonfinancialfirms (see, for example, Rajan and Zingales 1995).
Nevertheless, the empirical research regarding banks’ capitalstructure has evidenced that those attributes that affect bank capitalstructure are not so far removed from the attributes which influencenonfinancial firms’ capital structure. Thus, Modigliani and Miller’stheory holds, within limits, for banks as well (Miles, Yang, andMarcheggiano 2013). Research carried out by Flannery (1994), Flan-nery and Sorescu (1996), Morgan and Stiroh (2001), Flannery andRangan (2008), and Allen, Carletti, and Marquez (2011) has shownthat market discipline demonstrated by subordinated creditors, andeven by depositors (as in Martinez Peria and Schmukler 2001), hasplayed an important role in explaining banks’ capital structure.
Regarding the existence of similarity, or not, between the deter-minants of banks’ capital structure and nonfinancial firms andwhether the traditional capital determinants also hold for finan-cial institutions, an empirical work carried out by Barber and Lyon(1997) and Brewer Iii, Kaufman, and Wall (2008) established thatbank-specific indicators also contribute to explain banks’ capitalstructure. Barber and Lyon (1997) concluded that the relationshipsbetween size, market-to-book value, and security returns are posi-tive and similar for both financial and nonfinancial firms. BrewerIii, Kaufman, and Wall (2008) found that leverage is positively andsignificantly correlated with banks’ risk; however, the remainingvariables, such as return on assets and size, are not significantlyrelated to leverage. Nevertheless, bank-specific variables collectivelyexplain banks’ leverage, taking into account the result from the Waldtest. With regards to speed of adjustment, the value attained was12 percent.
The more recent studies on banks’ capital structure were devel-oped by Gropp and Heider (2010)—who expound on the influence ofbank-specific indicators on banks’ capital structure, comparing thesewith those evidenced by nonfinancial firms—and also De Jongheand Oztekin (2015), whose focus was to investigate the adjustmentprocess for targeting capital. Using a sample of large public banksfrom the United States and Europe (from 1991 to 2004), the first
164 International Journal of Central Banking September 2021
study evidences that regulation is not the main feature that causesthe divergence of banks’ capital structure from that which wasargued by Modigliani and Miller (1958). For these authors, mostbanks seem to optimize their capital structure in much the sameway as firms do, except when their capital ratios approach the levelsof the regulatory minimum. Additionally, as demonstrated by Lem-mon, Roberts, and Zander (2008), banks move toward their targetleverage ratios at a speed of adjustment of 45 percent. This evidencecontradicts the “regulatory view” of banks, whereby they shouldconverge toward a common target, namely the minimum require-ment set under Basel I, which gives support to the results obtainedby Berger et al. (2008), who argue that banks actively manage theircapital ratios.
The second study, that of De Jonghe and Oztekin (2015), usinga sample of banks from 64 countries during the 1994–2010 period,based on the studies developed for nonfinancial firms by Oztekin andFlannery (2012) and Oztekin (2015), found that in the case of banks,the speed of adjustment is heterogeneous, depending on the insti-tutional environment—which is consistent with the results obtainedwith nonfinancial firms. That is to say that the speed of adjustmenttoward the target capital ratio increases in those countries that havemore stringent capital requirements, better supervisory monitoring,and more-developed capital markets—which in turn decreases thecosts of debt and/or equity issuance. In addition, and consistentwith those studies developed so far, this study found that smaller,more profitable, and cost-efficient banks have higher capital ratios.
3. Research Question and Hypothesis Development
This paper aims to empirically answer the following question: Arethe determinants of banks’ capital structure different in public ver-sus private banks? Public banks are those that are quoted/listedin capital markets, whereas private banks are those that are notquoted/listed in capital markets.
On the one hand, we expect that the determinants of publicbanks’ capital structure and their respective decisions regarding theoptimal capital are different from those of private banks, due to thefact that the former has easier access to capital and debt markets, as
Vol. 17 No. 3 The Determinants of European Banks’ Capital 165
a result of having less of the information asymmetry which charac-terizes public firms, whether they be financial or nonfinancial firms.On the other hand, considering that the banking sector is one of themost regulated in the world (Santos 2001), supplemented by the factthat all banks (public or private) are obliged to disclose informationthrough pillar 3 of the regulatory framework, the determinants ofpublic banks’ capital structure, as identified by Gropp and Heider(2010), may well be not so different from those of private banks.
Accordingly, we test the hypothesis that the determinants of pub-lic banks’ capital structure are different from the determinants ofprivate banks against the hypothesis that the determinants of banks’capital structure are the same for both types of banks.
A detailed overview of the explanatory variables and their sourcesis provided in table 1. Table 2 presents the expected signs of theeffects of bank-specific indicators on banks’ capital structure, as wellas a summary of the arguments that support such expectations.
4. Data
The data for this paper include banks which have their headquar-ters in 21 European countries, as well as subsidiaries of foreign banks(mainly from the United States), which add up to 586 banks, for theperiod of 2000–16. The data give rise to a panel of 6,065 bank-yearobservations. As mentioned in table 1, all data were collected fromthe Bankscope and SNL databases.
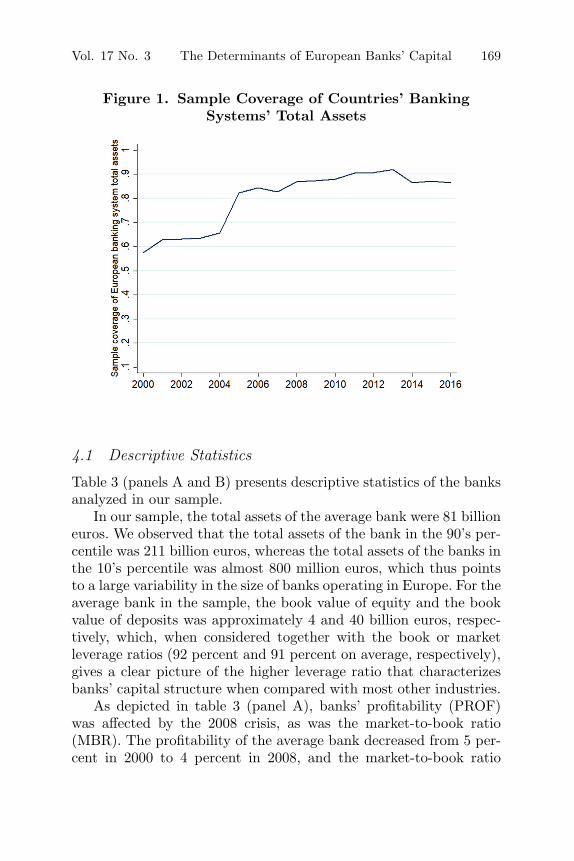
As shown in figure 1, the sample covers a high percentage ofthe European banking system’s assets, which represents a shareof 90 percent in 2012, decreasing slightly to 85 percent from 2012onward—which is due to the change of the database from Bankscopeto SNL.
We obtain an unbalanced panel data set, on account of a data gapand entry/exit in the sample. It is worth noting that the occurrenceof certain mergers and acquisitions, together with the emergence ofnew banks, caused changes in the constitution of the sample dur-ing the period under analysis (table 3). It should be mentioned thatthese mergers and acquisitions events are included in banks’ fixedeffects.

166 International Journal of Central Banking September 2021Tab
le1.
Var
iable
s:D
escr
iption
and
Sou
rces
Var
iable
sD
escr
ipti
on
Sourc
e
BO
OK
VA
LU
EO
FA
SSE
TS
The
sum
ofth
efo
llow
ing
item
s:“c
ash
and
adva
nces
inot
her
cred
itin
stitut
ions
,”“c
laim
son
othe
rcr
edit
inst
itut
ions
,”“t
otal
loan
san
dre
ceiv
able
s,”
“fina
ncia
las
sets
clas
sifie
dat
fair
valu
eth
roug
hpr
ofit
orlo
ss,”
“fina
ncia
las
sets
clas
sifie
das
avai
labl
efo
rsa
le,”
“fina
ncia
las
sets
clas
sifie
das
held
for
trad
ing,
”“fi
nanc
ialas
sets
clas
sifie
das
held
tom
atur
ity,
”an
d“o
ther
asse
ts”
net
ofth
ere
spec
tive
impa
irm
ent.
Ban
ksco
pe/
SNL
BO
OK
VA
LU
EO
FE
QU
ITY
The
sum
ofth
efo
llow
ing
item
s:“c
apital
,”“r
eser
ves,
”an
d“n
etin
com
e.”
Ban
ksco
pe/
SNL
BO
OK
LE
VE
RA
GE
(BL)
Com
pute
das
1–
(boo
kva
lue
ofeq
uity
/boo
kva
lue
ofas
sets
).B
anks
cope/
SNL
MA
RK
ET
LE
VE
RA
GE
(ML)
Cal
cula
ted
as1
–[m
arke
tva
lue
ofeq
uity
(com
pute
das
num
ber
ofou
tsta
ndin
gsh
ares
*end
ofye
arst
ock
pric
e)/m
arke
tva
lue
ofba
nk(c
ompu
ted
asth
em
arke
tva
lue
ofeq
uity
+boo
kva
lue
oflia
bilit
ies)
].
Ban
ksco
pe/
SNL
SIZE
The
log
ofboo
kva
lue
ofas
sets
.B
anks
cope/
SNL
PR
OFIT
AB
ILIT
Y(P
RO
F)
Com
pute
das
the
ratio
bet
wee
nth
esu
mof
pret
axpr
ofit
and
inte
rest
expen
ses
and
the
boo
kva
lue
ofas
sets
.B
anks
cope/
SNL
MA
RK
ET
-TO
-BO
OK
RAT
IO(M
BR
)C
alcu
late
das
the
ratio
bet
wee
nm
arke
tva
lue
ofas
sets
and
boo
kva
lue
ofas
sets
.B
anks
cope/
SNL
CO
LLAT
ER
AL
(CO
LL)
Com
pute
das
the
ratio
bet
wee
nth
esu
mof
the
follo
win
gitem
s:“t
otal
secu
rities
,”“fi
xed
asse
ts,”
and
“cas
han
ddu
efr
omba
nks”
and
the
boo
kva
lue
ofas
sets
.
Ban
ksco
pe/
SNL
RIS
KC
ompu
ted
asth
ean
nual
ized
stan
dard
devi
atio
nof
mon
thly
stoc
kpr
ice
retu
rns
(mar
ket*
valu
eof
equi
ty/m
arke
tva
lue
ofba
nk)
orth
elo
gof
the
stan
dard
devi
atio
nof
retu
rnon
asse
ts(w
hich
isco
mpu
ted
asth
era
tio
bet
wee
nne
tin
com
ean
dth
eav
erag
eof
boo
kva
lue
ofas
sets
)ca
lcul
ated
from
the
last
thre
eob
serv
atio
nsfo
rth
ere
spec
tive
year
.
Blo
omber
g/B
anks
cope/
SNL
SUB
OR
DIN
AT
ED
DE
BT
Asp
ecifi
cty
pe
ofde
btth
atra
nks
bel
owth
eot
her
types
ofde
btsu
chas
depos
its
and
othe
rde
btse
curi
ties
issu
edby
anin
stitut
ion.
Ban
ksco
pe/
SNL
SUB
OR
DIN
AT
ED
DE
BT
/ASS
ET
SC
alcu
late
das
the
ratio
bet
wee
nto
talsu
bor
dina
ted
debt
liabi
litie
san
dto
talas
sets
.B
anks
cope/
SNL
(con
tinu
ed)

Vol. 17 No. 3 The Determinants of European Banks’ Capital 167
Tab
le1.
(Con
tinued
)
Var
iable
sD
escr
ipti
on
Sourc
e
NO
ND
EP
OSI
TS/
ASS
ET
SC
ompu
ted
asth
era
tio
bet
wee
nno
ndep
osits
liabi
litie
san
dto
talas
sets
.B
anks
cope/
SNL
SEC
UR
ITIE
S/A
SSE
TS
The
ratio
bet
wee
nse
curi
ties
and
tota
las
sets
.B
anks
cope/
SNL
LO
AN
S/A
SSE
TS
The
ratio
bet
wee
nne
tlo
ans
and
tota
las
sets
.T
OTA
LC
AP
ITA
LR
AT
IOT
hera
tio
bet
wee
now
nfu
nds
(as
defin
edin
Dir
ective
2000
/12/
EC
until
2006
,in
Dir
ective
2006
/49/
EC
bet
wee
n20
07an
d20
13,an
din
Reg
ulat
ion
575/
2013
from
2014
onw
ards
)an
dri
sk-w
eigh
ted
asse
ts.
Ban
ksco
pe/
SNL
TIE
R1
CA
PIT
AL
RAT
IOT
hera
tio
bet
wee
now
nfu
nds
oftier
1qu
ality
(as
defin
edin
Dir
ective
2000
/12/
EC
until20
06an
din
Dir
ective
2006
/49/
EC
,in
Dir
ective
2006
/49E
Cbet
wee
n20
07an
d20
13,an
din
Reg
ulat
ion
575/
2013
from
2014
onw
ards
—es
sent
ially
equi
tyan
dre
serv
es)
and
risk
-wei
ghte
das
sets
.
Ban
ksco
pe/
SNL
TIE
R2
CA
PIT
AL
RAT
IOT
hera
tio
bet
wee
now
nfu
nds
oftier
2qu
ality
(as
defin
edin
Dir
ective
2000
/12/
EC
until20
06,in
Dir
ective
2006
/49/
EC
bet
wee
n20
07an
d20
13,
and
inR
egul
atio
n57
5/20
13fr
om20
14on
war
ds—
esse
ntia
llysu
bor
dina
ted
debt
)an
dri
sk-w
eigh
ted
asse
ts.
Ban
ksco
pe/
SNL
PU
BLIC
DU
MM
YD
umm
yva
riab
leth
atta
kes
the
valu
eof
1if
the
bank
islis
ted
inm
arke
t,an
d0
othe
rwis
e.B
anks
cope/
SNL
SPE
ED
OF
AD
JUST
ME
NT
Com
pute
das
1–
coeffi
cien
ton
boo
kle
vera
geor
mar
ket
leve
rage
lagg
edby
one
per
iod.
Ban
ksco
pe/
SNL
CA
PR
Dum
my
vari
able
draw
nfr
omth
est
udy
carr
ied
out
byC
erut
tiet
al.(2
017)
whi
chta
kes
the
valu
eof
1if
any
tigh
tca
pita
lm
easu
rew
asta
ken
byea
chre
gula
tory
auth
ority,
and
0ot
herw
ise.
Cer
utti
etal
.(2
017)
Note
:T
his
table
pre
sent
sth
edefi
nit
ions
and
sourc
esof
the
mai
nva
riab
les
use
din
this
study.

168 International Journal of Central Banking September 2021Tab
le2.
Expec
ted
Effec
tsof
Eac
hV
aria
ble
onB
anks’
Cap
ital
Str
uct
ure
Var
iable
sExpec
ted
Effec
tsan
dR
atio
nal
e
MA
RK
ET
-TO
-BO
OK
RAT
IO(M
BR
)–
Bas
edon
Gro
ppan
dH
eide
r(2
010)
,le
vera
geis
nega
tive
lyco
rrel
ated
with
mar
ket-
to-b
ook
ratio.
Inth
eory
,fir
ms
with
high
mar
ket-
to-b
ook
ratios
have
high
erco
sts
offin
anci
aldi
stre
ss.
PR
OFIT
AB
ILIT
Y(P
RO
F)
–/+
Bas
edon
empi
rica
llit
erat
ure
(Gro
ppan
dH
eide
r20
10an
dD
eJo
nghe
and
Ozt
ekin
2015
)le
vera
geha
sa
nega
tive
rela
tion
ship
with
profi
ts.T
hese
resu
lts
unde
rpin
onth
eco
ncep
tth
atfir
ms
that
face
alo
wer
cost
ofra
isin
geq
uity
inth
esh
ort
term
(i.e
.,pr
ofita
ble
firm
s)te
ndto
hold
sign
ifica
ntly
mor
eca
pita
l.T
his
istr
uem
ainl
yw
hen
debt
finan
cing
isth
edo
min
ant
sour
ceof
exte
rnal
finan
cing
(Raj
anan
dZin
gale
s19
95).
SIZE
+In
theo
ry,la
rger
firm
sar
ebet
ter
dive
rsifi
edan
dha
vea
low
erpr
obab
ility
ofbei
ngin
finan
cial
dist
ress
coup
led
with
the
fact
that
,bei
ngla
rger
,th
eyar
ebet
ter
know
nby
the
mar
ket
and
find
itea
sier
tois
sue
mor
ede
btth
ansm
alle
rfir
ms.
The
empi
rica
llit
erat
ure
(Gro
ppan
dH
eide
r20
10an
dD
eJo
nghe
and
Ozt
ekin
2015
)su
ppor
tsth
ese
argu
men
ts.
CO
LLAT
ER
AL
(CO
LL)
+/–
Bas
edon
Gro
ppan
dH
eide
r(2
010)
,le
vera
geha
sa
pos
itiv
ere
lation
ship
with
colla
tera
l.T
hera
tion
ale
unde
rlyi
ngth
isfa
ctor
isth
atta
ngib
leas
sets
are
easy
toco
llate
raliz
ean
dth
usth
eyre
duce
the
agen
cyco
sts
ofda
ta.
RIS
K–
Acc
ordi
ngto
Gro
ppan
dH
eide
r(2
010)
,ri
skre
duce
sle
vera
ge.Fir
ms
with
mor
evo
latile
cash
flow
sfa
cehi
gher
expec
ted
cost
sof
finan
cial
dist
ress
and
shou
ldus
ele
ssde
bt.
SPE
ED
OF
AD
JUST
ME
NT
+A
ccor
ding
toG
ropp
and
Hei
der
(201
0)an
dD
eJo
nghe
and
Ozt
ekin
(201
5),w
eex
pec
tth
atba
nks,
like
nonfi
nanc
ialfir
ms,
conv
erge
tow
ard
bank
-spec
ific
targ
ets.
Note
:T
his
table
pre
sent
sth
eeff
ects
ofea
chva
riab
leon
ban
kca
pit
alst
ruct
ure
,w
her
eM
BR
rati
ois
calc
ula
ted
asth
era
tio
bet
wee
nm
arke
tva
lue
ofas
sets
and
boo
kva
lue
ofas
sets
;PR
OF
isco
mpute
das
the
rati
obet
wee
nth
esu
mof
pre
tax
pro
fit
and
inte
rest
expen
ses
and
the
boo
kva
lue
ofas
sets
;SIZ
Eis
defi
ned
asth
elo
gof
tota
las
sets
whic
his
com
pute
das
the
sum
ofth
efo
llow
ing
item
s:“c
ash
and
adva
nce
sin
other
cred
itin
stit
uti
ons,
”“c
laim
son
other
cred
itin
stit
uti
ons,
”“t
otal
loan
san
dre
ceiv
able
s,”
“finan
cial
asse
tscl
assi
fied
atfa
irva
lue
thro
ugh
pro
fit
orlo
ss,”
“finan
cial
asse
tscl
assi
fied
asav
aila
ble
for
sale
,”“fi
nan
cial
asse
tscl
assi
fied
ashel
dfo
rtr
adin
g,”
“finan
cial
asse
tscl
assi
fied
ashel
dto
mat
uri
ty,”
and
“oth
eras
sets
”net
ofth
ere
spec
tive
impai
rmen
t;C
OLL
isco
mpute
das
the
rati
obet
wee
nth
esu
mof
the
follow
ing
item
s:“t
otal
secu
riti
es,”
“fixe
das
sets
,”an
d“c
ash
and
due
from
ban
ks”
and
the
boo
kva
lue
ofas
sets
;R
ISK
isca
lcula
ted
asth
elo
gof
annu
aliz
edst
andar
ddev
iati
onof
mon
thly
stoc
kpri
cere
turn
s(m
arke
t*va
lue
ofeq
uity/
mar
ket
valu
eof
ban
k)or
thro
ugh
the
log
ofst
andar
ddev
iati
onof
retu
rnon
asse
ts(w
hic
his
com
pute
das
the
rati
obet
wee
nnet
inco
me
and
the
aver
age
ofboo
kva
lue
ofas
sets
)ca
lcula
ted
from
the
last
thre
eob
serv
atio
ns
for
the
resp
ecti
veye
ar(i
nth
eca
seof
pri
vate
ban
ks);
and
SPEED
OF
AD
JUST
MEN
Tis
com
pute
das
1–
bet
aon
boo
kle
vera
geor
mar
ket
leve
rage
lagg
edby
one
per
iod.
Vol. 17 No. 3 The Determinants of European Banks’ Capital 169
Figure 1. Sample Coverage of Countries’ BankingSystems’ Total Assets
4.1 Descriptive Statistics
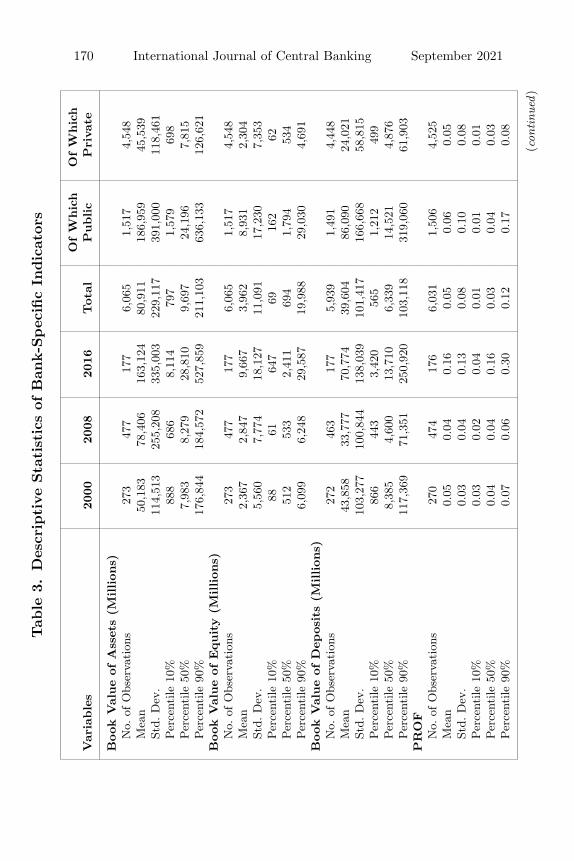
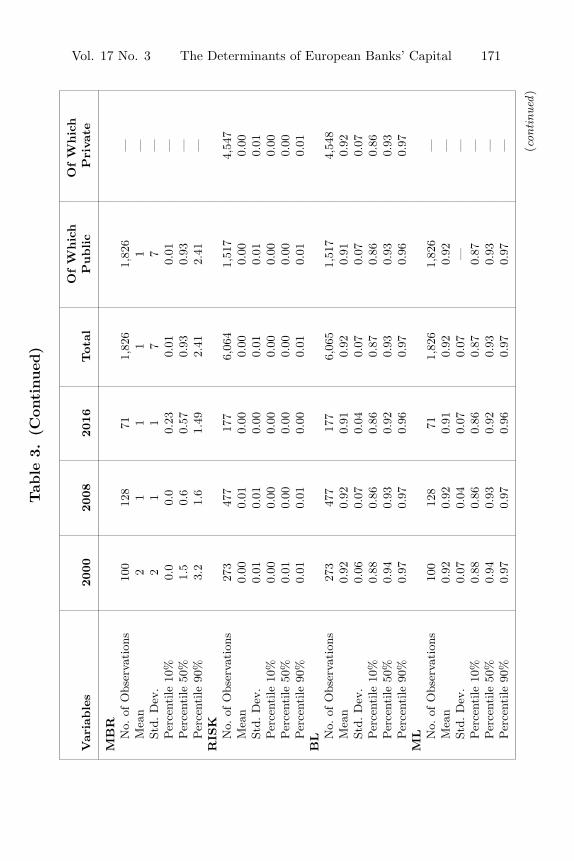
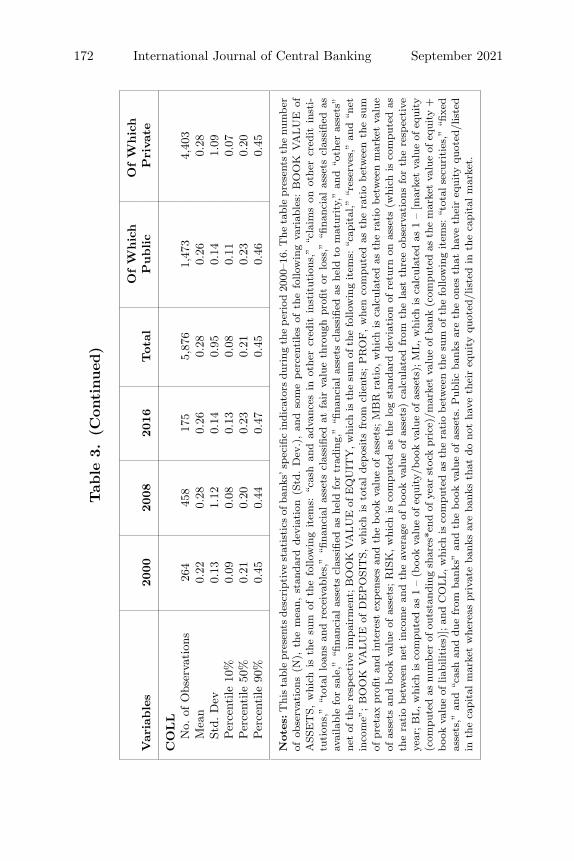
Table 3 (panels A and B) presents descriptive statistics of the banksanalyzed in our sample.
In our sample, the total assets of the average bank were 81 billioneuros. We observed that the total assets of the bank in the 90’s per-centile was 211 billion euros, whereas the total assets of the banks inthe 10’s percentile was almost 800 million euros, which thus pointsto a large variability in the size of banks operating in Europe. For theaverage bank in the sample, the book value of equity and the bookvalue of deposits was approximately 4 and 40 billion euros, respec-tively, which, when considered together with the book or marketleverage ratios (92 percent and 91 percent on average, respectively),gives a clear picture of the higher leverage ratio that characterizesbanks’ capital structure when compared with most other industries.
As depicted in table 3 (panel A), banks’ profitability (PROF)was affected by the 2008 crisis, as was the market-to-book ratio(MBR). The profitability of the average bank decreased from 5 per-cent in 2000 to 4 percent in 2008, and the market-to-book ratio
170 International Journal of Central Banking September 2021Tab
le3.
Des
crip
tive
Sta
tist
ics
ofB
ank-S
pec
ific
Indic
ator
s
OfW
hic
hO
fW
hic
hV
aria
ble
s20
0020
0820
16Tot
alP
ublic
Pri
vate
Book
Val
ue
ofA
sset
s(M
illion
s)N
o.of
Obs
erva
tion
s27
347
717
76,
065
1,51
74,
548
Mea
n50
,183
78,4
0616
3,12
480
,911
186,
959
45,5
39St
d.D
ev.
114,
513
255,
208
335,
003
229,
117
391,
000
118,
461
Per
cent
ile10
%88
868
68,
114
797
1,57
969
8Per
cent
ile50
%7,
983
8,27
928
,810
9,69
724
,196
7,81
5Per
cent
ile90
%17
6,84
418
4,57
252
7,85
921
1,10
363
6,13
312
6,62
1B
ook
Val
ue
ofEquity
(Million
s)N
o.of
Obs
erva
tion
s27
347
717
76,
065
1,51
74,
548
Mea
n2,
367
2,84
79,
667
3,96
28,
931
2,30
4St
d.D
ev.
5,56
07,
774
18,1
2711
,091
17,2
307,
353
Per
cent
ile10
%88
6164
769
162
62Per
cent
ile50
%51
253
32,
411
694
1,79
453
4Per
cent
ile90
%6,
099
6,24
829
,587
19,9
8829
,030
4,69
1B
ook
Val
ue
ofD
epos
its
(Million
s)N
o.of
Obs
erva
tion
s27
246
317
75,
939
1,49
14,
448
Mea
n43
,858
33,7
7770
,774
39,6
0486
,090
24,0
21St
d.D
ev.
103,
277
100,
844
138,
039
101,
417
166,
668
58,8
15Per
cent
ile10
%86
644
33,
420
565
1,21
249
9Per
cent
ile50
%8,
385
4,60
013
,710
6,33
914
,521
4,87
6Per
cent
ile90
%11
7,36
971
,351
250,
920
103,
118
319,
060
61,9
03P
RO
FN
o.of
Obs
erva
tion
s27
047
417
66,
031
1,50
64,
525
Mea
n0.
050.
040.
160.
050.
060.
05St
d.D
ev.
0.03
0.04
0.13
0.08
0.10
0.08
Per
cent
ile10
%0.
030.
020.
040.
010.
010.
01Per
cent
ile50
%0.
040.
040.
160.
030.
040.
03Per
cent
ile90
%0.
070.
060.
300.
120.
170.
08
(con
tinu
ed)
Vol. 17 No. 3 The Determinants of European Banks’ Capital 171
Tab
le3.
(Con
tinued
)
OfW
hic
hO
fW
hic
hV
aria
ble
s20
0020
0820
16Tot
alP
ublic
Pri
vate
MB
RN
o.of
Obs
erva
tion
s10
012
871
1,82
61,
826
—M
ean
21
11
1—
Std.
Dev
.2
11
77
—Per
cent
ile10
%0.
00.
00.
230.
010.
01—
Per
cent
ile50
%1.
50.
60.
570.
930.
93—
Per
cent
ile90
%3.
21.
61.
492.
412.
41—
RIS
KN
o.of
Obs
erva
tion
s27
347
717
76,
064
1,51
74,
547
Mea
n0.
000.
010.
000.
000.
000.
00St
d.D
ev.
0.01
0.01
0.00
0.01
0.01
0.01
Per
cent
ile10
%0.
000.
000.
000.
000.
000.
00Per
cent
ile50
%0.
010.
000.
000.
000.
000.
00Per
cent
ile90
%0.
010.
010.
000.
010.
010.
01B
L No.
ofO
bser
vati
ons
273
477
177
6,06
51,
517
4,54
8M
ean
0.92
0.92
0.91
0.92
0.91
0.92
Std.
Dev
.0.
060.
070.
040.
070.
070.
07Per
cent
ile10
%0.
880.
860.
860.
870.
860.
86Per
cent
ile50
%0.
940.
930.
920.
930.
930.
93Per
cent
ile90
%0.
970.
970.
960.
970.
960.
97M
L No.
ofO
bser
vati
ons
100
128
711,
826
1,82
6—
Mea
n0.
920.
920.
910.
920.
92—
Std.
Dev
.0.
070.
040.
070.
07—
—Per
cent
ile10
%0.
880.
860.
860.
870.
87—
Per
cent
ile50
%0.
940.
930.
920.
930.
93—
Per
cent
ile90
%0.
970.
970.
960.
970.
97— (c
ontinu
ed)
172 International Journal of Central Banking September 2021
Tab
le3.
(Con
tinued
)
OfW
hic
hO
fW
hic
hV
aria
ble
s20
0020
0820
16Tot
alP
ublic
Pri
vate
CO
LL
No.
ofO
bser
vati
ons
264
458
175
5,87
61,
473
4,40
3M
ean
0.22
0.28
0.26
0.28
0.26
0.28
Std.
Dev
0.13
1.12
0.14
0.95
0.14
1.09
Per
cent
ile10
%0.
090.
080.
130.
080.
110.
07Per
cent
ile50
%0.
210.
200.
230.
210.
230.
20Per
cent
ile90
%0.
450.
440.
470.
450.
460.
45
Note
s:T
hista
ble
pres
ents
desc
ript
ive
stat
istics
ofba
nks’
spec
ific
indi
cato
rsdu
ring
the
per
iod
2000
–16.
The
tabl
epr
esen
tsth
enu
mber
ofob
serv
atio
ns(N
),th
em
ean,
stan
dard
devi
atio
n(S
td.
Dev
.),
and
som
eper
cent
iles
ofth
efo
llow
ing
vari
able
s:B
OO
KVA
LU
Eof
ASS
ET
S,w
hich
isth
esu
mof
the
follo
win
gitem
s:“c
ash
and
adva
nces
inot
her
cred
itin
stitut
ions
,”“c
laim
son
othe
rcr
edit
inst
i-tu
tion
s,”
“tot
allo
ans
and
rece
ivab
les,
”“fi
nanc
ialas
sets
clas
sifie
dat
fair
valu
eth
roug
hpr
ofit
orlo
ss,”
“fina
ncia
las
sets
clas
sifie
das
avai
labl
efo
rsa
le,”
“fina
ncia
las
sets
clas
sifie
das
held
for
trad
ing,
”“fi
nanc
ialas
sets
clas
sifie
das
held
tom
atur
ity,
”an
d“o
ther
asse
ts”
net
ofth
ere
spec
tive
impa
irm
ent;
BO
OK
VA
LU
Eof
EQ
UIT
Y,w
hich
isth
esu
mof
the
follo
win
gitem
s:“c
apital
,”“r
eser
ves,
”an
d“n
etin
com
e”;B
OO
KVA
LU
Eof
DE
PO
SIT
S,w
hich
isto
talde
pos
its
from
clie
nts;
PR
OF,w
hen
com
pute
das
the
ratio
bet
wee
nth
esu
mof
pret
axpr
ofit
and
inte
rest
expen
ses
and
the
boo
kva
lue
ofas
sets
;M
BR
ratio,
whi
chis
calc
ulat
edas
the
ratio
bet
wee
nm
arke
tva
lue
ofas
sets
and
boo
kva
lue
ofas
sets
;R
ISK
,w
hich
isco
mpu
ted
asth
elo
gst
anda
rdde
viat
ion
ofre
turn
onas
sets
(whi
chis
com
pute
das
the
ratio
bet
wee
nne
tin
com
ean
dth
eav
erag
eof
boo
kva
lue
ofas
sets
)ca
lcul
ated
from
the
last
thre
eob
serv
atio
nsfo
rth
ere
spec
tive
year
;BL,w
hich
isco
mpu
ted
as1
–(b
ook
valu
eof
equi
ty/b
ook
valu
eof
asse
ts);
ML,w
hich
isca
lcul
ated
as1
–[m
arke
tva
lue
ofeq
uity
(com
pute
das
num
ber
ofou
tsta
ndin
gsh
ares
*end
ofye
arst
ock
pric
e)/m
arke
tva
lue
ofba
nk(c
ompu
ted
asth
em
arke
tva
lue
ofeq
uity
+boo
kva
lue
oflia
bilit
ies)
];an
dC
OLL,w
hich
isco
mpu
ted
asth
era
tio
bet
wee
nth
esu
mof
the
follo
win
gitem
s:“t
otal
secu
rities
,”“fi
xed
asse
ts,”
and
“cas
han
ddu
efr
omba
nks”
and
the
boo
kva
lue
ofas
sets
.P
ublic
bank
sar
eth
eon
esth
atha
veth
eir
equi
tyqu
oted
/lis
ted
inth
eca
pita
lm
arke
tw
here
aspr
ivat
eba
nks
are
bank
sth
atdo
not
have
thei
req
uity
quot
ed/l
iste
din
the
capi
talm
arke
t.
Vol. 17 No. 3 The Determinants of European Banks’ Capital 173
dropped from 2 to 1 during the same period. While banks’ prof-itability has recovered to a level of around 16 percent up until 2016,market-to-book ratio has never recovered to its pre-crisis level.
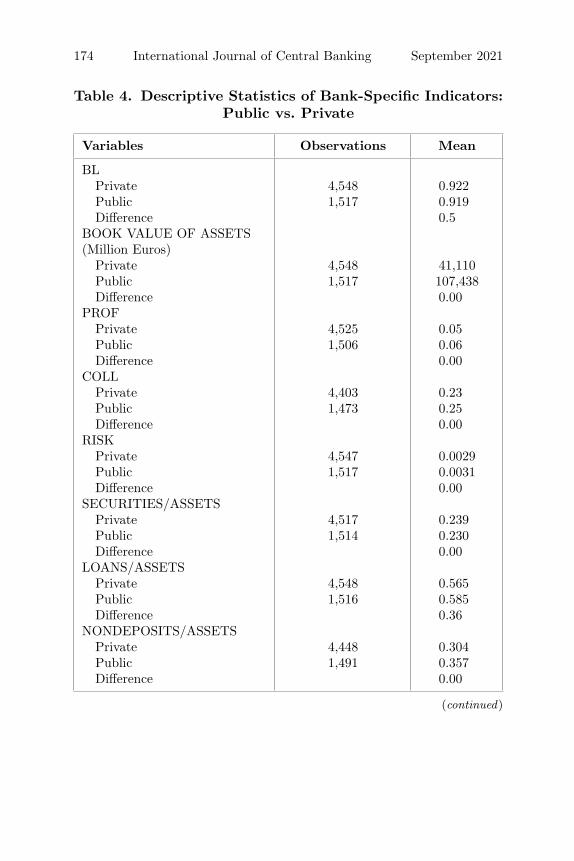
Table 3 also shows that there are significantly more private banksthan public banks, which appears to indicate that the EuropeanBanking System is mainly composed of small and medium-sizedprivate banks, with the sample of public banks being more het-erogeneous than that of private banks—as the standard deviationin several bank-specific indicators is higher in the case of publicbanks. Furthermore, public banks are larger, on average (with aver-age assets of 187 billion euros, when compared with 46 billion eurosfor private banks), although they are more profitable (1 percent-age point above the average profitability of private banks) but lessleveraged (1 percentage point below the average leverage shown byprivate banks) than private banks. These differences are statisti-cally significant when the Wilcoxon signed-rank test is carried out,as shown in table 4. In addition, public banks seem to rely more onnondeposits debt and subordinated debt than private banks. Accord-ing to Flannery (1994), Flannery and Sorescu (1996), Morgan andStiroh (2001), Flannery and Rangan (2008), and Allen, Carletti,and Marquez (2011), this kind of debt is more subject to marketdiscipline than deposits.2
4.2 Cross-Country Comparison Throughout thePeriod 2009–16
This subsection explores the main differences between countries, inparticular the distribution of public and private banks and theircapital composition.
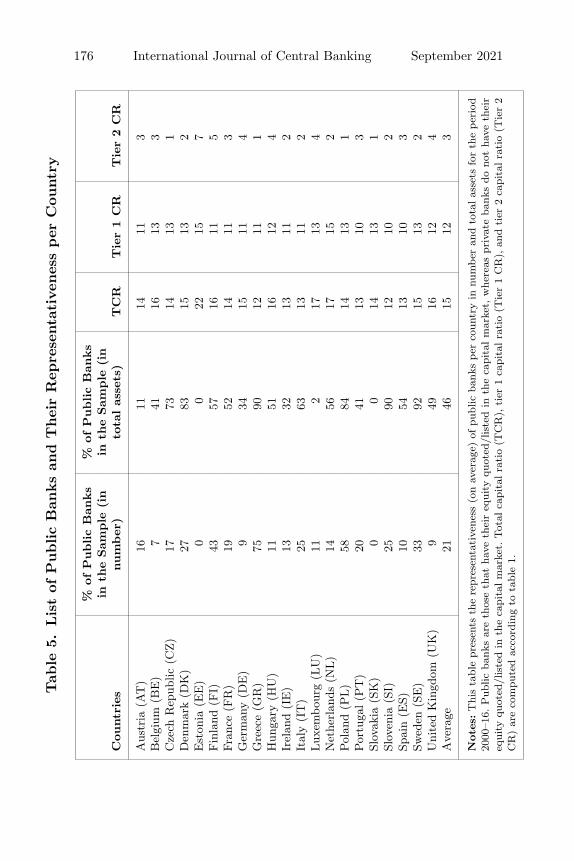
In table 5 we can observe that the percentage of public banksacross European countries for the period of 2000 to 2016, in bothnumber and percentage of total assets of each country’s banking sys-tems, varies significantly, ranging from 0 percent to 75 percent, and0 percent to 92 percent, respectively. It should be added that themajority of banks are private at the European level.
2Some of the differences between the data presented in table 3 and thoseshown in table 4 are due to the fact that the variables presented in table 4 werewindsorized, whereas those presented in table 3 were not.
174 International Journal of Central Banking September 2021
Table 4. Descriptive Statistics of Bank-Specific Indicators:Public vs. Private
Variables Observations Mean
BLPrivate 4,548 0.922Public 1,517 0.919Difference 0.5
BOOK VALUE OF ASSETS(Million Euros)
Private 4,548 41,110Public 1,517 107,438Difference 0.00
PROFPrivate 4,525 0.05Public 1,506 0.06Difference 0.00
COLLPrivate 4,403 0.23Public 1,473 0.25Difference 0.00
RISKPrivate 4,547 0.0029Public 1,517 0.0031Difference 0.00
SECURITIES/ASSETSPrivate 4,517 0.239Public 1,514 0.230Difference 0.00
LOANS/ASSETSPrivate 4,548 0.565Public 1,516 0.585Difference 0.36
NONDEPOSITS/ASSETSPrivate 4,448 0.304Public 1,491 0.357Difference 0.00
(continued)
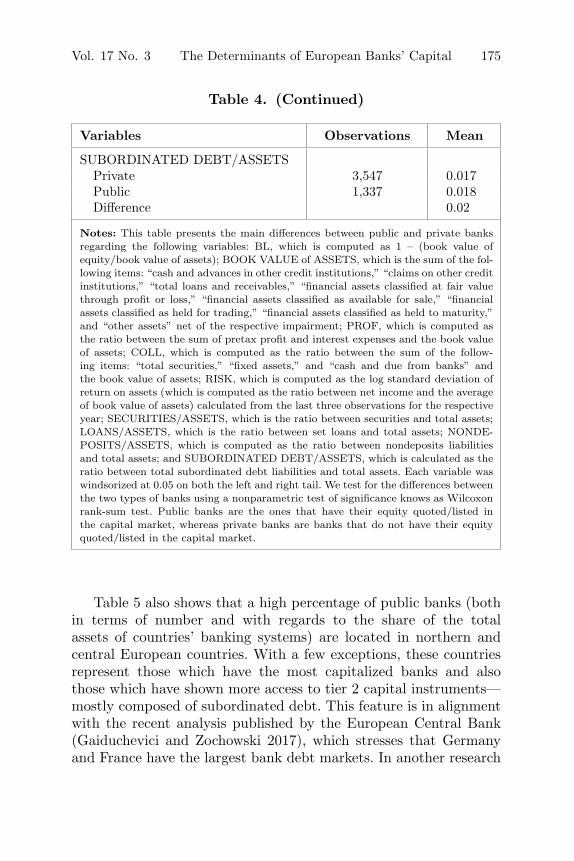
Vol. 17 No. 3 The Determinants of European Banks’ Capital 175
Table 4. (Continued)
Variables Observations Mean
SUBORDINATED DEBT/ASSETSPrivate 3,547 0.017Public 1,337 0.018Difference 0.02
Notes: This table presents the main differences between public and private banksregarding the following variables: BL, which is computed as 1 – (book value ofequity/book value of assets); BOOK VALUE of ASSETS, which is the sum of the fol-lowing items: “cash and advances in other credit institutions,” “claims on other creditinstitutions,” “total loans and receivables,” “financial assets classified at fair valuethrough profit or loss,” “financial assets classified as available for sale,” “financialassets classified as held for trading,” “financial assets classified as held to maturity,”and “other assets” net of the respective impairment; PROF, which is computed asthe ratio between the sum of pretax profit and interest expenses and the book valueof assets; COLL, which is computed as the ratio between the sum of the follow-ing items: “total securities,” “fixed assets,” and “cash and due from banks” andthe book value of assets; RISK, which is computed as the log standard deviation ofreturn on assets (which is computed as the ratio between net income and the averageof book value of assets) calculated from the last three observations for the respectiveyear; SECURITIES/ASSETS, which is the ratio between securities and total assets;LOANS/ASSETS, which is the ratio between set loans and total assets; NONDE-POSITS/ASSETS, which is computed as the ratio between nondeposits liabilitiesand total assets; and SUBORDINATED DEBT/ASSETS, which is calculated as theratio between total subordinated debt liabilities and total assets. Each variable waswindsorized at 0.05 on both the left and right tail. We test for the differences betweenthe two types of banks using a nonparametric test of significance knows as Wilcoxonrank-sum test. Public banks are the ones that have their equity quoted/listed inthe capital market, whereas private banks are banks that do not have their equityquoted/listed in the capital market.
Table 5 also shows that a high percentage of public banks (bothin terms of number and with regards to the share of the totalassets of countries’ banking systems) are located in northern andcentral European countries. With a few exceptions, these countriesrepresent those which have the most capitalized banks and alsothose which have shown more access to tier 2 capital instruments—mostly composed of subordinated debt. This feature is in alignmentwith the recent analysis published by the European Central Bank(Gaiduchevici and Zochowski 2017), which stresses that Germanyand France have the largest bank debt markets. In another research
176 International Journal of Central Banking September 2021Tab
le5.
Lis
tof
Public
Ban
ks
and
Thei
rR
epre
senta
tive
nes
sper
Cou
ntr
y
%of
Public
Ban
ks
%of
Public
Ban
ks
inth
eSam
ple
(in
inth
eSam
ple
(in
Cou
ntr
ies
num
ber
)to
talas
sets
)T
CR
Tie
r1
CR
Tie
r2
CR
Aus
tria
(AT
)16
1114
113
Bel
gium
(BE
)7
4116
133
Cze
chR
epub
lic(C
Z)
1773
1413
1D
enm
ark
(DK
)27
8315
132
Est
onia
(EE
)0
022
157
Fin
land
(FI)
4357
1611
5Fr
ance
(FR
)19
5214
113
Ger
man
y(D
E)
934
1511
4G
reec
e(G
R)
7590
1211
1H
unga
ry(H
U)
1151
1612
4Ir
elan
d(I
E)
1332
1311
2It
aly
(IT
)25
6313
112
Lux
embo
urg
(LU
)11
217
134
Net
herl
ands
(NL)
1456
1715
2Pol
and
(PL)
5884
1413
1Por
tuga
l(P
T)
2041
1310
3Sl
ovak
ia(S
K)
00
1413
1Sl
oven
ia(S
I)25
9012
102
Spai
n(E
S)10
5413
103
Swed
en(S
E)
3392
1513
2U
nite
dK
ingd
om(U
K)
949
1612
4A
vera
ge21
4615
123
Note
s:T
his
tabl
epr
esen
tsth
ere
pres
enta
tive
ness
(on
aver
age)
ofpu
blic
bank
sper
coun
try
innu
mber
and
tota
las
sets
for
the
per
iod
2000
–16.
Pub
licba
nks
are
thos
eth
atha
veth
eir
equi
tyqu
oted
/lis
ted
inth
eca
pita
lm
arke
t,w
here
aspr
ivat
eba
nks
dono
tha
veth
eir
equi
tyqu
oted
/lis
ted
inth
eca
pita
lm
arke
t.Tot
alca
pita
lra
tio
(TC
R),
tier
1ca
pita
lra
tio
(Tie
r1
CR
),an
dtier
2ca
pita
lra
tio
(Tie
r2
CR
)ar
eco
mpu
ted
acco
rdin
gto
tabl
e1.
Vol. 17 No. 3 The Determinants of European Banks’ Capital 177
note published by BBVA Research (Garcia and Rocamora 2018),the banks of Greece, Portugal, Ireland, and Spain all display thegreatest shortfalls of MREL—which proves that countries with asmall number of public banks are more likely to be able to overcomedifficulties in complying with MREL requirements.
Attention should be paid to Greece—which recorded a high per-centage of public banks and yet a lower number of tier 2 capitalinstruments—which is an exceptional case, originating from the dra-matic reduction of the number of total banks after the onset of thebanking and sovereign crisis in that country, which led to a con-solidation of Greece’s banking system. However, as they are public,these public banks overcame many difficulties by issuing bail-in-ableinstruments, as a result of concerns regarding the sustainability ofboth Greek banks and the Greek economy as a whole. Estonia is atthe other end of the spectrum, as it has no record of listed banks,although its banking system has the highest percentage of tier 2capital instruments in the sample. This feature could be explainedby the fact that this country is inundated by subsidiaries of foreignbanks, whose listed holding companies have much easier access tocapital markets to fund their activities, and they thus gain from thebenefit of belonging to reputable and well-known banking groups.
5. Methodology
To address the research question presented in section 3, we carry outthe following empirical analysis for year, country, and bank’s fixedeffects:
Lict = β0 + β1PROFict−1 + β2SIZEict−1 + β3COLLict−1
+ β4RISKict−1 + Ci + Ct + Cc + eit,
where Lict is book leverage (BL), and the remaining variables arethose described in table 1. i, c, and t represent bank, country, andtime, respectively, and Ci, Ct, and Cc represent bank, time, andcountry fixed effects. Banks’ specific variables are lagged by one year(as used by Gropp and Heider 2010), in order to mitigate possible
178 International Journal of Central Banking September 2021
endogeneity problems.3 We ran the model above for all the banks inthe sample, and subsequently distinguished between public and pri-vate banks in the subsamples. As a first step, we apply exactly thesame model to private and public banks, adopting the same depen-dent and explanatory variables for both types of banks (table 6,regressions 2 and 3). Apart from the variables considered above, wenext add the MBR in the case of public banks, and also the marketleverage, rather than use book leverage, as expressed below:
Lict = β0 + β1MBRict−1 + β2PROFict−1 + β3SIZEict−1
+ β4COLLict−1 + β5RISKict−1 + Ci + Ct + Cc + eit.
At a first glance, this second step could undermine the compari-son between public and private banks, as we can observe regressionswith one different dependent variable and one additional explana-tory variable. In order to properly assess the determinants of publicbanks’ capital structure, we opt to consider market values insteadof book values in terms of leverage ratio, as the former are themost frequently used to make decisions in all types of public firms(including banks). Additionally, it is essential to control for market-to-book ratio (MBR) in order to assess the capital structure of listedfirms/banks, as well as to evaluate the behavior of the other deter-minants. Furthermore, by not considering MBR, which is a specialfeature of public firms or banks, we choose to neglect the empiricalwork which has been carried out to date. In particular, the resultsobtained by Gropp and Heider (2010), whose sample was only com-posed of public and large banks, showed that the regressions witha higher R2 (and thus with the greatest explanatory power) werethose which use market leverage as a dependent variable and MBRas one of the explanatory variables. In this paper, the particularitiesof public banks gain even more importance and need to be takeninto consideration, as the sample is more heterogeneous than thatconsidered by Gropp and Heider (2010), which only includes large,public banks.
As in Gropp and Heider (2010), we consider the regulation andsupervision frameworks in year and country’s fixed effects. It should
3We do not include dividends as used by Gropp and Heider (2010) due toavailability issues.

Vol. 17 No. 3 The Determinants of European Banks’ Capital 179
Tab
le6.
Reg
ress
ion
Res
ults:
The
Det
erm
inan
tsof
Ban
ks’
Cap
ital
Str
uct
ure
Reg
ress
ion
5R
egre
ssio
n1
Reg
ress
ion
2R
egre
ssio
n3
Reg
ress
ion
4(G
ropp
and
(All
Ban
ks)
(Public
Ban
ks)
(Pri
vate
Ban
ks)
(Public
Ban
ks)
Hei
der
2010)
BL
BL
BL
ML
ML
MB
R—
——
−0.
0289
∗∗∗
−0.
118∗
∗∗
——
—(0
.003
9)(0
.039
)P
RO
F−
0.02
31−
0.01
43∗∗
−0.
0451
∗−
0.10
87∗∗
−0.
392∗
∗∗
(0.0
252)
(0.0
383)
(0.0
249)
(0.0
508)
(0.0
79)
SIZE
0.01
67∗∗
∗0.
0106
∗∗0.
0187
∗∗∗
0.02
24∗∗
0.01
3∗∗
(0.0
022)
(0.0
043)
(0.0
024)
(0.0
094)
(0.0
06)
CO
LL
0.00
960.
0179
∗0.
0068
−0.
0113
0.00
6(0
.007
1)(0
.009
8)(0
.009
1)(0
.020
4)(0
.013
)R
ISK
−0.
0015
∗∗∗
−0.
0072
∗∗∗
−0.
0018
∗∗∗
−0.
0100
∗∗−
0.01
6∗∗∗
(0.0
004)
(0.0
023)
(0.0
014)
(0.0
023)
(0.0
03)
Yea
rFix
edE
ffec
tsYes
Yes
Yes
Yes
No
Ban
k’s
Fix
edE
ffec
tsYes
Yes
Yes
Yes
Yes
Cou
ntry
Fix
edE
ffec
tsYes
Yes
Yes
Yes
No
R-s
quar
e0.
860.
880.
860.
870.
88O
bser
vation
s4,
876
1,21
73,
559
1,21
02,
415
(con
tinu
ed)

180 International Journal of Central Banking September 2021
Tab
le6.
(Con
tinued
)
Note
s:T
his
tabl
ere
por
tsco
effici
ents
ofth
efo
llow
ing
regr
essi
onm
odel
s:
Lic
t=
β0
+β1PRO
Fic
t–1
+β2SI
ZE
ict–
1+
β3C
OLL
ict–
1+
β4R
ISK
ict–
1+
Ci+
Ct+
Cc
+e i
t
Lic
t=
β0
+β1M
BR
ict–
1+
β2PRO
Fic
t–1
+β3SI
ZE
ict–
1+
β4C
OLL
ict–
1+
β5R
ISK
ict–
1+
Ci+
Ct+
Cc
+e i
t,
whe
reL
ict
isth
eM
L(r
egre
ssio
ns4
and
5)or
BL
aspr
esen
ted
inth
eta
ble,
BL
isco
mpu
ted
as1
–(b
ook
valu
eof
equi
ty/b
ook
valu
eof
asse
ts);
ML
isca
lcul
ated
as1
–[m
arke
tva
lue
ofeq
uity
(com
pute
das
num
ber
ofou
tsta
ndin
gsh
ares
*end
ofye
arst
ock
pric
e)/m
arke
tva
lue
ofba
nk(c
ompu
ted
asth
em
arke
tva
lue
ofeq
uity
+boo
kva
lue
oflia
bilit
ies)
];M
BR
isca
lcul
ated
asth
era
tio
bet
wee
nm
arke
tva
lue
ofas
sets
and
boo
kva
lue
ofas
sets
;P
RO
Fis
com
pute
das
the
ratio
bet
wee
nth
esu
mof
pret
axpr
ofit
and
inte
rest
expen
ses
and
the
boo
kva
lue
ofas
sets
;SI
ZE
isde
fined
asth
elo
gof
tota
las
sets
whi
chis
com
pute
das
the
sum
ofth
efo
llow
ing
item
s:“c
ash
and
adva
nces
inot
her
cred
itin
stitut
ions
,”“c
laim
son
othe
rcr
edit
inst
itut
ions
,”“t
otal
loan
san
dre
ceiv
able
s,”
“fina
ncia
las
sets
clas
sifie
dat
fair
valu
eth
roug
hpr
ofit
orlo
ss,”
“fina
ncia
las
sets
clas
sifie
das
avai
labl
efo
rsa
le,”
“fina
ncia
las
sets
clas
sifie
das
held
for
trad
ing,
”“fi
nanc
ialas
sets
clas
sifie
das
held
tom
atur
ity,
”an
d“o
ther
asse
ts”
net
ofth
ere
spec
tive
impa
irm
ent;
CO
LL
isco
mpu
ted
asth
era
tio
bet
wee
nth
esu
mof
the
follo
win
gitem
s:“t
otal
secu
rities
,”“fi
xed
asse
ts,”
and
“cas
han
ddu
efr
omba
nks”
and
the
boo
kva
lue
ofas
sets
;an
dR
ISK
isco
mpu
ted
asth
ean
nual
ized
stan
dard
devi
atio
nof
mon
thly
stoc
kpr
ice
retu
rns
(mar
ket*
valu
eof
equi
ty/m
arke
tva
lue
ofba
nk)
–re
gres
sion
s2
and
4or
the
log
ofth
est
anda
rdde
viat
ion
ofre
turn
onas
sets
(whi
chis
com
pute
das
the
ratio
bet
wee
nne
tin
com
ean
dth
eav
erag
eof
boo
kva
lue
ofas
sets
)ca
lcul
ated
from
the
last
thre
eob
serv
atio
nsfo
rth
ere
spec
tive
year
–re
gres
sion
s1
and
3.R
egre
ssio
ns2
and
4on
lyco
nsid
erpu
blic
bank
s,w
here
asre
gres
sion
3on
lyco
nsid
ers
priv
ate
bank
s.W
eus
eth
eex
plan
ator
yva
riab
les
lagg
edby
one
per
iod
tom
itig
ate
pos
sibl
een
doge
neity
prob
lem
s.R
egre
ssio
n5
pres
ents
the
resu
lts
obta
ined
byG
ropp
and
Hei
der
(201
0)us
ing
asa
mpl
eco
nsis
ting
ofth
e20
0la
rges
ttr
aded
bank
sin
the
Uni
ted
Stat
esan
dE
Ufr
omth
eB
anks
cope
data
base
from
1991
to20
04.P
ublic
bank
sar
eth
ose
that
have
thei
req
uity
quot
ed/l
iste
din
capi
talm
arke
ts,w
here
aspr
ivat
eba
nks
are
thos
eth
atdo
not
have
thei
req
uity
quot
ed/l
iste
din
capi
talm
arke
ts.T
hesa
mpl
eis
from
2000
to20
16.R
obus
tst
anda
rder
rors
clus
tere
dat
the
bank
and
coun
try-
year
leve
lsar
ein
pare
nthe
ses.
*,**
,an
d**
*de
note
sign
ifica
nce
atth
e10
per
cent
,5
per
cent
,an
d1
per
cent
leve
l,re
spec
tive
ly.
Vol. 17 No. 3 The Determinants of European Banks’ Capital 181
be mentioned that we relax this assumption as a robustness check,by including a variable in the model which attempts to proxy theregulation framework of each country. The variable in question is adummy variable, which assumes a value of 1 if a country’s bankingregulatory authority has implemented a measure which influencesbanks’ capital requirements, and consequently banks’ capital struc-ture, and 0 otherwise. The data for this variable were sourced fromthe study of Cerutti et al. (2017).
Considering that the standard deviation of stock returns does notapply to private banks, we also adjust this variable, using the stan-dard deviation of return on assets, which is computed as being thestandard deviation during the last three years of the ratio betweennet income and average assets (as described in table 1). This mea-sure has already been adopted by other researchers, such as Beaver,Kettler, and Scholes (1970), Miller and Bromiley (1990), and Bromi-ley (1991), and also Titman and Wessels (1988), albeit for a contextof capital structure.
As a final step, we follow a common practice in the empiricalliterature on capital structure and opt to use a partial adjustmentframework (Flannery and Rangan 2006, Lemmon, Roberts, and Zen-der 2008, Gropp and Heider 2010, and De Jonghe and Oztekin 2015),which states that in a frictionless world, both banks and firms alwaysmaintain their target capital ratio. The speed of this adjustmentdepends on the tradeoff between adjustment costs and the costs ofoperating with suboptimal leverage.
Accordingly, in a partial adjustment model, a bank’s current cap-ital ratio, Kij,t, is a weighted average of its target capital ratio (withweight λ ∈ [0, 1]), K∗
ij,t, and the previous period’s capital ratio, Kij,t,as well as a random shock, ξijt:
Kij,t = λK∗ij,t + (1 − λ)Kij,t−1 + ξijt.
Every year, banks try to close a proportion λ of the gap betweentheir actual and target capital levels. The smaller the λ, the morerigid bank capital is; that is to say, banks take more time to reachtheir target. Therefore, λ is interpreted as being the speed of adjust-ment. As banks’ target capital ratio is not manifested, we have tomodel each bank’s target capital level as a function of observed bankcharacteristics Xij,t−1, banks’, year, and countries’ fixed effects:
182 International Journal of Central Banking September 2021
K∗ij,t = βXij,t−1.
Substituting the equation of target leverage in equation of par-tial adjustment yields the following specification:
Kij,t = λβXij,t−1 + (1 − λ)Kij,t−1 + ξijt,
which, when translated to our model, produces the following regres-sion:
Lict = β0 + λβ1Xict−1 + (1 − λ)Lict−1 + Ci + Ct + Cc + eict,
where Xij,t−1 represents banks’ determinants such as profitability,market-to-book ratio, size, collateral, and risk.
Despite acknowledging that the generalized method of moments(GMM) panel analysis proposed by Blundell and Bond (1998)is the most suitable estimator for handling dynamic panel data(with lagged dependent variables), we choose to use a fixed-effectsestimator—as our sample has a relatively long time-series dimension,and after taking into consideration the bias caused by the presence ofboth lagged dependent variables and fixed effects (Nickell 1981) andalso bearing in mind that our objective is not to estimate the truespeed of adjustment, but rather to test whether these variables andfixed effects are similar for both public and private banks, togetherwith the fact that the above-mentioned bias reduces proportionallyas the number of time-series observations increases (Blundell andBond 1998).
In addition, the panel GMM methods are prone to flaws such asthe weak instrument problem (Bun and Windmeijer 2010).4
The results are presented with and without the lag dependentvariable. Acknowledging the fact that the leverage ratio is char-acterized by a high time persistence—which, to a certain degree,hampers the contributions of the other identified determinants ofcapital structure—we opt to present and analyze the contributionsof the other determinants, with and without this variable, which is
4We also carry out the analysis using GMM, which proves not to impair theresults presented in the paper.
Vol. 17 No. 3 The Determinants of European Banks’ Capital 183
in line with the research methodology of both Lemmon, Roberts,and Zender (2008) and Gropp and Heider (2010).
It is worth mentioning that the results obtained here are pre-sented alongside those of Gropp and Heider (2010), in order tofacilitate the comparison between them both.
6. Results
This section provides empirical evidence for the research questionand the hypothesis presented in section 3.
6.1 Banks’ Capital Determinants
Table 6 outlines that banks’ capital structure definitively does notdepend exclusively on regulation, in contrast to the argument ofGropp and Heider (2010) that the coefficients associated with eachdeterminant of banks’ capital structure are statistically nonsignif-icant. We find that leverage is indeed positively correlated withsize and is negatively related with risk. These results are highlyaligned with those obtained by Rajan and Zingales (1995), Frankand Goyal (2009), and Gropp and Heider (2010), except for col-lateral and profitability—whose relationships are not statisticallysignificant, even though they manifest the same signs in the vastmajority of the regressions.
Nevertheless, some differences exist between the coefficients orig-inating from the research carried out by Gropp and Heider (2010)and also from those described in this paper (regressions 4 and 5 oftable 6)—which are mostly related with the magnitude of the coeffi-cients. These differences result from different samples and time spanused by both studies, as well as the use of time fixed effects in thispaper, as detailed in table 6.5 For example, the economic impor-tance (magnitude) of the market-to-book ratio (MBR) coefficient inGropp and Heider (2010) when compared with that obtained in thispaper is probably due to the stress experienced in capital marketsbetween 2008 and 2012 in several European countries, which results
5Gropp and Heider (2010) use a sample comprising the 200 largest tradedbanks in the United States and EU from the Bankscope database, from 1991 to2004.
184 International Journal of Central Banking September 2021
in market timing being a capital determinant with less economicrelevance. Additionally, the differences encountered with regards toregressions 1, 2, and 3 are hardly surprising, as they include privatebanks, whereas the sample used by Gropp and Heider (2010) onlyincludes large public banks.
The split of the analysis between private and public banks yieldssome interesting results. When we use regressions 2 and 3, with thesame dependent and explanatory variables, to assess the differencesbetween public and private banks, we find that the determinants ofboth types of banks’ capital structures are broadly similar. Nonethe-less, we can observe that profitability and collateral count more inpublic banks’ capital structure than in the case of private banks.Profitability and collateral coefficients have a higher statistical sig-nificance in public banks, when compared with private banks. In thecase of public banks, profitability is statistically significant at 5 per-cent, and collateral is statistically significant at 10 percent, whereasin the case of private banks, profitability is significant at 10 percent,and collateral is not statistically significant at all.
Although the above-mentioned analysis has some drawbacks—such as assuming that market timing (measured by market-to-bookratio) does not apply to public banks and that the book values ofassets, liabilities, and equity are taken into account in banks’ capitaldecisions to the same degree as market value—it neglects to a largeextent the empirical studies which have been carried out over thepast years, in particular those carried out by Brav (2009) in the caseof nonfinancial firms, and Gropp and Heider (2010) in the case ofbanks.
In fact, regression 4 reveals that the role carried out by themarket timing theory is important for public banks, and that mar-ket values are important for capital structure, which highlights thedifferences between public and private banks.
Taking into account the arguments presented above, we base ouranalysis on regressions 3 and 4, in order to explain the main differ-ences between public and private banks, and we opt to only subjectthese specifications to robustness checks.
That said, the comparison between the results from regressions3 and 4 of table 6 all indicate that the determinants of public andprivate banks’ capital structure are different. As such, the resultsof this paper evidence that, in the case of private banks, only size
Vol. 17 No. 3 The Determinants of European Banks’ Capital 185
and risk are statistically significant at 5 percent and these maintainthe expected signs, whereas in the case of public banks, their lever-age is negatively related with market-to-book ratio (thus supportingthe market timing theory), as well as profitability (associated withthe pecking order theory) and risk, and are positively correlated withsize, with all the coefficients being statistically significant at a 5 per-cent level. These results are in line with those obtained by Flanneryand Rangan (2008), Lemmon, Roberts, and Zender (2008), Frankand Goyal (2009), and Gropp and Heider (2010).
So far, we can state that in the case of private banks, there aretwo theories which do not apply in the same manner as in the caseof public banks. First, the market timing theory by nature does notapply to private banks, as previously observed in the case of nonfi-nancial firms (Brav 2009), because the equity of private banks is notmarked-to-market. Additionally, the pecking order theory does notapply to private banks with the same significance and magnitudeas it is applicable to public banks. According to regression 3, thebeta for banks’ profitability reaches –0.045 and is only statisticallysignificant at a 10 percent level, whereas in the case of public banks(regression 4), this measure amounts to –0.109, and it is statisticallysignificant at a 5 percent level. It is logical that profitability countsmore in the case of public banks, as the pecking order theory gainsmore relevance against the cost of issuing equity in the market—which is only available to public banks. Economically speaking, wecan see that an increase of 1 percentage point of profitability for theaverage public bank (table 3, panel A) results in a decline of 1 basispoint in banks’ leverage, whereas for private banks, this increaseresults in a reduction of 0.2 basis point—in other words, profitabil-ity does not have an economic impact on banks’ leverage in the caseof private banks. Regarding other determinants, we also find differ-ences in magnitude of size and risk; however, these do not result ina significant impact for the average bank in both types of banks.
Considering the argument that banks manage their capital orleverage ratios toward a target, table 7 shows that the speed ofadjustment remains stable at around 40 percent whether we con-sider either the full sample or just private banks—which meansthat the banks of our sample converge toward their long-run tar-get at a speed of adjustment which is approximately the same asthat obtained by Gropp and Heider (2010) (46 percent) and greater

186 International Journal of Central Banking September 2021
Tab
le7.
Reg
ress
ion
Res
ults:
The
Det
erm
inan
tsof
Ban
ks’
Cap
ital
Str
uct
ure
Reg
ress
ion
5R
egre
ssio
n1
Reg
ress
ion
2R
egre
ssio
n3
Reg
ress
ion
4(G
ropp
and
(All
Ban
ks)
(Public
Ban
ks)
(Pri
vate
Ban
ks)
(Public
Ban
ks)
Hei
der
2010)
BL
BL
BL
ML
ML
Lt–
10.
6128
∗∗∗
0.60
77∗∗
∗0.
6028
∗∗∗
0.72
63∗∗
∗0.
532∗
∗∗
(0.0
327)
(0.0
694)
(0.0
371)
(0.0
536)
(0.0
45)
MB
R—
——
0.00
89∗∗
0.03
2∗∗
——
—(0
.003
5)(0
.015
)P
RO
F0.
0185
0.02
860.
0060
−0.
0078
−0.
096∗
∗
(0.0
154)
(0.0
220)
(0.0
179)
(0.0
386)
(0.0
45)
SIZE
0.00
38∗∗
0.00
46∗∗
0.00
41∗∗
0.08
1−
0.00
5∗∗
(0.0
015)
(0.0
021)
(0.0
019)
(0.0
062)
(0.0
02)
CO
LL
0.00
660.
0114
0.00
60−
0.01
350.
007
(0.0
047)
(0.0
072)
(0.0
061)
(0.0
131)
(0.0
12)
RIS
K−
0.00
12∗∗
∗−
0.00
21∗∗
−0.
0013
∗∗∗
−0.
0004
−0.
003
(0.0
003)
(0.0
009)
(0.0
003)
(0.0
019)
(0.0
02)
Yea
rFix
edE
ffec
tsYes
Yes
Yes
Yes
No
Ban
k’s
Fix
edE
ffec
tsYes
Yes
Yes
Yes
Yes
Cou
ntry
Fix
edE
ffec
tsYes
Yes
Yes
Yes
No
R-s
quar
e0.
910.
920.
910.
900.
92O
bser
vation
s4,
876
1,21
73,
559
1,21
02,
059
(con
tinu
ed)

Vol. 17 No. 3 The Determinants of European Banks’ Capital 187
Tab
le7.
(Con
tinued
)
Note
s:T
his
tabl
ere
por
tsco
effici
ents
ofth
efo
llow
ing
regr
essi
onm
odel
s:
Lic
t=
β0
+λβ1X
ict–
1+
(1−
λ)L
ict–
1+
Ci+
Ct+
Cc
+e i
ct,
whe
reL
ict
isth
eM
L(r
egre
ssio
ns4
and
5)or
BL
aspr
esen
ted
inth
eta
ble,
BL
isco
mpu
ted
as1–
(boo
kva
lue
ofeq
uity
/boo
kva
lue
ofas
sets
);M
Lis
calc
ulat
edas
1–[m
arke
tva
lue
ofeq
uity
(com
pute
das
num
ber
ofou
tsta
ndin
gsh
ares
*end
ofye
arst
ock
pric
e)/m
arke
tva
lue
ofba
nk(c
ompu
ted
asth
em
arke
tva
lue
ofeq
uity
+boo
kva
lue
oflia
bilit
ies)
];X
ij,t
–1
stan
dsfo
rba
nks’
dete
rmin
ants
such
asM
BR
,PR
OF,S
IZE
,CO
LL,a
ndR
ISK
.MB
Ris
calc
ulat
edas
the
ratio
bet
wee
nm
arke
tva
lue
ofas
sets
and
boo
kva
lue
ofas
sets
;PR
OF
isco
mpu
ted
asth
era
tio
bet
wee
nth
esu
mof
pre-
tax
profi
tan
din
tere
stex
pen
ses
and
the
boo
kva
lue
ofas
sets
;SI
ZE
isde
fined
asth
elo
gof
tota
las
sets
whi
chis
com
pute
das
the
sum
ofth
efo
llow
ing
item
s:“c
ash
and
adva
nces
inot
her
cred
itin
stitut
ions
,”“c
laim
son
othe
rcr
edit
inst
itut
ions
,”“t
otal
loan
san
dre
ceiv
able
s,”
“fina
ncia
las
sets
clas
sifie
dat
fair
valu
eth
roug
hpr
ofit
orlo
ss,”
“fina
ncia
las
sets
clas
sifie
das
avai
labl
efo
rsa
le,”
“fina
ncia
las
sets
clas
sifie
das
held
for
trad
ing,
”“fi
nanc
ialas
sets
clas
sifie
das
held
tom
atur
ity,
”an
d“o
ther
asse
ts”
net
ofth
ere
spec
tive
impa
irm
ent;
CO
LL
isco
mpu
ted
asth
era
tio
bet
wee
nth
esu
mof
the
follo
win
gitem
s:“t
otal
secu
rities
,”“fi
xed
asse
ts,”
and
“cas
han
ddu
efr
omba
nks”
and
the
boo
kva
lue
ofas
sets
;an
dR
ISK
isco
mpu
ted
asth
ean
nual
ized
stan
dard
devi
atio
nof
mon
thly
stoc
kpr
ice
retu
rns
(mar
ket*
valu
eof
equi
ty/m
arke
tva
lue
ofba
nk)
–re
gres
sion
s2
and
4or
the
log
ofth
est
anda
rdde
viat
ion
ofre
turn
onas
sets
(whi
chis
com
pute
das
the
ratio
bet
wee
nne
tin
com
ean
dth
eav
erag
eof
boo
kva
lue
ofas
sets
)ca
lcul
ated
from
the
last
thre
eob
serv
atio
nsfo
rth
ere
spec
tive
year
–re
gres
sion
s1
and
3.W
eus
eth
eex
plan
ator
yva
riab
les
lagg
edby
one
per
iod
tom
itig
ate
pos
sibl
een
doge
neity
prob
lem
s.R
egre
ssio
n5
pres
ents
the
resu
lts
obta
ined
byG
ropp
and
Hei
der
(201
0)us
ing
asa
mpl
eco
nsis
ting
ofth
e20
0la
rges
ttr
aded
bank
sin
the
Uni
ted
Stat
esan
dE
Ufr
omth
eB
anks
cope
data
base
from
1991
to20
04.P
ublic
bank
sar
eth
ose
that
have
thei
req
uity
quot
ed/l
iste
din
capi
talm
arke
ts,w
here
aspr
ivat
eba
nks
are
thos
eth
atdo
not
have
thei
req
uity
quot
ed/l
iste
din
capi
talm
arke
ts.T
hesa
mpl
eis
from
2000
to20
16.R
obus
tst
anda
rder
rors
clus
tere
dat
the
bank
and
coun
try-
year
leve
lsar
ein
pare
nthe
ses.
*,**
,an
d**
*de
note
sign
ifica
nce
atth
e10
per
cent
,5
per
cent
,an
d1
per
cent
leve
l,re
spec
tive
ly.
188 International Journal of Central Banking September 2021
than that obtained by De Jonghe and Oztekin (2015) (29 percent).Despite the similar significance of the lag coefficient for both types ofbanks, it is interesting to observe that private banks, which evidencea speed of adjustment of 40 percent, are slightly faster than publicbanks in reaching their capital target ratios, whose speed of adjust-ment is around 27 percent. This feature is probably due to the factthat public banks are more exposed to market volatility than pri-vate banks. It is not surprising that public banks show a lower speedof adjustment than private banks, bearing in mind that the timeperiod considered in this study encompasses the global financial cri-sis, as well as the sovereign debt crisis experienced in Europe—bothof which negatively affected capital markets, and especially thosebanks that detained sovereign debt and were under the spotlight ofthe markets.
It should be mentioned that the effect of the lag of the lever-age ratio on the other determinants does not put into question thedifferences found between public and private banks. This result isdue to the acknowledged high persistence of the leverage ratio, overtime, which jeopardizes the effect of other variables. To this end, wecommence our analysis by ignoring the lag of the leverage ratio andinstead include the persistence of the leverage ratio in our analysis,as carried out by Lemmon, Roberts, and Zender (2008) and Groppand Heider (2010), in order to better assess the slight differencesbetween public and private banks.
6.2 Access to the Subordinated Debt and the Influence of ItsDiscipline
The results presented so far point out some differences between pub-lic and private banks, both in statistical significance and in magni-tude, with regards to their decisions in relation to the optimizationof their capital structure, with particular relevance for their maindeterminants. These results are hardly surprising, given that it isnatural for public banks to have easier access to capital and debtmarkets, which in turn can highly influence their decisions regardingcapital structure. It is therefore important to investigate the impli-cations of these differences in terms of access by banks to capital anddebt markets and consequently the space given to market discipline.
Vol. 17 No. 3 The Determinants of European Banks’ Capital 189
Market discipline can be defined as the “process by whichinformed market investors gather and monitors firm’s activities andprospects as well as their risk” (Flannery and Sorescu 1996). Theimportance of market discipline has been recognized by supervisorsand regulators since the implementation of Basel II (Basel Commit-tee on Banking Supervision 2006). It is important to mention thatBasel II introduced a third pillar called “Market Discipline”—whoseaim is to encourage market discipline by introducing the disclosureof a broader range of information, in order to enable market par-ticipants to assess key pieces of information regarding capital, riskexposures, risk-assessment procedures, and the capital adequacy ofthe institution (BCBS 2006).
Even though one stream of the literature argues that banks’ cap-ital structure and risk-taking are heavily determined by regulatorsand supervisors, rather than by markets (Berger, Herring, and Szego1995, Rajan and Zingales 1995, Santos 2001, and Calomiris and Wil-son 2004), another, more recent, strand of the literature advocatesthat the attributes that affect banks’ capital structure and targetratios are not that different from those which influence nonfinancialfirms’ capital (Flannery 1994, Flannery and Rangan 2008, Groppand Heider 2010, Allen, Carletti, and Marquez 2011, and De Jongheand Oztekin 2015). This view stresses that banks are, to a certainextent, subject to market discipline, and that more space should begiven to the market discipline of banks.
In this context, in order to shed some light on the differencesbetween public and private banks with regards to access to capitaland debt markets and ultimately the influence of market disciplineon both types of banks’ capital determinants, it is useful to testwhether public banks rely more on nondeposits debt and subordi-nated debt than private banks. According to Flannery (1994), Flan-nery and Sorescu (1996), Morgan and Stiroh (2001), Flannery andRangan (2008), and Allen, Carletti, and Marquez (2011), this kindof debt is more subject to market discipline than deposits.
Taking the share of assets funded by subordinated debt as aproxy for market access and market discipline, table 8 shows thatpublic banks have been relying more on subordinated debt to fundtheir assets than private banks—which could imply that publicbanks have been capturing the preference of the market, as theircapital determinants are more similar to those observed in the case
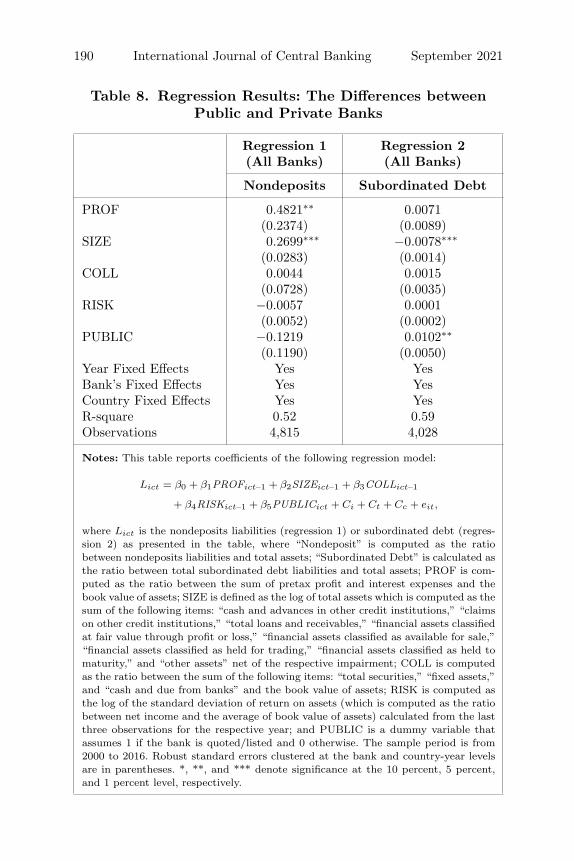
190 International Journal of Central Banking September 2021
Table 8. Regression Results: The Differences betweenPublic and Private Banks
Regression 1 Regression 2(All Banks) (All Banks)
Nondeposits Subordinated Debt
PROF 0.4821∗∗ 0.0071(0.2374) (0.0089)
SIZE 0.2699∗∗∗ −0.0078∗∗∗
(0.0283) (0.0014)COLL 0.0044 0.0015
(0.0728) (0.0035)RISK −0.0057 0.0001
(0.0052) (0.0002)PUBLIC −0.1219 0.0102∗∗
(0.1190) (0.0050)Year Fixed Effects Yes YesBank’s Fixed Effects Yes YesCountry Fixed Effects Yes YesR-square 0.52 0.59Observations 4,815 4,028
Notes: This table reports coefficients of the following regression model:
Lict = β0 + β1PROFict–1 + β2SIZEict–1 + β3COLLict–1
+ β4RISKict–1 + β5PUBLICict + Ci + Ct + Cc + eit,
where Lict is the nondeposits liabilities (regression 1) or subordinated debt (regres-sion 2) as presented in the table, where “Nondeposit” is computed as the ratiobetween nondeposits liabilities and total assets; “Subordinated Debt” is calculated asthe ratio between total subordinated debt liabilities and total assets; PROF is com-puted as the ratio between the sum of pretax profit and interest expenses and thebook value of assets; SIZE is defined as the log of total assets which is computed as thesum of the following items: “cash and advances in other credit institutions,” “claimson other credit institutions,” “total loans and receivables,” “financial assets classifiedat fair value through profit or loss,” “financial assets classified as available for sale,”“financial assets classified as held for trading,” “financial assets classified as held tomaturity,” and “other assets” net of the respective impairment; COLL is computedas the ratio between the sum of the following items: “total securities,” “fixed assets,”and “cash and due from banks” and the book value of assets; RISK is computed asthe log of the standard deviation of return on assets (which is computed as the ratiobetween net income and the average of book value of assets) calculated from the lastthree observations for the respective year; and PUBLIC is a dummy variable thatassumes 1 if the bank is quoted/listed and 0 otherwise. The sample period is from2000 to 2016. Robust standard errors clustered at the bank and country-year levelsare in parentheses. *, **, and *** denote significance at the 10 percent, 5 percent,and 1 percent level, respectively.
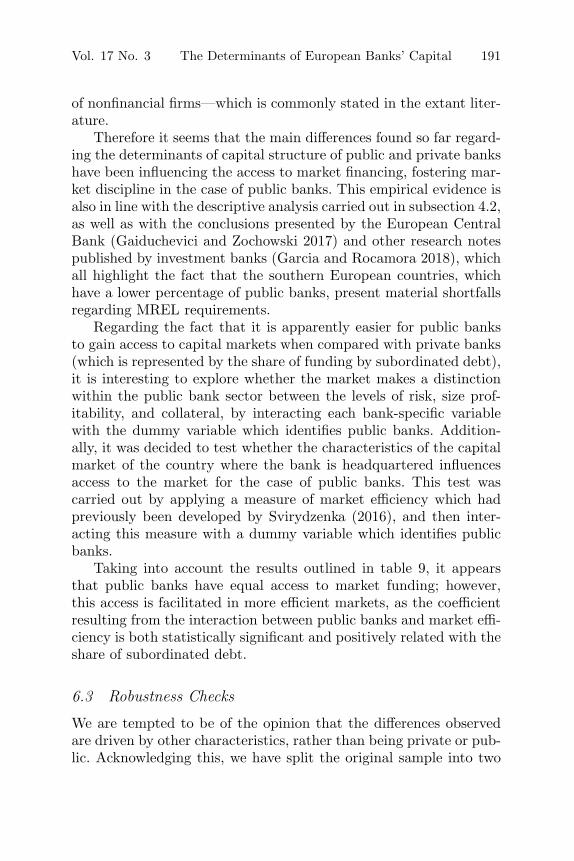
Vol. 17 No. 3 The Determinants of European Banks’ Capital 191
of nonfinancial firms—which is commonly stated in the extant liter-ature.
Therefore it seems that the main differences found so far regard-ing the determinants of capital structure of public and private bankshave been influencing the access to market financing, fostering mar-ket discipline in the case of public banks. This empirical evidence isalso in line with the descriptive analysis carried out in subsection 4.2,as well as with the conclusions presented by the European CentralBank (Gaiduchevici and Zochowski 2017) and other research notespublished by investment banks (Garcia and Rocamora 2018), whichall highlight the fact that the southern European countries, whichhave a lower percentage of public banks, present material shortfallsregarding MREL requirements.
Regarding the fact that it is apparently easier for public banksto gain access to capital markets when compared with private banks(which is represented by the share of funding by subordinated debt),it is interesting to explore whether the market makes a distinctionwithin the public bank sector between the levels of risk, size prof-itability, and collateral, by interacting each bank-specific variablewith the dummy variable which identifies public banks. Addition-ally, it was decided to test whether the characteristics of the capitalmarket of the country where the bank is headquartered influencesaccess to the market for the case of public banks. This test wascarried out by applying a measure of market efficiency which hadpreviously been developed by Svirydzenka (2016), and then inter-acting this measure with a dummy variable which identifies publicbanks.
Taking into account the results outlined in table 9, it appearsthat public banks have equal access to market funding; however,this access is facilitated in more efficient markets, as the coefficientresulting from the interaction between public banks and market effi-ciency is both statistically significant and positively related with theshare of subordinated debt.
6.3 Robustness Checks
We are tempted to be of the opinion that the differences observedare driven by other characteristics, rather than being private or pub-lic. Acknowledging this, we have split the original sample into two
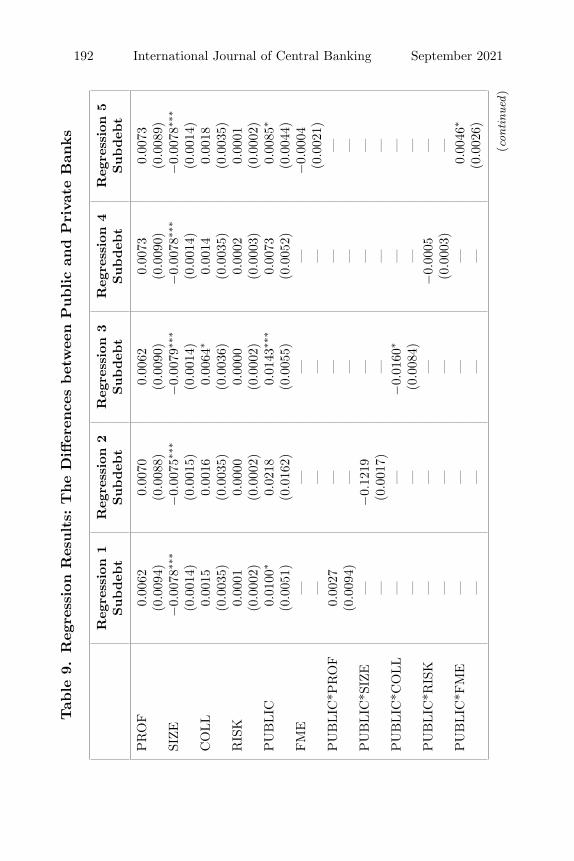
192 International Journal of Central Banking September 2021Tab
le9.
Reg
ress
ion
Res
ults:
The
Diff
eren
ces
bet
wee
nP
ublic
and
Pri
vate
Ban
ks
Reg
ress
ion
1R
egre
ssio
n2
Reg
ress
ion
3R
egre
ssio
n4
Reg
ress
ion
5Subdeb
tSubdeb
tSubdeb
tSubdeb
tSubdeb
t
PR
OF
0.00
620.
0070
0.00
620.
0073
0.00
73(0
.009
4)(0
.008
8)(0
.009
0)(0
.009
0)(0
.008
9)SI
ZE
−0.
0078
∗∗∗
−0.
0075
∗∗∗
−0.
0079
∗∗∗
−0.
0078
∗∗∗
−0.
0078
∗∗∗
(0.0
014)
(0.0
015)
(0.0
014)
(0.0
014)
(0.0
014)
CO
LL
0.00
150.
0016
0.00
64∗
0.00
140.
0018
(0.0
035)
(0.0
035)
(0.0
036)
(0.0
035)
(0.0
035)
RIS
K0.
0001
0.00
000.
0000
0.00
020.
0001
(0.0
002)
(0.0
002)
(0.0
002)
(0.0
003)
(0.0
002)
PU
BLIC
0.01
00∗
0.02
180.
0143
∗∗∗
0.00
730.
0085
∗
(0.0
051)
(0.0
162)
(0.0
055)
(0.0
052)
(0.0
044)
FM
E—
——
—−
0.00
04—
——
—(0
.002
1)P
UB
LIC
*PR
OF
0.00
27—
——
—(0
.009
4)—
——
—P
UB
LIC
*SIZ
E—
−0.
1219
——
——
(0.0
017)
——
—P
UB
LIC
*CO
LL
——
−0.
0160
∗—
——
—(0
.008
4)—
—P
UB
LIC
*RIS
K—
——
−0.
0005
——
——
(0.0
003)
—P
UB
LIC
*FM
E—
——
—0.
0046
∗
——
——
(0.0
026)
(con
tinu
ed)

Vol. 17 No. 3 The Determinants of European Banks’ Capital 193
Tab
le9.
(Con
tinued
)
Reg
ress
ion
1R
egre
ssio
n2
Reg
ress
ion
3R
egre
ssio
n4
Reg
ress
ion
5Subdeb
tSubdeb
tSubdeb
tSubdeb
tSubdeb
t
Yea
rFix
edE
ffect
sY
esY
esY
esY
esY
esB
ank’
sFix
edE
ffect
sY
esY
esY
esY
esY
esC
ount
ryFix
edE
ffect
sY
esY
esY
esY
esY
esR
-squ
are
0.59
0.59
0.59
0.59
0.59
Obs
erva
tion
s4,
028
4,02
84,
028
4,02
84,
028
Note
s:T
his
tabl
ere
por
tsth
eco
effici
ents
ofse
vera
lre
gres
sion
sw
hich
expl
oit
inte
ract
ions
bet
wee
npu
blic
bank
san
dba
nk-s
pec
ific
vari
able
sas
wel
las
aco
untr
y-sp
ecifi
cva
riab
leth
atch
arac
teri
zes
each
coun
try
finan
cial
mar
ket
effici
ency
,in
spir
edby
the
wor
kca
rrie
dou
tby
Svir
ydze
nka
(201
6).“
SubD
ebt”
stan
dsfo
rsu
bor
dina
ted
debt
,cal
cula
ted
asth
era
tio
bet
wee
nto
tals
ubor
dina
ted
debt
liabi
litie
san
dto
talas
sets
;P
RO
Fis
com
pute
das
the
ratio
bet
wee
nth
esu
mof
pret
axpr
ofit
and
inte
rest
expen
ses
and
the
boo
kva
lue
ofas
sets
;SI
ZE
isde
fined
asth
elo
gof
tota
las
sets
,w
hich
isco
mpu
ted
asth
esu
mof
the
follo
win
gitem
s:“c
ash
and
adva
nces
inot
her
cred
itin
stitut
ions
,”“c
laim
son
othe
rcr
edit
inst
itut
ions
,”“t
otal
loan
san
dre
ceiv
able
s,”
“fina
ncia
lass
ets
clas
sifie
dat
fair
valu
eth
roug
hpr
ofit
orlo
ss,”
“fina
ncia
las
sets
clas
sifie
das
avai
labl
efo
rsa
le,”
“fina
ncia
las
sets
clas
sifie
das
held
for
trad
ing,
”“fi
nanc
ial
asse
tscl
assi
fied
ashe
ldto
mat
urity,
”an
d“o
ther
asse
ts”
net
ofth
ere
spec
tive
impa
irm
ent;
CO
LL
isco
mpu
ted
asth
era
tio
bet
wee
nth
esu
mof
the
follo
win
gitem
s:“t
otal
secu
rities
,”“fi
xed
asse
ts,”
and
“cas
han
ddu
efr
omba
nks”
and
the
boo
kva
lue
ofas
sets
;R
ISK
isco
mpu
ted
asth
elo
gof
the
stan
dard
devi
atio
nof
retu
rnon
asse
ts(w
hich
isco
mpu
ted
asth
era
tio
bet
wee
nne
tin
com
ean
dth
eav
erag
eof
boo
kva
lue
ofas
sets
)ca
lcul
ated
from
the
last
thre
eob
serv
atio
nsfo
rth
ere
spec
tive
year
;P
UB
LIC
isa
dum
my
vari
able
that
assu
mes
1if
the
bank
isqu
oted
/lis
ted,
and
0ot
herw
ise;
and
FM
Est
ands
for
finan
cial
mar
ket
effici
ency
inde
xco
mpu
ted
asst
ock
mar
ket
turn
over
ratio,
i.e.,
stoc
kstr
aded
toca
pita
lizat
ion
(Svi
rydz
enka
2016
).T
hesa
mpl
eper
iod
isfr
om20
00to
2016
.R
obus
tst
anda
rder
rors
clus
tere
dat
the
bank
and
coun
try-
year
leve
lsar
ein
pare
nthe
ses.
*,**
,an
d**
*de
note
sign
ifica
nce
atth
e10
per
cent
,5
per
cent
,an
d1
per
cent
leve
l,re
spec
tive
ly.
194 International Journal of Central Banking September 2021
subsamples which group the institutions into two clusters accord-ing to their size (as a proxy for similarity). Cluster 1 comprisessmall/medium banks (banks with average assets of less than 81 bil-lion euros), and cluster 2 comprises large banks (banks with aver-age assets equal to or greater than 81 billion euros). By using thisdivision, we can isolate the differences between public and private,comparing similar banks by using size as the common characteristicfor the two groups of banks.
Table 10 shows that, in the case of small/medium banks (cluster1), the differences between the determinants of public and privatebanks’ capital structure are maintained when compared with theresults presented in table 6. That is to say that the determinants ofpublic banks’ capital structure are closer to those which affect nonfi-nancial firms. In the case of large banks (cluster 2), to a large extentthese results do not confirm those initially reported. Accordingly,we can notice certain differences between public and private banksin relation to their capital structure, although these differences arenot relevant for the group of large banks (cluster 2). This may bepartly explained by the fact that in cluster 2 we obtained a substan-tially lower number of observations, which hampers the variabilityin the coefficients, compounded by the fact that large banks are sub-ject to tighter market discipline than small/medium banks—whichdiminishes the effect of the type of banks on their capital structuredeterminants.
As mentioned in section 5, we relax the assumption that eachcountry’s regulatory framework is included in country and year fixedeffects, in similarity to Gropp and Heider (2010), and we include adummy variable which is adapted from the study carried out byCerutti et al. (2017)—which assumes the value of 1 if any tight cap-ital measure was implemented by each regulatory authority, and 0otherwise. The inclusion of this variable does not change the resultsnor the conclusions presented in this paper (table 11).
7. Main Conclusions and Policy Implications
Over the last decade there has been a considerable increase in thenumber of empirical studies which have focused on testing howthe determinants of capital structure applied to nonfinancial firmscan also apply to banks. Two of the most important recent studies

Vol. 17 No. 3 The Determinants of European Banks’ Capital 195Tab
le10
.R
egre
ssio
nR
esults:
The
Det
erm
inan
tsof
Ban
ks’
Cap
ital
Str
uct
ure
Reg
ress
ion
1R
egre
ssio
n2
Reg
ress
ion
3R
egre
ssio
n4
(Pri
vate
Ban
ks)
(Public
Ban
ks)
(Pri
vate
Ban
ks)
(Public
Ban
ks)
(Clu
ster
1)
(Clu
ster
1)
(Clu
ster
2)
(Clu
ster
2)
BL
BL
BL
ML
MB
R—
−0.
0274
∗∗∗
—−
0.03
24∗∗
∗
—(0
.004
5)—
(0.0
069)
PR
OF
−0.
0565
∗∗−
0.18
05∗∗
∗0.
0108
0.02
01(0
.028
5)(0
.061
4)(0
.035
3)(0
.083
5)SI
ZE
0.01
86∗∗
∗0.
0174
0.02
26∗∗
∗0.
0224
∗∗
(0.0
027)
(0.0
122)
(0.0
043)
(0.0
095)
CO
LL
0.00
500.
0031
0.01
560.
0101
(0.0
105)
(0.0
263)
(0.0
145)
(0.0
368)
RIS
K−
0.00
19∗∗
∗−
0.00
82∗∗
∗−
0.00
15∗∗
−0.
0129
∗∗∗
(0.0
006)
(0.0
028)
(0.0
007)
(0.0
039)
Yea
rFix
edE
ffec
tsYes
Yes
Yes
Yes
Ban
k’s
Fix
edE
ffec
tsYes
Yes
Yes
Yes
Cou
ntry
Fix
edE
ffec
tsYes
Yes
Yes
Yes
R-s
quar
e0.
850.
880.
820.
79O
bser
vation
s3,
067
831
492
379
Note
s:T
his
table
repor
tsco
effici
ents
ofth
efo
llow
ing
regr
essi
onm
odel
:
Lict
=β0
+β1PRO
Fict–1
+β2SIZ
Eict–1
+β3CO
LL
ict–1
+β4RIS
Kict–1
+C
i+
Ct+
Cc
+e
it,
wher
eL
ict
isth
eM
L(r
egre
ssio
ns
2an
d4)
orB
Las
pre
sent
edin
the
table
,B
Lis
com
pute
das
1–
(boo
kva
lue
ofeq
uity/
boo
kva
lue
ofas
sets
);PR
OF
isco
mpute
das
the
rati
obet
wee
nth
esu
mof
pre
tax
pro
fit
and
inte
rest
expen
ses
and
the
boo
kva
lue
ofas
sets
;SIZ
Eis
defi
ned
asth
elo
gof
tota
las
sets
,w
hic
his
com
pute
das
the
sum
ofth
efo
llow
ing
item
s:“c
ash
and
adva
nce
sin
other
cred
itin
stit
uti
ons,
”“c
laim
son
other
cred
itin
stit
uti
ons,
”“t
otal
loan
san
dre
ceiv
able
s,”
“finan
cial
asse
tscl
assi
fied
atfa
irva
lue
thro
ugh
pro
fit
orlo
ss,”
“finan
cial
asse
tscl
assi
fied
asav
aila
ble
forsa
le,”
“finan
cial
asse
tscl
assi
fied
ashel
dfo
rtr
adin
g,”
“finan
cial
asse
tscl
assi
fied
ashel
dto
mat
uri
ty,”
and
“oth
eras
sets
”net
ofth
ere
spec
tive
impai
rmen
t;C
OLL
isco
mpute
das
the
rati
obet
wee
nth
esu
mof
the
follow
ing
item
s:“t
otal
secu
riti
es,”
“fixe
das
sets
,”an
d“c
ash
and
due
from
ban
ks”
and
the
boo
kva
lue
ofas
sets
;R
ISK
isco
mpute
das
the
log
ofth
est
andar
ddev
iati
onof
retu
rnon
asse
ts(w
hic
his
com
pute
das
the
rati
obet
wee
nnet
inco
me
and
the
aver
age
ofboo
kva
lue
ofas
sets
)ca
lcula
ted
from
the
last
thre
eob
serv
atio
ns
for
the
resp
ecti
veye
ar.
Public
ban
ksar
eth
ose
that
hav
eth
eir
equity
quot
ed/l
iste
din
capit
alm
arke
ts,w
her
eas
pri
vate
ban
ksar
eth
ose
that
do
not
hav
eth
eir
equity
quot
ed/l
iste
din
capit
alm
arke
ts.T
he
sam
ple
isfr
om20
00to
2016
.R
obust
stan
dar
der
rors
clust
ered
atth
eban
kan
dco
unt
ry-y
ear
leve
lsar
ein
par
enth
eses
.*,
**,an
d**
*den
ote
sign
ifica
nce
atth
e10
per
cent
,5
per
cent
,an
d1
per
cent
leve
l,re
spec
tive
ly.
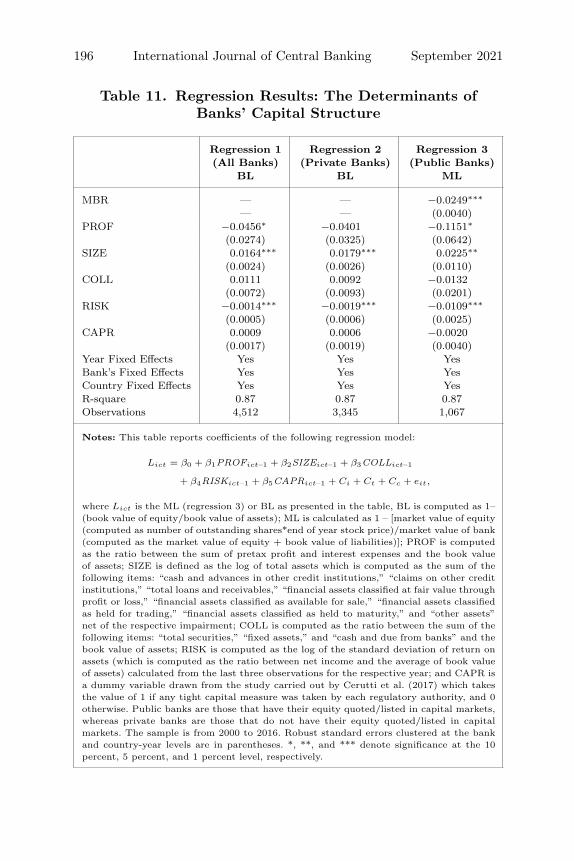
196 International Journal of Central Banking September 2021
Table 11. Regression Results: The Determinants ofBanks’ Capital Structure
Regression 1 Regression 2 Regression 3(All Banks) (Private Banks) (Public Banks)
BL BL ML
MBR — — −0.0249∗∗∗
— — (0.0040)PROF −0.0456∗ −0.0401 −0.1151∗
(0.0274) (0.0325) (0.0642)SIZE 0.0164∗∗∗ 0.0179∗∗∗ 0.0225∗∗
(0.0024) (0.0026) (0.0110)COLL 0.0111 0.0092 −0.0132
(0.0072) (0.0093) (0.0201)RISK −0.0014∗∗∗ −0.0019∗∗∗ −0.0109∗∗∗
(0.0005) (0.0006) (0.0025)CAPR 0.0009 0.0006 −0.0020
(0.0017) (0.0019) (0.0040)Year Fixed Effects Yes Yes YesBank’s Fixed Effects Yes Yes YesCountry Fixed Effects Yes Yes YesR-square 0.87 0.87 0.87Observations 4,512 3,345 1,067
Notes: This table reports coefficients of the following regression model:
Lict = β0 + β1PROFict–1 + β2SIZEict–1 + β3COLLict–1
+ β4RISKict–1 + β5CAPRict–1 + Ci + Ct + Cc + eit,
where Lict is the ML (regression 3) or BL as presented in the table, BL is computed as 1–(book value of equity/book value of assets); ML is calculated as 1 – [market value of equity(computed as number of outstanding shares*end of year stock price)/market value of bank(computed as the market value of equity + book value of liabilities)]; PROF is computedas the ratio between the sum of pretax profit and interest expenses and the book valueof assets; SIZE is defined as the log of total assets which is computed as the sum of thefollowing items: “cash and advances in other credit institutions,” “claims on other creditinstitutions,” “total loans and receivables,” “financial assets classified at fair value throughprofit or loss,” “financial assets classified as available for sale,” “financial assets classifiedas held for trading,” “financial assets classified as held to maturity,” and “other assets”net of the respective impairment; COLL is computed as the ratio between the sum of thefollowing items: “total securities,” “fixed assets,” and “cash and due from banks” and thebook value of assets; RISK is computed as the log of the standard deviation of return onassets (which is computed as the ratio between net income and the average of book valueof assets) calculated from the last three observations for the respective year; and CAPR isa dummy variable drawn from the study carried out by Cerutti et al. (2017) which takesthe value of 1 if any tight capital measure was taken by each regulatory authority, and 0otherwise. Public banks are those that have their equity quoted/listed in capital markets,whereas private banks are those that do not have their equity quoted/listed in capitalmarkets. The sample is from 2000 to 2016. Robust standard errors clustered at the bankand country-year levels are in parentheses. *, **, and *** denote significance at the 10percent, 5 percent, and 1 percent level, respectively.
Vol. 17 No. 3 The Determinants of European Banks’ Capital 197
are those of Gropp and Heider (2010) and De Jonghe and Oztekin(2015). Using a sample of large and public banks from Europe andthe United States (from 1991 to 2004), the first study shows thatregulation is not the main feature that distinguishes bank capitalstructure from what was argued by Modigliani and Miller (1958),as, for these authors, most banks appear to optimize their capitalstructure in much the same way as nonfinancial firms—except whentheir capital is close to the regulatory minimum.
Taking Gropp and Heider (2010) as a starting point, we assesswhether the determinants of European banks’ capital structure alsodepend on the type of the institution (i.e., whether it is privateor public). We attempt to empirically answer the following ques-tion: Are the determinants of banks’ capital structure different inpublic versus private banks? This topic has gained significant atten-tion after the implementation of the new capital requirements ofBasel III (conservation buffer, countercyclical buffer, and capitalbuffers for systemically important institutions, as well as lever-age requirements—unweighted capital requirements) and also theMREL requirements envisaged in the new resolution framework—where access by banks to market financing plays a pivotal rolein the success of compliance with these new requirements, whichconsequently strengthen the entire financial system and ultimatelyfinancial stability as a whole.
To a certain extent, our results for the sample as a whole confirmthose of Gropp and Heider (2010), namely that leverage is posi-tively correlated with size and is negatively correlated with profits,market-to-book value, and risk—which is broadly consistent withthe pecking order and market timing theories.
Interestingly, our results have identified differences between pub-lic and private banks which influence the access to market. As such,public banks whose capital determinants are more similar to thoseobserved in the case of nonfinancial firms have been those whichhave been more active in funding their assets with subordinated debt(proxy used for market financing), in accordance with the empiricalliterature which compares them with private banks.
In this context, this paper sheds some light on the potential suc-cess of the introduction of additional capital requirements underBasel III, and also how the entrance into force of the EU Directive onBanking Recovery and Resolution (BRRD), which regulates access
198 International Journal of Central Banking September 2021
to equity and debt markets, plays a pivotal role in their success. Thenew resolution regime envisages a “bail-in process”—where share-holders, creditors, and a certain proportion of deposits are calledupon to jointly share any losses with the first- and second-mentionedstakeholders—which implies that banks have to comply with theadditional capital requirements (which are known as MREL), andthat, in turn, they should comply with those equity and/or debtinstruments that have bail-in-able characteristics.
The observed differences between public and private banks inaccessing market financing can result in different levels of implemen-tation of the new resolution regime and the MREL requirementsacross banks. Therefore, according to the results reported in thispaper, public banks are expected to be quicker in complying withthese kinds of requirements than private banks, which are more ableto withstand difficulties in this regard.
In summary, the results presented in this paper represent seri-ous implications from a policy point of view. On the one hand, theresults highlight the potential challenges facing private banks as aconsequence of the implementation of the new resolution regimewhen compared with public banks, due to the fact that the latterare already subject to diversified liabilities and capital ratios, wheresubordinated debt plays an important role. The unlevel playing fieldacross banks in terms of accessing capital and debt markets mightwell undermine the success of this new regime, and in fact ultimatelyresult in negative consequences for financial stability. Furthermore,private banks, which are characterized by a weaker investor base, dueto a lack of, or limited experience in, issuing equity and debt instru-ments, are expected to withstand a higher spread—which in turncould undermine their profitability and also the internal generationof capital. On the other hand, the combination of this new resolutionregime and the requirement to issue bail-in-able debt instrumentscould contribute to increasing the number of banks which are sub-ject to market discipline and align the capital structure determinantsof public and private banks and thus change the capital determinantsof private banks to be more similar to those of public banks.
Despite the weakness demonstrated by market forces which cameto light during the last financial crisis, market discipline is welcomedby regulators, and some strands of the literature recognize thatmarket discipline can augment the role traditionally carried out by
Vol. 17 No. 3 The Determinants of European Banks’ Capital 199
regulatory and supervisory bodies. According to some authors, mar-ket discipline can be beneficial in several ways. First, the marketcan provide information to supervisors regarding the probabil-ity of default by banks (Flannery and Sorescu 1996, Gropp andVesala 2004, Ashcraft 2008, Flannery and Rangan 2008, Distin-guin, Kouassi, and Tarazi 2013, Hoang, Faff, and Haq 2014, andOliveira and Raposo 2019)—which helps supervisors to efficientlyallocate resources. Second, the market can discipline banks directlyby adopting certain covenants regarding debt issues (Ashcraft 2008).Third, this type of discipline can reduce the moral hazard incentiveswhich governmental guarantees create for banks. And finally, mar-ket discipline can improve efficiency and thus create pressure on lessefficient banks to change their modus operandi (Martinez Peria andSchmukler 2001).
References
Allen, F., E. Carletti, and R. Marquez. 2011. “Credit Market Com-petition and Capital Regulation.” Review of Financial Studies24 (4): 983–1018.
Ashcraft, A. B. 2008. “Does the Market Discipline Banks? NewEvidence from Regulatory Capital Mix.” Journal of FinancialIntermediation 17 (4): 543–61.
Barber, B. M., and J. D. Lyon. 1997. “Firm Size, Book-to-MarketRatio, and Security Returns: A Holdout Sample of FinancialFirms.” Journal of Finance 52 (2): 875–83.
Basel Committee on Banking Supervision. 2006. “International Con-vergence of Capital Measurement and Capital Standards: ARevised Framework Comprehensive Version.”
Beaver, W., P. Kettler, and M. Scholes. 1970. “The Associationbetween Market Determined and Accounting Determined RiskMeasures.” Accounting Review 45 (4): 654–82.
Berger, A. N., R. DeYoung, M. J. Flannery, D. Lee, and O. Oztekin.2008. “How Do Large Banking Organizations Manage Their Cap-ital Ratios?” Journal of Financial Services Research 34 (2–3):123–49.
Berger, A. N., R. J. Herring, and G. P. Szego. 1995. “The Roleof Capital in Financial Institutions.” Journal of Banking andFinance 19 (3): 393–430.
200 International Journal of Central Banking September 2021
Blundell, R., and S. Bond. 1998. “Initial Conditions and MomentRestrictions in Dynamic Panel Data Models.” Journal of Econo-metrics 87 (1): 115–43.
Brav, O. 2009. “Access to Capital, Capital Structure, and the Fund-ing of the Firm.” Journal of Finance 64 (1): 263–308.
Brewer Iii, E., G. G. Kaufman, and L. D. Wall. 2008. “Bank Cap-ital Ratios Across Countries: Why Do They Vary?” Journal ofFinancial Services Research 34 (2–3): 177–201.
Bromiley, P. 1991. “Paradox or at Least Variance Found: A Com-ment on Mean-variance Approaches to Risk-Return Relation-ships in Strategy: Paradox Lost.” Management Science 37 (9):1206–10.
Bun, M. J., and F. Windmeijer. 2010. “The Weak Instrument Prob-lem of the System GMM Estimator in Dynamic Panel DataModels.” Econometrics Journal 13 (1): 95–126.
Calomiris, C., and B. Wilson. 2004. “Bank Capital and PortfolioManagement: The 1930s Capital Crunch and the Scramble toShed Risk.” Journal of Business 77 (3): 421–55.
Cerutti, E., R. Correa, E. Fiorentino, and E. Segalla. 2017. “Changesin Prudential Policy Instruments—A New Cross-Country Data-base.” International Journal of Central Banking 13 (1, March):478–503.
Cocris, V., and M. C. Ungureanu. 2007. “Why Are Banks Special?An Approach from the Corporate Governance Perspective.” Sci-entific Annals (Al.I.Cuza University of Iasi, Economic Series):56–66.
De Jonghe, O., and O. Oztekin. 2015. “Bank Capital Management:International Evidence.” Journal of Financial Intermediation 24(2): 154–77.
Distinguin, I., T. Kouassi, and A. Tarazi. 2013. “Interbank Depositsand Market Discipline: Evidence from Central and EasternEurope.” Journal of Comparative Economics 41 (2): 544–60.
Flannery, M. J. 1994. “Debt Maturity and the Deadweight Costof Leverage: Optimally Financing Banking Firms.” AmericanEconomic Review 84 (1): 320–31.
Flannery, M. J., and K. P. Rangan. 2006. “Partial Adjustmenttoward Target Capital Structures.” Journal of Financial Eco-nomics 79 (3): 469–506.
Vol. 17 No. 3 The Determinants of European Banks’ Capital 201
———. 2008. “What Caused the Bank Capital Build-up of the1990s?” Review of Finance 12 (2): 391–429.
Flannery, M. J., and S. M. Sorescu. 1996. “Evidence of Bank Mar-ket Discipline in Subordinated Debenture Yields: 1983–1991.”Journal of Finance 51 (4): 1347–77.
Frank, M. Z., and V. K. Goyal. 2009. “Capital Structure Decisions:Which Factors are Reliably Important?” Financial Management38 (1): 1–37.
Gaiduchevici, G., and D. Zochowski. 2017. “MREL: Financial Stabil-ity Implications.” Macroprudential Bulletin 4 (December): 3–14.
Garcia, J., and M. Rocamora. 2018. “How Prepared are EuropeanBanks to Comply with MREL?” Report, BBVA Research.
Gropp, R., and F. Heider. 2010. “The Determinants of Bank CapitalStructure.” Review of Finance 14 (4): 587–622.
Gropp, R., and J. Vesala. 2004. “Deposit Insurance, Moral Hazardand Market Monitoring.” ECB Working Paper No. 302.
Harding, J. P., X. Liang, and S. L. Ross. 2013. “Bank CapitalRequirements, Capital Structure and Regulation.” Journal ofFinancial Services Research 43 (2): 127–48.
Harris, M., and A. Raviv. 1991. “The Theory of Capital Structure.”Journal of Finance 46 (1): 297–355.
Hoang, K. T., R. Faff, and M. Haq. 2014. “Market Discipline andBank Risk Taking.” Australian Journal of Management 39 (3):327–50.
Jensen, M. C., and W. H. Meckling. 1976. “Theory of the Firm:Managerial Behavior, Agency Costs and Ownership Structure.”Journal of Financial Economics 3 (4): 305–60.
Lemmon, M. L., M. R. Roberts, and J. F. Zender. 2008. “Back tothe Beginning: Persistence and the Cross-section of CorporateCapital Structure.” Journal of Finance 63 (4): 1575–1608.
Martinez Peria, M. S., and S. L. Schmukler. 2001. “Do Deposi-tors Punish Banks for Bad Behavior? Market Discipline, DepositInsurance, and Banking Crises.” Journal of Finance 56 (3):1029–51.
Miles, D., J. Yang, and G. Marcheggiano. 2013. “Optimal BankCapital.” Economic Journal 123 (567): 1–37.
Miller, K. D., and P. Bromiley. 1990. “Strategic Risk and Corpo-rate Performance: An Analysis of Alternative Risk Measures.”Academy of Management Journal 33 (4): 756–79.
202 International Journal of Central Banking September 2021
Modigliani, F., and M. H. Miller. 1958. “The Cost of Capital, Cor-poration Finance and the Theory of Investment.” American Eco-nomic Review 48 (3): 261–97.
Morgan, D. P., and K. J. Stiroh. 2001. “Market Discipline ofBanks: The Asset Test.” Journal of Financial Services Research20 (2–3): 195–208.
Myers, S. C., and N. S. Majluf. 1984. “Corporate Financingand Investment Decisions when Firms Have Information thatInvestors do not Have.” Journal of Financial Economics 13 (2):187–221.
Nickell, S. 1981. “Biases in Dynamic Models with Fixed Effects.”Econometrica 49 (6): 1417–26.
Oliveira, V., and C. Raposo. 2019. “How Did Regulation and MarketDiscipline Influence Banking Distress in Europe? Lessons fromthe Global Financial Crisis.” Studies in Economics and Finance37 (1): 160–98.
Oztekin, O. 2015. “Capital Structure Decisions around the World:Which Factors Are Reliably Important?” Journal of Financialand Quantitative Analysis 50 (3): 301–23.
Oztekin, O., and M. J. Flannery. 2012. “Institutional Determinantsof Capital Structure Adjustment Speeds.” Journal of FinancialEconomics 103 (1): 88–112.
Rajan, R. G., and L. Zingales. 1995. “What Do We Know about Cap-ital Structure? Some Evidence from International Data.” Journalof Finance 50 (5): 1421–60.
Santos, J. A. 2001. “Bank Capital Regulation in ContemporaryBanking Theory: A Review of the Literature.” Financial Mar-kets, Institutions and Instruments 10 (2): 41–84.
Svirydzenka, K. 2016. “Introducing a New Broad-based Index ofFinancial Development.” IMF Working Paper No. 16/5.
Titman, S., and R. Wessels. 1988. “The Determinants of CapitalStructure Choice.” Journal of Finance 43 (1): 1–19.