determinants of financial performance in private banks: a
TRANSCRIPT

Vol. 13(9), pp. 291-308, 14 May, 2019
DOI: 10.5897/AJBM2019.8771
Article Number: 95A3D0560818
ISSN: 1993-8233
Copyright© 2019
Author(s) retain the copyright of this article
http://www.academicjournals.org/AJBM
African Journal of Business Management
Full Length Research Paper
Determinants of financial performance in private banks: A case in Ethiopia
Tewodros Biset Amene1* and Gedion Abayneh Alemu2
1Department of Management, College of Business and Economics, Oda Bultum University, Ethiopia.
2Department of Accounting and Finance, College of Business and Economics, Jigjiga University, Ethiopia.
Received 11 February, 2019; Accepted 4 April, 2019
The objective of this study is to empirically assess the effect of bank-specific and macroeconomic determinants of Ethiopian private commercial banks financial performance using three measures namely, return on assets (ROA), return on equity (ROE) and economic value added (EVA) for the period 2006 to 2015 by using multiple regression on a sample of seven private commercial banks. The results indicated that performance persists to some extent, indicating the existence of relatively fair competitive market in private commercial banking environment. Regarding the explanatory variables from bank-specific determinants, Capital adequacy (CAP has a significant and positive relation with ROA and significant and negative relation with ROE and EVA. In addition, ASQ has a significant and negative relation with ROA and insignificant and negative relation with ROE and EVA. Whereas ME affect bank performance (ROA, ROE and EVA) significantly and negatively. On the other hand, LIQ and BS affect bank performance (ROA, ROE and EVA) significantly and positively. Furthermore, GDP has an outsized positive and significant effect on both ROE and EVA but an insignificant effect on ROA. Therefore, Ethiopian commercial banks policy makers and managers should give high emphasis on CAP, ASQ, ME, LIQ, BS and GDP as these were found to have significant effect on private commercial banks financial performance. Key words: Financial performance, return on assets (ROA), return on equity (ROE) and economic value added (EVA).
INTRODUCTION In any economy there are five basic components of financial environment. These are money, financial markets, financial instruments, rules and regulations. Among the various financial institutions, banks are the most active players and fundamental components in the financial system (Dhanabhakyam and Kavitha, 2012). According to Rashid (2010), a bank is a financial
institution that receives deposits from the public or depositor and gives loans to the deficit units and the borrowers, in the process gaining from the spread of the different interest charged. Concerning the scope of their advantages, banks are very important to economic growth of any economy. Moreover, banks are basic components of the financial system and significant
*Corresponding author. E-mail: [email protected].
Author(s) agree that this article remain permanently open access under the terms of the Creative Commons Attribution
License 4.0 International License
292 Afr. J. Bus. Manage. players in financial markets (Guisse, 2012). According to Brigham and Houston (2009), banks have control over a large part of the supply of money in circulation. Through their influence over the volume of bank money, they can influence nature and character of production in any country. Finance literature indicated banks’ performances get a
great deal of attention, that realizing the sector serve a crucial role in the economy. The performance of a bank is explained in different terms such as profitability, efficiency, competition, concentration and productivity. To resist negative shocks and contribute to the stability of the financial system, banks acquire better performances and better implementation ability (Athanasoglou et al., 2008). In the financial environment, profitability of the banking system has been one of the hot issues. Since, the banking industry play a major role in the financial system of a country and it supports the competitiveness of the financial institution.
In different countries, many researchers have made investigation on this area by considering the importance and the hot issue of profitability in banking sector. Goddard et al. (2004), suggested that among modeled determinants of profitability incorporate, size, capital asset ratio, credit risk and ownership were the major determinants of banks profitability. In addition to the above, Al Karim and Alam (2013), stated that it has been marked that there is a positive relation of economic value added (EVA) with bank size and asset management while negative relation with the operational efficiency and credit risk.
In the case of Sub-Sahara African (SSA) countries banking sector, the profitability of the commercial banking industries are affected by different internal and external factors. Munyambonera (2010) confirms the importance of bank level factors such as assets, operational efficiency, capital adequacy and liquidity, and macroeconomic factors such as growth in GDP and inflation in explaining bank profitability in SSA. He recommended that the findings call for a number of policy interventions in SSA, given the low poor performance in terms of profitability. Low profitability levels reflected lack of competiveness and inefficiency in the SSA banking sector. In addition, policies would probably need to be directed at strengthening supportive information and bank supervision, improving risk management and technology, developing inter-banking relationship, equity markets and securities, and at sustaining macroeconomic stability.
For the past decades, the banking environment in Ethiopia has undergone regulatory and financial reforms like other African countries and the rest of developing world. These reforms have brought about many structural changes in the banking sector of the country and have also encouraged private banks to enter and expand their operations in the industry (Tesfaye, 2014). A study by Amdemikael (2012) on seven commercial banks in Ethiopia, covering the period of 2000-2011 and using a
mixed methods research approach finds out that in the Ethiopian banking industry there was excess liquidity ratio. In contrary to this, the existence of a very serious liquidity problem in the Ethiopian banking industry, particularly in the case of private banks which may result from some regulations imposed by the government like the credit cap and the forced investment on bonds which amounts 27% of their total loan, that is, both these regulations are exercised on private banks only.
A study by Zerayehu et al. (2013) using qualitative, descriptive and econometric techniques have found that in Ethiopia, the financial system is dominated by banking sector even though the sector is relatively underdeveloped, closed and under-banked economy compared to those of other countries in the world. In most cases, commercial bank of Ethiopia is one of the leading banks in Ethiopia and still seizes quasi-monopoly power. The Ethiopian banking industry can be characterized as highly profitable, concentrated and moderately competitive. However, the banking industry in Ethiopia is characterized by operational inefficiency, little and insufficient competition, and perhaps can be distinguished by its market concentration towards the big government owned commercial bank and having undiversified ownership structure.
In light of these facts, a lot of research work has so far taken place concerning the issue of determinants of bank performance. For example, the studies on the determinants of Ethiopian commercial banks profitability (Birhanu, 2012) used a mixed approach, and without including the recently established banks like, lion international bank, cooperative bank of Oromia, Zemen bank and Oromia International bank, have concluded that bank’s capital, liquidity status, bank size and macro-economic variables such real GDP growth rates have significant impact on banks’ profitability. On the other hand, Tesfaye (2014), by adopting a quantitative approach and without including the recently established banks like, Oromia International bank, lion international bank, cooperative bank of Oromia and zemen bank, concluded that bank’s capital, liquidity status, bank size and macro-economic variables such real GDP growth rates have no significant impact on banks’ profitability.
Based on the above discussions, the purpose of this study was to evaluate the determinants of financial performance and to find out the impact of accounting measures (return on assets (ROA), return on equity (ROE) and EVA) of Ethiopian private commercial banks financial performance (EPCBFP) for the period 2006-2015.
REVIEW OF LITERATURE Economic Value Added (EVA) EVA is a financial performance measure that was

developed by Stern Steward to calculate the true economic profit produced by a company. It helps to measure the true profitability of the company by considering the cost of equity (Brigham and Houston, 2009). Traditional financial measures reflect historical performance, which consider only the effects of using the invested capital into affair and not the cost of capital too. Some of the traditional financial measures are ROA, ROE and EPS. Most companies have better financial performances. However, their activities do not generate value but drive to a permanent loss in value. The modern measures are based on the concept ‘to create value’. It can be confirmed theoretically that EVA is superior to other measures of performance because it accounts for the full cost of capital, including the cost of equity (Dumitru and Dumitru, 2009).
The connection between ROE and EVA
According to Brigham and Houston (2009), EVA is different from traditional accounting profit because EVA reflects the cost of equity as well as the cost of debt. Indeed, using the previous example, we could also express EVA as net income minus the dollar cost of equity.
This expression can be rewritten as follows:
The last expression indicates that EVA depends on three factors; rate of return (as reflected in ROE), risk (which affects the cost of equity), and size (which is measured by the equity employed).
Link between EVA and MVA
According to Stewart (1991), EVA comes closer than any other measure to capture the true economic profitability of an enterprise and is the performance measure, which is most directly linked to the shareholder value over time. Whereas MVA is a cumulative measure of corporate performance and that it represents the stock market’s assessment from a particular time onwards of the NPV of all of a company’s past and projected capital projects. EVA can be calculated as follows:
EVA = (ROIC - WACC) x IC
Where: ROIC = return on invested capital WACC = weighted average cost of capital
Amene and Alemu 293 IC = invested apital (at the beginning of the year)
The ROIC minus the WACC is also called the return spread. When the company is generating surplus returns above its cost of capital and this translates into a higher MVA, EVA and related measures attempt to improve on traditional accounting measures of performance by measuring the economic profits of an enterprise. The link between EVA and MVA is that MVA is the present value of all the future EVAs a company is expected to generate, discounted at the WACC.
Measurements of financial performance
The two broad approaches to the measurements of financial performance are the traditional accounting-based profitability measurements and economic-based value measurements of financial performance. Flamini et al. (2009) pointed out that return on assets (ROA) is a measure of bank profitability which reflects the ability of a bank’s management to generate profits from the bank’s assets. ROE reflects how effectively a bank management is using shareholders’ funds. Banks with lower leverage will generally report higher ROA, but lower ROE. A bank’s ROE is affected by its ROA as well as by the bank’s degree of financial leverage. Since returns on assets tend to be lower for financial intermediaries, most banks utilize financial leverage heavily to increase return on equity to a competitive level (Ommeren, 2011). Moreover, Mushtaq et al. (2014) study scrutinizes the impact of bank-specific and macro-economic determinants on Pakistan private commercial banks financial performance. For the financial performance measurement, two different measures are used, which are; accounting based measure (ROE) and value based measure (EVA). Pooled regression is applied on balanced data set. Assets quality (ASQ), capital adequacy ratio (CAR), efficiency (EFF), deposits and assets ratio (TDTA) and operating efficiency (OPEFF) are taken as bank-specific variables. Economic growth (GDP) and inflation (INF) are taken as macro-economic variables. Results of the study showed that CAR and GDP were significant and positively related with both the measures that is, EVA and ROE. Other than these variables, EFF and ASQ are significant and have positive association with EVA. Inflation and TDTA are found insignificant in both models.
In line with previous studies that scrutinized the determinants of commercial banks’ financial performance, this research relied on three measures of commercial banks’ financial performance by using the traditional accounting method (ROA and ROE) and economic measurement method (EVA).
Conceptual framework
This conceptual framework describes the relationship of
EVA = Net Income − [Equity capital x Cost of equity capital
[EVA = Equity capital Net income
Equity capital − Cost of equity capital]
EVA = (Equity capital)(ROE − Cost of equity capital)

294 Afr. J. Bus. Manage. financial performance with bank specific and macro-economic determinants based on the theoretical and empirical perspective. RESEARCH METHODOLOGY Research design This empirical study was based on secondary data that was obtained from published and unpublished reports of financial statements and audited annual financial reports of the selected private commercial banks in Ethiopia, and NBE publications for ten years (2006-2015). Panel method of data analysis has been used due to the advantage that it has, as it helps to study the behavior of each bank over time and across space (Gujarati, 2004). The study employed both descriptive and econometrics techniques. Descriptive statistics was applied for trend analysis and the econometrics method was used to assess the effect of selected internal and external variables on the performance of the banking sector. Model specification The researchers used a multiple linear regression model of ordinary least square (OLS) method. Modeling was based on panel data techniques. Panel data comprises of both time-series and cross-sectional elements. The cross sectional elements were reflected by the different (the seven) EPCBs and the time-series element was reflected by the period of the study (2006-2015). To examine the determinants of the EPCBFP, the random effects model has been used after testing the correlated random effects using Hausman
Test for the validity of the assumptions of the models. The study used the estimated general least squares (EGLS) of a panel regression technique to analyze the impact of bank specific and macroeconomic determinants on EPCBFP. The general model that was estimated has the following linear form, which was adopted from Davydenko (2010).
(1) Where: Πit is the financial performance of bank I at time t, with i =1...N; t = 1...T, α is a constant term, β is coefficient for the respective variables X, Χit are k explanatory variables, superscript n denote both internal and external determinants of performance and εit is the disturbance with vi of the unobserved individual bank-specific effect and uit is the idiosyncratic error or varies over time and entities. The explanatory variables Χit were grouped, according to the above discussion, into bank-specific and macroeconomic variables.
The general specification of model (1) with the Χit separated into these two groups of determinants of financial performance was described as follows:
(2) Where: - The Χit with superscripts J and M denote bank-specific and macroeconomic determinants of financial performance respectively.
The equation that account for individual explanatory variables, which was specified for this particular study, is given as follows:
Where: β1 – β7 are coefficients for the respective explanatory variables, from this β1–β5; represent coefficient of bank specific variables, β6 and β7 represent coefficient of macroeconomic variable. CAP = Capital Adequacy, ASQ = Asset Quality, ME = Management Efficiency, LIQ = Liquidity, BS= Bank Size, GDP = Gross Domestic Product (Economic Growth), INF = Inflation.
The study used three measures to evaluate the determinants of EPCBFP. ROA, ROE, and EVA. Therefore, three econometrical models have been derived as follows:
ROA Model: Return on Assets as dependent variable
(4) ROE Model: Return on Equity as dependent variable
(5)
EVA Model: Economic Value Added as dependent variable
(6)
𝛱it = 𝛼 + 𝛽k𝑋𝑛it + 𝜀it
𝛱it = 𝛼 + 𝛽kj𝑋𝑗
it
𝐽
𝑗 =1
+ 𝛽km𝑋𝑚it
𝑀
𝑚=1
+ 𝜀it
Πit = α + β1 CAP it + β2 ASQ it + β3 ME it + β4 LIQ it + β5 BS it + β6 GDP it + β7 INF it + εit
ROAit = 𝛼 + 𝛽1 𝐶𝐴𝑃 it + 𝛽2 ASQ it + 𝛽3 ME it + 𝛽4 LIQ it + 𝛽5 BS it + 𝛽6 GDP it + 𝛽7 INF it + 𝜀it
ROEit = 𝛼 + 𝛽1 𝐶𝐴𝑃 it + 𝛽2 ASQ it + 𝛽3 ME it + 𝛽4 LIQ it + 𝛽5 BS it + 𝛽6 GDP it + 𝛽7 INF it + 𝜀it
EVAit = 𝛼 + 𝛽1 𝐶𝐴𝑃 it + 𝛽2 ASQ it + 𝛽3 ME it + 𝛽4 LIQ it + 𝛽5 BS it + 𝛽6 GDP it + 𝛽7 INF it + 𝜀it

Amene and Alemu 295
Table 1. Correlated random effects - Hausman test.
Equation: - ROA
Test cross-section and period random effects
Test Summary Chi-Sq. Statistic Chi-Sq. d.f. Prob.
Cross-section random 0.000000 7 1.0000
Period random 0.000000 5 1.0000
Cross-section and period random 0.000000 5 1.0000
Equation: - ROE
Test cross-section and period random effects
Test Summary Chi-Sq. Statistic Chi-Sq. d.f. Prob.
Cross-section random 0.000000 7 1.0000
Period random 0.000000 5 1.0000
Cross-section and period random 0.000000 5 1.0000
Equation: - EVA
Test cross-section and period random effects
Test Summary Chi-Sq. Statistic Chi-Sq. d.f. Prob.
Cross-section random 0.000000 7 1.0000
Period random 0.000000 5 1.0000
Cross-section and period random 0.000000 5 1.0000
Source: Eviews computed result (Null hypothesis: Ho = RE > FE; against Ha = FE > RE).
Davydenko (2010) and Athanasoglo et al. (2005) explained that bank profits indicated a tendency to persist over time, reflecting impediments to market competition, informational symmetry, and sensitivity to macroeconomic shocks. But, in the case of EPCBs profitability determinants, since this area is not well known, the persisting of profit is unknown. The researcher of this study has considered this issue in the empirical result and discussion part.
EMPIRICAL RESULTS AND DISCUSSION Model specification test To test the relationship between the private commercial banks financial performance measures (ROA, ROE and EVA) and the identified determinants, the theoretical model is developed based on the finance theory from the methodological part of this study. The main issue from Equation 1 panel model is that it is not specified whether it is fixed effects or random effects model that is going to be implemented. Thus, there are two general classes of panel data estimation methods that can be employed in empirical research; random effects models and fixed effects models. The focal point that the researchers need to be concerned here is to test whether individual effects are fixed or random. Moreover, this requires a high concern when the researchers employ the panel data approaches. Thus, it is of interest to determine whether the random effects model passes the Hausman test for the random effects being uncorrelated with the explanatory variables.
According to Hausman test, random effects model is appropriate than the fixed effects model (Brooks, 2008). As shown in Table 1, the Hausman test results for each of the three models (ROA, ROE and EVA), the p-value for each of the three models test is highly insignificant and greater than 1% indicating that the fixed effects model is not appropriate and that the random effects specification is to be preferred since the null hypothesis is accepted. As a result, for this study the researchers employed RE rather than FE for all the three models as the random effects model is the appropriate for this study.
Heteroskedasticity test Based on the OLS assumptions, Heteroskedasticity test is the first diagnostic test that was analyzed in this study. This is expressed by Brooks (2008), as var (ut) = σ2 < ∞. It has been assumed thus far that the variance of the errors is constant, σ2. This is known as the assumption of homoscedasticity. If the errors do not have a constant variance, they are said to be heteroskedastic. It is the most popular test of homoscedasticity.
Table 2 indicates that the f-statistic versions of the test statistics gave evidence for the presence of Heteroskedasticity (for ROA, ROE and EVA).The Chi-Square test statistics gave the same conclusion that there is no evidence for the presence of Heteroskedasticity (for ROA) and concludes for the presence of Heteroskedasticity (for ROE and EVA).

296 Afr. J. Bus. Manage.
Table 2. Heteroskedasticity tests: white.
ROA Heteroskedasticity Test: - White
F-statistic 1.834978 Prob. F(35,34) 0.0399**
Obs R-squared 45.76973 Prob. Chi-Square(35) 0.1052
Scaled explained SS 46.17003 Prob. Chi-Square(35) 0.0981*
ROE Heteroskedasticity Test: - White
F-statistic 3.408325 Prob. F(35,34) 0.0003***
Obs R-squared 54.47401 Prob. Chi-Square(35) 0.0190**
Scaled explained SS 55.92664 Prob. Chi-Square(35) 0.0138**
EVA Heteroskedasticity Test: - White
F-statistic 3.876868 Prob. F(35,34) 0.0001***
Obs R-squared 55.97446 Prob. Chi-Square(35) 0.0136**
Scaled explained SS 69.81929 Prob. Chi-Square(35) 0.0004***
Null hypothesis: Ho = there is no Heteroskedasticity; against Ha=there is Heteroskedasticity; *, **, and *** denotes significance level of 10, 5 and 1%, respectively. Source: Eviews computed results.
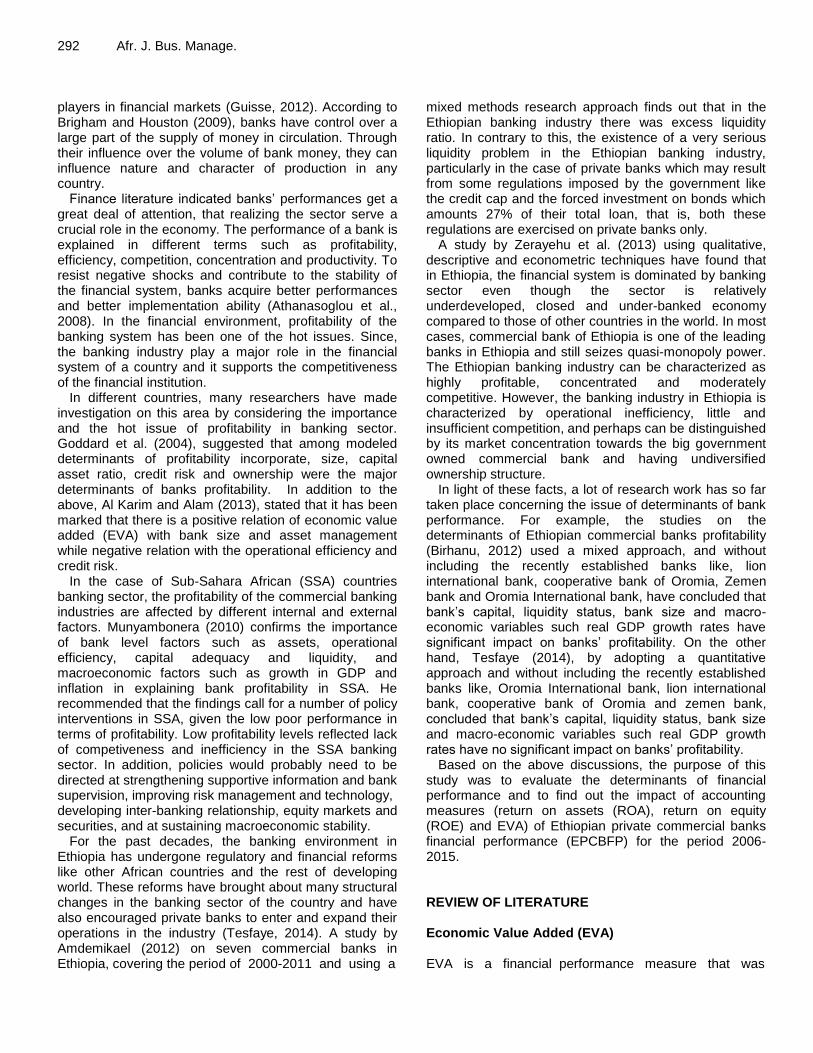
The third version of the test statistic (Scaled explained SS), which as the name indicates is based on a normalized version of the explained sum of squares from the auxiliary regression, gave the same conclusion that there is an evidence for the presence of Heteroskedasticity problem since the p-values are less than 10, 5 and 1% for ROA, ROE and EVA, respectively. Consequently, the above tests have proven that there is a Heteroskedasticity problem, that is, the variance of the errors is not constant in ROA, ROE and EVA models. This has been proved by both χ2 and Scaled explained SS versions rejecting the null hypothesis even at 10% significance level for ROA. The three χ2, Scaled explained SS and F-test versions fail to accept the null hypothesis even at 5% significance level for ROE and EVA models. According to Eviews 8 User’s Guide II (2013), even though there is the presence of Heteroskedasticity in these models, it can be relieved by implementing an OLS estimation type of method that can treat Heteroskedasticity problems in an OLS equation estimation, known as Estimated General Least Squares, EGLS, (the Random Effect model in this case). Autocorrelation test Autocorrelation test is the second vital diagnostic test which was employed in this research. As revealed in Table 3, both the F-statistic and Chi-Square versions of the test statistic provided the same conclusion that there is indication for the presence of a higher order serial correlation in ROA, ROE and EVA models since the p-values are significant at 5% significance level.
According to Gujarati (2004), the existence of a higher order autocorrelation in a given regression model can be
corrected by introducing the first difference of the dependent variable. Similarly, in this research the authors used one period lagged dependent variable to solve the problem of autocorrelation. The result of this study is also consistent with other earlier studies that examined the determinants of commercial banks’ profits. Berger et al. (2000), Athanasoglou et al. (2005), Davydenko (2010) and Birhanu (2012) explained that bank profits show a tendency to persist over time (serial correlation between a given time series and a lagged version of itself over successive time intervals), reflecting impediments to market competition, informational symmetry and sensitivity to macroeconomic shocks. To see this empirical fact, the study adopted a dynamic specification of the model by including a one year lagged dependent
variable (Πit- ) on the right hand side of the previous equation. The equation augmented with lagged dependent variable is:
(7)
Where Πit- is the one-period lagged financial performance and γ is the speed of adjustment to equilibrium. The value of the coefficient of the lagged profitability variable or γ between zero and one implies that performance persists, but they will eventually return to their normal level. The value close to zero means that the industry is competitive, while a value of γ close to one indicates less competitive structure (Athanasoglo et al., 2005). The regression equation of model that includes the lagged dependent variables and all explanatory variables are:
𝛱it = 𝛼 + 𝛾 𝛱it-1 + 𝛽kj𝑋𝑗it
𝐽
𝑗 =1
+ 𝛽km𝑋𝑚it
𝑀
𝑚=1
+ 𝑢it𝜀it
Amene and Alemu 297
Table 3. Autocorrelation tests.
ROA autocorrelation test
Breusch-Godfrey serial correlation LM test:
F-statistic 3.295257 Prob. F(2,60) 0.0439**
Obs R-squared 6.927954 Prob. Chi-Square(2) 0.0313**
ROE autocorrelation test
Breusch-Godfrey serial correlation LM test:
F-statistic 4.223293 Prob. F(2,60) 0.0192**
Obs R-squared 8.638284 Prob. Chi-Square(2) 0.0133**
EVA autocorrelation test
Breusch-Godfrey serial correlation LM test:
F-statistic 4.775111 Prob. F(2,60) 0.0119**
Obs R-squared 9.611983 Prob. Chi-Square(2) 0.0082***
Source: Eviews computed results (Ho = There is no autocorrelation; against, Ha = There is autocorrelation) *, **, and *** denotes significance level of 10, 5 and 1%, respectively.
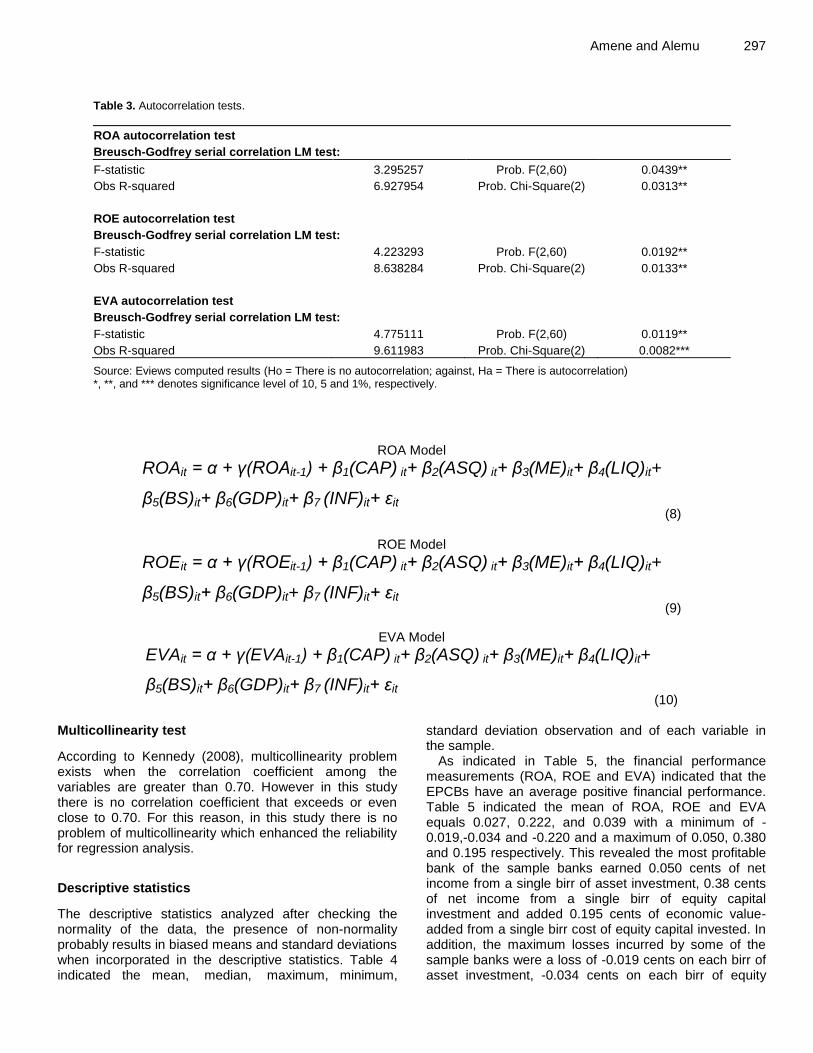
ROA Model
(8)
ROE Model
(9)
EVA Model
(10) Multicollinearity test
According to Kennedy (2008), multicollinearity problem exists when the correlation coefficient among the variables are greater than 0.70. However in this study there is no correlation coefficient that exceeds or even close to 0.70. For this reason, in this study there is no problem of multicollinearity which enhanced the reliability for regression analysis.
Descriptive statistics
The descriptive statistics analyzed after checking the normality of the data, the presence of non-normality probably results in biased means and standard deviations when incorporated in the descriptive statistics. Table 4 indicated the mean, median, maximum, minimum,
standard deviation observation and of each variable in the sample.
As indicated in Table 5, the financial performance measurements (ROA, ROE and EVA) indicated that the EPCBs have an average positive financial performance. Table 5 indicated the mean of ROA, ROE and EVA equals 0.027, 0.222, and 0.039 with a minimum of -0.019,-0.034 and -0.220 and a maximum of 0.050, 0.380 and 0.195 respectively. This revealed the most profitable bank of the sample banks earned 0.050 cents of net income from a single birr of asset investment, 0.38 cents of net income from a single birr of equity capital investment and added 0.195 cents of economic value-added from a single birr cost of equity capital invested. In addition, the maximum losses incurred by some of the sample banks were a loss of -0.019 cents on each birr of asset investment, -0.034 cents on each birr of equity
ROAit = α + γ(ROAit-1) + β1(CAP) it+ β2(ASQ) it+ β3(ME)it+ β4(LIQ)it+
β5(BS)it+ β6(GDP)it+ β7 (INF)it+ εit
ROEit = α + γ(ROEit-1) + β1(CAP) it+ β2(ASQ) it+ β3(ME)it+ β4(LIQ)it+
β5(BS)it+ β6(GDP)it+ β7 (INF)it+ εit
EVAit = α + γ(EVAit-1) + β1(CAP) it+ β2(ASQ) it+ β3(ME)it+ β4(LIQ)it+
β5(BS)it+ β6(GDP)it+ β7 (INF)it+ εit

298 Afr. J. Bus. Manage.
Table 4. Correlation analysis among explanatory variables.
Correlation probability
CAP ASQ ME LIQ BS GDP INF
CAP 1.000000
-
ASQ 0.288835 1.000000
0.0153 -
ME 0.085085 0.055738 1.000000
0.4837 0.6467 -
LIQ -0.065318 0.286658 -0.132672 1.000000
0.5911 0.0161 0.2736 -
BS -0.535529 -0.601054 0.073360 -0.209636 1.000000
0.0000 0.0000 0.5462 0.0815 -
GDP 0.148641 0.399403 -0.245436 0.063610 -0.509637 1.000000
0.2194 0.0006 0.0406 0.6009 0.0000 -
INF -0.008089 0.165761 -0.188249 0.236296 -0.185782 0.295529 1.000000
0.9470 0.1703 0.1186 0.0489 0.1236 0.0130 -
Source: Eviews computed results.
Table 5. Descriptive statistics of variables.
Statistic ROA ROE EVA CAP ASQ ME LIQ BS GDP INF
Mean 0.03 0.22 0.04 0.14 0.05 0.54 0.34 22.5 0.105 17.6
Med 0.03 0.22 0.05 0.12 0.04 0.53 0.33 22.7 0.104 12.1
Max 0.05 0.38 0.19 0.54 0.15 0.74 0.56 23.9 0.118 43.8
Min -0.02 -0.03 -0.22 0.08 0.006 0.34 0.12 19.2 0.088 7.5
Std. 0.01 0.08 0.07 0.06 0.03 0.09 0.11 0.91 0.009 11.7
Obs. 70.00 70.00 70.00 70.0 70.00 70.0 70.0 70.0 70.00 70.0
EVA is not presented in absolute terms of Ethiopian birr rather it has been standardized by means of dividing it by invested capital.
capital investment and -0.220 cents on each birr cost of equity capital invested. That is, the bank’s shareholders actually earned -0.220 cents less than they could have earned elsewhere by investing in other shares with the same risk. In line with Habtamu (2012), Birhanu (2012) and Amdemikael (2012), there is less variation in financial performance revealed by the difference between the mean and median. The seven explanatory variables that are displayed in Table 5, asset quality, capital adequacy, liquidity, managerial efficiency, bank size, GDP and inflation rate, also have different characteristics. Regression This section contained over all the empirical results of the
regressions and discussions undertaken in order to accomplish the research objective that has been stated to determine the impact of the major internal and external factors on financial performance measures of Ethiopian Private commercial banks. Tables 6 to 8 show the random effects regression results for ROA, ROE, and EVA models respectively. While Tables 9 to 11, report the dynamic model regression results for ROA, ROE and EVA models respectively.
As described in the econometric analysis of autocorrelation test section, the researchers mentioned the presence of higher order autocorrelation in the model. This indicates that financial performance of private commercial banks of Ethiopia is not only explained by internal and external determinant factors. Instead, variability in private commercial banks financial
Amene and Alemu 299
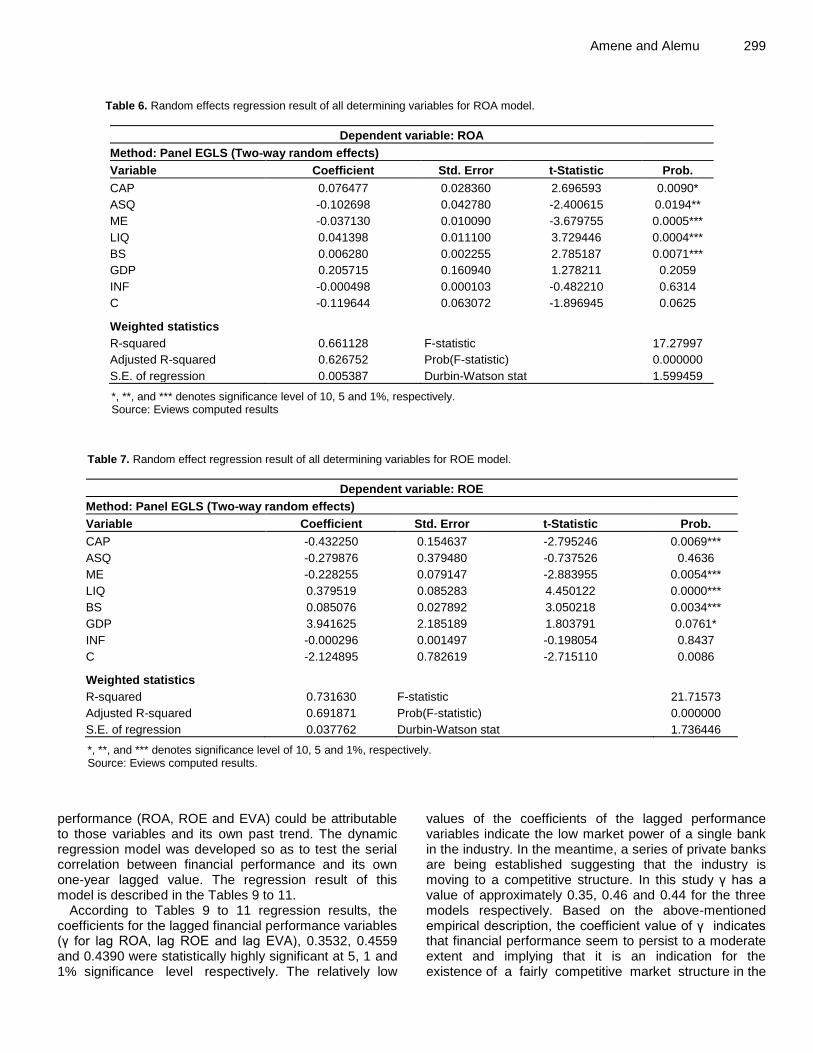
Table 6. Random effects regression result of all determining variables for ROA model.
Dependent variable: ROA
Method: Panel EGLS (Two-way random effects)
Variable Coefficient Std. Error t-Statistic Prob.
CAP 0.076477 0.028360 2.696593 0.0090*
ASQ -0.102698 0.042780 -2.400615 0.0194**
ME -0.037130 0.010090 -3.679755 0.0005***
LIQ 0.041398 0.011100 3.729446 0.0004***
BS 0.006280 0.002255 2.785187 0.0071***
GDP 0.205715 0.160940 1.278211 0.2059
INF -0.000498 0.000103 -0.482210 0.6314
C -0.119644 0.063072 -1.896945 0.0625
Weighted statistics
R-squared 0.661128 F-statistic 17.27997
Adjusted R-squared 0.626752 Prob(F-statistic) 0.000000
S.E. of regression 0.005387 Durbin-Watson stat 1.599459
*, **, and *** denotes significance level of 10, 5 and 1%, respectively. Source: Eviews computed results
Table 7. Random effect regression result of all determining variables for ROE model.
Dependent variable: ROE
Method: Panel EGLS (Two-way random effects)
Variable Coefficient Std. Error t-Statistic Prob.
CAP -0.432250 0.154637 -2.795246 0.0069***
ASQ -0.279876 0.379480 -0.737526 0.4636
ME -0.228255 0.079147 -2.883955 0.0054***
LIQ 0.379519 0.085283 4.450122 0.0000***
BS 0.085076 0.027892 3.050218 0.0034***
GDP 3.941625 2.185189 1.803791 0.0761*
INF -0.000296 0.001497 -0.198054 0.8437
C -2.124895 0.782619 -2.715110 0.0086
Weighted statistics
R-squared 0.731630 F-statistic 21.71573
Adjusted R-squared 0.691871 Prob(F-statistic) 0.000000
S.E. of regression 0.037762 Durbin-Watson stat 1.736446
*, **, and *** denotes significance level of 10, 5 and 1%, respectively. Source: Eviews computed results.
performance (ROA, ROE and EVA) could be attributable to those variables and its own past trend. The dynamic regression model was developed so as to test the serial correlation between financial performance and its own one-year lagged value. The regression result of this model is described in the Tables 9 to 11.
According to Tables 9 to 11 regression results, the coefficients for the lagged financial performance variables (γ for lag ROA, lag ROE and lag EVA), 0.3532, 0.4559 and 0.4390 were statistically highly significant at 5, 1 and 1% significance level respectively. The relatively low
values of the coefficients of the lagged performance variables indicate the low market power of a single bank in the industry. In the meantime, a series of private banks are being established suggesting that the industry is moving to a competitive structure. In this study γ has a value of approximately 0.35, 0.46 and 0.44 for the three models respectively. Based on the above-mentioned empirical description, the coefficient value of γ indicates that financial performance seem to persist to a moderate extent and implying that it is an indication for the existence of a fairly competitive market structure in the

300 Afr. J. Bus. Manage.
Table 8. Random effects regression result of all determining variables for EVA model.
Dependent variable: EVA
Method: Panel EGLS (Two-way random effects)
Variable Coefficient Std. Error t-Statistic Prob.
CAP -0.444019 0.159539 -2.783145 0.0071 ***
ASQ -0.252012 0.375152 -0.671759 0.5042
ME -0.249918 0.087717 -2.849143 0.0059 ***
LIQ 0.383307 0.083695 4.579779 0.0000 ***
BS 0.081018 0.029724 2.725715 0.0083 ***
GDP 3.703256 2.192963 1.688700 0.0963 *
INF -0.000328 0.001465 -0.223649 0.8238
C -2.190411 0.830350 -2.637937 0.0105
Weighted statistics
R-squared 0.706354 F-statistic 21.30553
Adjusted R-squared 0.673201 Prob(F-statistic) 0.000000
S.E. of regression 0.037585 Durbin-Watson stat 1.741499
*, **, and *** denotes significance level of 10, 5 and 1%, respectively. EVA is not presented in absolute terms of Ethiopian birr in fact it has been standardized by dividing to invested capital. Source: Eviews computed results.
Table 9. Dynamic effect regression result of all determining variables for ROA model.
Dependent variable: ROA
Method: Panel least squares
Variable Coefficient Std. Error t-Statistic Prob.
lag ROA 0.353195 0.145010 2.435667 0.0182**
CAP 0.030869 0.012198 2.530743 0.0143**
ASQ -0.073002 0.036427 -2.004081 0.0501**
ME -0.031644 0.011735 -2.696677 0.0093***
LIQ 0.024799 0.008271 2.998165 0.0041***
BS 0.002718 0.001940 1.400950 0.1669
GDP 0.026572 0.095521 0.278182 0.7819
INF -0.000026 0.000057 -0.455899 0.6503
C -0.037662 0.045130 -0.834534 0.4077
R-squared 0.674913 F-statistic 14.01366
Adjusted R-squared 0.622868 Prob(F-statistic) 0.000000
S.E. of regression 0.005603 Durbin-Watson stat 1.921255
*, **, and *** denotes significance level of 10, 5 and 1%, respectively. Source: Eviews computed results.
current Ethiopian private commercial banking sector. Moreover, this makes Ethiopian banks lose their absolute monopoly power on pricing of their services and enjoy the new era of competition. The result of this study is supported by Amdemikael (2012) and Birhanu (2012), that there exists statistically significant persistence of financial performance in Ethiopian commercial banking sector. However, this finding is in contrast with Belayneh (2011), who found that there is no significant evidence for the presence of persistence in financial performance in Ethiopian commercial banks.
The previous Tables 6 to 11 show the empirical results of the estimation of equation model and random effect and
dynamic regression models respectively. Accordingly, the regression result for the three random effect regression tables show the higher explanatory power as well as the higher f-statistic values of the equations. The DW statistic result for the three random effects models ROA, ROE and EVA is 1.60, 1.74, and 1.74 respectively. According to the DW, statistic results do not show autocorrelation that occurred between the variables and their respective lagged value.

Accordingly, considering the validity of the models, a model with the highest adjusted R
2, highest f-statistic
values and consisting of more significant variables was selected as the valid model to explain financial performance. In view of this, each determinant was described and analyzed based on the random effects regression output. The results of the estimations are based on equation model 2 using random effects regression.
Amene and Alemu 301 Random effects regression analysis between ROA and explanatory variables The first regression analysis conducted to examine the relationship between performance measure ROA and explanatory variables was presented in Table 6. The regression model R-squared and adjusted-R squared statistics was 66.11 and 62.67% respectively. The result shows that the changes in the independent variables explain 62.67% of the changes in the dependent variable. The regression estimation equation applied was:
The discussion of the analysis results for the independent variables is presented subsequently. Capital adequacy (CAP): The coefficient of capital adequacy was positive and statistically significant (p-value=0.009). Based on the finding, we can conclude that capital adequacy is one of the main determinants of financial performance ROA of private commercial banks in Ethiopia. The finding was consistent with the result of (Athanasoglou et al., 2008; Pasiouras and Kosmidou, 2007; Trujillo, 2011; Belayneh, 2011). Asset quality (ASQ): The coefficient of asset quality was negative and statistically significant (p-value=0.0194). Based on the finding, we can conclude that ASQ is the main determinant of Ethiopian private commercial banking sector’s profitability. In addition, the finding was consistent with the results of (Athanasoglou et al., 2005; Ommeren, 2011; Flamini et al., 2009; Belayneh, 2011; Birhanu, 2012; Amdemikael, 2012; Habtamu, 2012; Tesfaye, 2014).
Management efficiency (ME): The efficiency of the management regarding expenses relative to income, had statistically significant (p-value=0.0005) relationship with financial performance ROA. This has indicated that minimizing private commercial banks expenses would certainly improve the banks financial performance in general and ROA in particular. This finding is supported by (Sufian and Chong, 2008; Athanasoglou et al., 2008; Sastrosuwito and Suzuki, 2011). Liquidity ratio (LIQ): For this study, liquidity level of banks had positive and significant (p-value=0.0004) relationship with financial performance ROA, witnessing that better financial performance to some extent also stems from liquid assets other than loans and advances. The significant and outsized negative coefficient for the ratio of non-performing loans to total loans and advances (AQ = -0.102698) to affect ROA, also confirms the above argument proving that bank financial performance ROA stems or drops mainly from loans and advances. There
are studies which found out significant and positive relationship such as (Tesfaye, 2014), negative relationship such as (Berger et al., 2000), and even no or insignificant relationship such as (Said and Tumin, 2011). Bank size (BS): The natural logarithm of total asset, which measures the bank size of banks had statistically significant (p-value=0.0071) relationship with financial performance ROA, indicates that any increase in this variable leads to a little increase in financial performance ROA of private banks in Ethiopia. The result indicates that larger banks enjoy better profit than smaller banks in Ethiopia banking sector. The result of this study is supported by Athanasoglou et al (2005) and Ramlall (2009). Gross domestic product (GDP): The impact of the economic growth GDP rate on bank performance ROA is positive. But, it appears an insignificant driver of private commercial banks performance ROA even at 10% significance level. The result is supported by Nassreddine et al. (2013) and Athanasoglou et al (2005). Nevertheless, these authors are consistent to this conclusion, Tesfaye (2014) who studied the situation in Ethiopia fail to reach this conclusion and found that in Ethiopia the impact is zero on commercial banks financial performance ROA. Inflation (INF): The coefficient of inflation was negative. However it was statistically insignificant as explained by the large (p-values = 0.758). This may be because of that, the existence of a lower real interest rate that is obviously lower than the real inflationary rate, resulting in costs increased faster than revenues. The result is consistent with the result found by (Amdemikael, 2012), that the effect of inflation is negative but insignificant on EPCBFP (ROA). Random effects regression analysis between ROE and explanatory variables
The second regression analysis undertaken to investigate
ROA = - 0.119 + 0.076*CAP - 0.1023*ASQ - 0.037*ME + 0.041*LIQ + 0.006*BS + 0.206*GDP -
0.000050*INF

302 Afr. J. Bus. Manage.
Table 10. Dynamic effect regression result of all determining variables for ROE model.
Dependent variable: ROE
Method: Panel least squares
Variable Coefficient Std. Error t-Statistic Prob.
lag ROE 0.455880 0.102395 4.452158 0.0000***
CAP -0.633632 0.162379 -3.902186 0.0003***
ASQ -0.619103 0.423118 -1.463191 0.1492
ME -0.152912 0.042643 -3.585835 0.0007***
LIQ 0.133094 0.052285 2.545538 0.0138**
BS 0.001092 0.018903 0.057762 0.9542
GDP 0.201085 0.760334 0.264470 0.7924
INF -0.000022 0.000579 -0.038083 0.9698
C 0.226305 0.469887 0.481616 0.6320
R-squared 0.710294 F-statistic 18.40181
Adjusted R-squared 0.677585 Prob(F-statistic) 0.000000
S.E. of regression 0.044349 Durbin-Watson stat 2.117878
*, **, and *** denotes significance level of 10, 5 and 1%, respectively. Source: Eviews computed results.
the relationship between performance measure ROE and independent variables was presented in Table 7. The model R-squared and adjusted-R squared statistics were 73.16 and 69.19% respectively. The result revealed that
the changes in the independent variables explain 69.19% of the changes in the dependent variable. The regression estimation equation applied was:
The discussion of the analysis results for the independent variables is presented below. Capital adequacy (CA): Even if the relationship with financial performance as indicated in the a priori expectations will be positive, it is interesting to see the unexpected significant negative and unpredicted moderate coefficient to influence the profit level ROE of private commercial banks. The coefficient of the CA was statistically significant at 1% significance level. This fact revealed that banks with higher profitability ROE would have more advantage in their capital structure, which is in contrary to the findings (positive CA coefficient) of the regression result for ROA. The correlation coefficient for bank size and capital adequacy of -0.535529 (p value=0.0000) indicating bank size is closely related to the capital adequacy of a bank, has also supplemented the above argument that relatively large banks tend to raise less equity capital, and hence it acts in enhanced performance ROE. Furthermore, this negative CA coefficient for ROE, in contrary to ROA, indicated that although using more debt lowers profits and thus the ROA, it does not have the same negative effect on ROE for the reason that debt lowers net income, but it also lowers the bank’s equity, and the equity reduction can offset the lower net income as well. These are the most probable reasons behind the negative relation between
CA and ROE. This finding is consistent with previous study of (Habtamu, 2012) Figure 1. Asset quality (ASQ): The ratio of nonperforming loans to gross loans, which measures how much a bank is not collecting in year relative to its gross loans disbursed, was used to measure the impact of nonperforming loans on EPCBFP (ROE). The negative coefficient of this ratio that was in line with the previous theory for that matter indicated the existence of an inverse relationship between financial performance ROE and asset quality. But, the coefficient of the variable was statistically insignificant, even at 10% significance level. This indicates the insignificant contribution of the ratio of nonperforming loans to gross loans to ROE and that AQ is not the determinant factor of private commercial banks financial performance ROE. In addition, the finding was consistent with the results of (Habtamu, 2012; Tesfaye, 2014; Belayneh, 2011). Management efficiency (ME): The results revealed that the ratio of total expenses to total income is negative and highly significant, at 1% significance level and determinant of EPCBFP (ROE). It is obvious that efficient cost management is essential for improved profitability of banks. This has indicated that minimizing private commercial banks’ expenses would positively improve
ROE = -2.1249 -0.4322*CAP - 0.2799*ASQ - -0.2283*ME + 0.3795*LIQ + 0.0850*BS + 3.9416*GDP -
0.0003*INF
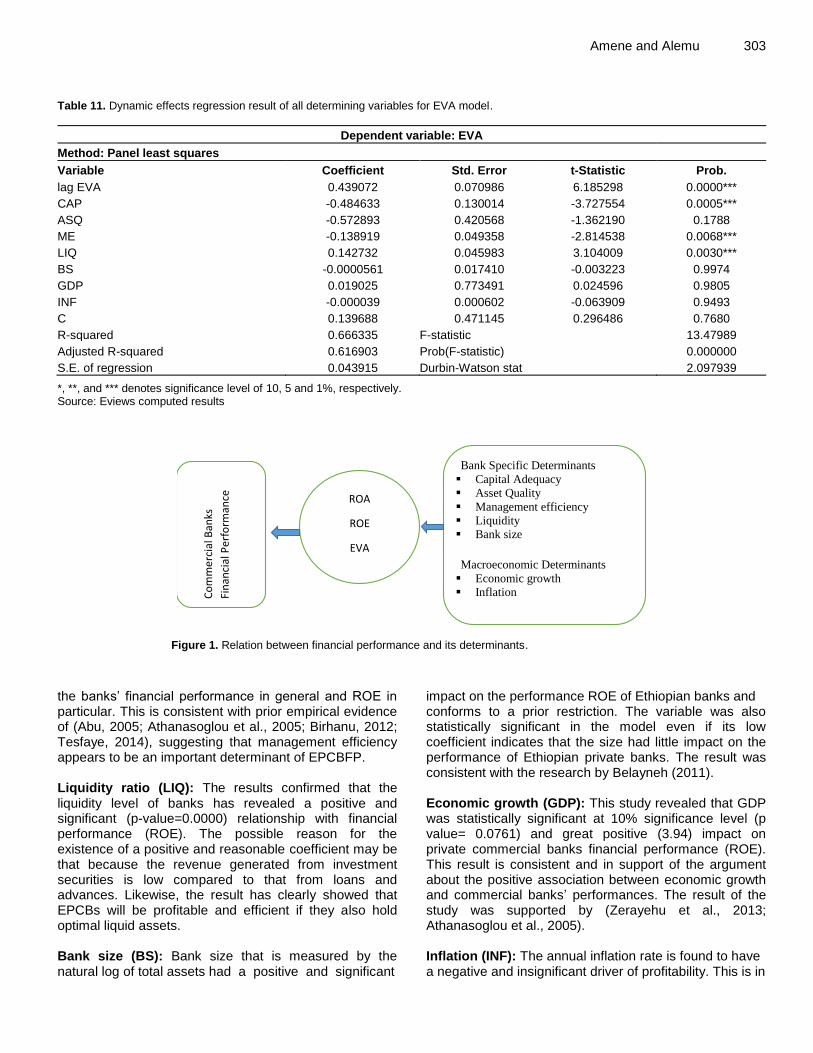
Amene and Alemu 303 Table 11. Dynamic effects regression result of all determining variables for EVA model.
Dependent variable: EVA
Method: Panel least squares
Variable Coefficient Std. Error t-Statistic Prob.
lag EVA 0.439072 0.070986 6.185298 0.0000***
CAP -0.484633 0.130014 -3.727554 0.0005***
ASQ -0.572893 0.420568 -1.362190 0.1788
ME -0.138919 0.049358 -2.814538 0.0068***
LIQ 0.142732 0.045983 3.104009 0.0030***
BS -0.0000561 0.017410 -0.003223 0.9974
GDP 0.019025 0.773491 0.024596 0.9805
INF -0.000039 0.000602 -0.063909 0.9493
C 0.139688 0.471145 0.296486 0.7680
R-squared 0.666335 F-statistic 13.47989
Adjusted R-squared 0.616903 Prob(F-statistic) 0.000000
S.E. of regression 0.043915 Durbin-Watson stat 2.097939
*, **, and *** denotes significance level of 10, 5 and 1%, respectively. Source: Eviews computed results
Figure 1. Relation between financial performance and its determinants.
the banks’ financial performance in general and ROE in particular. This is consistent with prior empirical evidence of (Abu, 2005; Athanasoglou et al., 2005; Birhanu, 2012; Tesfaye, 2014), suggesting that management efficiency appears to be an important determinant of EPCBFP. Liquidity ratio (LIQ): The results confirmed that the liquidity level of banks has revealed a positive and significant (p-value=0.0000) relationship with financial performance (ROE). The possible reason for the existence of a positive and reasonable coefficient may be that because the revenue generated from investment securities is low compared to that from loans and advances. Likewise, the result has clearly showed that EPCBs will be profitable and efficient if they also hold optimal liquid assets. Bank size (BS): Bank size that is measured by the natural log of total assets had a positive and significant
impact on the performance ROE of Ethiopian banks and conforms to a prior restriction. The variable was also statistically significant in the model even if its low coefficient indicates that the size had little impact on the performance of Ethiopian private banks. The result was consistent with the research by Belayneh (2011). Economic growth (GDP): This study revealed that GDP was statistically significant at 10% significance level (p value= 0.0761) and great positive (3.94) impact on private commercial banks financial performance (ROE). This result is consistent and in support of the argument about the positive association between economic growth and commercial banks’ performances. The result of the study was supported by (Zerayehu et al., 2013; Athanasoglou et al., 2005). Inflation (INF): The annual inflation rate is found to have a negative and insignificant driver of profitability. This is in
1.1. Conceptual Framework
This conceptual framework describes the relationship of financial performance with bank specific and
macroeconomic determinants based on the theoretical and empirical perspective.
Co
mm
erci
al B
anks
Fin
anci
al P
erfo
rman
ce
ROA
ROE
EVA
Bank Specific Determinants
Capital Adequacy
Asset Quality
Management efficiency
Liquidity
Bank size
Macroeconomic Determinants
Economic growth
Inflation

304 Afr. J. Bus. Manage. line with the expected result as banks in Ethiopia do not seem to be influenced by the change in real interest rate as the variation in interest rate in both the asset and liability side is constant and usually has fixed nature. Hence, as the collected data shows, currently despite a high inflation rate that existed in the country the amount of deposits made by customers is increasing from time to time. As a result, the result of both the regression and the data clearly reveals as EPCBFP is not influenced by inflation. The result of the study supports the previous research by (Tesfaye, 2014).
Random effects regression analysis between EVA and explanatory variables
The third regression analysis undertaken to examine the relationship between performance measure EVA and independent variables was presented in table 8. From Table 8, the R-squared and the adjusted-R squared statistics of the model were 70.63% and 67.32% respectively. This means the changes in the independent variables explain 67.32% of the changes in the dependent variable. The regression Estimation Equation applied was:
The discussion of the analysis results for the independent variables is presented below. Capital adequacy (CA): The coefficient of the CA is negative and it was significant determinant of financial performance EVA at 1% significance level. The possible suggestion for the significant negative relation of CA ratio with financial performance EVA may be that when banks acquire assets, they must find capital from other banks or other sources, and capital is expensive. Thus, if banks have too much equity capital, their cost of equity capital will be too high, which will depress their profits (ROE). This in turn depresses their economic value added to their shareholders EVA. This finding was in contrast with previous studies of (Mushtaq et al., 2014; Al Karim and Alam, 2013). Asset quality (ASQ): literatures support that increased exposure to asset quality is basically connected with decreased commercial banks financial performance (EVA). Consistent with those literatures, this study also found a negative coefficient for this ratio which was in line with the prior anticipation and theory for that matter indicated the existence of an inverse relationship between financial performance (EVA) and nonperforming loans to gross loans ratio. But, the coefficient of the variable was statistically insignificant, even at 10% significance level. This indicates the insignificant contribution of AQ to EVA. In addition, the finding was consistent with the findings of (Dang, 2011). Management efficiency (ME): The ratio of total operating expenses to total operating income, which is a proxy measure of management efficiency regarding controllable expenses, has a negative and strong significant, at 1% significance level, relationship with financial performance (EVA). The result was consistent with the findings of (Al Karim and Alam, 2013; Abu,2005; Athanasoglou et al., 2005). Liquidity (LIQ): Concerning the liquid assets to deposit
ratio, which measures the liquidity level of banks has a positive and statistically significant (p-value=0.0004) relationship with financial performance EVA. The regression results in this research imply that liquid banks have higher financial performance EVA. This finding was supported by (Ongore, 2011; Olweny and Shipho, 2011).
Bank size (BS): Concerning bank size, this research has found a positive and significant at 10% significance level relationship between banks’ financial performance EVA and size of the banking. This finding was supported by (Nassreddine et al., 2013; Mushtaq et al., 2014), who found size has positively related to financial performance EVA.
Gross domestic product: As expected, EPCBFP (EVA) was positively associated to the GDP growth. The growth of GDP has statistically significant (p value =0.0963) relationship with financial performance (EVA). The parameter, 3.70 of GDP in the random effects panel regression model, indicated that the business cycle was a quite substantial factor of private commercial banks’ financial performance (EVA) in Ethiopia as far as the Ethiopian banks profitability shows a parallel increase as the economy grows up. This finding was supported by (Zerayehu et al., 2013).
Inflation (INF): Concerning inflation this research has found a negative but statistically insignificant coefficient of inflation pointing the effect of inflation on EPCBFP (EVA) is insignificant. The finding of this study is consistent with (Mushtaq et al., 2014; Nassreddine et al., 2013), who have concluded that inflation has an insignificant negative impact on financial performance (EVA).
Impact of accounting performance measures ROA and ROE on EVA
The regression analysis undertaken to investigate the impact of accounting performance measures ROA and
EVA = -2.190411 - 0.444019*CAP - 0.252012*ASQ - 0.249918*ME + 0.383307*LIQ + 0.081018*BS+
3.703256*GDP - 0.000328*INFLATION

Amene and Alemu 305
Table 12. Random effects regression of ROA and ROE on EVA.
Dependent variable: EVA
Method: Panel EGLS (Two-way random effects)
Variable Coefficient Std. Error t-Statistic Prob.
ROA 0.001514 0.000595 2.544607 0.0133**
ROE 0.999862 0.0000727 13753.61 0.0000***
C -0.183245 0.007542 -24.29605 0.0000
Weighted statistics
R-squared 1.000000 Mean dependent var 1.25E-05
Adjusted R-squared 1.000000 S.D. dependent var 0.071319
S.E. of regression 2.85E-05 Sum squared resid 5.44E-08
F-statistic 2.16E+08 Durbin-Watson stat 2.050055
Prob(F-statistic) 0.000000
*, **, and *** denotes significance level of 10, 5 and 1%, respectively. Source: Eviews calculated output
ROE on value performance measures EVA was presented in Table 12. From the table, the R-squared and the adjusted-R squared statistics of the model was 100.0000% and 100.0000% respectively. The result shows that the changes in the independent variables, ROA and ROE, explain 100.0000% of the changes in the dependent variable EVA. That is, net income to total assets and net income to equity ratio collectively explain 100.0000% of the changes in EVA. Thus, these variables collectively, are supposed to be the very valuable variables to explain the performance EVA of private commercial banks in Ethiopia.
As it was depicted in the regression output, ROA has a coefficient of 0.001514 that is significant at a 5% significance level (p-value=0.0133). This indicated that ROA has a very small positive contribution for a unit change in EVA. On the other hand, the coefficient value for ROE was a significant 0.999862 at 1% significance level (Pvalue= 0.0000). This implied that ROE has a great responsibility for change of EVA. From these results, one can conclude that ROE is strongly related with EVA. This finding is supported by (Kosalathevi, 2013), that EVA has a significant relationship with ROE.
Correlation analysis between EVA and the accounting measures ROA and ROE
The other analytical method that was employed to use in order to evaluate the level of relation between the accounting measures (ROA and ROE) and the value measure EVA was the correlation analysis. Based on this the correlation matrix for the three measures is presented in Table 13. According to the output results, the value of correlation, t-statistic and probability between ROA and EVA was 0.82846, 12.19839, and 0.0000 respectively. On the other hand, the value of Correlation, t-Statistic
and probability between ROE and EVA was 0.948493, 24.68906, and 0.0000 respectively. From these results, a conclusion has been made that there was a strong significant correlation between the accounting-based measure ROE and the value-based measure EVA, as the coefficient of correlation and f-statistic value were larger than that of ROA and EVA. The result of this research was consistent with the findings made by Haddad (2012) and Kosalathevi (2013), stating that besides EVA has impact on financial performance ROE, EVA is highly focused by the equity base. Due to that, ROE is highly influenced by the EVA but not by ROA.
Conclusion The main objective of this study was to assess the effect of bank-specific and macroeconomic determinants on Ethiopian private commercial banking industry’s financial performance and the emphasis was to find out the impact of economic value added on traditional based measures (ROA and ROE) for the period 2006-2015 of financial performance. The major findings of the study results from econometrics analysis of empirical data are presented in Table 13.
According to the dynamic regression results, the empirical data pointed out that the coefficient of lagged variables, (γ) for lag ROA, lag ROE and lag EVA were statistically highly significant. Thus, pointing out the existence of performance to persist to a moderate extent in EPCBs and are indicators for the presence of fairly competitive market structure in the current Ethiopian private commercial banking sectors. According to the random effects regression results in relation to ROA, all explanatory variables have similar relations in agreement with the hypothesis as they were expected with return on asset. As a result, capital

306 Afr. J. Bus. Manage.
Table 13. Correlation matrix for ROA, ROE and EVA.
Correlation analysis: Ordinary
Correlation
t-Statistic
Probability EVA ROA ROE
EVA
1.000000
-
-
ROA
0.828461 1.000000
12.19839 -
0.0000*** -
ROE
0.948493 0.771115 1.000000
24.68906 9.987146 -
0.0000*** 0.0000*** -
*, **, and *** denotes significance level of 10, 5 and 1%, respectively. Source: Eviews computed results.
adequacy, bank size and liquidity have significant positive impact on the financial performance ROA of private commercial banks. But, asset quality and managerial efficiency have significant negative impact on ROA of private commercial banks. However, both the macroeconomic determinants, GDP growth rate and inflation rate have insignificant impact on ROA.
Regarding ROE as a financial performance measure for the study, capital adequacy and managerial efficiency have a negative significant impact on return on equity. Bank size and liquidity have a positive significant impact on return on equity. Level of GDP also has a positive significant impact on ROE. On the other hand, the regression analysis result indicated that capital adequacy have a negative relationship with return on equity. However, there is negative relationship between capital adequacy and return on equity showing that it is significant. This means that the more capital adequacy the bank, the lower the financial performance, ROE. However, asset quality and inflation rate have insignificant impact on the financial performance, ROE, of private commercial banks.
Concerning EVA, similar to ROE, the explanatory variables like capital adequacy and managerial efficiency have a negative and statistically significant impact on economic value added (EVA). Liquidity and bank size have a positive and statistically significant relationship with EVA. GDP also has a positive and statistically significant impact on EVA. Against the hypothesis, the regression analysis result indicated that capital adequacy has a negative relationship with EVA. Though, there is negative relationship between economic value added and capital adequacy, it is significant, which means the more capital adequacy the bank, the lower the financial performance, EVA. However, asset quality and inflation rate, have insignificant impact on the financial performance (EVA), of private commercial banks. The
findings of the research have also showed that the accounting-based measure of financial performance ROE has more impact on the value-based measure of financial performance (EVA) as compared to the accounting-based measure of financial performance ROA.
Furthermore, it has also been found that the accounting-based measure of financial performance ROE outperforms the other two of financial performance measures ROA & EVA, and it was placed the best over the two performance measures that were used in this study. Next to ROE, notching very close to ROE in adjusted R
2, f-statistic value, and number of significant
regressors, EVA has put itself at the second-best position over ROA, which was found to be ordered on the third position. However, even if EVA was very close to ROE, it could have been EVA to be regarded as the best one, if there were a stock market in Ethiopia. Hence the data used for this particular research was an estimated one based on some historical data. This indicates the need for further research of the area in Ethiopia. Recommendation According to the random effects regression results for the three financial performance measures, the positive and highly significant relationship of CA with ROA indicated that using more debt (external financing) lowers performance, ROA. Therefore, Ethiopian private commercial banks need to determine the optimum level of capital adequacy ratio that can enable them achieve their long-term strategy and short-term objectives with reference to the required capital position. Private commercial banks need to develop their credit risk (non-performing loan) management capacity. Beside the existing single borrower loan limit directive, the policy makers need to consider improving poor enforcement of

creditor rights and obligations (if there is), and strengthening the legal environment of the business.
Private commercial banks should engage themselves in cost control activities like presenting more technology based banking services and utilizing operating, administrative and personnel expenses efficiently. But, the private banks should properly manage the utilization of employees through fair employment practices not only to sustain the efficiency and productivity of employees but also to improve the bank’s performance.
Liquidity risk has significant effect on private commercial banks performance in Ethiopia. This implies the existence of extra liquidity permits banks to diversify their income via engaging themselves in nontraditional banking services like foreign operations and short-term investments. Hence, banks should invert their attention towards maintaining the proper mix between nontraditional banking services and their loan exposures. The impact of bank size on profitability is always positive because it makes large banks capable of providing extended banking service for large number of customers. As a result, private commercial banks will be able to make better performance by opening more and more number of branches and expanding their operations in an effective and efficient manner. Direction of further research
The study sought to examine the factors that affect performance of private commercial banks in Ethiopia. But, the variables used in this study did not contain all factors that can influence performance of private commercial banks in Ethiopia. Therefore, future research could incorporate other factors such as government regulation, bond-purchasing principle imposed on the banks by the government, ownership, and exchange rates. CONFLICT OF INTERESTS The authors have not declared any conflict of interests. REFERENCES Abu U (2005). Determinants of bank profitability: company-level
evidence from Nigeria. University of Nigeria, Departement of Accounting & Finance. Enugu: Unpublished Master’s thesis.
Al Karim R, Alam A (2013). An evaluation of financial performance of private commercial banks in Bangladesh: Ratio analysis. Journal of Business Studies Quarterly 5(2):65.
Amdemikael A (2012). Factors affecting profitability: an empirical study on Ethiopian banking industry. Addis Ababa University, Department of Accounting and Finance. Addis Ababa: Unpublished Master’s thesis.
Athanasoglou PP, Brissimis SN, Delis MD (2008). Bank-Specific, Industry-Specific and Macroeconomic Determinants of Bank Profitability. Journal of International Financial Markets Institutions and Money 18(2):121-136.
Amene and Alemu 307 Athanasoglou PP, Brissimis SN, Delis MD (2005). Bank-specific.
Industry-Specific and Macroeconomic Determinants of Bank Profitability.
Belayneh HD (2011). Determinants of commercial banks profitability: an empirical study on Ethiopian commercial banks. Addis Ababa University, Department of Accounting and Finance. Addis Ababa: Unpublished Master’s Thesis.
Berger AN, Bonime SD, Covitz DM, Hancock D (2000). Why are bank profits so persistent? The roles of product market competition, informational opacity, and regional/macroeconomic shocks. Journal of Banking and Finance 24:1203-1235.
Birhanu TA (2012). Determinants of commercial banks profitability: an empirical evidence from the commercial banks of Ethiopia. Addis Ababa University, Department of Accounting and Finance. Addis Ababa: unpublished master’s thesis.
Brigham EF, Houston JF (2009). Fundamentals of financial management. (12th Ed.).Mason, USA: Cengage Learning.
Brooks C (2008). Introductory Econometrics for Finance. (2nd Ed). New York: Cambridge University Press.
Dang U (2011). The CAMEL rating system in banking supervision: A case study of Arcada. University of Arcada, Department of International Business. Unpublished master’s thesis.
Davydenko A (2010). Determinants of Bank Profitability in Ukraine. Undergraduate Economic Review 7(1):9-18.
Dhanabhakyam M, Kavitha M (2012). Financial Performance of selected Public sector banks in India. International Journal of Multidisciplinary Research 2(1):255- 269.
Dumitru AP, Dumitru CE (2009). EVA Versus Traditional Accounting Measures of Performance as Drivers of Shareholder Value – A Comparative Analysis. Romanian-American University.
Eviews 8 (20 3). Eviews 8 user’s guide II. United States. IHS Global Inc.
Flamini V, Schumacher ML, McDonald MC (2009). The determinants of commercial bank profitability in Sub-Saharan Africa (No. 9-15). International Monetary Fund Working Paper pp. 1-30.
Goddard J, Molyneux P, Wilson SJ (2004). The profitability of European Banks:a cross-sectional and dynamic panel analysis. The Manchester School 72(3):363-381.
Guisse ML (2012). Financial performance of the Malaysian banking industry: Domestic vs foreign banks. Doctoral dissertation, Eastern Mediterranean University (EMU).
Gujarati ND (2004). Basic econometrics. (4th ed). United States. Boston. McGraw−Hill.
Habtamu NA (2012). Determinants of bank profitability: An empirical study on Ethiopian private commercial banks. Addis Ababa University, Departement of Accounting and Finance. Addis Ababa: unpublished Master’s thesis.
Haddad FS (2012). The relationship between economic value added and stock returns: evidence from Jordanian banks. International Research Journal of Finance and Economics 89(1):6-14.
Ramlall I (2009). Bank-specific, industry-specific and macroeconomic determinants of profitability in Taiwanese banking system: under panel data estimation. International Research Journal of Finance and Economics 34(34):160-167.
Kennedy P (2008). Guide to econometrics. (6th ed). Malden: Blackwell Publishing.
Kosalathevi T (2013). Impact of Economic Value Added on Financial Performance: Special Reference to Selected Private Banks in Sri Lanka. Available at: https://s3.amazonaws.com/academia.edu.documents/32788790/Impact_of_Economic_Value_Added_on_Financial_Performance.pdf?AWSAccessKeyId=AKIAIWOWYYGZ2Y53UL3A&Expires=1555590793&Signature=kE1m7LJ3XlfavkmoMS9Ou5BNySE%3D&response-content-disposition=inline%3B%20filename%3DIISTE_International_Journals_2013_Decemb.pdf
Munyambonera EF (20 0). Determinants of commercial banks’ profitability in Sub-Saharan Africa. Unpublished master’s thesis.
Mushtaq M, Naveed U, Muhammad SY, Muhammad MH (2014). Determinants of commercial banks performance: Empirical evidence from Pakistan. Journal of Applied Environmental and Biological sciences 4(7):15-21.

308 Afr. J. Bus. Manage. Nassreddine G, Fatma S, Anis J (2013). Determinants of banks
performance: viewing test by cognitive mapping technique a case of Biat. International Review of Management and Business Research 2(1):20-49.
Olweny T, Shipo MT (2011). Effects of banking sectoral factors on the profitability of commercial banks in Kenya. Economics and Finance Review 1(5):1-30.
Ommeren S (2011). An examination of the Determinants of Banks’ Profitability in the European Banking sector. Erasmus University, departments of Finance. Rotterdam: Unpublished Master’s thesis.
Ongore VO (2011). The relationship between ownership structure and firm performance: an empirical analysis of listed companies in Kenya. African Journal of Business Management 5(6):67-84.
Pasiouras F, Kosmidou K (2007). Factors influencing the profitability of domestic and foreign commercial banks in the European Union. Research in International Business and Finance 21(2):222-237.
Rashid M (2010). Banking Sector Challenges in Bangladesh. The Daily Star.
Said R, Tumin M (2011). Performance and financial ratios of commercial banks in Malaysia and China. International Review of Business Research Papers 7(2):157-169.
Sastrosuwito S, Suzuki Y (2011). Post crisis Indonesian banking system profitability: bank-specific, industry-specific, and macroeconomic determinants. Paper presented at the 2nd international research symposium in service management Yogyakarta, Indonesia pp. 26-30.
Stewart G (1991). The quest for value: the EVATM Management Guide.
New York: Harper Business. Sufian F, Chong RR (2008). Determinant of bank profitability in a
developing economy: empirical evidence from the Philippines. Asian Academy of Management. Journal of Accounting and Finance 4(2):91-112.
Tesfaye BL (2014). The determinants of Ethiopian commercial banks performance. European Journal of Business and Management 6(14):52-62.
Trujillo PA (2011). What determines the profitability of banks? Evidence from Spain. Pablo de Olavide University. Working papers.
Zerayehu SE, Kagnew WT, Teshome KA (2013). Competition in Ethiopian banking industry. African Journal of Economics 1(5):176-190.