an investigation of the determinants of banks’ net...
TRANSCRIPT
1
Working Paper
An Investigation of the Determinants of Banks’ Net Interest
Margins in Jamaica
Stephanie Umraugh
Research and Economic Programming Division
Bank of Jamaica
July 2015
Abstract
The aim of this study is to determine the firm- specific and macroeconomic
determinants of net interest margins (NIM) in Jamaica. A generalized method of
moments (GMM) technique was applied to a panel of 11 Jamaican financial
institutions using quarterly data over the period 2002:1 to 2014:4. The results show
that foreign bank participation and operating costs were the most significant reasons
for the relatively high NIMs in Jamaica. Liquidity, credit and funding risks and the
change in the size of the financial institutions were inversely related with the NIM.
In regards to macroeconomic variables, NIM displayed a negative relationship with
the exchange rate volatility. Overall, these results indicate that structural changes
to improve the operational efficiency as well competition need to occur to reduce
the NIM over the long- run in Jamaica.
JEL Classification numbers: E43;E44; G21; C23
Keywords: Banks’ interest margins; Financial institutions; Panel data estimation.
Stephanie Umraugh is a graduate student in the Depart of Economics, U.W.I, Mona Campus, Kingston,
Jamaica. This paper was written while Stephanie served as an intern in the Monetary Analysis and
Programming Department at Bank of Jamaica under supervision of Mr. André Murray. The views and results
expressed in this paper represent those of the authors and not necessarily those of the Bank of Jamaica.

2

3
Table of Contents
1.0 Introduction 4
2. Literature Review 5
3. Data and Methodology 8
3.1 Data 8
3.1.1 Stylized Facts 12
3.2 Methodology 13
3.2.1 Incorporating Risks 15
3.2.2 Other Considerations 15
4. Empirical Results 17
5. Conclusions and Policy Implications 20
References 22
Appendices 24
4
1.0 Introduction
The efficiency of the financial sector has always been topical given the perception that an
inefficient financial sector is inimical to the economic growth prospects of a country. So the
question debated in recent years particularly for Jamaica is ‘why are interest rate margins so high?’
In that regard, there are several theoretical and empirical studies published on the determinants of
banks’ net interest margin (NIM). Many of these studies have shown that banks’ efficiency are not
only influenced by firm-specific factors but also by macroeconomic factors.
Typically, interest margins are studied using the difference of the average banks’ lending rate and
the average banks’ deposit rate. However, this paper approaches the question from the NIM, which
is defined as the difference between a bank’s interest income and expenses as a percentage of
interest earning assets. Understanding the reasons for the level of NIM is an important policy, as
it indicates how efficiently financial institutions perform their intermediation role of savings
utilization and allocation. The inefficiencies in intermediation may emerge from structural
problems: high operating costs, scale diseconomies due to small market size, lack of adequate
competition.
The purpose of this study is to provide an econometric account of some of the main determinants
of the NIM in Jamaica. The paper uses stacked quarterly data of financial institutions operating in
Jamaica over the period of 2002 to 2014. To accomplish this objective, a modified version of the
cost function model by (Klein, 1971) and (Monti, 1972) is estimated, adjusting for missing data
and shocks within the economy. This empirical analysis is the first step towards a serious and
informed policy discussion on feasible options to lower margins. Previous work done focused on
high operational costs as the most relevant factor in determining NIM. Additionally, (Claeys &
Vander Vennet, 2008) argue that developing countries have greater NIMs due to low efficiency
and low degree of market competition.
5
The results of the study show that NIMs in Jamaica are relatively high to other developing
countries such as Honduras and that the main determinants of the NIMs are operating costs,
foreign- owned as well the debt re-profiling program, JDX. Given these results, the monetary
authority should focus on ways to reduce high operating costs, monitoring foreign bank
participation as they were found to have the most influence on the NIM as well as increase market
competition within the financial sector.
The remainder of the paper is divided into 4 sections. In section 2, the paper will look at the relevant
literature. Section 3 describes the method, variables and the data used. Section 4 examines the
empirical results, diagnostic tests, the model specification as well as the analysis of the regressors.
Finally, section 5 has the main conclusions and policy recommendations.
2. Literature Review
Starting with the seminal paper by (Ho & Saunders, 1981), it was found that positive interest
margins will always exist due to transaction uncertainty faced by a bank using the dealership
model. They highlighted that the four main factors contributing to the margins were: (i) the degree
of managerial risk, (ii) the average size of transactions undertaken by the bank, (iii) bank- market
structure and (iv) the adjustment cost of interest rates. This study paved the way for further studies
as it relates to both theoretical and empirical models by providing useful financial management
tools for banks to combat increased uncertainties over the future course of interest rates.
Subsequently, the theoretical model by (Ho & Saunders, 1981) has been expanded by other authors
such as (Demirguc-Kunt & Huizinga, 1999); (Moore & Craigwell, 2002); (Brock & Franken, Bank
interest margins meet interest rate spreads: how good is balance sheet data for analyzing the cost
the cost of financial intermediation?, 2002); (Maudos & Solis, 2009); among others. (Demirguc-
Kunt & Huizinga, 1999), suggests that bank interest spreads can be interpreted as an indicator of
the efficiency of the banking system. Although the NIM signals efficiency or inefficiency, the
results suggest that it is not always certain that a reduction in NIMs imply improved bank
6
efficiency. For instance, a reduction in NIM can reflect a reduction in bank taxation or a higher
loan default rate. While the first case depicts an improved financial market function, the second
case says the opposite. They also noted that variations in the accounting NIM may reflect
differences in the interest expenditure (the numerator) and the average earning assets (the
denominator). The paper showed that differences in interest margins as well as bank profitability
were reflected by a variety of determinants: bank characteristics, macroeconomic conditions, bank
taxation, deposit insurance guidelines, financial structure as well as legal and institutional
indicators. The regression analysis suggests that a larger bank asset to GDP ratio and a lower
market concentration ratio lead to lower margins as well as profits. This coincides with (Moore &
Craigwell, 2002) who suggest that these bank-specific factors are significant to the banks’ NIM.
However, (Brock & Franken, 2002) noted that interest rate spreads are highly dependent on
industry level as well as macroeconomic factors therefore bank- specific factors would be more
relevant to other variables such as bank profitability. They also cautioned against using NIM as a
proxy for interest rate spread as misinterpretation of the interest rate spreads are likely.
(Chirwa & Mlachica, 2004) tested the claims of typically high spreads in developing countries,
highlighting that high spreads (as proxied by NIMs) will persist if the financial sector does not
alter the structure in which banks operate. Evidence from this paper suggests that the interest rate
spread may rise as a result of poorly-developed banking sectors as well as inefficiencies of the
legal system and high corruption.
(Maudos & Solis, 2009) analysed the determinants of net interest income in Mexico for the period
1993-2005 simultaneously including operating costs, diversification and specialization as the
determinants of the margins. Two methodologies were applied: a dynamic system GMM model
and a panel data fixed effects static model. The results suggested that average operating costs and
the Lerner Index, which measures the market power and also accounts for the market competition
in the banking industry are positively linked to high interest income in Mexico. In addition, they
recommended that policy- oriented measures should be directed at increasing banking competition,
promoting efficiency in the industry and supporting stable economic conditions.
7
(Horvath, 2009) analysed the determinants of interest rate margins in Czech Republic for the
period 2000-2006. He followed the dealership model first employed by (Ho & Saunders, 1981)
using market structure, interest rate volatility, implicit payment, opportunity cost of reserves and
capital requirements as the determinants. His main findings showed that bank market structure,
interest rate volatility and bank capitalization are important determinants of banks’ NIM.
In recent years, the ownership structure of banks has also been explored in relation to interest rate
margins. (Hamadi & Awdeh, 2012) highlighted that the interest rate margins are different between
domestic and foreign banks. For domestic banks, the bank size, liquidity efficiency, capitalization,
credit risk, concentration as well as economic growth affected the interest margins negatively. On
the other hand, macroeconomic conditions, industry factors, the central bank discount rate as well
as the interbank rate have a much weaker impact on foreign bank interest margins. (Demirguc-
Kunt & Huizinga, 1999) also implies that foreign-owned banks play a vital role in developing
countries as they outperform domestic banks. Foreign ownership in developing countries was
associated with higher NIMs and bank profitability.
The paper by (Nassar, Martinez, & Pineda, 2014), analysed the determinants of banks’ NIM in
Honduras during 1998- 2013. During this period the banks displayed rising NIM, there was foreign
bank participation as well as consolidation. The competition among banks led to higher
concentration and positively affected foreign banks’ NIM. In addition to the bank specific
determinant, inflation was an important determinant of high interest rate margins. Therefore, they
conclude that further structural reforms and consolidation may reduce banks’ NIMs. The current
research on Jamaica’s deposit taking sector will adopt a similar approach to the (Nassar, Martinez,
& Pineda, 2014) paper however the methodology will employ the generalized method of moments
(GMM) dynamic panel data estimation following previous studies (Maudos & Solis, 2009);
(Moulton, 2011); (Liebeg & Schwaiger, 2006); among others). These studies included variables
which were influencing the NIM. This paper adds to literature employing firm- specific and
8
macroeconomic variables as well as examines the impact of foreign- owned banks on the efficiency
of the banking sector in Jamaica.
3. Data and Methodology
3.1 Data
The paper uses quarterly banking system data for the period March 2002 to December 2014. It
employs an unbalanced panel since some institutions have exited the market or merged during the
sample period. Data from 11 institutions utilized in the study which covers in the commercial
banks, building societies’ sectors and other institutions licensed under the Financial Institution Act
(FIAs). The data is sourced from institutions’ report to the Bank of Jamaica (BOJ).
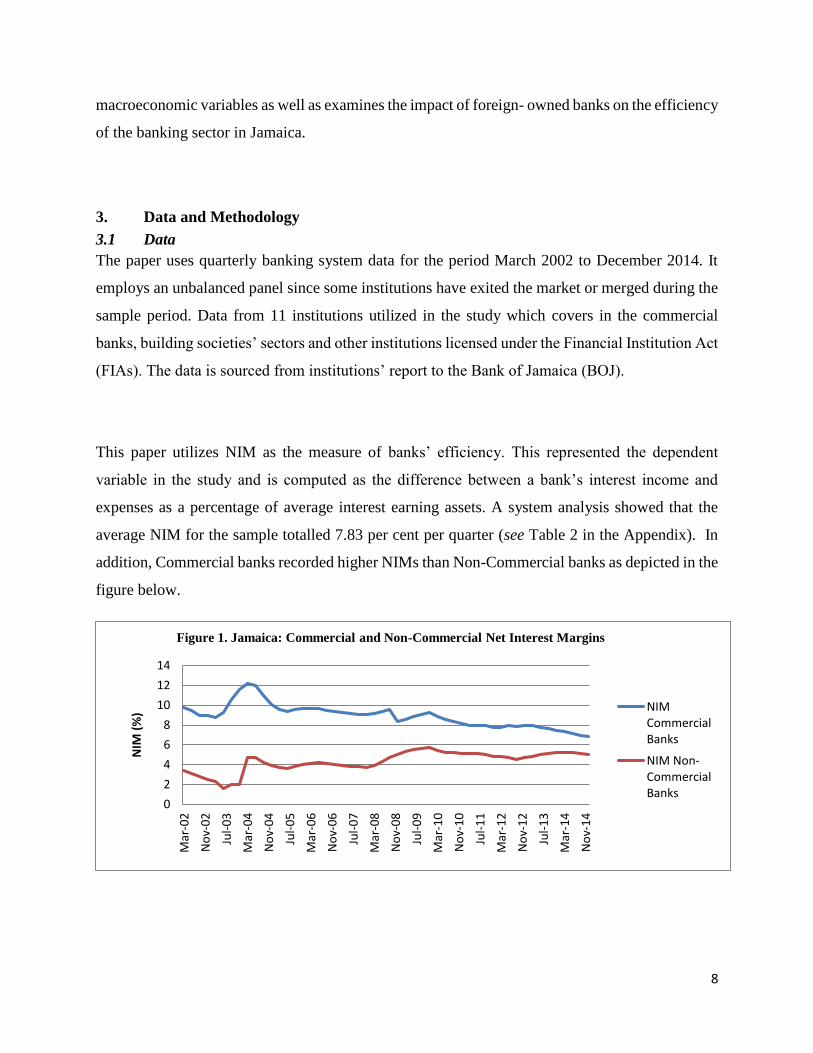
This paper utilizes NIM as the measure of banks’ efficiency. This represented the dependent
variable in the study and is computed as the difference between a bank’s interest income and
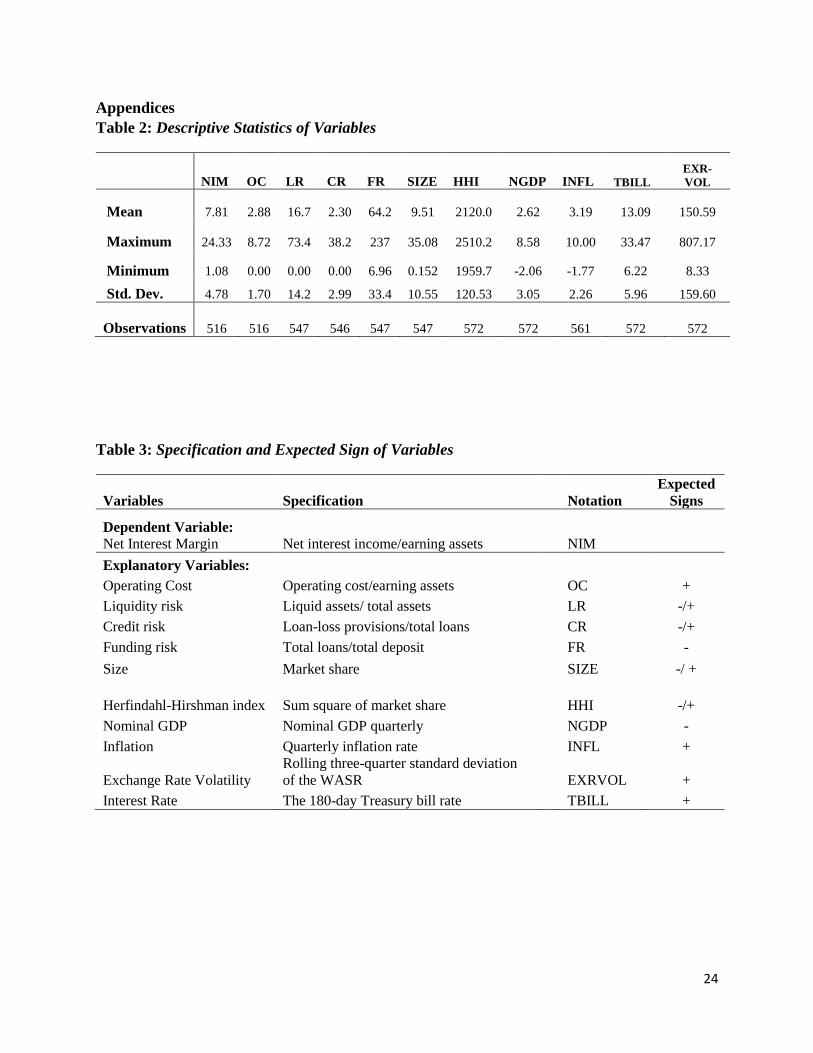
expenses as a percentage of average interest earning assets. A system analysis showed that the
average NIM for the sample totalled 7.83 per cent per quarter (see Table 2 in the Appendix). In
addition, Commercial banks recorded higher NIMs than Non-Commercial banks as depicted in the
figure below.
0
2
4
6
8
10
12
14
Mar
-02
No
v-0
2
Jul-
03
Mar
-04
No
v-0
4
Jul-
05
Mar
-06
No
v-0
6
Jul-
07
Mar
-08
No
v-0
8
Jul-
09
Mar
-10
No
v-1
0
Jul-
11
Mar
-12
No
v-1
2
Jul-
13
Mar
-14
No
v-1
4
NIM
(%
)
Figure 1. Jamaica: Commercial and Non-Commercial Net Interest Margins
NIMCommercialBanks
NIM Non-CommercialBanks
9
The independent variables employed in the study are intended to cover the firm-specific as well as
the macroeconomic determinants of banks’ efficiency. The firm- specific determinants of banks’
efficiency incorporated in this paper are operating costs, liquidity risks, credit risks, funding risks
as well as the size of the bank.
Operating costs (OC) reflect the operating costs of the institutions as a share of its total earning
assets and is expected to have a positive effect on the bank’s NIM. (Nassar, Martinez, & Pineda,
2014) concluded that operating costs is the most important determinant of the banks’ NIM in
Honduras. Additionally, (Brock & Suarez, 2000) highlighted in their paper that larger costs can be
interpreted as a higher spread.
Liquidity risk (LR) is defined as the losses that may arise from banks’ inability to match deposits
with loans, owing to maturity mismatch between their assets and liabilities. This is calculated as
the ratio of liquid assets to total assets. The expected impact is positive/negative as the literature
gives both a negative as well as a positive relationship with NIM.1
Credit risk (CR) was calculated as the ratio of the loan-loss provisions to total loans. It can be
negatively correlated with NIM which implies banks with high credit risks tend to offer higher
interest rates, to encourage depositors to bank with them. On the contrary, in line with the literature,
credit risk was positively correlated with NIM which suggests that structural reform should aim at
improving risk assessment as well as lower non-performing loans and higher loan loss provisions.
Funding risk (FR) is risk associated with the impact of higher funding costs or lack of availability
of funds on a project's cash flow. This paper uses the credit-to deposit ratio as a measure of FR.
According to (Nassar, Martinez, & Pineda, 2014) a decline in the credit-to deposit ratio puts
1 (Hamadi & Awdeh, 2012) concluded that Liquidity has an inverse relationship with NIM as domestic banks may
increase the interest rates on deposits therefore boosting liquidity which in turn lowers the Interest Margins.
Conversely, (Nassar, Martinez, & Pineda, 2014) concluded that high liquidity ratio was translated into high NIM.

10
pressure on banks’ business model which in turn leads to higher interest margins. This highlights
the negative relationship expected with NIM.
The size (SIZE) of a financial institution is included in the analysis and is obtained by calculating
the market share of each institution. In addition, the Herfindahl-Hirschman Index (HHI) is included
in an effort to capture market concentration and also competition for the financial system.2 It is
obtained by the squaring and summing of market share of each institution. There is conflict in the
literature on the expected impact. (Fungacova & Poghosyan, 2011) posit that due to increased
economies of scale, banks providing more credit should benefit from their size and have lower
margins. However, (Liebeg & Schwaiger, 2006) argued that the larger the size of the operations,
the larger the concentration risk which implies higher NIMs.
Nominal GDP (NGDP) is expected to have a negative effect on the NIM. This view is supported
by (Bernanke & Gertler, 1987) who suggested that potential borrowers with low wealth relative to
the size of their investment (projects) will lead to higher agency costs and thus poor performance
in the investment sector and in the economy as a whole.
A positive relationship between CPI inflation (INFL) and NIM has been observed in previous
studies (Gelos, 2009); (Demirguc-Kunt & Huizinga, 1999).
The impact of the variability in interest rates was proxied by the 180-day Treasury bill rate
(TBILL). The T-bill rate is generally used as an indicator of the interest policy being pursued by
the government as well as a benchmark for rate charge by financial institutions. Therefore, it is
2 The most widely used method of calculating market concentration is the Herfindahl Hirschman Index (HHI). Markets can be
classified into three groups: (i) A value of below 0.1 indicates an unconcentrated index, (ii) 0.1 – 0.18 indicates a moderate
concentration, and (iii) above 0.18 indicates high concentration (U. S. Department of Justice and Federal Trade Commission.
Horizontal Merger Guidelines. 2010).
11
anticipated that a low- interest rate environment will in turn shrink the NIM. The exchange rate
volatility (EXRVOL) was also calculated by the rolling three- quarter standard deviation for the
exchange rate proxied by the weighted average selling rate (WASR). This variable is an indicator
of macroeconomic instability and should be positively correlated with NIM.
A dummy variable representing Commercial banks (CB) is used to analyse the differences in the
NIM of commercial banks versus non-commercial banks. This analysis is aimed at concluding
whether commercial banks have higher NIM than non-commercial banks.
A dummy variable to represent foreign- owned banks (FOREIGN) is used for this study, since in
the literature, (Demirguc-Kunt & Huizinga, 1999), it was concluded that foreign banks have
greater NIMS in developing countries. It must be noted however that (Ho & Saunders, 1981) have
argued that bank ownership was irrelevant in determining NIMs. They argue that banks would
apply similar strategies when competing in the same market.
The paper includes a Jamaica Debt Exchange (JDX) dummy variable as (Bailey-Tapper, 2010)
argued that the GOJ’s debt re-profiling programme strongly affected the business model of
Jamaican banks. More specifically, banks’ investment and net earnings performance were
significantly affected by this impact.3
3 The JDX was launched on 14 January 2010 and involved investors voluntarily participating by surrendering old
bonds and choosing new bonds according to specified rules. The financial settlement date was 24 February 2010 and
on this date, new bonds were issued and accrued interest paid.
12
Similarly, a National Debt Exchange (NDX) dummy variable is included. (Robinson, 2002) notes
that “the level of government borrowing and its influence on money and credit markets imposes
constraints on the flexibility on interest rates.” Therefore, an impact is expected on the NIM.4
The predictions can be summarized as follows: (i) higher operating costs, higher NIM; (ii) market
concentration increases yield higher NIMs; (iii) liquidity and credit risks may be either positive or
negative while (iv) funding risks, inflation, interest rates and exchange rates are positively related
to NIM. On the other hand, Real GDP is expected to have a negative impact on NIMs. The
dummies added should also be significant.
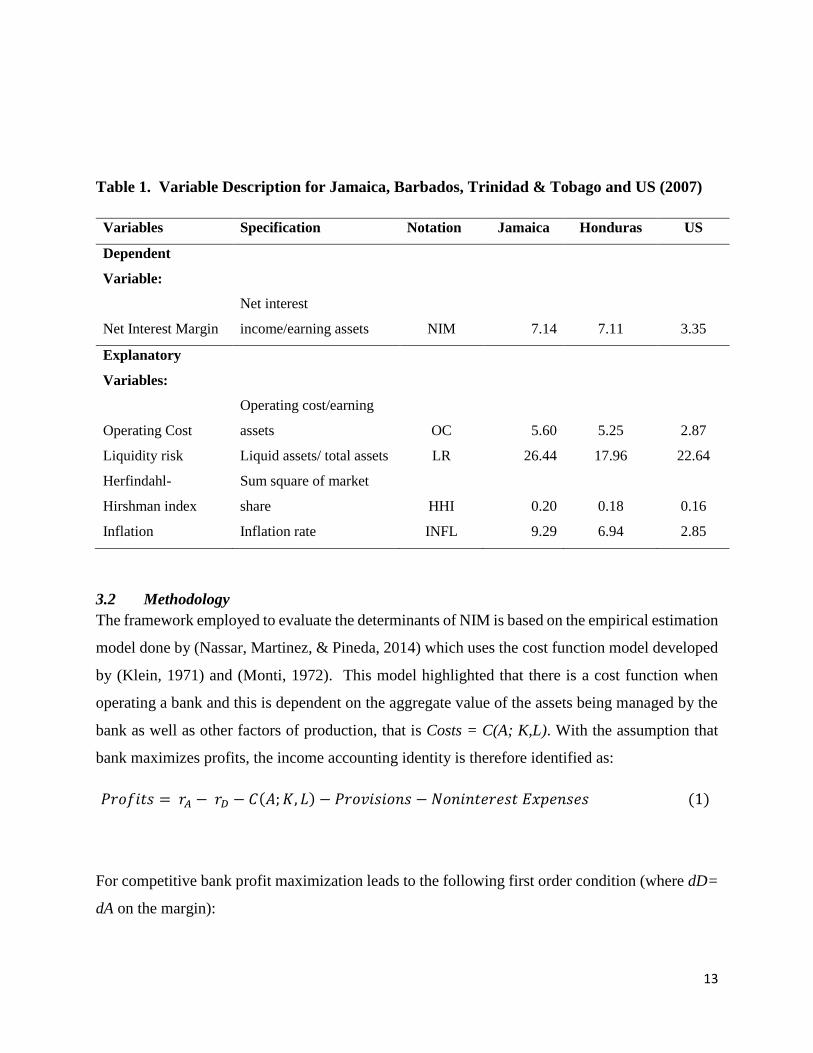
3.1.1 Stylized Facts
The table below depicts the comparison of the variables to some other countries. The NIM in
Jamaica is relatively high in comparison to the United States (developed country) while it falls in
the same region as Honduras (developing countries). Jamaican banks have relatively high liquidity
risk in comparison to Barbados and the United States. The operating costs of banks in Jamaica and
Honduras are relatively higher than the operating costs faced by banks in the United States. The
Banking sector in Jamaica and Honduras are said to be highly concentrated while the banking
sector in the United States is described as moderately concentrated (see Table 1).
4 On February 12, 2013 the Government of Jamaica announced the launch of the National Debt Exchange Offer
(NDX), which is an exchange of debt instruments between the government and creditors on the local market. The
expected announcement of results and settlement was February 22, 2013.
13
Table 1. Variable Description for Jamaica, Barbados, Trinidad & Tobago and US (2007)
Variables Specification Notation Jamaica Honduras US
Dependent
Variable:
Net Interest Margin
Net interest
income/earning assets NIM 7.14 7.11 3.35
Explanatory
Variables:
Operating Cost
Operating cost/earning
assets OC 5.60 5.25 2.87
Liquidity risk Liquid assets/ total assets LR 26.44 17.96 22.64
Herfindahl-
Hirshman index
Sum square of market
share HHI 0.20 0.18 0.16
Inflation Inflation rate INFL 9.29 6.94 2.85
3.2 Methodology
The framework employed to evaluate the determinants of NIM is based on the empirical estimation
model done by (Nassar, Martinez, & Pineda, 2014) which uses the cost function model developed
by (Klein, 1971) and (Monti, 1972). This model highlighted that there is a cost function when
operating a bank and this is dependent on the aggregate value of the assets being managed by the
bank as well as other factors of production, that is Costs = C(A; K,L). With the assumption that
bank maximizes profits, the income accounting identity is therefore identified as:
𝑃𝑟𝑜𝑓𝑖𝑡𝑠 = 𝑟𝐴 − 𝑟𝐷 − 𝐶(𝐴; 𝐾, 𝐿) − 𝑃𝑟𝑜𝑣𝑖𝑠𝑖𝑜𝑛𝑠 − 𝑁𝑜𝑛𝑖𝑛𝑡𝑒𝑟𝑒𝑠𝑡 𝐸𝑥𝑝𝑒𝑛𝑠𝑒𝑠 (1)
For competitive bank profit maximization leads to the following first order condition (where dD=
dA on the margin):
14
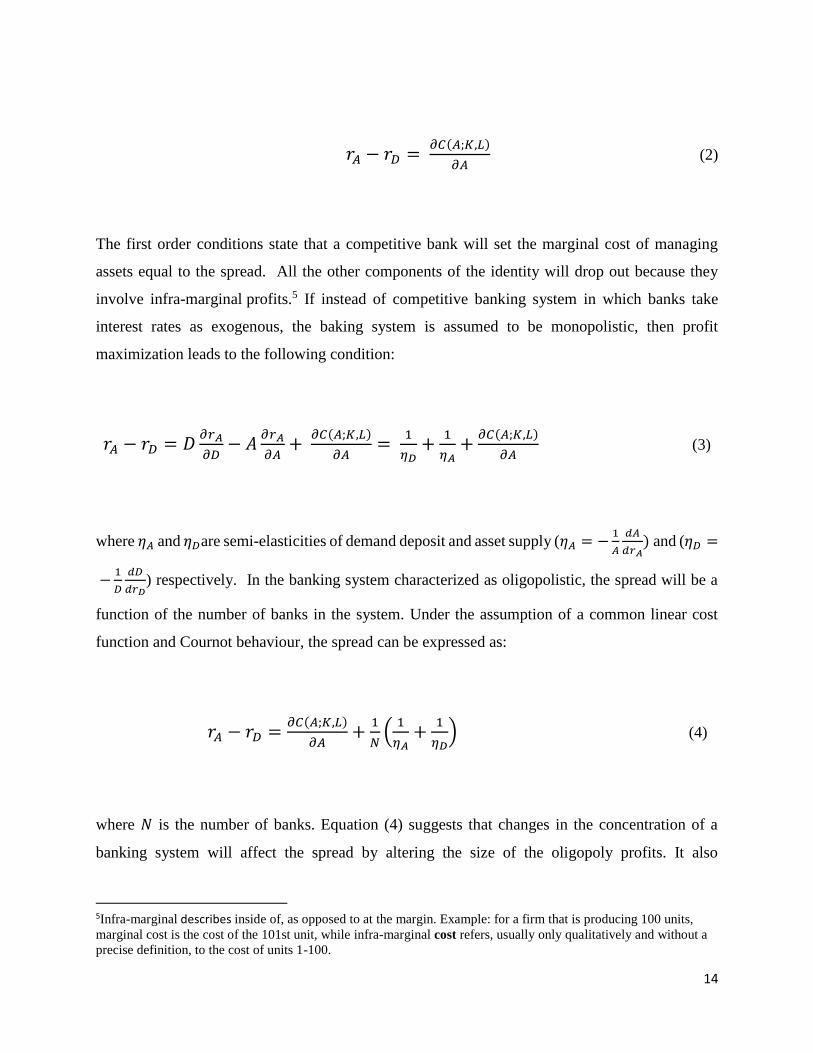
𝑟𝐴 − 𝑟𝐷 = 𝜕𝐶(𝐴;𝐾,𝐿)
𝜕𝐴 (2)
The first order conditions state that a competitive bank will set the marginal cost of managing
assets equal to the spread. All the other components of the identity will drop out because they
involve infra-marginal profits.5 If instead of competitive banking system in which banks take
interest rates as exogenous, the baking system is assumed to be monopolistic, then profit
maximization leads to the following condition:
𝑟𝐴 − 𝑟𝐷 = 𝐷𝜕𝑟𝐴
𝜕𝐷− 𝐴
𝜕𝑟𝐴
𝜕𝐴+
𝜕𝐶(𝐴;𝐾,𝐿)
𝜕𝐴=
1
𝜂𝐷+
1
𝜂𝐴+
𝜕𝐶(𝐴;𝐾,𝐿)
𝜕𝐴 (3)
where 𝜂𝐴 and 𝜂𝐷are semi-elasticities of demand deposit and asset supply (𝜂𝐴 = −1
𝐴
𝑑𝐴
𝑑𝑟𝐴) and (𝜂𝐷 =
−1
𝐷
𝑑𝐷
𝑑𝑟𝐷) respectively. In the banking system characterized as oligopolistic, the spread will be a
function of the number of banks in the system. Under the assumption of a common linear cost
function and Cournot behaviour, the spread can be expressed as:
𝑟𝐴 − 𝑟𝐷 =𝜕𝐶(𝐴;𝐾,𝐿)
𝜕𝐴+
1
𝑁(
1
𝜂𝐴+
1
𝜂𝐷) (4)
where 𝑁 is the number of banks. Equation (4) suggests that changes in the concentration of a
banking system will affect the spread by altering the size of the oligopoly profits. It also
5Infra-marginal describes inside of, as opposed to at the margin. Example: for a firm that is producing 100 units,
marginal cost is the cost of the 101st unit, while infra-marginal cost refers, usually only qualitatively and without a
precise definition, to the cost of units 1-100.
15
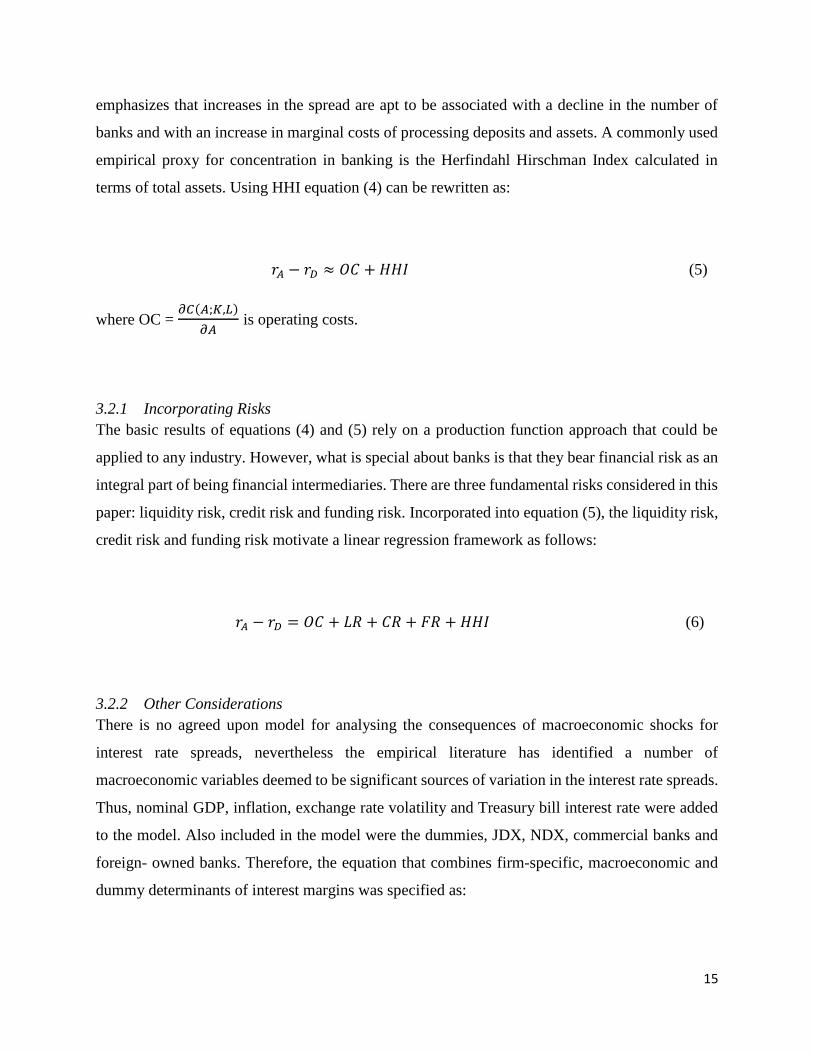
emphasizes that increases in the spread are apt to be associated with a decline in the number of
banks and with an increase in marginal costs of processing deposits and assets. A commonly used
empirical proxy for concentration in banking is the Herfindahl Hirschman Index calculated in
terms of total assets. Using HHI equation (4) can be rewritten as:
𝑟𝐴 − 𝑟𝐷 ≈ 𝑂𝐶 + 𝐻𝐻𝐼 (5)
where OC = 𝜕𝐶(𝐴;𝐾,𝐿)
𝜕𝐴 is operating costs.
3.2.1 Incorporating Risks
The basic results of equations (4) and (5) rely on a production function approach that could be
applied to any industry. However, what is special about banks is that they bear financial risk as an
integral part of being financial intermediaries. There are three fundamental risks considered in this
paper: liquidity risk, credit risk and funding risk. Incorporated into equation (5), the liquidity risk,
credit risk and funding risk motivate a linear regression framework as follows:
𝑟𝐴 − 𝑟𝐷 = 𝑂𝐶 + 𝐿𝑅 + 𝐶𝑅 + 𝐹𝑅 + 𝐻𝐻𝐼 (6)
3.2.2 Other Considerations
There is no agreed upon model for analysing the consequences of macroeconomic shocks for
interest rate spreads, nevertheless the empirical literature has identified a number of
macroeconomic variables deemed to be significant sources of variation in the interest rate spreads.
Thus, nominal GDP, inflation, exchange rate volatility and Treasury bill interest rate were added
to the model. Also included in the model were the dummies, JDX, NDX, commercial banks and
foreign- owned banks. Therefore, the equation that combines firm-specific, macroeconomic and
dummy determinants of interest margins was specified as:
16
𝑟𝐴 − 𝑟𝐷 = 𝑂𝐶 + 𝐿𝑅 + 𝐶𝑅 + 𝐹𝑅 + 𝑆𝐼𝑍𝐸 + 𝐻𝐻𝐼 + 𝑁𝐺𝐷𝑃 + 𝐼𝑁𝐹𝐿 + 𝐸𝑋𝑅𝑉𝑂𝐿 + 𝑇𝐵𝐼𝐿𝐿 + 𝐽𝐷𝑋
+ 𝑁𝐷𝑋 + 𝐶𝑂𝑀𝐵 + 𝐹𝑂𝑅𝐸𝐼𝐺𝑁 (7)
The empirical estimation is written to take the form:
𝑁𝐼𝑀𝑖𝑡 = 𝛽0 + 𝛽1𝑂𝐶𝑖𝑡 + 𝛽2𝐿𝑅𝑖𝑡 + 𝛽3𝐶𝑅𝑖𝑡 + 𝛽4𝐹𝑅𝑖𝑡 + 𝛽5∆𝑆𝐼𝑍𝐸𝑖𝑡 + 𝛽6 𝐻𝐻𝐼 + 𝛽7∆𝑁𝐺𝐷𝑃𝑖𝑡
+ 𝛽8𝐼𝑁𝐹𝐿𝑖𝑡 + 𝛽9𝐸𝑋𝑅𝑉𝑂𝐿𝑖𝑡 + 𝛽10∆𝑇𝐵𝐼𝐿𝐿𝑖𝑡 + 𝛽11𝐽𝐷𝑋 + 𝛽12 𝑁𝐷𝑋 + 𝛽13𝐶𝑂𝑀𝐵
+ 𝛽14𝐹𝑂𝑅𝐸𝐼𝐺𝑁 + 𝜀𝑖𝑡 (8)
where subscripts i and t stand for banking sector (Commercial, Building society or FIAs) and year
respectively. NIMit is the NIM for the specific banking sector i in period t; and εit is the error term.
This paper applies the GMM dynamic panel data technique to estimate this model. This method is
useful in providing unbiased and efficient estimates. The GMM methodology was first proposed
by (Arellano & Bover, 1995). It combines a set of equations in levels and differences and uses its
lagged levels and lagged first differences as instruments. This estimation technique was chosen
explicitly to account for several characteristics of the panel data such as: (i) possible endogeneity
of the firm- specific explanatory variables; (ii) the presence of fixed effects correlated with the
explanatory variables; (iii) the presence of the lagged dependent variable may increase
autocorrelation; and (iv) the possibility of heteroskedasticity. Therefore, the equation banks’ NIM
to the set of explanatory variables is:
𝑁𝐼𝑀𝑖𝑡 = 𝛽0 + 𝛽1𝑂𝐶𝑖𝑡 + 𝛽2𝐿𝑅𝑖𝑡 + 𝛽3𝐶𝑅𝑖𝑡 + 𝛽4𝐹𝑅𝑖𝑡 + 𝛽5∆𝑆𝐼𝑍𝐸𝑖𝑡 + 𝛽6 𝐻𝐻𝐼 + 𝛽7∆𝑁𝐺𝐷𝑃𝑖𝑡
+ 𝛽8𝐼𝑁𝐹𝐿𝑖𝑡 + 𝛽9𝐸𝑋𝑅𝑉𝑂𝐿𝑖𝑡 + 𝛽10∆𝑇𝐵𝐼𝐿𝐿𝑖𝑡 + 𝛽11𝐽𝐷𝑋 + 𝛽12 𝑁𝐷𝑋 + 𝛽13𝐶𝑂𝑀𝐵
+ 𝛽14𝐹𝑂𝑅𝐸𝐼𝐺𝑁 + 𝜀𝑖𝑡 (9)
17
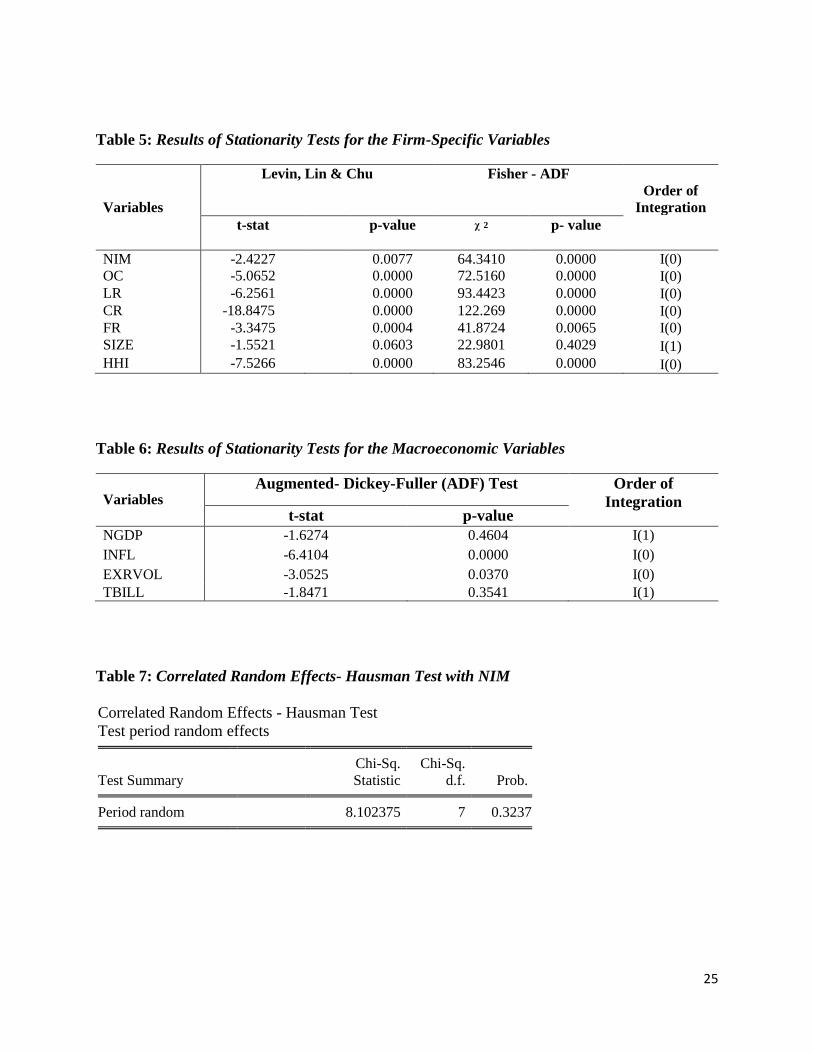
Before the model was estimated, stationarity tests of the panel were carried out using the Levin,
Lin & Chu and Fisher- Augmented Dickey Fuller (ADF) tests for stationarity. The results are
shown in Table 5 of the Appendix. Both tests were revealed that the panel was stationary except
for size which was integrated of order one and had to be first differenced. Additionally, the
macroeconomic variables were also tested using ADF (see Table 6) and results indicated that all
variables were stationary with exception of the 180–day Treasury Bill interest rate and the nominal
GDP. Both variables had to be first differenced.
4. Empirical Results
Equation 8 is first estimated with random effects after which a post- regression test, the Hausman
test is used to determine the appropriateness of the fixed versus the random effect specification.
The Hausman test indicates a failure to reject the null hypothesis of no misspecification of the
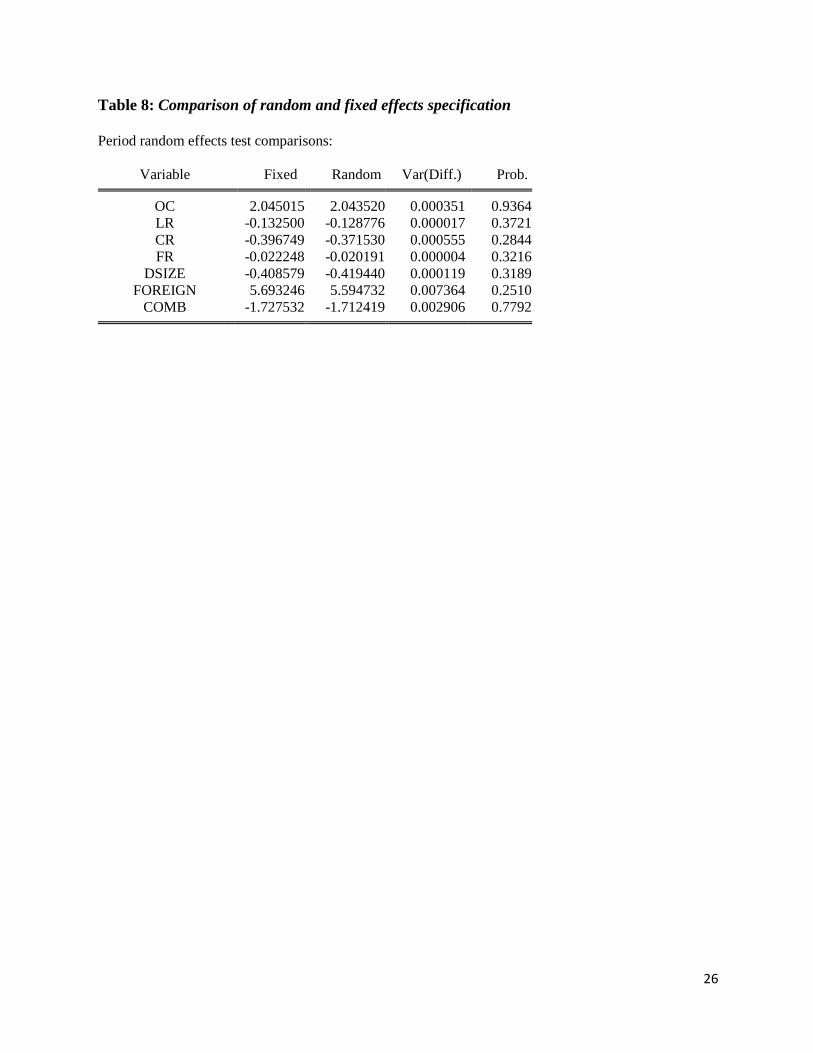
model (see Table 7). Additionally, a comparison of the coefficients of the models estimated by
fixed and random effects reveals a failure to reject the null hypothesis of no difference between
operating cost, liquidity risks, credit risk, funding risk, the change in size as well as foreign- owned
banks and commercial banks estimated by the random and fixed effects method at the 5 per cent
level.
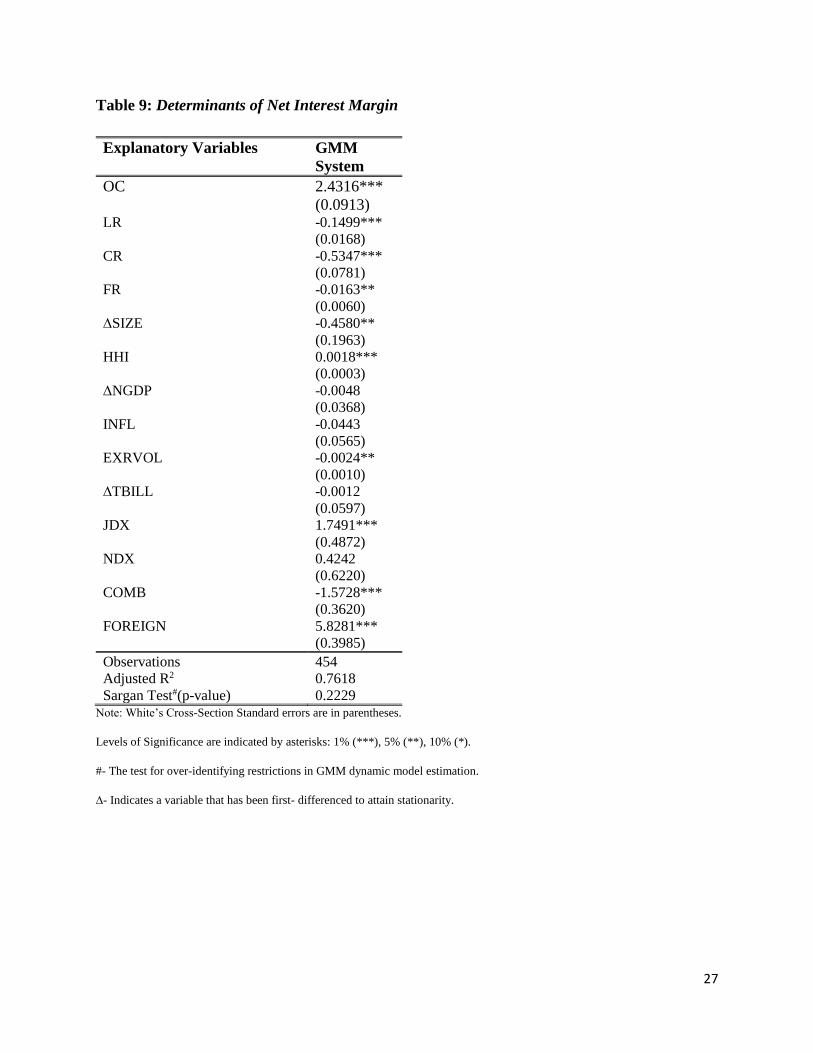
Given the possible existence of serial correlation in the model, the GMM estimator is used to
derive robust estimates of a dynamic panel model. The model was estimated using various firm-
specific and macroeconomic factors as instrumental variables (see Table 9). The results of the
most robust model are shown and includes all macroeconomic and firm- specific variables are
inconsistent with the (Nassar, Martinez, & Pineda, 2014) paper, however appears consistent with
other papers such as (Hamadi & Awdeh, 2012); (Liebeg & Schwaiger, 2006); (Demirguc-Kunt &
Huizinga, 1999) and (Bailey-Tapper, 2010). The quality of the results obtained from the final
model was subject to several robustness checks for dynamic panel model; specifically the results
18
of the Sargan test showed no evidence of over- identifying restrictions and instruments used in the
model are valid.6
The empirical estimates show that there is a positive and significant relationship between the
operating cost and NIMs. The coefficient of 2.43 implies that over the study period, the operating
cost has risen by 2.43 per cent. This coincides with (Nassar, Martinez, & Pineda, 2014); (Brock &
Suarez, 2000) that highlighted high operating costs is translated into higher NIMs. Operating costs
reflect the activities in which financial institutions specialize. Therefore financial institutions
operating with high costs due to diseconomies of scale must operate with high NIMs to cover those
costs. High operating costs reflect less efficient management, however financial institutions can
increase their operational efficiency and realize cost saving through technological change. Banks
could move towards electronic banking systems, high-speed check imaging systems; these allow
banks to reduce costs by substituting human capital for labour.
The negative and significant coefficient of 0.15 on the liquidity risk variable suggests that as
liquidity risks expand the NIM will decrease by 0.15 per cent. (Hamadi & Awdeh, 2012)
highlighted this negative effect stems from financial institutions tend to have excess liquidity, the
exposure to liquidity risks is low which contributes to lower margins. In addition, the loan-loss
provisions to total loans (the measure of credit risk) displays an inversely relationship with the
NIM. The negative and highly significant coefficient of 0.53 suggests that as the credit risks
increases the NIM will decline by 0.53 per cent. This suggests that as the loan-loss provisions
increases, the interest income decreases which in turn decreases the NIMs.
In line with the literature of the empirical model, the estimated coefficient of the funding risk is
negative and significant. Therefore with an increase in the loan-to-deposit ratio in the financial
6 The Sargan statistic is distributed as a 𝜒(𝑝 − 𝑘), where 𝑘 is the number of estimated coefficients and 𝑝 is the instrument rank.
19
sector it will in turn reduce the NIM. The results suggest that as the funding risk increases the NIM
will be reduced by 0.02 per cent.
The coefficient associated with the change in size of the financial institutions suggests that as the
change decreases the NIM will decrease by 0.45 per cent. This follows the paper by (Fungacova
& Poghosyan, 2011) that argued due to increased economies of scale, banks that provide more
credit should benefit from their size and have lower margins. On the other hand, the market
concentration proxied by HHI displayed a positive relationship with the NIM with the coefficient
suggesting that as the HHI increases the NIM will also see an increase by 0.002 per cent. This can
be explained as the market concentration increases; competition decreases (oligopolistic market
structure) and in turn increases the NIM (Hamadi & Awdeh, 2012).
Turning to the macroeconomic variables, the results are mixed. Similar to (Nassar, Martinez, &
Pineda, 2014) the change in Nominal GDP growth has no statistically significant impact on the
NIM. Additionally, inflation as well as the variability in the 180- day Treasury bill rate were
statistically insignificant in determining the NIM in Jamaica. The negative coefficient on exchange
rate is significant even though this result was not expected. (Randall, 1998) highlighted in her
study that there is a negative relationship between the economic activity and bank spreads. It is
interpreted that an increase in the exchange rate volatility will subsequently lead to a decline in the
NIM by 0.002 per cent.
In examining the effect of dummy variables employed in the model, NDX proved to be
insignificant in determining the NIM. However, JDX displayed a positive and highly significant
relationship with the NIM, which implies that the three quarters (March-September) in 2010
subsequently showed an increase in the NIM of 1.75 per cent. In addition, Foreign –owned banks
are positively and significantly correlated with NIM. In fact, the estimated coefficient is the largest
among all the explanatory variables, therefore it is most important determinant of NIM. It implies
that foreign- banks have higher NIMs in Jamaica and this coincides with (Demirguc-Kunt &
20
Huizinga, 1999) paper that highlighted that within developing countries, foreign- owned banks
have higher margins. Contrary to the actual data, commercial banks display a negative and
significant relationship with NIM. This implies that commercial banks have lower NIMs in
Jamaica. This could be explained by the financial institution, MFG being an outlier, had NIMs
twice the size of any commercial bank.
5. Conclusions and Policy Implications
The main purpose of the study was to investigate the firm – specific and macroeconomic
determinants of the net interest margin in Jamaica for the period 2002:1 to 2014:4. The
determinants were classified as firm –specific variables which include operating costs, liquidity
risk, credit risk, funding risks, size, market concentration and macroeconomic variables: nominal
GDP, inflation, exchange rate volatility, Treasury bill rate. JDX, NDX, commercial banks and
foreign-owned banks were also added to the model to address shocks experienced by financial
institutions as well as ownership of the financial institution. This was accomplished through the
estimation of a dynamic unbalanced panel framework, using the (Arellano & Bover, 1995) GMM
technique.
The paper revealed that NIM in Jamaica is mainly dependent on the ownership of the bank.
Foreign- owned banks have operated with persistently higher margins than that of domestic banks.
The analysis also supports evidence that the observed financial institutions’ margins were
positively and significantly impacted by operating costs, market concentration proxied by HHI and
the implementation of the JDX program. On the other hand, the results displayed that the NIM was
negatively and significantly affected by the liquidity risks, credit risks, funding risks, size of the
financial institution, exchange rate volatility as well as being a commercial bank.
Several policy implications emanate from this paper. Firstly, financial institutions must continue
to deal with the issues of high levels of operating costs and the diseconomies of scale in their
operations. Enhancing operational efficiencies to exploit scale and scope economies must become

21
urgent priority of financial institutions. Secondly, with respect to competition, a more competitive
environment would help to mitigate some of the monopoly rents extracted by financial institutions.
Policies that link access to liquidity from the Bank that is inversely related to bank size and deposit
could aid in reducing market concentration and increase competition. Overall, reduction in the
NIM supports long-term economic growth for Jamaica.
This study can be extended looking at the role of foreign bank entry and the effects it has on the
operation of the domestic banks. It would be interesting determining whether the main determinant
for this study is overall welfare improving for Jamaica in the long-run.
22
References
Arellano, M., & Bover, O. (1995). Another look at the instrumental variable estimation of error-
components models . Journal of Econometrics , 68(1), 29-51.
Bailey-Tapper, S. (2010). Non-Interest Income Financial performance & the Macroeconomy:
Evidence on Jamaican panel data . CBB Working Paper.
Bernanke, B., & Gertler, M. (1987). Financial fragility and economic performance . National
Bureau of Economic Research, w2318.
Brock, P., & Franken, H. (2002). Bank interest margins meet interest rate spreads: how good is
balance sheet data for analyzing the cost the cost of financial intermediation?
Brock, P., & Suarez, L. R. (2000). Understanding the behaviour of bank spreads in Latin America.
Journal of Development Economics, 63(1), 113- 134.
Chirwa, E. W., & Mlachica, M. (2004). Financial reforms and Interest Rate Spreads in the
Commercial Banking system in Malawi. IMF Staff papers, 51(1), 96- 122.
Claeys, S., & Vander Vennet, R. (2008). Determinants of bank interest margins in Central and
Eastern Europe: A comparison with the West. Economic Systems, 32(2), 197-216.
Demirguc-Kunt, A., & Huizinga, H. (1999). Determinants of commercial bank interest margins
and profitability: some international evidence . The World Bank Economic Review , 13(2),
379-408.
Fungacova, Z., & Poghosyan. (2011). Determinants of bank interest margins in Russia: Does bank
ownership matter? Economic Systems , 35(4), 481- 495.
Gelos. (2009). Banking spreads in Latin America . Economic Inquiry, 47(4), 796- 814.
Hamadi, H., & Awdeh, A. (2012). The Determinants of bank interest margins: evidence from the
Lebanese banking sector . Journal of Money, Investment and banking , 23(3), 85- 98.
Ho, T. S., & Saunders, A. (1981). The determinants of bank interest margins: theory and emprical
evidence. Journal of Financial and Quantitative analysis, 16(04), 581-600.
Horvath, R. (2009). The determinants of the interest rate margins of Czech banks. Czech Journal
of Eonomiccs and Finance , 59(2), 128- 136.
Klein, M. (1971). A Theory of the Banking Firm. Journal of Money, Credit and Banking, 3. 205-
18.
Liebeg, D., & Schwaiger, M. (2006). Determinants of te interest rte margins of Austrian banks .
Financcial Stability Report, 12, 104- 116.
23
Maudos, J., & Solis, L. (2009). The determinants of net interest income in the Mexican banking
system: An integrated model. Journal of Banking & Finance , 33(10), 1920-1931.
Monti, M. (1972). Deposit, Credit, and Interest rate determination under alternative Bank
Objecctives . Mathematical Methods in Investment and Finance, 430- 454.
Moore, W., & Craigwell, R. (2002). Market power and interest rate spreads in the Caribbean .
International Review of Applied Economics , 16(4),391- 405.
Moulton, A. (2011). An Investigation of the Determinants & Forecast Performance of Bank
Profits: The Case of Jamaican Banks .
Nassar, K., Martinez, E., & Pineda, A. (2014). Determinants of Banks' Net Inerest Margins in
Honduras. IMF Working Paper, WP/14/163.
Randall, R. (1998). Interest Rate Spreads in Eastern Caribbean . IMF Working Paper , Vol. 59.
Robinson, J. W. (2002). Commercial Bank interest rate spreads in Jamaica: Measurement, Trend
and Prospects .
24
Appendices
Table 2: Descriptive Statistics of Variables
NIM OC LR CR FR SIZE HHI NGDP INFL TBILL
EXR-
VOL
Mean 7.81 2.88 16.7 2.30 64.2 9.51 2120.0 2.62 3.19 13.09 150.59
Maximum 24.33 8.72 73.4 38.2 237 35.08 2510.2 8.58 10.00 33.47 807.17
Minimum 1.08 0.00 0.00 0.00 6.96 0.152 1959.7 -2.06 -1.77 6.22 8.33
Std. Dev. 4.78 1.70 14.2 2.99 33.4 10.55 120.53 3.05 2.26 5.96 159.60
Observations 516 516 547 546 547 547 572 572 561 572 572
Table 3: Specification and Expected Sign of Variables
Variables Specification
Notation
Expected
Signs
Dependent Variable:
Net Interest Margin Net interest income/earning assets
NIM
Explanatory Variables:
Operating Cost Operating cost/earning assets OC +
Liquidity risk Liquid assets/ total assets LR -/+
Credit risk Loan-loss provisions/total loans CR -/+
Funding risk Total loans/total deposit FR -
Size Market share SIZE -/ +
Herfindahl-Hirshman index Sum square of market share
HHI -/+
Nominal GDP Nominal GDP quarterly NGDP -
Inflation Quarterly inflation rate INFL +
Exchange Rate Volatility
Rolling three-quarter standard deviation
of the WASR
EXRVOL +
Interest Rate The 180-day Treasury bill rate TBILL +
25
Table 5: Results of Stationarity Tests for the Firm-Specific Variables
Variables
Levin, Lin & Chu
Fisher - ADF
Order of
Integration
t-stat
p-value
ᵡ 2 p- value
NIM -2.4227 0.0077 64.3410 0.0000 I(0)
OC -5.0652 0.0000 72.5160 0.0000 I(0)
LR -6.2561 0.0000 93.4423 0.0000 I(0)
CR -18.8475 0.0000 122.269 0.0000 I(0)
FR -3.3475 0.0004 41.8724 0.0065 I(0)
SIZE -1.5521 0.0603 22.9801 0.4029 I(1)
HHI -7.5266 0.0000 83.2546 0.0000 I(0)
Table 6: Results of Stationarity Tests for the Macroeconomic Variables
Variables
Augmented- Dickey-Fuller (ADF) Test Order of
Integration t-stat p-value
NGDP -1.6274 0.4604 I(1)
INFL -6.4104 0.0000 I(0)
EXRVOL -3.0525 0.0370 I(0)
TBILL -1.8471 0.3541 I(1)
Table 7: Correlated Random Effects- Hausman Test with NIM
Correlated Random Effects - Hausman Test
Test period random effects
Test Summary
Chi-Sq.
Statistic
Chi-Sq.
d.f. Prob. Period random 8.102375 7 0.3237
26
Table 8: Comparison of random and fixed effects specification
Period random effects test comparisons:
Variable Fixed Random Var(Diff.) Prob.
OC 2.045015 2.043520 0.000351 0.9364
LR -0.132500 -0.128776 0.000017 0.3721
CR -0.396749 -0.371530 0.000555 0.2844
FR -0.022248 -0.020191 0.000004 0.3216
DSIZE -0.408579 -0.419440 0.000119 0.3189
FOREIGN 5.693246 5.594732 0.007364 0.2510
COMB -1.727532 -1.712419 0.002906 0.7792
27
Table 9: Determinants of Net Interest Margin
Explanatory Variables GMM
System
OC 2.4316***
(0.0913) LR -0.1499***
(0.0168)
CR -0.5347***
(0.0781)
FR -0.0163**
(0.0060)
∆SIZE -0.4580**
(0.1963)
HHI 0.0018***
(0.0003)
∆NGDP -0.0048
(0.0368)
INFL -0.0443
(0.0565)
EXRVOL -0.0024**
(0.0010)
∆TBILL -0.0012
(0.0597)
JDX 1.7491***
(0.4872)
NDX 0.4242
(0.6220)
COMB -1.5728***
(0.3620)
FOREIGN 5.8281***
(0.3985)
Observations 454
Adjusted R2 0.7618
Sargan Test#(p-value) 0.2229 Note: White’s Cross-Section Standard errors are in parentheses.
Levels of Significance are indicated by asterisks: 1% (***), 5% (**), 10% (*).
#- The test for over-identifying restrictions in GMM dynamic model estimation.
∆- Indicates a variable that has been first- differenced to attain stationarity.