determinants of financial performance of commercial banks
TRANSCRIPT
International Journal of Economics and Financial Issues Vol. 3, No. 1, 2013, pp.237-252 ISSN: 2146-4138 www.econjournals.com
237
Determinants of Financial Performance of Commercial Banks in Kenya
Vincent Okoth Ongore
Assistant Commissioner, Kenya Revenue Authority, Kenya. Email: [email protected]
Gemechu Berhanu Kusa
Local Economic Development and Finance Specialist, Addis Ababa, Ethiopia. Email: [email protected]
ABSTRACT: Studies on moderating effect of ownership structure on bank performance are scanty. To fill this glaring gap in this vital area of study, the authors used linear multiple regression model and Generalized Least Square on panel data to estimate the parameters. The findings showed that bank specific factors significantly affect the performance of commercial banks in Kenya, except for liquidity variable. But the overall effect of macroeconomic variables was inconclusive at 5% significance level. The moderating role of ownership identity on the financial performance of commercial banks was insignificant. Thus, it can be concluded that the financial performance of commercial banks in Kenya is driven mainly by board and management decisions, while macroeconomic factors have insignificant contribution. Keywords: Financial Performance; Bank Specific Factors; Macroeconomic Variables JEL Classifications: E4; G2 1. Introduction
Commercial banks play a vital role in the economic resource allocation of countries. They channel funds from depositors to investors continuously. They can do so, if they generate necessary income to cover their operational cost they incur in the due course. In other words for sustainable intermediation function, banks need to be profitable. Beyond the intermediation function, the financial performance of banks has critical implications for economic growth of countries. Good financial performance rewards the shareholders for their investment. This, in turn, encourages additional investment and brings about economic growth. On the other hand, poor banking performance can lead to banking failure and crisis which have negative repercussions on the economic growth.
Thus, financial performance analysis of commercial banks has been of great interest to academic research since the Great Depression Intern the 1940’s. In the last two decades studies have shown that commercial banks in Sub-Saharan Africa (SSA) are more profitable than the rest of the world with an average Return on Assets (ROA) of 2 percent (Flamini et al., 2009). One of the major reasons behind high return in the region was investment in risky ventures. The other possible reason for the high profitability in commercial banking business in SSA is the existence of huge gap between the demand for bank service and the supply thereof. That means, in SSA the number of banks are few compared to the demand for the services; as a result there is less competition and banks charge high interest rates. This is especially true in East Africa where the few government owned banks take the lion's share of the market. The performance of commercial banks can be affected by internal and external factors (Al-Tamimi, 2010; Aburime, 2005). These factors can be classified into bank specific (internal) and macroeconomic variables. The internal factors are individual bank characteristics which affect the bank's performance. These factors are basically influenced by the internal decisions of management and board. The external factors are sector wide or country wide factors which are beyond the control of the company and affect the profitability of banks.
Studies show that performance of firms can also be influenced by ownership identity (Ongore, 2011). To study the effect of ownership identity, we introduced the concept of moderating variable. In this study the ownership identity is classified into foreign and domestic. The domestic vis-à-vis foreign classification is based on the nature of the existing major ownership identity in Kenya. According to Central Bank of Kenya (2011) Supervision Report as of December 2011 out of the 43
International Journal of Economics and Financial Issues, Vol. 3, No. 1, 2013, pp.237-252
238
commercial banks 30 of them are domestically owned and 13 are foreign owned. In terms of asset holding, foreign banks account for about 35% of the banking assets as of 2011. In Kenya the commercial banks dominate the financial sector. In a country where the financial sector is dominated by commercial banks, any failure in the sector has an immense implication on the economic growth of the country. This is due to the fact that any bankruptcy that could happen in the sector has a contagion effect that can lead to bank runs, crises and bring overall financial crisis and economic tribulations. Despite the good overall financial performance of banks in Kenya, there are a couple of banks declaring losses (Oloo, 2011). Moreover, the current banking failures in the developed countries and the bailouts thereof motivated this study to evaluate the financial performance of banks in Kenya. Thus, to take precautionary and mitigating measures, there is dire need to understand the performance of banks and its determinants.
This study utilized CAMEL approach to check up the financial health of commercial banks, Intern line with the recommendations of the Basel Committee on Banking Supervision of the Bank of International Settlements (BIS) of 1988 (ADB in Baral, 2005).
Most studies conducted in relation to bank performances focused on sector-specific factors that affect the overall banking sector performances (Chantapong, 2005; Olweny and Shipho, 2011 and Heng et al., 2011). Nevertheless, there is a need to include the macroeconomic variables. Thus, this study has incorporated key macroeconomic variables (Inflation and GDP) in the analysis. Moreover, this study examined whether ownership identity has influenced the relationship between bank performance and its determinants. 2. Review of Relevant Literature on Bank Performance
Since the introduction of Structural Adjustment Programs (SAP) in the late 1980’s, the banking sector worldwide has experienced major transformations in its operating environment. Countries have eased controls on interest rates, reduced government involvement and opened their doors to international banks (Ismi, 2004). Due to this reform, firms of the developed nations have become more visible in developing countries through their subsidiaries and branches or by acquisition of foreign firms. More specifically, foreign banks’ presence in other countries across the globe has been increasing tremendously. Since 1980’s, many foreign banks have established their branches or subsidiaries in different parts of the world. In the last two decades or so, the number of foreign banks in Africa in general and Sub-Saharan Africa in particular has been increasing significantly. On the contrary, the number of domestic banks declined (Claessens and Hore, 2012.) These have attracted the interests of researchers to examine bank performance in relation to these reforms. There has been noticed a significant change in the financial configuration of countries in general and its effect on the profitability of commercial banks in particular. It is obvious that a sound and profitable banking sector is able to withstand negative shocks and contribute to the stability of the financial system (Athanasoglou et al. 2005.) Moreover, commercial banks play a significant role in the economic growth of countries. Through their intermediation function banks play a vital role in the efficient allocation of resources of countries by mobilizing resources for productive activities. They transfer funds from those who don't have productive use of it to those with productive venture. In addition to resource allocation good bank performance rewards the shareholders with sufficient return for their investment. When there is return there shall be an investment which, in turn, brings about economic growth. On the other hand, poor banking performance has a negative repercussion on the economic growth and development. Poor performance can lead to runs, failures and crises. Banking crisis could entail financial crisis which in turn brings the economic meltdown as happened in USA in 2007 (Marshall, 2009.) That is why governments regulate the banking sector through their central banks to foster a sound and healthy banking system which avoid banking crisis and protect the depositors and the economy (Heffernan, 1996; Shekhar and Shekhar, 2007.) Thus, to avoid the crisis due attention was given to banking performance.
A more organized study of bank performance started in the late 1980’s (Olweny and Shipho, 2011) with the application of Market Power (MP) and Efficiency Structure (ES) theories (Athanasoglou et al., 2005.) The MP theory states that increased external market forces results into profit. Moreover, the hypothesis suggest that only firms with large market share and well differentiated portfolio (product) can win their competitors and earn monopolistic profit. On the other hand, the ES theory suggests that enhanced managerial and scale efficiency leads to higher
Determinants of Financial Performance of Commercial Banks in Kenya
239
concentration and then to higher profitability. According to Nzongang and Atemnkeng in Olweny and Shipho (2011) balanced portfolio theory also added additional dimension into the study of bank performance. It states that the portfolio composition of the bank, its profit and the return to the shareholders is the result of the decisions made by the management and the overall policy decisions. From the above theories, it is possible to conclude that bank performance is influenced by both internal and external factors. According to Athanasoglou et al., (2005) the internal factors include bank size, capital, management efficiency and risk management capacity. The same scholars contend that the major external factors that influence bank performance are macroeconomic variables such as interest rate, inflation, economic growth and other factors like ownership. 2.1 Bank Performance Indicators
Profit is the ultimate goal of commercial banks. All the strategies designed and activities performed thereof are meant to realize this grand objective. However, this does not mean that commercial banks have no other goals. Commercial banks could also have additional social and economic goals. However, the intention of this study is related to the first objective, profitability. To measure the profitability of commercial banks there are variety of ratios used of which Return on Asset, Return on Equity and Net Interest Margin are the major ones (Murthy and Sree, 2003; Alexandru et al., 2008).
2.1.1 Return on Equity (ROE) ROE is a financial ratio that refers to how much profit a company earned compared to the total amount of shareholder equity invested or found on the balance sheet. ROE is what the shareholders look in return for their investment. A business that has a high return on equity is more likely to be one that is capable of generating cash internally. Thus, the higher the ROE the better the company is in terms of profit generation. It is further explained by Khrawish (2011) that ROE is the ratio of Net Income after Taxes divided by Total Equity Capital. It represents the rate of return earned on the funds invested in the bank by its stockholders. ROE reflects how effectively a bank management is using shareholders’ funds. Thus, it can be deduced from the above statement that the better the ROE the more effective the management in utilizing the shareholders capital.
2.1.2 Return on Asset (ROA) ROA is also another major ratio that indicates the profitability of a bank. It is a ratio of Income to its total asset (Khrawish, 2011). It measures the ability of the bank management to generate income by utilizing company assets at their disposal. In other words, it shows how efficiently the resources of the company are used to generate the income. It further indicates the efficiency of the management of a company in generating net income from all the resources of the institution (Khrawish, 2011). Wen (2010), state that a higher ROA shows that the company is more efficient in using its resources.
2.1.3 Net Interest Margin (NIM) NIM is a measure of the difference between the interest income generated by banks and the amount of interest paid out to their lenders (for example, deposits), relative to the amount of their (interest-earning) assets. It is usually expressed as a percentage of what the financial institution earns on loans in a specific time period and other assets minus the interest paid on borrowed funds divided by the average amount of the assets on which it earned income in that time period (the average earning assets). The NIM variable is defined as the net interest income divided by total earnings assets (Gul et al., 2011). Net interest margin measures the gap between the interest income the bank receives on loans and securities and interest cost of its borrowed funds. It reflects the cost of bank intermediation services and the efficiency of the bank. The higher the net interest margin, the higher the bank's profit and the more stable the bank is. Thus, it is one of the key measures of bank profitability. However, a higher net interest margin could reflect riskier lending practices associated with substantial loan loss provisions (Khrawish, 2011). 2.2 Determinants of Bank Performance
The determinants of bank performances can be classified into bank specific (internal) and macroeconomic (external) factors (Al-Tamimi, 2010; Aburime, 2005). These are stochastic variables that determine the output. Internal factors are individual bank characteristics which affect the banks performance. These factors are basically influenced by internal decisions of management and the board. The external factors are sector-wide or country-wide factors which are beyond the control of the company and affect the profitability of banks. The overall financial performance of banks in
International Journal of Economics and Financial Issues, Vol. 3, No. 1, 2013, pp.237-252
240
Kenya in the last two decade has been improving. However, this doesn't mean that all banks are profitable, there are banks declaring losses (Oloo, 2010). Studies have shown that bank specific and macroeconomic factors affect the performance of commercial banks (Flamini et al. 2009). In this regard, the study of Olweny and Shipho (2011) in Kenya focused on sector-specific factors that affect the performance of commercial banks. Yet, the effect of macroeconomic variables was not included. Moreover, to the researcher's knowledge the important element, the moderating role of ownership identity on the performance of commercial banks in Kenya was not studied. Thus, this study was conducted with the intention of filling this gap.
2.2.1 Bank Specific Factors/Internal Factors As explained above, the internal factors are bank specific variables which influence the profitability of specific bank. These factors are within the scope of the bank to manipulate them and that they differ from bank to bank. These include capital size, size of deposit liabilities, size and composition of credit portfolio, interest rate policy, labor productivity, and state of information technology, risk level, management quality, bank size, ownership and the like. CAMEL framework often used by scholars to proxy the bank specific factors (Dang, 2011). CAMEL stands for Capital Adequacy, Asset Quality, Management Efficiency, Earnings Ability and Liquidity. Each of these indicators are further discussed below.
2.2.1.1 Capital Adequacy Capital is one of the bank specific factors that influence the level of bank profitability. Capital is the amount of own fund available to support the bank's business and act as a buffer in case of adverse situation (Athanasoglou et al. 2005). Banks capital creates liquidity for the bank due to the fact that deposits are most fragile and prone to bank runs. Moreover, greater bank capital reduces the chance of distress (Diamond, 2000). However, it is not without drawbacks that it induce weak demand for liability, the cheapest sources of fund Capital adequacy is the level of capital required by the banks to enable them withstand the risks such as credit, market and operational risks they are exposed to in order to absorb the potential loses and protect the bank's debtors. According to Dang (2011), the adequacy of capital is judged on the basis of capital adequacy ratio (CAR). Capital adequacy ratio shows the internal strength of the bank to withstand losses during crisis. Capital adequacy ratio is directly proportional to the resilience of the bank to crisis situations. It has also a direct effect on the profitability of banks by determining its expansion to risky but profitable ventures or areas (Sangmi and Nazir, 2010).
2.2.1.2 Asset Quality The bank's asset is another bank specific variable that affects the profitability of a bank. The bank asset includes among others current asset, credit portfolio, fixed asset, and other investments. Often a growing asset (size) related to the age of the bank (Athanasoglou et al., 2005). More often than not the loan of a bank is the major asset that generates the major share of the banks income. Loan is the major asset of commercial banks from which they generate income. The quality of loan portfolio determines the profitability of banks. The loan portfolio quality has A direct bearing on bank profitability. The highest risk facing a bank is the losses derived from delinquent loans (Dang, 2011). Thus, nonperforming loan ratios are the best proxies for asset quality. Different types of financial ratios used to study the performances of banks by different scholars. It is the major concern of all commercial banks to keep the amount of nonperforming loans to low level. This is so because high nonperforming loan affects the profitability of the bank. Thus, low nonperforming loans to total loans shows that the good health of the portfolio a bank. The lower the ratio the better the bank performing (Sangmi and Nazir, 2010).
2.2.1.3 Management Efficiency Management Efficiency is one of the key internal factors that determine the bank profitability. It is represented by different financial ratios like total asset growth, loan growth rate and earnings growth rate. Yet, it is one of the complexes subject to capture with financial ratios. Moreover, operational efficiency in managing the operating expenses is another dimension for management quality. The performance of management is often expressed qualitatively through subjective evaluation of management systems, organizational discipline, control systems, quality of staff, and others. Yet, some financial ratios of the financial statements act as a proxy for management efficiency. The capability of the management to deploy its resources efficiently, income maximization, reducing operating costs can be measured by financial ratios. One of this ratios used to measure management quality is
Determinants of Financial Performance of Commercial Banks in Kenya
241
operating profit to income ratio (Rahman et al. in Ilhomovich, 2009; Sangmi and Nazir, 2010). The higher the operating profits to total income (revenue) the more the efficient management is in terms of operational efficiency and income generation. The other important ratio is that proxy management quality is expense to asset ratio. The ratio of operating expenses to total asset is expected to be negatively associated with profitability. Management quality in this regard, determines the level of operating expenses and in turn affects profitability (Athanasoglou et al. 2005).
2.2.1.4 Liquidity Management Liquidity is another factor that determines the level of bank performance. Liquidity refers to the ability of the bank to fulfill its obligations, mainly of depositors. According to Dang (2011) adequate level of liquidity is positively related with bank profitability. The most common financial ratios that reflect the liquidity position of a bank according to the above author are customer deposit to total asset and total loan to customer deposits. Other scholars use different financial ratio to measure liquidity. For instance Ilhomovich (2009) used cash to deposit ratio to measure the liquidity level of banks in Malaysia. However, the study conducted in China and Malaysia found that liquidity level of banks has no relationship with the performances of banks (Said and Tumin, 2011). 2.2.2 External Factors/ Macroeconomic Factors
The macroeconomic policy stability, Gross Domestic Product, Inflation, Interest Rate and Political instability are also other macroeconomic variables that affect the performances of banks. For instance, the trend of GDP affects the demand for banks asset. During the declining GDP growth the demand for credit falls which in turn negatively affect the profitability of banks. On the contrary, in a growing economy as expressed by positive GDP growth, the demand for credit is high due to the nature of business cycle. During boom the demand for credit is high compared to recession (Athanasoglou et al., 2005). The same authors state in relation to the Greek situation that the relationship between inflation level and banks profitability is remained to be debatable. The direction of the relationship is not clear (Vong and Chan, 2009). 2.3 Ownership Identity and Financial Performance
The study of the relationship between ownership and performance is one of the key issues in corporate governance which has been the subject of ongoing debate in the corporate finance literature. The relationship between firm performance and ownership identity, if any, emanate from Agency Theory. This theory deals with owners and manager’s relationship, which one way or the other refers to ownership and performance. In relation to performance according to Javid and Iqbal (2008), the identity of ownership matters more than the concentration of ownership. This is so because ownership identity shows the behavior and interests of the owners. Ongore (2011) argues that the risk-taking behavior and investment orientation of shareholders have great influence on the decisions of managers in the day-to-day affairs of firms. According to Ongore (2011), the concept of ownership can be defined along two lines of thought: ownership concentration and ownership mix. The concentration refers to proportion of shares held (largest shareholding) in the firm by few shareholders and the later defines the identity of the shareholders. Morck et al. in Wen (2010) explained that ownership concentration has two possible consequences. The dominant shareholders have the power and incentive to closely monitor the performances of the management. This in turn has two further consequences in relation to firm performance. On the one hand close monitoring of the management can reduce agency cost and enhance firm performance. On the other hand concentrated ownership can create a problem in relation to overlooking the right of the minority and also affect the innovativeness of the management (Ongore, 2011; Wen, 2010).
Concerning the relationship between ownership identity & bank performance different scholars came up with varying results. For instance according to Claessens et al., (1998) domestic banks' performance is superior compared to their foreign counterparts in developed countries. According to the same scholars the opposite is true in developing countries. Micco et al. in Wen (2010) also support the above argument in that in developing countries the performances of foreign banks is better compared with the other types of ownership in developing countries. However, Detragiache (2006) presented a different view about the foreign bank performance in relation to financial sector development, financial deepening, and credit creation in developing countries. He found that the performances of foreign banks compared to their domestic owned banks are inferior in developing countries. Ownership is one of the variables that affect the performance of banks. Specifically, ownership identity is one of the factors explaining the performances of banks across the
International Journal of Economics and Financial Issues, Vol. 3, No. 1, 2013, pp.237-252
242
board; yet the level & direction of its effect remained contentious. There are scholars who claimed that foreign firms perform better with high profit margins and low costs compared to domestic owned banks (Farazi et al., 2011). This is so because foreign owned firms are believed to have tested management expertise in other countries over years. Moreover, foreign banks often customize and apply their operation systems found effective at their home countries (Ongore, 2011). It is also assumed that banks crossing boundaries are often those big and successful ones. For instance in countries such as Thailand, Middle East and North Africa region, it was found that foreign banks performance is better than domestic counterparts (Azam and Siddiqui, 2012; Chantapong, 2005; Farazi et al. 2011). The study conducted in Pakistan by Azam and Siddiqui (2012) concluded that "...foreign banks are more profitable than all domestic banks regardless of their ownership structure by applying regression analysis." They further suggest that "...it is better for a multinational bank to establish a subsidiary/branch rather than acquiring an “existing player” in the host country." Moreover, Chantapong (2005) by studying domestic and foreign bank performance in Thailand concluded that foreign banks are more profitable than the average domestic banks profitability. It is also supported by Okuda and Rungsomboon (2004) that foreign owned banks in Thailand are found to be efficient compared to their domestic counterparts due to modernized business activities supported by technology, reduced costs associated with fee-based businesses and improved their operational efficiency. These indicate that in the area studied above foreign banks were found to be more profitable than their domestic counterparts. The major reason behind these assertions is that foreign banks were believed to be strong & efficient.
However, there are scholars who argue that domestic banks perform better then foreign banks. For instance (Cadet, 2008) stated that "... foreign banks are not always more efficient than domestic banks in developing countries, and even in a country with low income level." Yildirim and Philippatos in Chen and Lia (2009) also support the above view that foreign owned banks performed not better, even less than the domestic banks in relation to developing countries especially in Latin America. The study conducted in Turkey by Tufan et al. (2008) also found that domestic banks perform better than their foreign counterparts. There are also other scholars who argue that the performance of domestic and foreign banks varies from region to region. Claessens et al. (1998), for example, stated that foreign banks perform better in developing countries compared to when they are in developed countries. Thus, they conclude that domestic banks perform better in developed countries than when they are in developing countries. They further assert that an increase in the share of foreign banks leads to a lower profitability of domestic banks in developing countries. Thus, does ownership identity influence the performance of commercial banks? Studies have shown that bank performance can be affected by internal and external factors (Athanasoglou et al. 2005; Al-Tamimi, 2010; Aburime, 2005.) Moreover, the magnitude of the effect can be influenced by the decision of the management. The management decision, in turn, is affected by the interests of the owners which is determined by their investment preferences and risk appetite (Ongore, 2011). This implies the moderating role of ownership identity. This study attempted to examine whether ownership identity significantly moderate the relationship between commercial banks' financial performance and its determinants in Kenya or not. 2.4. Conceptual Framework
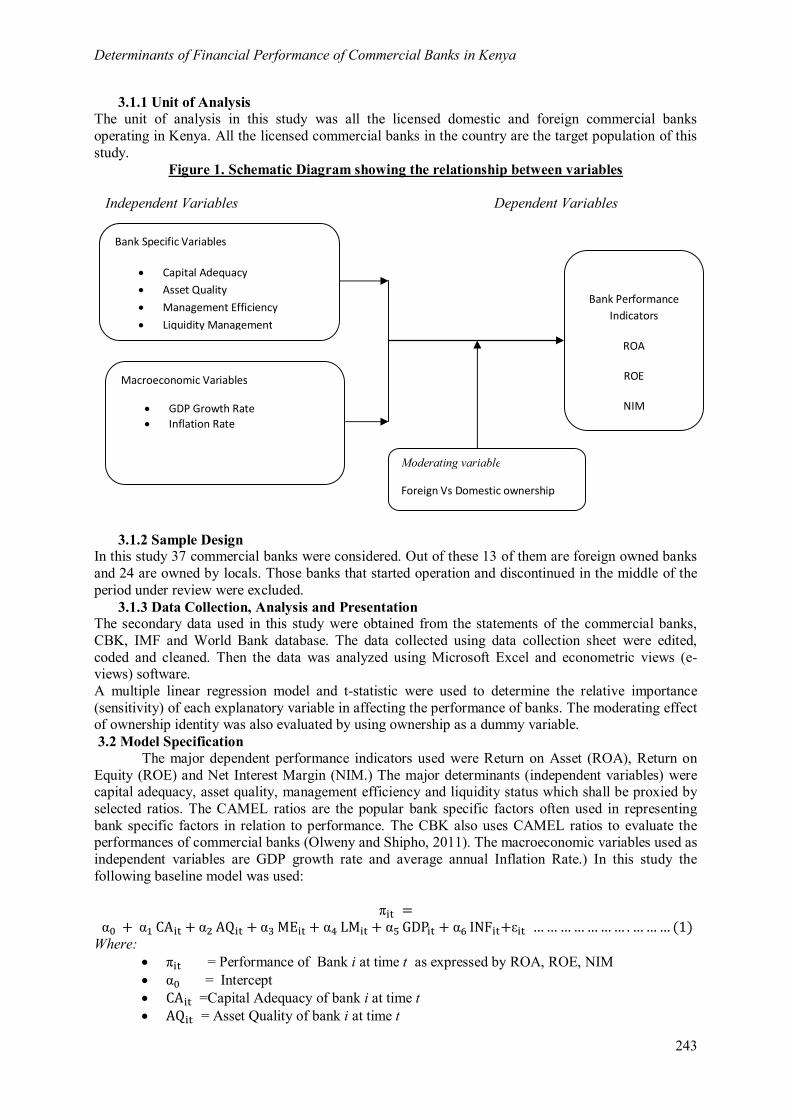
The conceptual framework is developed from the review of literature discussed above and presented in the following diagram (figure 1). It shows the relationship between the dependent (ROA, ROE, NIM) and explanatory (bank specific and macroeconomic) variables. It also demonstrates the moderating role of ownership identity.
3. Research Methodology 3.1 Research Design
This explanatory study is based on secondary data obtained from published statements of accounts of all commercial banks in Kenya, CBK, IMF and World Bank publications for ten years from 2001 to 2010. It uses panel data due to the advantage that it has. It helps to study the behavior of each bank over time and across space (Baltagi, 2005; Gujarati, 2003).
Determinants of Financial Performance of Commercial Banks in Kenya
243
3.1.1 Unit of Analysis The unit of analysis in this study was all the licensed domestic and foreign commercial banks operating in Kenya. All the licensed commercial banks in the country are the target population of this study.
Figure 1. Schematic Diagram showing the relationship between variables Independent Variables Dependent Variables
3.1.2 Sample Design In this study 37 commercial banks were considered. Out of these 13 of them are foreign owned banks and 24 are owned by locals. Those banks that started operation and discontinued in the middle of the period under review were excluded.
3.1.3 Data Collection, Analysis and Presentation The secondary data used in this study were obtained from the statements of the commercial banks, CBK, IMF and World Bank database. The data collected using data collection sheet were edited, coded and cleaned. Then the data was analyzed using Microsoft Excel and econometric views (e-views) software. A multiple linear regression model and t-statistic were used to determine the relative importance (sensitivity) of each explanatory variable in affecting the performance of banks. The moderating effect of ownership identity was also evaluated by using ownership as a dummy variable. 3.2 Model Specification
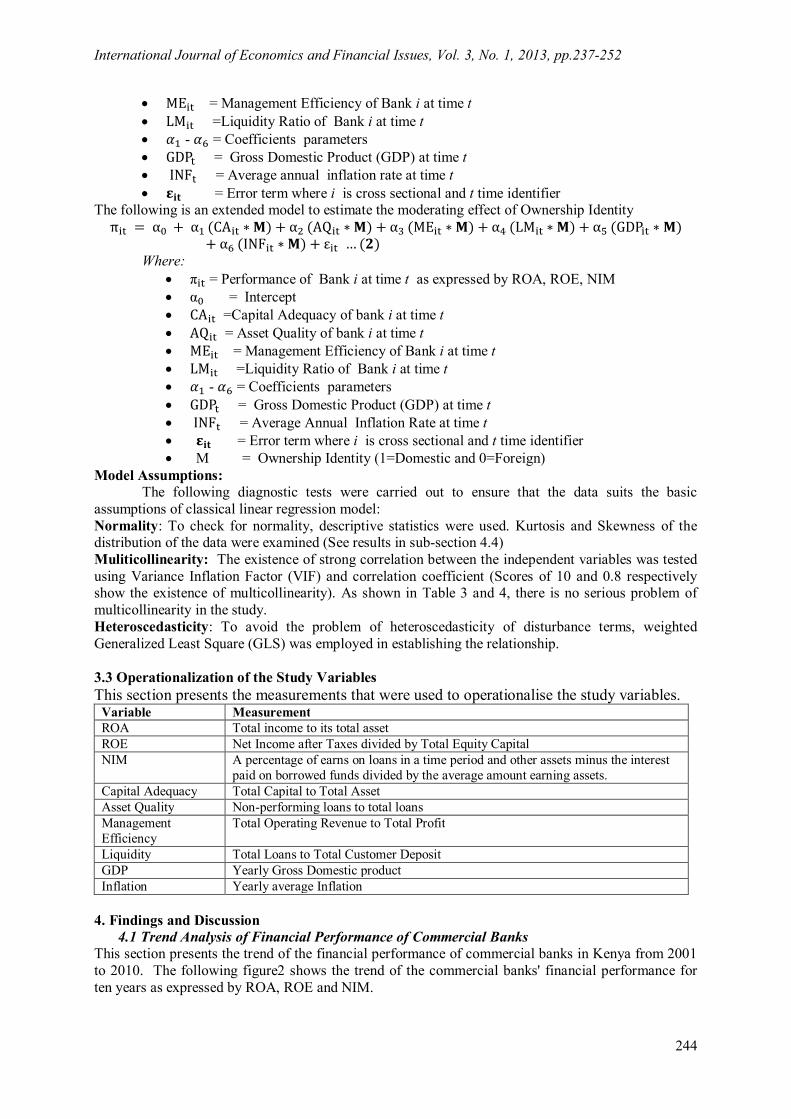
The major dependent performance indicators used were Return on Asset (ROA), Return on Equity (ROE) and Net Interest Margin (NIM.) The major determinants (independent variables) were capital adequacy, asset quality, management efficiency and liquidity status which shall be proxied by selected ratios. The CAMEL ratios are the popular bank specific factors often used in representing bank specific factors in relation to performance. The CBK also uses CAMEL ratios to evaluate the performances of commercial banks (Olweny and Shipho, 2011). The macroeconomic variables used as independent variables are GDP growth rate and average annual Inflation Rate.) In this study the following baseline model was used:
π =
α +α CA + α AQ + α ME + α LM + α GDP + α INF +ε ………………… .………(1) Where:
π = Performance of Bank i at time t as expressed by ROA, ROE, NIM α = Intercept CA =Capital Adequacy of bank i at time t AQ = Asset Quality of bank i at time t
Moderating variable
Foreign Vs Domestic ownership
Bank Specific Variables
Capital Adequacy Asset Quality Management Efficiency Liquidity Management
Macroeconomic Variables
GDP Growth Rate Inflation Rate
Bank Performance Indicators
ROA
ROE
NIM
International Journal of Economics and Financial Issues, Vol. 3, No. 1, 2013, pp.237-252
244
ME = Management Efficiency of Bank i at time t LM =Liquidity Ratio of Bank i at time t 훼 - 훼 = Coefficients parameters GDP = Gross Domestic Product (GDP) at time t INF = Average annual inflation rate at time t 훆퐢퐭 = Error term where i is cross sectional and t time identifier
The following is an extended model to estimate the moderating effect of Ownership Identity π = α +α (CA ∗ 퐌) + α (AQ ∗ 퐌) + α (ME ∗ 퐌) + α (LM ∗퐌) + α (GDP ∗ 퐌)
+ α (INF ∗ 퐌) + ε … (ퟐ) Where:
π = Performance of Bank i at time t as expressed by ROA, ROE, NIM α = Intercept CA =Capital Adequacy of bank i at time t AQ = Asset Quality of bank i at time t ME = Management Efficiency of Bank i at time t LM =Liquidity Ratio of Bank i at time t 훼 - 훼 = Coefficients parameters GDP = Gross Domestic Product (GDP) at time t INF = Average Annual Inflation Rate at time t 훆퐢퐭 = Error term where i is cross sectional and t time identifier M = Ownership Identity (1=Domestic and 0=Foreign)
Model Assumptions: The following diagnostic tests were carried out to ensure that the data suits the basic
assumptions of classical linear regression model: Normality: To check for normality, descriptive statistics were used. Kurtosis and Skewness of the distribution of the data were examined (See results in sub-section 4.4) Muliticollinearity: The existence of strong correlation between the independent variables was tested using Variance Inflation Factor (VIF) and correlation coefficient (Scores of 10 and 0.8 respectively show the existence of multicollinearity). As shown in Table 3 and 4, there is no serious problem of multicollinearity in the study. Heteroscedasticity: To avoid the problem of heteroscedasticity of disturbance terms, weighted Generalized Least Square (GLS) was employed in establishing the relationship. 3.3 Operationalization of the Study Variables This section presents the measurements that were used to operationalise the study variables.
Variable Measurement ROA Total income to its total asset ROE Net Income after Taxes divided by Total Equity Capital NIM A percentage of earns on loans in a time period and other assets minus the interest
paid on borrowed funds divided by the average amount earning assets. Capital Adequacy Total Capital to Total Asset Asset Quality Non-performing loans to total loans Management Efficiency
Total Operating Revenue to Total Profit
Liquidity Total Loans to Total Customer Deposit GDP Yearly Gross Domestic product Inflation Yearly average Inflation
4. Findings and Discussion
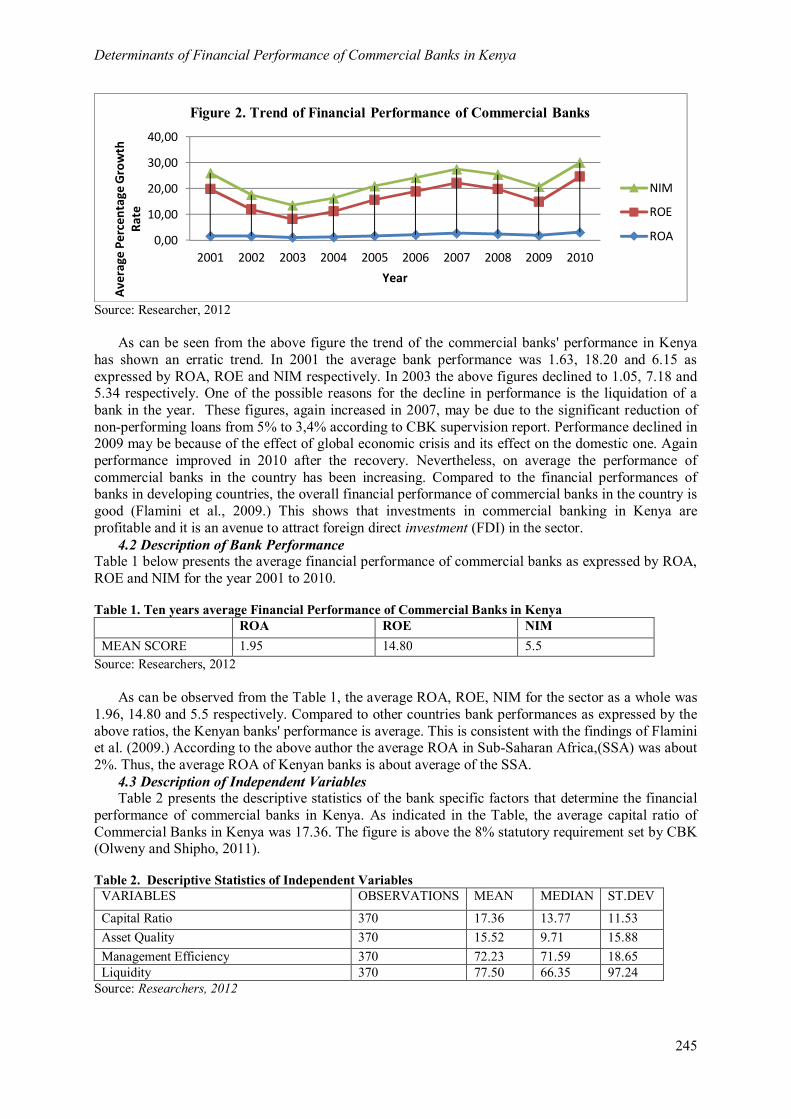
4.1 Trend Analysis of Financial Performance of Commercial Banks This section presents the trend of the financial performance of commercial banks in Kenya from 2001 to 2010. The following figure2 shows the trend of the commercial banks' financial performance for ten years as expressed by ROA, ROE and NIM.
Determinants of Financial Performance of Commercial Banks in Kenya
245
Source: Researcher, 2012
As can be seen from the above figure the trend of the commercial banks' performance in Kenya has shown an erratic trend. In 2001 the average bank performance was 1.63, 18.20 and 6.15 as expressed by ROA, ROE and NIM respectively. In 2003 the above figures declined to 1.05, 7.18 and 5.34 respectively. One of the possible reasons for the decline in performance is the liquidation of a bank in the year. These figures, again increased in 2007, may be due to the significant reduction of non-performing loans from 5% to 3,4% according to CBK supervision report. Performance declined in 2009 may be because of the effect of global economic crisis and its effect on the domestic one. Again performance improved in 2010 after the recovery. Nevertheless, on average the performance of commercial banks in the country has been increasing. Compared to the financial performances of banks in developing countries, the overall financial performance of commercial banks in the country is good (Flamini et al., 2009.) This shows that investments in commercial banking in Kenya are profitable and it is an avenue to attract foreign direct investment (FDI) in the sector.
4.2 Description of Bank Performance Table 1 below presents the average financial performance of commercial banks as expressed by ROA, ROE and NIM for the year 2001 to 2010. Table 1. Ten years average Financial Performance of Commercial Banks in Kenya
ROA ROE NIM MEAN SCORE 1.95 14.80 5.5
Source: Researchers, 2012
As can be observed from the Table 1, the average ROA, ROE, NIM for the sector as a whole was 1.96, 14.80 and 5.5 respectively. Compared to other countries bank performances as expressed by the above ratios, the Kenyan banks' performance is average. This is consistent with the findings of Flamini et al. (2009.) According to the above author the average ROA in Sub-Saharan Africa,(SSA) was about 2%. Thus, the average ROA of Kenyan banks is about average of the SSA.
4.3 Description of Independent Variables Table 2 presents the descriptive statistics of the bank specific factors that determine the financial
performance of commercial banks in Kenya. As indicated in the Table, the average capital ratio of Commercial Banks in Kenya was 17.36. The figure is above the 8% statutory requirement set by CBK (Olweny and Shipho, 2011). Table 2. Descriptive Statistics of Independent Variables
VARIABLES OBSERVATIONS MEAN MEDIAN ST.DEV
Capital Ratio 370 17.36 13.77 11.53 Asset Quality 370 15.52 9.71 15.88 Management Efficiency 370 72.23 71.59 18.65 Liquidity 370 77.50 66.35 97.24
Source: Researchers, 2012
0,00
10,00
20,00
30,00
40,00
2001 2002 2003 2004 2005 2006 2007 2008 2009 2010
Aver
age
Perc
enta
ge G
row
th
Rate
Year
Figure 2. Trend of Financial Performance of Commercial Banks
NIM
ROE
ROA
International Journal of Economics and Financial Issues, Vol. 3, No. 1, 2013, pp.237-252
246
This shows that the Kenyan commercial banks hold more capital than required. This could imply that banks could prefer less risky investment, which results in lower profit. The average asset quality of the commercial banking sector in the stated period was as high as 15.52. This shows the existence of high exposure to credit risk and the relationship is expected to be negative with profit. Another important factor, management efficiency, proxied by operating income to total income was 72.23 on average. It shows that in Kenya more than 70% of commercial banks income is derived from the conventional intermediation (operating) function.
The Table also shows that the average total loans to total deposit were 77.50%. This indicates that commercial banks in Kenya use 77.50% of customer deposit for on lending. This shows that banks keep more than the statutory liquidity requirement. Customer deposit is one of the cheapest sources of fund due to the high margin between deposit and lending rate that banks utilize to generate income. Moreover, the figure shows that commercial banks in the country target domestic resources, mainly customer deposit, for their banking business.
4.4 Test for Robustness of the Model To check for normality Jarque-Bera test (JB) was applied. It is a test based on residuals of the least squares regression model. The following formula was used to test for the normality:
퐽퐵 = 푁[푠6+(퐾 − 3)
24]
Where: N=sample size, S=skewness coefficient and K=kurtosis coefficient.
For normal distribution JB statistics is expected to be zero (Guajarati, 2007). In this study JB statistics was 0.09 with skewness of 0.14 and kurtosis of 3.38. Thus, the JB is very close to zero and that the variables are very close to normal distribution.
The existence of the problem of multicollinearity was tested using correlation coefficient test and VIF. Correlation above 0.8 between independent variables indicates the existence of the problem of multicollinearity (Guajarati, 2007.) As can be seen from the Table 3 there is no serious multicollinearity problem. All the correlation coefficients between the independent variables were less than 0.8 Table 3. Correlation Coefficient between variables
CAPITAL RATIO
ASSET QUALITY
MANAGEMENT EFFICIENCY
LIQUIDITY
Capital Ratio 1.0000 Asset Quality 0.5674 1.0000 Management Efficiency
0.3145 0.2383 1.0000
Liquidity 0.7997 0.5419 0.3180 1.0000 Source: Researchers, 2012
Furthermore VIF above 10 shows the existence of multicollinearity (Guajarati, 2007.) According to this author, as a rule of thumb, if the VIF of a variable exceeds 10, which will happen if R2i exceeds 0.90, that variable is said to be highly collinear. As can be seen from the following Table 4 that presented the VIF of the variables, none of them is above 10. This shows that there is no problem of multicollinearity in this analysis.
The other assumption of the model was about heteroscedasticity. To avoid the problem of heteroscedasticity of the disturbance term in the analysis GLS method was preferred to OLS. The GLS assigns weight to each observation and capable of producing estimators that are Best, Linear, Unbiased and Efficient (BLUE) (Gujarati, 2003). Thus, there is no problem of heteroscedasticity in the regression results.
Determinants of Financial Performance of Commercial Banks in Kenya
247
Table 4. Variance Inflation Factor of Variables VARIABLES
COEFFICIENT OF DETERMINATION ON OTHER REPRESSORS AND VIF
R2 VIF Capital Ratio 0.83 3.21 Asset Quality 0.44 1.24 Management Efficiency 0.86 3.84 Liquidity 0.68 1.86 GDP 0.07 1.00 Inflation 0.08 1.01
Source: Researchers, 2012 4.5 The Relationship between Bank Performance and Its Determinants
This section presents the relationship between the identified bank specific factors and its relationship with bank performance as expressed by ROA, ROE and NIM. The relationship was explained by the parameter coefficients between the explanatory and explained variables. The coefficients shows the magnitude and direction of the relationships, whether it is strong, weak positive or negative. The higher the values the stronger the relationship, and the smaller the coefficient is an indicator of a weak relationship. The sign also shows the direction of the relationship. The positive sign shows a positive relationship and the negative shows the opposite. Table 5. Correlation Coefficient between Variables
VARIABLES ROA ROE NIM Capital Ratio 0.035082 -0.350220 0.061121 Asset Quality -0.097720 -0.319185 -0.035547 Mgt Efficiency 0.032879 0.193528 0.024611 Liquidity 0.000177 0.005010 0.000263 GDP -0.045980 0.003932 -0.070564 Inflation -0.054978 -0.290817 -0.041615
Source: Researchers, 2012
Table 5 shows the relationship between the dependent and independent variables. As can be seen from the Table capital ratio is positively related to ROA and NIM. This relationship may indicate that banks face no volatility in earnings due to leverage. However, capital ratio has a negative relationship with ROE. This is in line with the conventional argument that higher capital ratios encourage banks to invest in safer assets, such as lower-risk loans or securities, which may affect bank performance (Bouwman, 2009).
Asset quality which is expressed as non-performing loans to total loans is negatively related to all the three bank performance indicators. This indicates that poor asset quality or high non-performing loans to total asset related to poor bank performance. The negative correlation coefficient between poor asset quality and return on equity is very strong. This is due to the fact that loan constitutes the largest share of assets that generate income for the investment (equity). The other explanatory variable, management efficiency is positively related to all the three performance ratios and more strongly related to ROE. Liquidity management is also positively related to ROA, ROE and NIM but the relationship is very weak. This may be due to the fact that liquidity management is more related with fulfilling depositors’ obligation (safeguarding depositors) than investment.
The type of relationship between gross domestic product and bank performance is mixed. It seems that it is negatively related to ROA and positively related to ROE. However, in both cases the relationship is not significant. However, it is significantly negatively related to NIM. This relationship supports the view that GDP growth is not necessarily positively related with bank performance (Flamini et al. 2009). This seems to be in line with the fact that Sub-Saharan/developing country banks perform better than the developed country ones. The other macroeconomic variable, inflation is significantly negatively related with the performances of commercial banks. This is probably due to
International Journal of Economics and Financial Issues, Vol. 3, No. 1, 2013, pp.237-252
248
the fact that inflation could affect the value for money, purchasing power of people and the real interest rate that banks charge and receive. 4.6 Regression Results
The following regression result shows the effect of bank specific and macroeconomic factors on the performance of commercial banks. The first objective of this study was to answer whether bank specific factors affect the performance of commercial banks in Kenya or not. At the outset it was hypothesized that bank specific factors significantly affect the performance of commercial banks. Thus, the first hypothesis was that bank specific factors affect the performances of commercial banks in Kenya. The following Table 6 presents the regression results of the study. Table 6. Regression Output of Bank Specific Factors
VARIABLES
MODEL 1 (ROA)
MODEL 2 (ROE)
MODEL 3 (NIM)
Constant 1.237852 (3.468773)*
13.93189 (6.317538)*
3.776651 (11.06329)*
Capital Ratio 0.035082 (2.836691)**
-0.350220 (-5.922229)*
0.061121 (9.191437)*
Asset Quality -0.097720 (-12.91408)*
-0.319185 (-7.915126)*
-0.035547 (-7.483690)*
Management Efficiency 0.032879 (8.984467)*
0.193528 (7.362248)*
0.024611 (5.924266)*
Liquidity 0.000177 (0.091713)NS
0.005010 (0.698608)NS
0.000263 (0.258960)NS
GDP -0.045980 (-1.366994)NS
0.003932 (-0.018262)NS
-0.070564 (-2.605582)**
Inflation -0.054978 (-3.012167)**
-0.290817 (-2.482634)***
-0.041615 (-2.826572)**
Observation 370 370 370 R2 0.638823 0.567085 0.890327 Adjusted R2 0.632853 0.559929 0.888514
Method: GLS (Cross Section Weights) Note The figures in parentheses are t-Statistics * Statistically significant at the 1% level ** Statistically significant at the 5% level *** Statistically significant at the 10% level NS Statistically not significant Source: Researchers, 2012
As presented in Table 6, bank specific factors affect the performances of commercial banks
with a minimum of 95% confidence level. The above results thus leads to the rejection of Hypothesis H01 that there is a significant effect of the of bank specific factors on the financial performance of commercial banks. This hypothesis can be rejected with 95% confidence level. However, the liquidity variable as one of the bank specific factor, which is positively related with bank performance, has no significant effect on the financial performance of commercial banks in Kenya.
The second objective of this study was to examine whether macroeconomic variables affect the performances of commercial banks in Kenya. It was hypothesized that macroeconomic factors have no significantly effect on the financial performances of commercial banks in Kenya. As can be seen from Table 4.6 above the regression output shows mixed results. The effect of GDP on ROA and ROE is not significant. Moreover, the effect of inflation on bank performance is not very strong. Thus, hypothesis H02 can be accepted with 99 % confidence level. However, it was inconclusive at 95% confidence level.
The other objective of this study was to evaluate the moderating effect of ownership identity on the performance of commercial banks in Kenya. Table 7 presents the output of the regression analysis after being moderated by the ownership identity (domestic vis-à-vis foreign.)
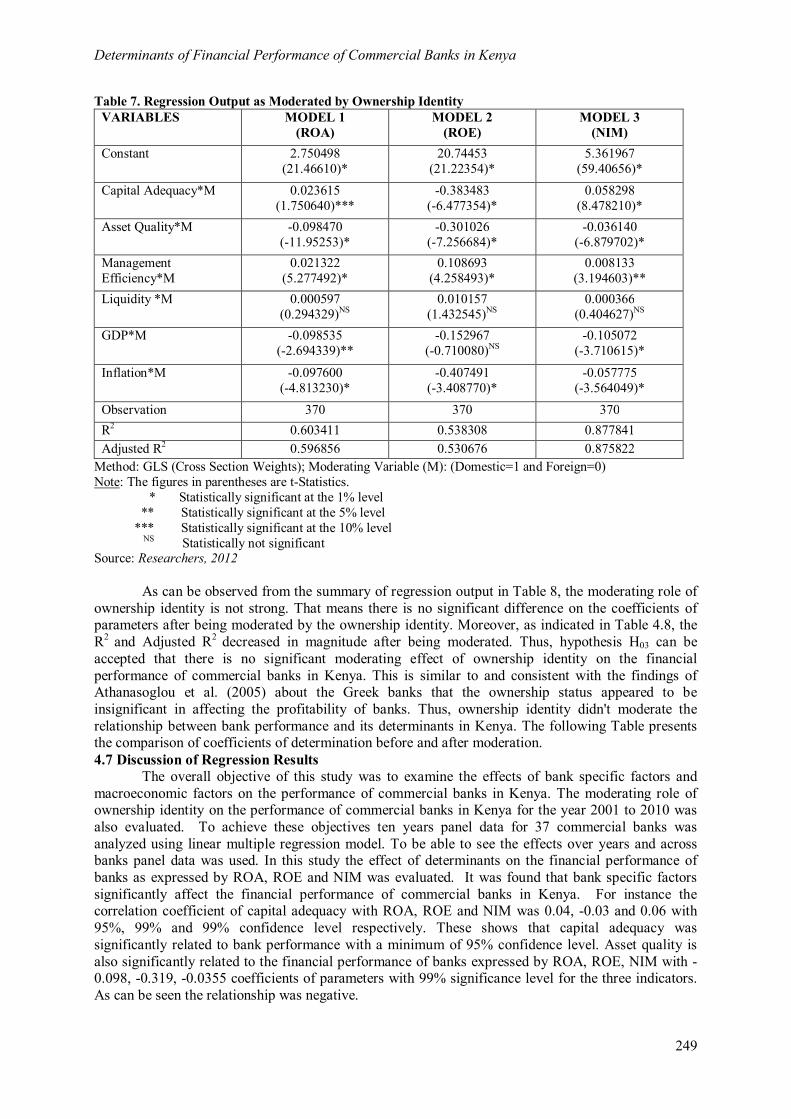
Determinants of Financial Performance of Commercial Banks in Kenya
249
Table 7. Regression Output as Moderated by Ownership Identity VARIABLES MODEL 1
(ROA) MODEL 2
(ROE) MODEL 3
(NIM) Constant 2.750498
(21.46610)* 20.74453
(21.22354)* 5.361967
(59.40656)* Capital Adequacy*M 0.023615
(1.750640)*** -0.383483
(-6.477354)* 0.058298
(8.478210)* Asset Quality*M -0.098470
(-11.95253)* -0.301026
(-7.256684)* -0.036140
(-6.879702)* Management Efficiency*M
0.021322 (5.277492)*
0.108693 (4.258493)*
0.008133 (3.194603)**
Liquidity *M 0.000597 (0.294329)NS
0.010157 (1.432545)NS
0.000366 (0.404627)NS
GDP*M -0.098535 (-2.694339)**
-0.152967 (-0.710080)NS
-0.105072 (-3.710615)*
Inflation*M -0.097600 (-4.813230)*
-0.407491 (-3.408770)*
-0.057775 (-3.564049)*
Observation 370 370 370 R2 0.603411 0.538308 0.877841 Adjusted R2 0.596856 0.530676 0.875822
Method: GLS (Cross Section Weights); Moderating Variable (M): (Domestic=1 and Foreign=0) Note: The figures in parentheses are t-Statistics. * Statistically significant at the 1% level ** Statistically significant at the 5% level *** Statistically significant at the 10% level NS Statistically not significant Source: Researchers, 2012
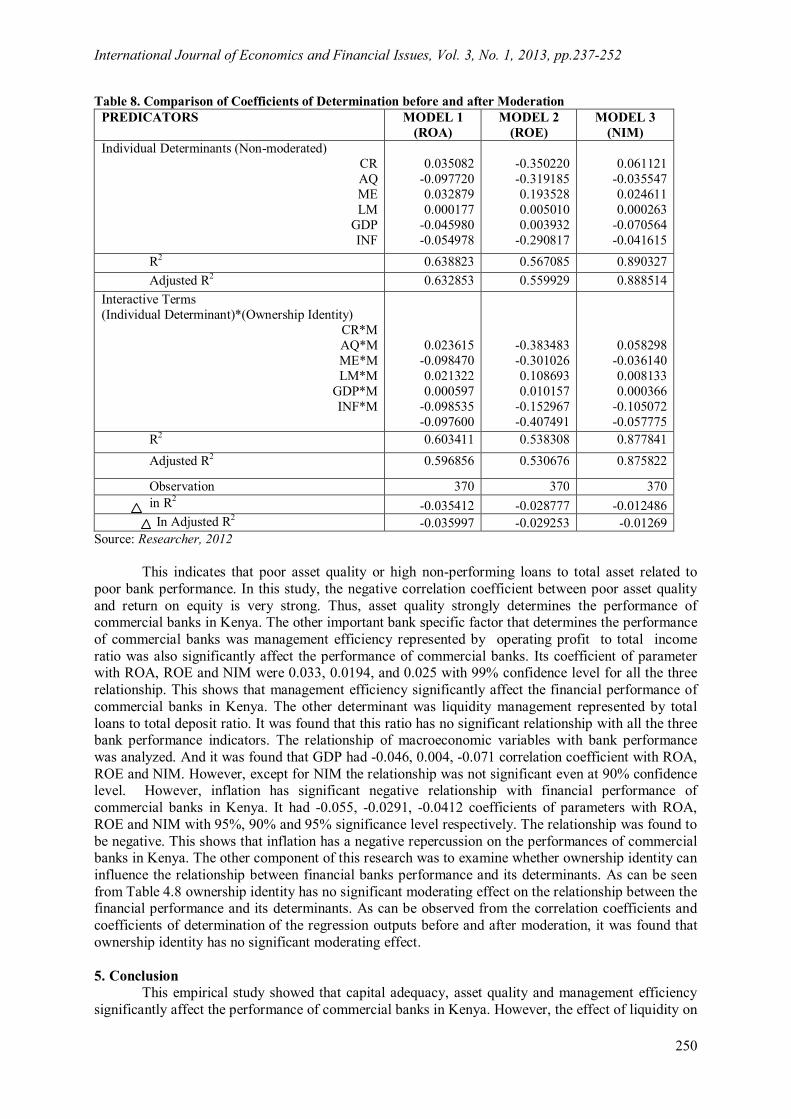
As can be observed from the summary of regression output in Table 8, the moderating role of ownership identity is not strong. That means there is no significant difference on the coefficients of parameters after being moderated by the ownership identity. Moreover, as indicated in Table 4.8, the R2 and Adjusted R2 decreased in magnitude after being moderated. Thus, hypothesis H03 can be accepted that there is no significant moderating effect of ownership identity on the financial performance of commercial banks in Kenya. This is similar to and consistent with the findings of Athanasoglou et al. (2005) about the Greek banks that the ownership status appeared to be insignificant in affecting the profitability of banks. Thus, ownership identity didn't moderate the relationship between bank performance and its determinants in Kenya. The following Table presents the comparison of coefficients of determination before and after moderation. 4.7 Discussion of Regression Results
The overall objective of this study was to examine the effects of bank specific factors and macroeconomic factors on the performance of commercial banks in Kenya. The moderating role of ownership identity on the performance of commercial banks in Kenya for the year 2001 to 2010 was also evaluated. To achieve these objectives ten years panel data for 37 commercial banks was analyzed using linear multiple regression model. To be able to see the effects over years and across banks panel data was used. In this study the effect of determinants on the financial performance of banks as expressed by ROA, ROE and NIM was evaluated. It was found that bank specific factors significantly affect the financial performance of commercial banks in Kenya. For instance the correlation coefficient of capital adequacy with ROA, ROE and NIM was 0.04, -0.03 and 0.06 with 95%, 99% and 99% confidence level respectively. These shows that capital adequacy was significantly related to bank performance with a minimum of 95% confidence level. Asset quality is also significantly related to the financial performance of banks expressed by ROA, ROE, NIM with -0.098, -0.319, -0.0355 coefficients of parameters with 99% significance level for the three indicators. As can be seen the relationship was negative.
International Journal of Economics and Financial Issues, Vol. 3, No. 1, 2013, pp.237-252
250
Table 8. Comparison of Coefficients of Determination before and after Moderation PREDICATORS MODEL 1
(ROA) MODEL 2
(ROE) MODEL 3
(NIM) Individual Determinants (Non-moderated)
CR AQ
ME LM
GDP INF
0.035082
-0.097720 0.032879 0.000177
-0.045980 -0.054978
-0.350220 -0.319185 0.193528 0.005010 0.003932
-0.290817
0.061121
-0.035547 0.024611 0.000263
-0.070564 -0.041615
R2 0.638823 0.567085 0.890327 Adjusted R2 0.632853 0.559929 0.888514
Interactive Terms (Individual Determinant)*(Ownership Identity)
CR*M AQ*M
ME*M LM*M
GDP*M INF*M
0.023615 -0.098470 0.021322 0.000597
-0.098535 -0.097600
-0.383483 -0.301026 0.108693 0.010157
-0.152967 -0.407491
0.058298 -0.036140 0.008133 0.000366
-0.105072 -0.057775
R2 0.603411 0.538308 0.877841 Adjusted R2 0.596856 0.530676 0.875822
Observation 370 370 370 in R2 -0.035412 -0.028777 -0.012486 In Adjusted R2 -0.035997 -0.029253 -0.01269
Source: Researcher, 2012
This indicates that poor asset quality or high non-performing loans to total asset related to poor bank performance. In this study, the negative correlation coefficient between poor asset quality and return on equity is very strong. Thus, asset quality strongly determines the performance of commercial banks in Kenya. The other important bank specific factor that determines the performance of commercial banks was management efficiency represented by operating profit to total income ratio was also significantly affect the performance of commercial banks. Its coefficient of parameter with ROA, ROE and NIM were 0.033, 0.0194, and 0.025 with 99% confidence level for all the three relationship. This shows that management efficiency significantly affect the financial performance of commercial banks in Kenya. The other determinant was liquidity management represented by total loans to total deposit ratio. It was found that this ratio has no significant relationship with all the three bank performance indicators. The relationship of macroeconomic variables with bank performance was analyzed. And it was found that GDP had -0.046, 0.004, -0.071 correlation coefficient with ROA, ROE and NIM. However, except for NIM the relationship was not significant even at 90% confidence level. However, inflation has significant negative relationship with financial performance of commercial banks in Kenya. It had -0.055, -0.0291, -0.0412 coefficients of parameters with ROA, ROE and NIM with 95%, 90% and 95% significance level respectively. The relationship was found to be negative. This shows that inflation has a negative repercussion on the performances of commercial banks in Kenya. The other component of this research was to examine whether ownership identity can influence the relationship between financial banks performance and its determinants. As can be seen from Table 4.8 ownership identity has no significant moderating effect on the relationship between the financial performance and its determinants. As can be observed from the correlation coefficients and coefficients of determination of the regression outputs before and after moderation, it was found that ownership identity has no significant moderating effect. 5. Conclusion
This empirical study showed that capital adequacy, asset quality and management efficiency significantly affect the performance of commercial banks in Kenya. However, the effect of liquidity on
Determinants of Financial Performance of Commercial Banks in Kenya
251
the performance of commercial banks is not strong. The relationship between bank performance and capital adequacy and management efficiency was found to be positive and for asset quality the relationship was negative. This indicates that poor asset quality or high non-performing loans to total asset related to poor bank performance. Thus, it is possible to conclude that banks with high asset quality and low non-performing loan are more profitable than the others. The other bank specific factor liquidity management represented by liquidity ratio was found to have no significant effect on the performance of commercial banks in Kenya. This shows that performance is not as such about keeping high liquid asset; rather it is about asset quality, capital adequacy, efficiency and others. But, this doesn't mean that liquidity status of banks has no effect at all. Rather it means that liquidity has lesser effect on performance of commercial banks in the study period in Kenya. Thus, it is possible to conclude that those bank managers who invest their liquid assets can generate income and boost their performance. The direction and effect of macroeconomic variables on the performance of commercial banks in Kenya was inconclusive. It was found that GDP had a negative correlation with ROA and NIM and positive with ROE. Moreover, the relationship was not significant. However, the other macroeconomic variable, inflation, had relatively strong negative correlation with financial performance of commercial banks in Kenya compared to GDP. This shows that inflation affects negatively the profitability of commercial banks in Kenya for the period under study. Thus, it is possible to state that the effect of macroeconomic variables on the performance of commercial banks in Kenya for the year 2001 to 2010 was inconclusive. The moderating role of ownership identity on the overall performance of commercial banks in Kenya was not significant. Thus, it is possible to conclude that the interaction effect of ownership identity on the financial performance of commercial banks in Kenya was not significant. In general, it can be concluded from this empirical study that bank specific factors (factors under the control of managers) are the most significant determinants of the financial performance of commercial banks in Kenya. This evidence supports and is in line with the Efficiency Structure theory which states that enhanced managerial efficiency leads to higher performance. References Aburime, U. (2005) Determinants of Bank Profitability: Company-Level Evidence from Nigeria.
Nigeria: University of Nigeria, Enugu Campus. Alexandru, C., Genu, G., Romanescu, M.L. (2008), The Assessment of Banking Performances-
Indicators of Performance in Bank Area. MPRA Paper No. 11600. Al-Tamimi, H., Hassan, A. (2010) Factors Infuluncing Performance of the UAE Islamic and
Conventional National Banks. . Department of Accounting, Finance and Economics, College of Business Administration, University of Sharjah.
Athanasoglou, P.P., Sophocles, N.B., Matthaios, D.D. (2005) Bank-specific, industry-specific and macroeconomic determinants of bank profitability . Working paper, Bank of Greece. 1(1), 3-4.
Azam, M., Siddiqoui, S. (2012) Domestic and Foreign Banks’ Profitability: Differences and Their Determinants. International Journal of Economics and Financial Issues 2(1), 33-40.
Baltagi, B.H. (2005) Econometric Analysis of Panel Data . England: John Wiley & Sons Ltd, The Atrium, Southern Gate, Chichester, West Sussex PO19 8SQ.
Baral, K.J. (2005) Health Check-up of Commercial Banks in the Framework of CAMEL: A Case Study of Joint Venture Banks in Nepal. The Journal of Nepalese Business Studies 2(1) 14-35.
Central Bank of Kenya (2011) Bank Supervision Annual Report, Kenya. Chantapong, S. (2005) Comparative Study of Domestic and Foreign Bank Performance in Thailand:
The Regression Analysis. The Office of Macroeconomic Policy and Analysis, Monetary Policy Group (MPG), The Central Bank of Thailand, Bangkhunprom, 2005.
Chen, S., Chien-Chang, L. (2009). Are Foreign Banks more Profitable than Domestic Banks? Home- and Host-Country Effects of Banking Market Structure, Governance, and Supervision.
Claessens, S., Hore, N. (2012) Foreign Banks: Trends, Impact and Financial Stability. IMF Working Paper, Research Department.
Claessens, S. Asli, D., Harry, H. (1998) How Does Foreign Entry Affect the Domestic Banking Market? Revised: May 1998.
Dang, Uyen. ( 2011) The CAMEL Rating System in Banking Supervision: a Case Study of Arcada University of Applied Sciences, International Business.
International Journal of Economics and Financial Issues, Vol. 3, No. 1, 2013, pp.237-252
252
Detragiache, E., Poonam, G., Thierry, T. (2006) Foreign Banks in Poor Countries: Theory and Evidence. Washington, DC: Paper presented at the 7th Jacques Polak Annual Research Conference, Hosted by the International Monetary Fund
Farazi, S., Erik, F., Roberto, R. (2011) Bank Ownership and Performance in the Middle East and North Africa Region. . The World Bank Middle East and North Africa Region Financial and Private Sector Development Unit & Financial and Private Secto.
Flamini, C., Valentina C., McDonald, G., Liliana, S. (2009) The Determinants of Commercial Bank Profitability in Sub-Saharan Africa. IMF Working Paper.
FSD (2009) Costs of Collateral in Kenya Opportunities for reform. Diamond, D.W., Raghuram, A. (2000) A Theory of Bank Capital. The Journal of Finance 52(6), 12-
23. Gujarati, D.N. (2003) Basic Econometrics. United States Military Academy, West Point. Published by
McGraw-HiII/lrwin, a business unit of The McGraw-Hili Companies, Inc. 1221 Avenue of the Americas, New York, NY, 10020.
Gul, S., Faiza, I., Khalid, Z. (2011) Factors Affecting Bank Profitability in Pakistan. The Romanian Economic Journal, 2(3), 6-9.
Heffernan, S. (1996) Modern banking in Theory and Practice. England: Published by John Wiley & Sons Ltd,West Sussex PO19 1UD.
Ilhomovich, S.E. (2009) Factors affecting the performance of foreign banks in Malaysia. . Malaysia: A thesis submitted to the fulfillment of the requirements for the degree Master of Science (Banking) College of Business (Finance and Banking.)
Ismi, A. (2004) Impoverishing a Continent: The World Bank and the IMF in Africa. 2004. www.asadismi.ws
Khrawish, H.A. (2011) Determinants of Commercial Banks Performance: Evidence from Jordan. International Research Journal of Finance and Economics. Zarqa University, 5(5), 19-45.
Marshall, J. (2009) The financial crisis in the US: key events, causes and responses, Research Paper 09/34, http://www.parliament.uk
Murthy, Y., Sree, R. (2003) A Study on Financial Ratios of major Commercial Banks . Research Studies, College of Banking & Financial Studies, Sultanate of Oman.
Oloo, O. (2010) Banking Survey Report, The best banks this decade 2000-2009 , Think Business Limited, Kenya, www.bankingsurvey.co.ke
Oloo, O. (2011) Banking Survey Report, The best banks this decade 2001-2010, Think Business Limited, Kenya, www.bankingsurvey.co.ke
Olweny, T., Shipho, T.M. (2011) Effects of Banking Sectoral Factors on the Profitability of Commercial Banks in Kenya. Economics and Finance Review, 1(5), 1-30.
Ongore, V.O. (2011) The relationship between ownership structure and firm performance: An empirical analysis of listed companies in Kenya. African Journal of Business Management, 5(6), 2120-2128.
Rungsomboon, S., Okuda, H. (2004) Comparative Cost Study of Foreign and Thai Domestic Banks 1990–2002, CEI Working Paper Series, 20(19), Center for Economic Institutions.
Said, R.M., Mohd, H.T. (2011) Performance and Financial Ratios of Commercial Banks in Malaysia and China.
Sangmi, M., Tabassum, N. (2010). Analyzing Financial Performance of Commercial Banks in India: Application of CAMEL Model. Pakistan Journal Commercial Social Sciences.
Shekhar, K., Lekshmy, S. (2007) Banking Theory and Practice, 20th ed,. VIKAS publshig House, New Delhi.
Tufan, E., Bahattin H., Mirela C., Laura, G.V. (2008) Multi-criteria evaluation of domestic and foreign banks in Turkey by using financial ratios, Banks and Bank Systems Journal, 3(2), 20-28.
Vong, A, Hoi, S. (2009) Determinants of Bank Profitability in Macao. Faculty of Business Administration, University of Macau.
Wen, W. (2010) Ownership Structure and Banking Performance: New Evidence in China. Universitat Autònoma de Barcelona Departament D’economia de L’empresa, 2010.