soil water measurements on four alluvial soils in canterbury 1. soil water extraction patterns under...
TRANSCRIPT

New Zealand Journal ojCrop and Horticultural Science, 1989, Vol. 17: 189-199 0114-0671/89/1702-D189 $2.50/0 © Crown copyright 1989
189
Soil water measurements on four alluvial soils in Canterbury 1. Soil water extraction patterns under spring-sown peas and barley, and pasture
T.R. WEBB Division of Land and Soil Sciences Department of Scientific and Industrial Research Private Bag, Christchurch, New Zealand
Abstract Changes in water content of four soil types from alluvium were monitored under springsown barley during 1978/79, spring -sown peas during 1979/80 and under pasture during September 1981 - August 1984. The soil types varied in texture and depth to sandy gravels and are representative of a large area of the Canterbury and North Otago Plains. Patterns of soil water depletion over time are depicted graphically for representative soils in each season. All crops extracted similar amounts of water from the upper 30 cm, but spring-sown crops extracted less water below 30 cm. In stone-free soils, pea and barley crops obtained more than 80% of their total soil water from above 60 cm depth, and pasture obtained less than 60% of total soil water from the same depth. Pasture grown in moderately deep and shallow soils extracted 70-80% of total soil water from above 60 cm. Spring-sown crops extracted water to 90-100 cm depth in stone-free horizons, but pasture extracted water to at least 120 cm in soils underlain by sandy gravels, and to 180 cm in deep stone-free soils. High amounts of soil watcrextracted by pasture from subsoil horizons were considered to be related to perching of water in sandy layers.
Keywords available water; soil depth; water deficit; peas; barley; pasture; Canterbury; water extraction; soil types; water storage
Received 6 May 1988; accepted 6 March 1989
INTRODUCTION
In regions that are subject to seasonal soil water deficits, like the Canterbury Plains, the capacity of a soil to store water is of fundamental importance in assessing the potential productivity of the soil and in making management decisions such as irrigation scheduling. Also, available water capacity (A WC) is a fundamental component of crop growth models. Hayman & Stocker (1982) showed the importance of accurate assessment of A WC for improving irrigation efficiency and effectiveness. Also, previous studies at Department of Scientific and Industrial Research (DSIR) at Lincoln have shown theoveriding effect A WC has on yield of spring- and autumnsown cereal crops in Canterbury (Bennett et al. 1980, Webb & Purves 1983, Bennett & Webb 1987).
There is, therefore, a need for soil scientists and agronomists to determine A WC on a regular basis. However, even with a knowledge of soil water storage characteristics, soil water availability is difficult to define. Root distributions down the profile and total depths of root penetration vary with crop type. Consequently different crop types have different patterns of water extraction with soil depth. Furthermore, different season and agronomic treatments can affect root distribution and hence water extraction. Also surface horizons commonly dry out beyond -15 bar water tension and, in some profiles, water moves upwards into the root zone by capillarity along water-potential gradients. Ritchie (1981) considered that available water measurements made in the laboratory were too inaccurate for use in water balance studies. He recommended taking field measurements of soil water storage limits until sufficient knowledge is gained to enable confident estimates to be made. There is, therefore, a need to measure limits of available water in the field and to tcst theoretical,laboratory-based estimates of Awe.
In the South Island, irrigation trials assessing pasture response to irrigation have been conducted for several decades (Rickard et al. 1986) but soil water measurements have only recently been made to depths greater than 10 or 30 cm. Watt (1977)

.....
Tab
le 1
B
rief
soil
des
crip
tion
s fo
r re
pres
enta
tive
pro
file
s.
\0
0
Dep
th
Deg
ree
of
Por
es/l
Ocm
2 R
oot
Hor
izon
(c
m)
Tex
ture
S
truc
ture
S
oil s
tren
gth
pack
ing
(>2m
m)
Mot
tles
co
nten
t·
Wak
anu
l dee
p 4
Ap
0-18
si
lt lo
am
wea
k nu
t m
ediu
m
5 m
any
Bw
18
-32
silt
loam
w
eak
nut
v. h
igh
8 co
mm
on f
ine
man
y B
gl
32-4
8 si
lt lo
am
wea
k bl
ock
v. h
igh
0 co
mm
on m
edim
n m
any
Bg2
48
-62
fine
san
dy l
oam
m
assi
ve
med
ium
0
man
y m
ediu
m
few
B
CI
62-6
9 lo
amy
fme
sand
m
assi
ve
low
fe
w f
ine
com
mon
B
C2
69-7
3 fm
e sa
ndy
loam
m
assi
ve
low
m
any
fine
co
mm
on
BC
3 75
-80
loam
y fm
e sa
nd
mas
sive
fe
w f
me
few
B
C4
80
-90
fm
e sa
ndy
loam
m
assi
ve
man
yfm
e fe
w
Cl
90-1
70
v. s
tony
san
d si
ngle
gra
in
v.
few
Z
(1
)
Tem
plet
on d
eep
3
~
Ap
0-1
9
silt
loam
m
od.n
ut
v. w
eak
man
y N
B
wl
19-3
5 si
lt lo
am
wea
k nu
t m
od. w
eak
med
ium
10
fe
w f
ine
man
y ~
Bw
2 35
-63
loam
y fm
e sa
nd
mas
sive
v.
wea
k m
edim
n 0
com
mon
fin
e co
mm
on
::l
Bw
3 63
-70
fme
sand
y lo
am
mas
sive
m
od. w
eak
high
0
few
fin
e fe
w
Q. ......
Bw
4 7
0-8
0
loam
y fm
e sa
nd
mas
sive
v.
wea
k lo
w
0 co
mm
on m
ediu
m
few
0 c
Bg
l 80
-95
fine
san
dy l
oam
m
assi
ve
mod
. flJ1
11
med
ium
0
com
mon
med
imn
few
a
Cg
l 95
-128
lo
amy
fme
sand
m
assi
ve
v. w
eak
low
0
com
mon
med
imn
nil
a C
g2
128-
158
loam
y fm
e sa
nd
mas
sive
lo
ose
0 co
mm
on m
ediu
m
nil
0 -,
Cg3
15
8-18
4 fm
e sa
ndy
loam
m
assi
ve
mod
. flJ1
11
med
ium
0
nil
(J
C
184-
200
fme
sand
y lo
am
mas
sive
ni
l .g
Tem
plet
on m
oder
atel
y de
ep 3
§
Ap
0-2
2
silt
loam
w
eak
nut
v. w
eak
med
ium
8
man
y Q
.
Bw
22
-36
silt
loam
w
eak
nut
v. f
lJ111
hi
gh
5 fe
w f
me
man
y s:
Bg
l 3
6-6
0
silt
loam
m
assi
ve
mod
. str
ong
v.hi
gh
0 co
mm
onfm
e co
mm
on
g. B
g2
60-6
8 sa
ndy
loam
m
assi
ve
v. fl
J111
0
com
mon
med
ium
co
mm
on
E.
BC
68
-90
v. s
tony
loam
y sa
nd
sing
le g
rain
m
od. w
eak
few
....
C
98-1
40
v. s
tony
san
d si
ngle
gra
in
v. w
eak
nil
~ E
yre
shaD
ow 4
en
n
Ap
0-1
7
silt
loam
w
eak
nut
mod
. wea
k m
any
o·
Bw
l 17
-40
v. s
tony
sil
t loa
m
wea
k nu
t m
od. f
lJ111
2
com
mon
::
l n B
w2
40
-60
v.
sto
ny lo
amy
sand
si
ngle
gra
in
mod
. wea
k m
any
.(1)
BC
60
-130
v.
sto
ny lo
amy
sand
si
ngle
gra
in
v. w
eak
few
.....
\0
C
130-
200
v.st
ony
sand
si
ngle
gra
in
v. w
eak
nil
00
.\
0
• ro
ots
per
100
cm2
; m
any,
25-
200;
com
mon
, 10
-25;
few
, 2-
10; v
. fe
w,
1-2.
<:
~
.....
-.l
Webb-Soil water extraction patterns
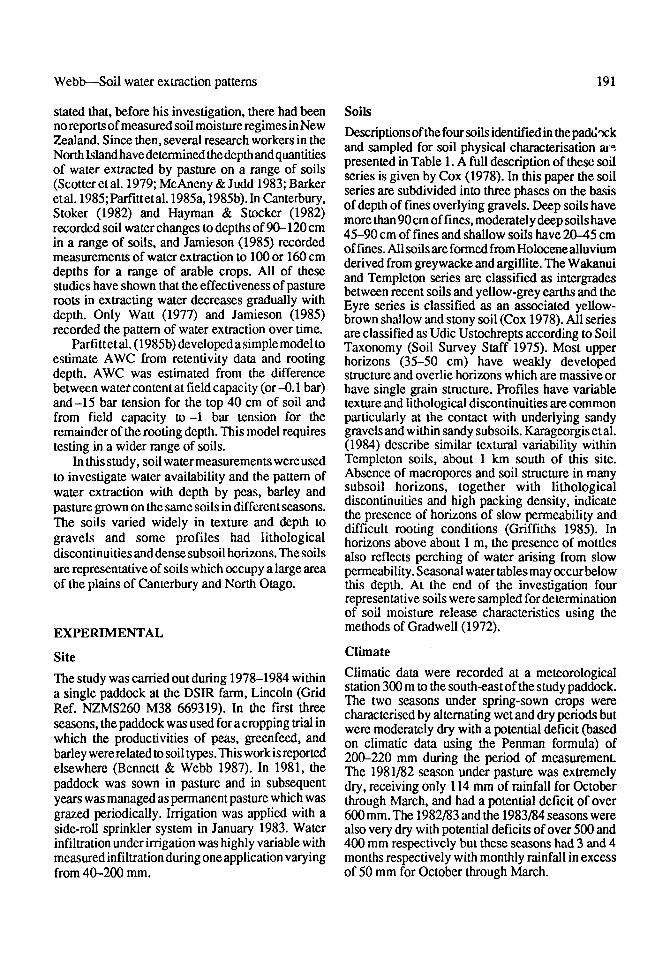
stated that, before his investigation, there had been no reports of measured soil moisture regimes in New Zealand. Since then, several research workers in the North Island have determined the depth and quantities of water extracted by pasture on a range of soils (Scotter et al. 1979; McAneny & Judd 1983; Barker etal.1985; Parfittetal.1985a,1985b). In Canterbury, Stoker (1982) and Hayman & Stocker (1982) recorded soil water changes to depths of 90--120 cm in a range of soils, and Jamieson (1985) recorded measurements of water extraction to 100 or 160 cm depths for a range of arable crops. All of these studies have shown that the effectiveness of pasture roots in extracting water decreases gradually with depth. Only Watt (1977) and Jamieson (1985) recorded the pattern of water extraction over time.
Parfittetal. (1985b) developed a simple model to estimate A WC from retentivity data and rooting depth. A WC was estimated from the difference between watet content at field capacity (or -0.1 bar) and-15 bar tension for the top 40 em of soil and from field capacity to -1 bar tension for the remainder of the rooting depth. This model requires testing in a wider range of soils.
In this study, soil water measurements were used to investigate water availability and the pattern of water extraction with depth by peas, barley and pasture grown on the same soils in different seasons. The soils varied widely in texture and depth to gravels and some profiles had lithological discontinuities and dense subsoil horizons. The soils are representative of soils which occupy a large area of the plains of Canterbury and North Otago.
EXPERIMENTAL
Site
The study was carried out during 1978-1984 within a single paddock at the DSIR farm, Lincoln (Grid Ref. NZMS260 M38 669319). In the first three seasons, the paddock was used for a cropping trial in which the productivities of peas, green feed, and barley were related to soil types. This work is reported elsewhere (Bennett & Webb 1987). In 1981, the paddock was sown in pasture and in subsequent years was managed as permanent pasture which was grazed periodically. Irrigation was applied with a side-roll sprinkler system in January 1983. Water infiltration under irrigation was highly variable with measured infiltration during one application varying from 40-200 mm.
191
Soils
Descriptions of the four soils identified in the pad~ '1Ck and sampled for soil physical characterisation al~ presented in Table 1. A full description of these soil series is given by Cox (1978). In this paper the soil series are subdivided into three phases on the basis of depth of fines overlying gravels. Deep soils have more than 90 cm of fines, moderatel y deep soils have 45-90 cm of fines and shallow soils have 20-45 cm offines. All soils are formed from Holocene alluvium derived from grey wacke and argillite. The Wakanui and Templeton series are classified as intergrades between recent soils and yellow-grey earths and the Eyre series is classified as an associated yellowbrown shallow and stony soil (Cox 1978). All series are classified as Udic Ustochrepts according to Soil Taxonomy (Soil Survey Staff 1975). Most upper horizons (35-50 cm) have weakly developed structure and overlie horizons which are massive or have single grain structure. Profiles have variable texture and lithological discontinuities are common particularly at the contact with underlying sandy gravels and within sandy subsoils. Karageorgis et al. (1984) describe similar textural variability within Templeton soils, about 1 km south of this site. Absence of macropores and soil structure in many subsoil horizons, together with lithological discontinuities and high packing density, indicate the presence of horizons of slow permeability and difficult rooting conditions (Griffiths 1985). In horizons above about 1 m, the presence of mottles also reflects perching of water arising from slow permeability. Seasonal water tables may occur below this depth. At the end of the investigation four representative soils were sampled for determination of soil moisture release characteristics using the methods of Gradwell (1972).
Climate
Climatic data were recorded at a meteorological station 300 m to the south-east of the study paddock. The two seasons under spring-sown crops were characterised by alternating wet and dry periods but were moderately dry with a potential deficit (based on climatic data using the Penman formula) of 200-220 mm during the period of measurement The 1981/82 season under pasture was extremely dry, receiving only 114 mm of rainfall for October through March, and had a potential deficit of over 600 mm. The 1982/83 and the 1983/84 seasons were also very dry with potential deficits of over 500 and 400 mm respectively but these seasons had 3 and 4 months respectively with monthly rainfall in excess of 50 mm for October through March.

192 New Zealand Journal of Crop and Horticultural Science, 1989, Vol. 17
Soil water measurements
Before August 1981, soil water was measured gravimetrically, mainly at weekly intervals, using a 8 cm diam. bucket auger. Samples were taken from 5-15, 15-25,25-35,35-45,55-65,75-85 cm depth increments from three profJ1es for each of four soils (Table 2). Sampling was confmed to strata above very stony horizons as these could not be penetrated by the auger. From August 1981, soil water was recorded for each depth increment of 15 cm, using the gravimetric method for the upper 30 cm and using a Troxler neutron probe below 30 cm. In August 1981, neutron probe access tubes were
installed above the gravels in three sites within each of Templeton moderately deep, Templeton deep, and Wakanui deep soils. The tubes in the deep soil were 1.5 m in length while tubes in the Wakanui deep soils were about 1 m long and tubes in the Templeton moderately deep soil varied from 0.6 to 0.9 m in length. In October 1982, a further six access tubes were installed. One long tube (2.0 m in length) was installed in the Templeton deep soil and the remaining tubes (1.5 m in length) were installed in the Wakanui deep and Templeton moderately deep soils so as to penetrate underlying gravels.
Measurements of soil water under pasture were taken at intervals ranging from 1 to 4 weeks, with
Table 2 Maximum soil water deficits for each depth increment for each season. (Number of profiles given in parenthesis).
SamJ2ling del2th {cm} Soil phase 5-15 15-25 25-35 35-45 55-65 75--85
Barley 1978/79 Templeton deep (3) 25 18 13 13 12 7 Wakanui deep (3) 22 19 21 12 8 6 Templeton mod. deep (3) 23 22 15 12 13 Eyre shallow (3) 29 22 18 Mean, all soils 25 20 17 12 11 6 Peas 1979/80 Templeton deep (3) 21 16 13 12 12 8 Wakanui deep (3) 21 16 13 12 12 8 Templeton mod. deep (3) 21 19 21 15 8 Eyre shallow (3) 22 19 15 Mean, all soils 21 18 17 14 9 8
SamQling deQth {cm} 0-15 15-30 30-45 45-60 60-75 75-90 90-105 105-120 120-150 150-180
Pasture 1981/82 Templeton deep (2) 26 21 22 24 20 18 19 19 Wakanui deep (2) 26 23 22 20 16 18 Templeton mod. deep (2) 28 22 23 25 Mean, all soils 27 22 22 23 18 18 Pasture 1982183 Templeton deep (3) 24 22 22 27 22 22 17 13 11 6 Wakanui deep (2) 24 21 21 20 21 22 16* 5* Templeton mod. deep (2) 26 21 20 23 10* 8* 6* 6* Eyre shallow (3) 28 24 18* 9* 9* 6* 6* 6* 5* Mean, all soils (stonefree) 25 22 21 23 21 22
Pasture 1983/84 Templeton deep (2) 19 17 18 23 19 16 16 10 10 8 Wakanui deep (2) 22 21 15 15 18 16 161 51 Templeton mod. deep (2) 23 21 16 19 15* 5* 5* 4* Eyre shallow (3) 25 22 13* 6* 4* 4* 5* 4* Mean, all soils (stonefree) 22 23 16 19 18 16
I Missing values taken from previous season. * Stony horizons.

Webb-Soil water extraction patterns 193
A B Soil moisture (vol.%) Soil moisture (vol.%)
00 10 1~~4 30 ~~09 1~ H }10 30 Soil water depletion
o 12/1-1112
30 30 D 11/2-1113
[] 11/3- 14/4
E 60 60 u ......
..r:: C. Q)
090 90
120 120
Fig. 1 Soil water depletion of selected profIles for the main drying period under pasture in 1983. A, Templeton deep 2; B, Eyre shallow 1.
some longer intervals during winter. The calibration for the neutron probe was obtained from previous work on Templeton and Wakanui soils. Gravimetric detenninations for the upper 30 cm were converted to volumetric values by assuming a bulk density of l.3 g/cm3.
Soil water measurements were recorded from two to three proftles for each of four soils to provide replication (Table 2). However, variable depths to gravels, and variable depths and thicknesses of horizons of contrasting particle size. make averaging of water content over the same depth increments inappropriate. Each proftle has therefore been considered as an individual. and discussion is confined to changes observed within particular proftles or comparisons of trends common to all individuals within particular soil phases.
Water balance calculations Potential evapotranspiration (E ) for pasture was calculated using the PenmanP fonnula. Actual evapotranspiration (E ) was calculated from the sum of soil water depletio~ (decrease taken as positive) and rainfall. Rainfall in excess of the current deficit was credited to drainage. The field capacity of each soil strata was taken as the maximum water content
recorded for that strata after there had been at least four days without rainfall. thus allowing adequate opportunity for drainage. Most of the highest readings were recorded on July 28 1983 when there had been only 36 mm of rainfall in the preceding 18 days and there had been no rainfall in the preceding 4 days. For simplicity of discussion. soil water deficits below field capacity were attributed to plant extraction. It is recognised. however. that part of the recorded deficits may arise from evaporation from the soil surface. slow drainage. and lateral movement of water. Evidence oflateral movement of water within the lower horizons of the Templeton soils was noted occasionally. but this could rarely be taken into account in calculations because of the difficulty of distinguishing causes of soil water changes. There is an empirical relationship between the ratio EjE • and soil water deficit (Johns & Smith 1975) a.rfd E IE was used to estimate the degree of water defidlt stress experienced by the plants.
RESULTS AND DISCUSSION
The 1982/83 season began with soils slightly below field capacity. All other growth periods began with soils close to field capacity. The three spring-autumn
194
A Soil moisture (vol.%)
o 10 20 30 0 , , • II"" ,
30
60
...... E () .......
.J::. 90 a. cv 0
120
150
180
Soil water depletion
D F:l ~
D . .
4/10/83-10/11/83
10/11/83-2/2/84
2/2184-213184
: -15 bar - 0.1 bar
New Zealand Journal of Crop and Horticultural Science, 1989, Vol. 17
B C Soil moisture (vol.%)
o O. 1J.i
o 10 20 30 40 • I .h .. I i
30 30 :. :.
!:=; 60 60
,.;.
90 90
120 120
D E Soil moisture (vol.%)
o 10 20 30 40 0 , i • • Ii . • . i • I i
Soil moisture (vol.%)
10 20 30
E 30 30 () .......
.s:::. a. ~ 60 60 L • ~ "'
90 90
120
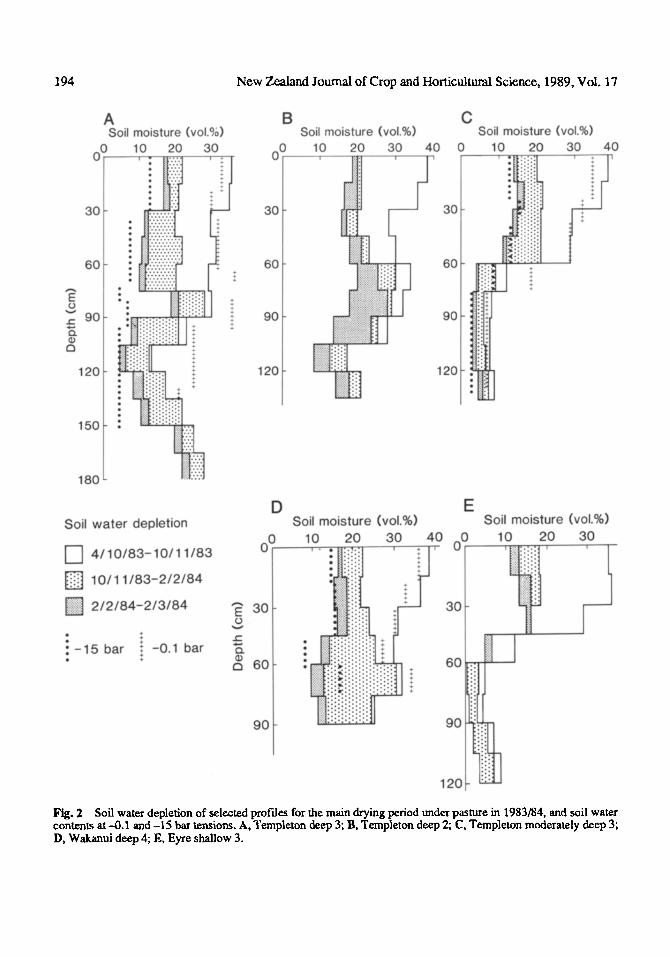
Fig. 2 Soil water depletion of selected profiles for the main drying period under pasture in 1983/84, and soil water contenls at "{}.1 and -15 bar tensions. A, Templeton deep 3; B, Templeton deep 2; C. Templeton moderately deep 3; D, Wakanui deep 4; E, Eyre shallow 3.

Webb-Soil water extraction patterns
seasons under pasture were very dry with rainfall rarely penetrating below 30 cm.
Depth of extraction of water for different crops and seasons Total depth of extraction varied with crop type (Table 2). The annual crops of peas and barley had very low extraction at 75-85 cm depth and effective depth of extraction was estimated to be 90-100 cm. This finding agrees with other work at Lincoln in which soil water extraction has been measured under spring -sown cereals and peas (Jamieson 1985). Under barley, significant extraction of water below 50 cm occurred only during very dry periods in October and December. Examples of soil water extraction under pasture for two seasons are depicted in Fig. 1 & 2. Soils with underlying gravels had very low water extraction from sandy gravel horizons (below 45 cm in Eyre shallow phase and below 60 em in Templeton moderately deep phase) but amounts extracted in gravel horizons did not decrease greatly with depth within the depths measured. The depth to which water may be extracted from gravel horizons is, therefore, still to be determined. One of the deep Templeton soils showed low water extraction between 150 and 180 cm, andfor most cases, 180cm may be taken as the lowest depth for water availability. Under very dry conditions, as occurred in 1982/83, plants general I y ex tracted water from all depths during any particular period if water was available at all depths. However, the rate of extraction of water decreased with depth so water reserves were first depleted in upper horizons.
The process of soil water extraction below about 120 cm may be debated. The possibility of normal root extraction at this depth has been demonstrated by Evans (1976) for clover and ryegrass, and by Weir & Barraclough (1986) for winter wheat. In the present study, however, no roots were observed in horizons below 100 cm in some soils (Table 1) yet substantial water was removed from below these depths. This water may have moved upwards into the root zone by capillarity driven by water potential gradients. Root observations recorded in Table 1 were not made with sufficient care to preclude the possibility of sparse roots occurring below 100 cm. Ritchie (1981) considered that upward movement of water has been overestimated in the past and that insufficient account has been taken of sparse roots at depth which may be highly active in uptake when water supply is restricted in upper parts of the profile. Gregory etal. (1978) and Weir & Barraclough (1984), studied winter wheat under severe drought
195
conditions, and found that deep roots had much greater inflows of water per unit length than had roots higher in the profile.
Patterns of water extraction for different crops and seasons The pea and barley crops grew in relatively moist seasons and had similar amounts of water extracted from the same depth increments (Table 2). Comparable amounts of water were extracted in the upper 30 em by the spring-sown crops as was extracted by pasture during each of the three dry seasons. Below 30 em, however, much lower quantities of water were extracted by the springsown crops. Between 45-90 cm depths, the pea and barley crops extracted only about half as much water as did pasture. In drier seasons, barley and, to a lesser extent, peas may extract more water from horizons below 45 cm. The three seasons under pasture were very similar; they began with soils at, or close, to field capacity and had periods with severe soil water deficits. Similar amounts of water were extracted from the same depths in stone-free horizons in each season (Table 2) although the Eyre shallow phase tended to have slightly greater amounts of water extracted in the upper 30 cm.
In late January 1983, Profile 2 of the Templeton deep phase and Profile 1 of the Eyre shallow phase were both irrigated to field capacity. The subsequent period was very dry (only 65mm of rainfall in 12 weeks) therefore the data from these soils (Fig. 1) provide an ideal comparison of the effects of soil depth on soil water extraction under high potential evapotranspiration. Pasture growing on the Eyre shallow phase extracted almost all of the available water in the first 3 weeks, and the remainder was extracted in the second 4 weeks under severe water deficit stress (EjE = 0.5). Pasture growing on the Templeton deep phke extracted substantial amounts of water during each of the above periods. It was subject to only moderate water deficit stress (EjE = 0.75) in the final 5 weeks and in contrast to oilier Templeton profiles, water below 60 cm depth was extracted at a rapid rate. Note the regular increase of depth of extraction with time. Maximum deficits for the Eyre shallow phase and the Templeton deep phase were 165 and 285mm respectively.
Patterns of soil water depletion for three successive periods in 1983/84 are shown in Fig. 2 and are generally representative of patterns of soil water depletion for the three seasons under pasture. During the first five weeks, all soils supplied very similar amounts of water, which came mainly from
196 New Zealand Journal of Crop and Horticultural Science, 1989, Vol. 17
the upper 60 cm depth increment. At the end of the period, the soil water reserves in the shallow soils were almost entirely depleted. In the second period, depletion of soil water storage varied from 0 mm in the shallowest profile to 110 mm in one of the deep profiles. Water was generally derived from all depths, but there were substantial differences in amounts of water derived from different depths. Limited reserves of water remained and in the final period, most profiles supplied a small amount of water from all depth increments.
Total evapotranspiration values were calculated for the two seasons when deep soil water measurements were recorded. In the 1982/83 and 1983/84 seasons, the shallowest Eyre profile provided respectively only two-thirds and three-quarters as much water for plant growth as did the Templeton deep soils.
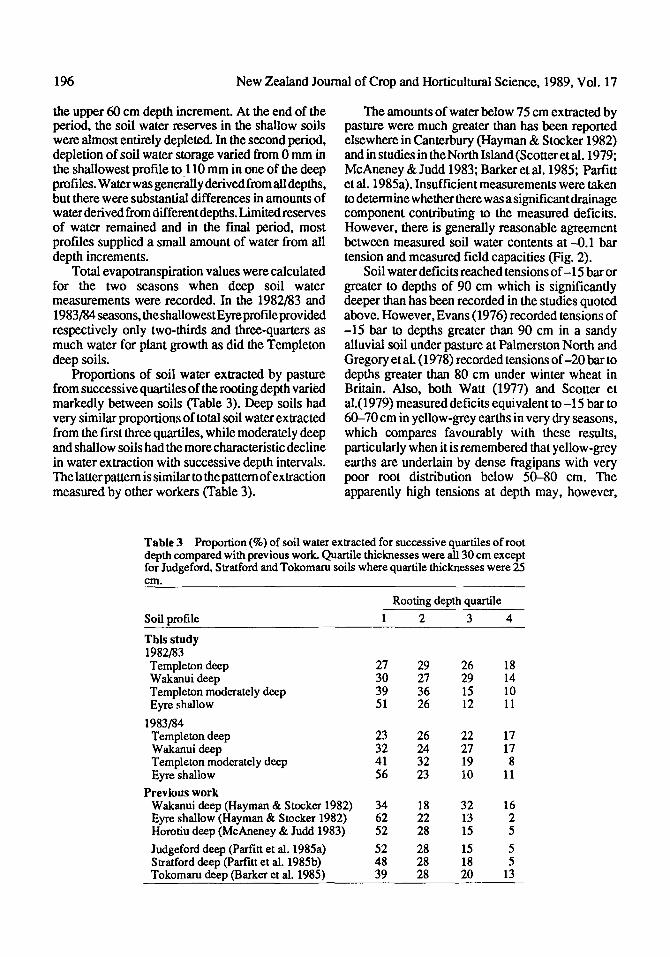
Proportions of soil water extracted by pasture from successive quartiles of the rooting depth varied markedly between soils (Table 3). Deep soils had very similar proportions of total soil water extracted from the first three quartiles, while moderately deep and shallow soils had the more characteristic decline in water extraction with successive depth intervals. The latterpattem is similar to the pattern of extraction measured by other workers (Table 3).
The amounts of water below 75 em extracted by pasture were much greater than has been reported elsewhere in Canterbury (Hayman & Stocker 1982) and in studies in the North Island (Scotter et al. 1979; McAneney & Judd 1983; Barker et al. 1985; Parfitt et al. 1985a). Insufficient measurements were taken to determine whether there was a significant drainage component contributing to the measured deficits. However, there is generally reasonable agreement between measured soil water contents at -0.1 bar tension and measured field capacities (Fig. 2).
Soil water deficits reached tensions of -15 bar or greater to depths of 90 em which is significantly deeper than has been recorded in the studies quoted above. However, Evans (1976) recorded tensions of -15 bar to depths greater than 90 cm in a sandy alluvial soil under pasture at Palmerston North and Gregory et at (1978) recorded tensions of -20 bar to depths greater than 80 cm under winter wheat in Britain. Also, both Watt (1977) and Scotter et a1.(1979) measured deficits equivalent to -15 bar to 60--70 cm in yellow-grey earths in very dry seasons, which compares favourably with these results, particularly when it is remembered that yellow-grey earths are underlain by dense fragipans with very poor root distribution below 50-80 cm. The apparently high tensions at depth may, however,
Table 3 Proportion (%) of soil water extracted for successive quartiles of root depth compared with previous work. Quartile thicknesses were all 30 cm except for Iudgeford. Stratford and Tokomaru soils where quartile thicknesses were 25 cm.
Rooting depth quartile
Soil profile 1 2 3 4
This study 1982/83 Templeton deep 27 29 26 18 Wakanuideep 30 27 29 14 Templeton moderately deep 39 36 15 10 Eyre shallow 51 26 12 11
1983/84 Templeton deep 23 26 22 17 Wakanui deep 32 24 27 17 Templeton moderately deep 41 32 19 8 Eyre shallow 56 23 10 11
Previous work Wakanui deep (Hayman & Stocker 1982) 34 18 32 16 Eyre shallow (Hayman & Stocker 1982) 62 22 13 2 Horotiu deep (McAneney & Judd 1983) 52 28 15 5
Iudgeford deep (Parfitt et al. 1985a) 52 28 15 5 Stratford deep (Parfitt et al. 1985b) 48 28 18 5 Tokomaru deep (Barker et al. 1985) 39 28 20 13

Webb-Soil water extraction patterns 197
Fig. 3 Available water holding capacity (AWC) versus stone-free soil depth for all soils underpasture.
240 ~ 0 1982/83 Q 1983/84
@ o
200
160
E E ~ 120 ;: «
80
40
o
AWCz239-191 (0.983 depth)
SE ±19 ±23±0.007
O~ 2'0 4'0 6'0 8'0 1()0 120 140 HlO
result from poor correlation between laboratorymeasured soil tensions and field-assessed soil water contents. Highly variable textures make correlations tenuous, a few centimetres away from the sampling position, results could differ substantially. Also, soil water estimates obtained with the neutron probe may have underestimated water content in stony and sandy materials. This possibility is supported by the extremely low, and sometimes negative, soil water readings obtained in stony horizons (Fig. 2). Cannell & Asbell (1974) found that neutron probe measurements made in soils with sharp textural breaks can be in error by as much as 8%. The soil water content error may be greater or less than water contents measured gravimetrically, depending on whether the neutron measurement is made on entering or leaving a sandy layer.
It is important to note that, in this study, soil water was extracted under severe water deficit conditions. The water extracted under severe stress is likely to have been used to maintain plant viability rather than to support growth (parfitt et al. 1985a, 1985b). The extremely slow rate of extraction at the dry end of the seasons would support this view. Also, the presence of flatweeds, particularly after the drought of 1981/82, may account for extraction of water at high tensions at depth. Flatweeds were seen to maintain their turgidity in the drier conditions for longer than did the pasture plants. There is a need for further research to relate soil water deficits to
Soil depth (em)
pasture growth in these soils to determine the critical deficit at which pasture growth slows because of lack of water.
Available water capacity A WC for each of the soils under barley and peas, calculated from summation of values in Table 2, were: Templeton deep and Wakanui deep phases, 110 to 120 mm; and Templeton moderately deep phase, 100 to 110 mm. The relationship between stone-free soil depth and A WC for each of the soils under pasture is presented in Fig. 3. Values for both years are very similar. The effective rooting depth of the deep Templeton phase was taken as 150 cm. The following estimates of A WC under pasture were derived from Fig. 3: Templeton deep phase (>150 cmoffines),225-240mm;TempletonandWakanui deep phases (9~ 150cm of stone-free fines), 2~225 mm; Templeton moderately deep phase (45-90 cm of stone-free fines), 15~200 mm; Eyre shallow phase (2~5 cm of stone-free fines), 100-150 mm; and Eyre stony phase «20 cm of stone-free fines), less than 100 mm.
A WCs based on laboratory-determined values calculated after Parfitt et al. (l985b) were compared with water extracted from the same profiles in the field as measured by the neutron probe in the 1982/83 and 1983/84 seasons. A deep Templeton profile had comparable water extraction and laboratory-based A WC but laboratory-based A WCs

198 New Zealand Journal of Crop and Horticultural Science, 1989, Vol. 17
for three other profiles (Wakanui deep, Templeton moderately deep, and Eyre shallow soils) were 60-80% lower than measured water extraction. Higher measured A WCs may be accounted for from two observations. Firstly, recent measurements indicate that -0.05 bar is probably a closer estimate of 'field capacity' than is -0.1 bar for horizons with sharp textural contrasts. Secondly, under severe drought conditions, pasture appears to extract water below 40 cm depths to tensions well beyond -1 bar as suggested by Parfitt et aI. (1985b). The close agreement found between field- and laboratorybased assessments of A WC for the Templeton deep soil is largely fortuitous. Laboratory estimates of A WC over-estimated AWC below 90cm but for the upper 90 cm of profile laboratory estimates were only 85% of measured values.
Stone-free horizons above 90 cm depth with textures varying from silt loam to loamy fine sand all had A WCs of 20-25%. Stony horizons with loamy textures above 90 cm and stone-free horizons below 90 cm depth had A WCs of 10-15%. Stony sandy horizons below 60 cm had A WCs of 5-7%.
Absolute values of A WC are very high and need to be considered in relation to amounts of water extracted under moderate to high deficit conditions. Results from the 1982/83 and 1983/84 seasons indicate that 30% of recorded available water was extracted under moderate to severe water deficit stresses (EjE < 0.85).
Furtherm6re, high A WCs in deep soils will only have relevance when soils have been fully recharged. In seasons following dry winters, deep soils will not be restored to field capacity, so that their recharged water profiles will not reach their potential A WC. This occurred in 1984 when deep soils retained large deficits into spring. In mid August 1984 soil water measurements indicated that deficits were 115-130 mminTempletondeepphase,40-50mminWakanui deep and Templeton moderately deep phases and 20-40 mm in Eyre shallow phase.
Drainage There were marked differences in drainage related to soil depth classes. During 8 weeks of wetting in May-J uly 1983, the shallow soils were calculated to have allowed 80-100 mm of water to drain away while the moderately deep soils had a few millimetres of drainage and the deep soils had no drainage. In the following 12 weeks, Templeton deep phase had 10-20 mm of drainage while the other soils had 40-75 mm of drainage. Total drainage figures during 1983 were: deep soils, 8-58 mm; moderately deep soils, 77 mm; and shallow soils, 149-174 mm.
CONCLUSIONS
The values obtained for A WC were considerably higher than estimations based on laboratory measurements and confirm the need for field-based assessments of A WC. Subsoils containing horizons with sharp textural contrasts had relatively high A WCs and strata at the same depth had similar A WCs even though texture varied from loamy fine sand to silt loam. A formula was derived to estimate A WC, under pasture, from stone-free soil depth, irrespective of textural composition. A WC in underlying sandy gravels, which contained about 50% gravels, could be taken as 5% by volume, at least to a depth of 120 cm from the soil surface. These assessments of A WC can be used in crop growth models and for irrigation design parameters. However, there is a need for further work to determine deficits at which plant growth slows and at which plant growth effectively stops.
Effective rooting depth of stone-free soils was 90-100 cm for spring-sown peas and barley and was 150 cm for ryegrass/white clover pasture. The effective rooting depth for pasture within soils underlain by sandy gravels at depths varying from 40 to 90 cm, extended to at least 120 cm from the soil surface. Lithological discontinuities did not inhibit water extraction below the discontinuities. There is a need for further work to determine the mechanism of soil water extraction from deep horizons which have only a sparse occurrence of roots.
ACKNOWLEDGMENTS
Special thanks are due to Miss Cathy Bennett and Mr Andrew Purves for help in many aspects of this study. Thanks are also due to the several technical trainees, wage workers and colleagues who helped to record soil moisture; to Mr Gerrard Lilley for sampling and analysing the soils for soil moisture release characterisation; to Ms Sabrina Malcolm for drafting of figures, and to Dr C. W. Ross for helpful comments on the manuscript.
REFERENCES
Barker, D. J.; Chu, A. P. C.; Korte, C. 1. 1985. Depletion of soil water from a Tokomaru silt loam by a perenial ryegrass sward. New Zealandjour1W.l of agricultural research 28: 525-530.
Bennett, C. M.; Webb, T. H. 1987. Influence of soil type and irrigation on yield of spring-sown barley and peas and autumn-sown greenfeed in Canterbury. New Zealand journal of experimental agriculture 15: 123-133.
Bennett, C. M.; Webb, T. H.; Wallace, A. R. 1980. Influence of soil type and irrigation on barley yield. New Zealand journal of experimental agiculture8: 111-115.

Webb-Soil water extraction patterns
Cannell, G. H.; Asbell, C. W. 1974. The effects of soilprofile variations and related factors on neutronmoderation measurements. Soil science 117: 124-127
Cox, J. E. 1978. Soils and agriculture of part Paparua County, Canterbury, New Zealand. New Zealand Soil Bureau bulletin 34: 128p.
Evans,P.S.1976.Rootdistributionandwater-withdrawal patterns of some crop and pasture species. Pp 186-190 in: Proceedings of soil and plant water symposium. May 25-27, PaImerston North. Department of Scientific and Industrial Research Information Series No 126.
Gradwell, M. W. 1972. Methods for physical analysis of soils. New Zealand Soil Bureau scientific report IOC.
Gregory, P. H.; McGowan, M.; Biscoe, Y. P. 1978. Water relations in winter wheat. 2. Soil water relations. Agricultural science 91: 103-116.
Griffiths, E. 1985. Interpretation of soil morphology for assessing moisture movement and storage. New Zealand Soil Bureau scientific report 74. 2Op.
Hayman, J.M.; Stocker, R.Y. 1982. Soil water extraction patterns under pasture and lucerne on two soil types in Mid-Canterbury. Proceedings of the Agronomy Society of New Zealand 12: 61-63.
Jamieson, P. D. 1985. Soil moisture extraction patterns from irrigated and dryland arable crops in Canterbury. Proceedings of the Agronomy Society of New Zealand 15: 1-6.
Johns, G.G.; Smith, R.C. G.1975. Accuracy of soil water budgets based on a range of relationships for the influence of soil water availability on actual water use. Australian journal of agricultural research 26: 871-883.
Karageorgis, D.; Tonkin, P. 1.; Adams, 1. A. 1984. Medium and short range variability in textural layering in an Ochrept developed on an alluvial floodplain. Australianjournal of soil research 22: 471-474.
199
McAneney, K. J.; Judd, M. D.; 1983. Pasture production and water use measurernents in the centralWaikato. New Zealandjournal of agricultural research 26: 7-13.
Parfitt, R. L.; Joe, E. N.; Cook, F. J. 1985a. Water use and pasture growth on JUdgeford silt loam. New Zealand journal of agricultural research 28: 387-392.
Parfitt, R. L.; Roberts, A. H. C.; Thomson N. A. Cook, F. J.1985b. Water use and pasture growth on Stratford silt loam. New Zealand journal of agricultural research 28: 393-401.
Rickard, D. S.; McBride, S. D.; Fitzgerald, P. D. 1986. The effect of soil moisture deficits on pasture yield. New Zealand journal of agricultural science 20: 7-12.
Ritchie, 1. T. 1981. Soil water availability. Plant and Soil 58: 327-338.
Scotter, D. R.; Clothier, B. E.; Corker, R. B. 1979. Soil water in a Fragiaqualf. Australian journal of soil research 17: 443-453.
Soil Survey Staff 1975. Soil Taxonomy, a basic system for making and interpreting soil surveys. U.S. Department of Agriculture, Soil Conservation Service Handbook No. 436. 754 p.
Stoker, R. 1982. Soil wetting and moisture extraction trials on a Lismore stony silt loam. Technical report of the Winchmore Irrigation Research Station No.16. 13p.
Watt,1. P. C. 1977. Field observations of the moisture regime of a yellow-grey earth (Otokia silt loam) in eastern Otago. Journal of hydrology 16: 53-72.
Webb, T.H.; Purves, A.M. 1983. Influence of soil type on yield of autumn-sown wheat and oats in Canterbury in a dry year. New Zealandjournalofexperimental agriculture 11: 289-294.
Weir, A. H.; Barraclough, P. B. 1986. The effect of drought on the root growth of winter wheat on its water uptake from a deep loam. Soil use and management 2: 91-96.