soil treatability studies area iv santa susana field ... of mercury... · 5.2 mercury speciation...
TRANSCRIPT
UC Riverside 1
Evaluation of Mercury Contamination
Soil Treatability Studies
Area IV Santa Susana Field Laboratory
Ventura County, California
Final Report
June 4, 2015
Prepared by Haizhou Liu
Department of Chemical and Environmental Engineering
University of California, Riverside, CA 92521
Tel: (951) 827-2076 Fax: (951) 827-5696
E-mail: [email protected]

UC Riverside 2
Table of Contents
1. Introduction ............................................................................................................................... 4
2. Roles and Responsibilities of Study Team .............................................................................. 4
3. Basis of the Study ...................................................................................................................... 5
3.1 Study Objectives ............................................................................................................................... 5
3.2 Study Phases...................................................................................................................................... 5
3.3 Study Limitations ............................................................................................................................. 5
4. Study Materials and Methods .................................................................................................. 6
4.1 Background Information ................................................................................................................. 6 4.1.1 Valence State of Mercury in Contaminated Soil ......................................................................... 6
4.1.2 Speciation of Mercury(II) in Contaminated Soil ......................................................................... 7
4.1.3 Mobility and Bioavailability of Mercury in Contaminated Soil .................................................. 8
4.2 Field Sampling .................................................................................................................................. 9
4.3 Soil Analytical and Quality Assurance Procedures ..................................................................... 11
4.4 Analysis of Mercury Valence State ............................................................................................... 12
4.5 Analysis of Mercury Complexes .................................................................................................... 12
5. Study Findings ......................................................................................................................... 15
5.1 Total Mercury Distribution with Soil Depth ................................................................................ 15
5.2 Mercury Speciation Data ............................................................................................................... 19
6. Conclusions .............................................................................................................................. 22
6.1 Conclusions ..................................................................................................................................... 22
6.2 Recommendations ........................................................................................................................... 22
7. References ................................................................................................................................ 23
Appendix A: Analytical Method Reporting Limits
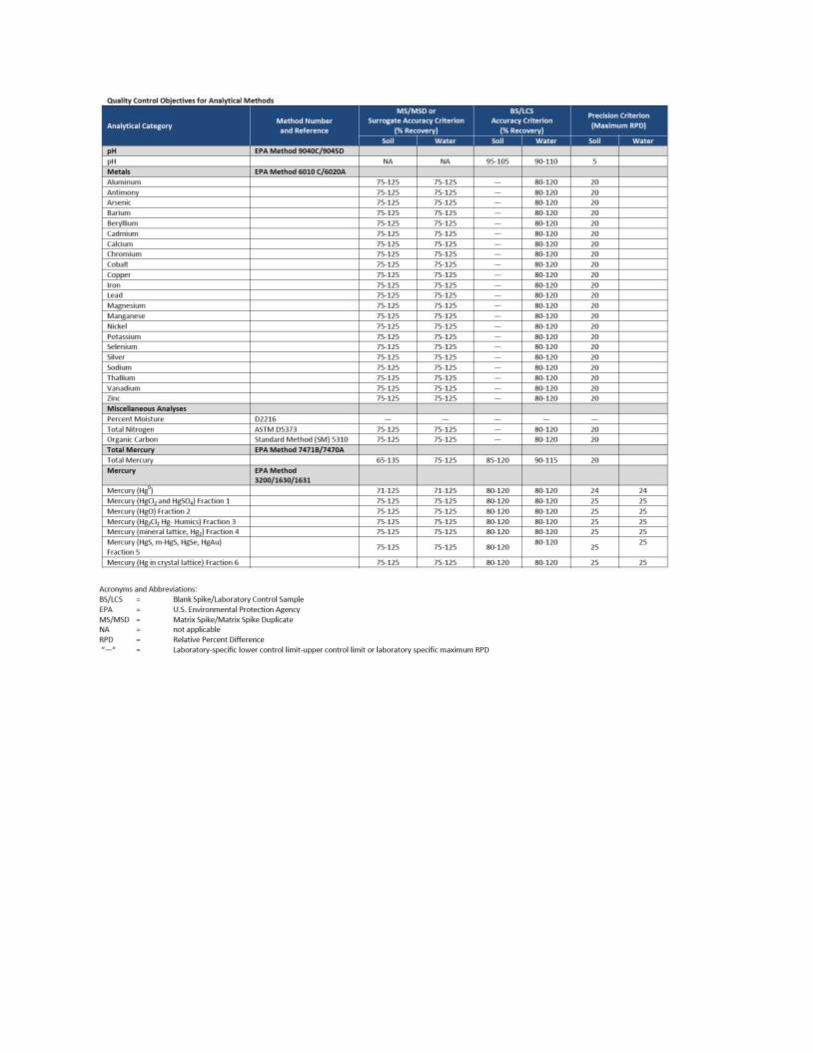
Appendix B: Quality Control Objectives for Analytical Methods
UC Riverside 3
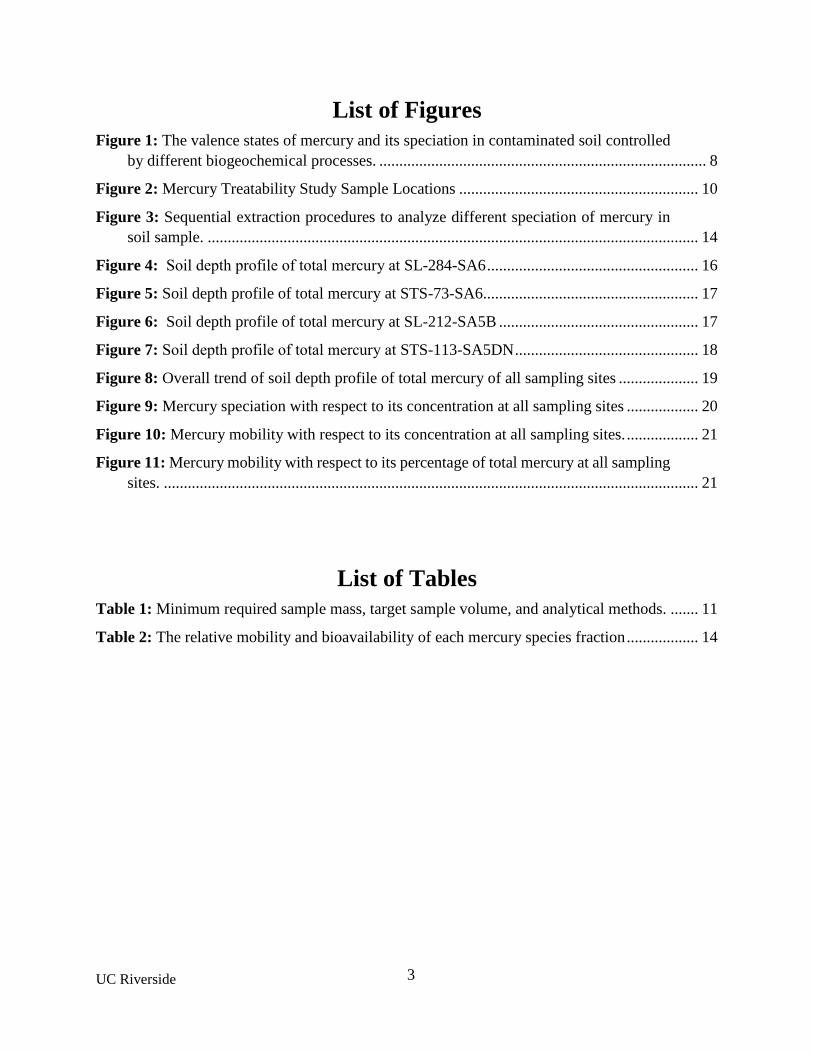
List of Figures
Figure 1: The valence states of mercury and its speciation in contaminated soil controlled
by different biogeochemical processes. .................................................................................. 8
Figure 2: Mercury Treatability Study Sample Locations ............................................................ 10
Figure 3: Sequential extraction procedures to analyze different speciation of mercury in
soil sample. ........................................................................................................................... 14
Figure 4: Soil depth profile of total mercury at SL-284-SA6 ..................................................... 16
Figure 5: Soil depth profile of total mercury at STS-73-SA6...................................................... 17
Figure 6: Soil depth profile of total mercury at SL-212-SA5B .................................................. 17
Figure 7: Soil depth profile of total mercury at STS-113-SA5DN .............................................. 18
Figure 8: Overall trend of soil depth profile of total mercury of all sampling sites .................... 19
Figure 9: Mercury speciation with respect to its concentration at all sampling sites .................. 20
Figure 10: Mercury mobility with respect to its concentration at all sampling sites. .................. 21
Figure 11: Mercury mobility with respect to its percentage of total mercury at all sampling
sites. ...................................................................................................................................... 21
List of Tables
Table 1: Minimum required sample mass, target sample volume, and analytical methods. ....... 11
Table 2: The relative mobility and bioavailability of each mercury species fraction .................. 14

UC Riverside 4
1. Introduction
A mercury spill occurred at the Santa Susana Field Laboratory (SSFL) circa 2000 when the steam
generation facility used for the sodium reactor experiment was being decommissioned. This spill
is referred to as “the primary mercury spill” in this document. Mercury that was deposited on the
soils and in the subsurface from the primary mercury spill was originally in its elemental state, as
indicated by historical records. In addition to the primary mercury spill, other activities at SSFL
may have resulted in smaller quantity mercury releases. The valence state of any spilled mercury
(regardless of source) and its chemical speciation have likely been impacted by a series of
biogeochemical processes in the subsurface since their release.
The purpose of this study is to determine the chemical form(s) of mercury present in Area IV soils.
Knowledge of the mercury chemical form will help to evaluate the proper remediation
technologies for these soils. This mercury study, along with the other four concurrent treatability
studies that were conducted, will support the evaluation of methods for reducing the volume of
contaminated soils that may need to be removed from Area IV by more traditional remediation
methods, such as excavation and offsite transportation/disposal.
2. Roles and Responsibilities of Study Team
The mercury study team consisted of seven entities. These entities, and their roles and
responsibilities, are briefly described below.
The Department of Energy is a responsible party for Area IV of SSFL and provided funding
for the study.
CDM Smith provided overall project management and contracting, was jointly responsible for
preparing the initial mercury contamination study plan, performing field sample collection,
conducting the study with University of California-Riverside (UC Riverside) and the contract
laboratory, and working with the California Department of Toxic Substances Control (DTSC)
to gain regulatory acceptance of the study plan.
UC Riverside was jointly responsible for preparing the mercury contamination study plan with
CDM Smith, conducting the study with CDM Smith and the contract laboratory, and preparing
this final mercury study report.
DTSC is the regulatory agency over Area IV of SSFL.
California Polytechnic State University, San Luis Obispo (Cal Poly) conducted the
bioremediation, natural attenuation, and phytoremediation treatability studies with CDM
Smith. As part of their studies, Cal Poly reviewed the analytical chemistry data from this study
to determine if the chemical form of mercury present in Area IV soils would be bioavailable
or could be converted to a different state that can be readily remediated by bioremediation or
phytoremediation.

UC Riverside 5
Eurofins Lancaster and Eurofins Frontier Global Services (collectively the “contract
laboratory”) performed chemical analyses of the mercury study soil samples. The contract
laboratory performed their analyses at the aforementioned two Eurofin facilities.
The Soil Treatability Investigation Group (STIG) was updated on study progress and results.
3. Basis of the Study
3.1 Study Objectives
The objectives of the mercury contamination study were to:
Determine the current valence state of mercury in contaminated Area IV soils;
Understand the spatial distribution of mercury valence states at different Area IV sites;
Quantify the speciation and mobility of mercury at different soil depths; and
Recommend efficient in situ mercury remediation technologies.
3.2 Study Phases
The mercury contamination study phases were:
Phase 1: study plan preparation, review, and finalizing; STIG meetings concerning the study
plan.
Phase 2: field soil sampling and analysis of samples by contract laboratory.
Phase 3: UC Riverside review and analysis of sample results; STIG meeting concerning study
results.
Phase 4: final report preparation.
3.3 Study Limitations
Sampling sites for mercury soil depth analysis were focused on sites with known or suspected
contamination and that had the potential for in situ remediation (e.g., would be amenable to
bioremediation or phytoremediation). Due to the areal extent of Area IV, not every potential
sampling location could be sampled. However, total mercury analysis was conducted at multiple
locations within Area IV in 2011, including at the sample locations selected for this study. The
2011 data were analyzed in conjunction with the data from the samples collected for this study.
This study assumes that any mercury found in 2011 did not continue to migrate downward through
the soil column between 2011 and 2014 (i.e., contaminant migration has slowed appreciably since
the time period immediately following the release).

UC Riverside 6
4. Study Materials and Methods
4.1 Background Information
4.1.1 Valence State of Mercury in Contaminated Soil
As previously stated, a spill of elemental mercury occurred in Area IV when the steam generation
facility used for sodium reactor experiments was being decommissioned (in addition to other
smaller mercury releases) [1]. In situ thermal treatment would be a viable remedial option if
mercury still remained in its elemental form, as heat can drive mercury out of the soil and its vapor
can be collected and contained for transport and disposal at an offsite treatment facility [2].
However, the valence state of mercury and its chemical speciation have likely been impacted by a
series of bio-geochemical processes in the subsurface since the time of any release.
Total mercury concentration in soil has been analyzed in Area IV to some extent. However, total
mercury analyses do not fully elucidate the behavior of mercury because mercury’s reactivity and
subsequent bioavailability are dependent on its speciation. The lack of data on the chemical
speciation of mercury in contaminated soil poses uncertainties to the implementation of
remediation technologies. Therefore, it is important to understand the current valence state of
mercury species and consequently determine the most effective remediation treatment.
Mercury is a ubiquitous contaminant that can enter the environment from a variety of natural and
anthropogenic sources. Natural sources include rock weathering, geothermal, and volcanic events
[3-4], whereas anthropogenic sources are mainly solid waste incineration, coal combustion, metal
smelting, and mining [5]. Once deposited in soil, mercury can exist in three valence states, i.e., 0,
+1, and +2.
Hg(0): elemental mercury can be readily vaporized into a gaseous state. It can be oxidized to
Hg(I), and subsequently to more stable Hg(II) forms [6]. Meanwhile, Hg(0) can be formed by
reduction of Hg(II) under reducing conditions by abiotic reduction mediated by solid-phase
Fe(II) [7], and biotic enzymatic reduction mediated by the presence of fairly ubiquitous
mercury resistant bacteria that detoxify their environment by converting inducing
concentrations of Hg(II) to Hg(0) [8].
Hg(I): mercury in its +1 valence state only exists as the metastable dimer Hg22+ [9-10]. In soil
environments, the Hg(I) dimmer is formed as a transient species during the oxidation of Hg(0)
to Hg(II), but its relatively short half-life typically prevents it from concentrating to detectable
values [6].
Hg(II): mercury in its +2 valence state is usually the most dominant species in soil and aquifer
sediment. Hg(II) can be present in both inorganic and organic forms. Inorganic Hg(II) species
include mercuric chloride (HgCl2), mercuric oxide (HgO), mercuric sulfide (HgS), and Hg(II)
complexes with soil organic matter. Methyl mercury (CH3Hg+) is typically by far the most
abundant organic form of Hg(II) in soil and groundwater. Dimethyl mercury, (CH3)2Hg, is
another organic species that is highly volatile and very unstable in the presence of light and

UC Riverside 7
typically only concentrates to detectable values in marine sediment and deep seawater [11].
During the methylation process, inorganic Hg(II) is transformed to the methyl mercury
molecule.
Prior studies on mercury speciation in other contaminated soils have identified a variety of Hg(II)
species after the deposition of elemental Hg(0) in soil [6]. For example, after a spill near a plant
using elemental mercury for manufacturing thermometers, an average of 80% of the total mercury
in soil was detected as Hg(II) 20 years after the spill. Fractionation analysis also showed that 60%
of Hg(II) was bound to sulfide as HgS and 30% bound to soil organic matter, with 10% existing
as methyl mercury [12]. The same study also found that the surface layer of soil (0-20 cm) was
characterized by higher mercury concentrations than that of the subsurface soil (60-80 cm).
In another study to examine mercury speciation after an elemental Hg(0) spill in Oak Ridge,
Tennessee, similar results showed that a majority of the Hg(0) had been oxidized to Hg(II) in soil
samples [13]. Studies from different contaminated sites also found that the major Hg(II) species in
soil included HgS, HgCl2, HgSO4, HgO, and Hg-organic complex [14-16]. Depending on its
concentration, the residual Hg(0) (i.e., what is left after oxidation and volatilization) can either
exist as concentrated spherical particles or adsorb to the surface soil particles. It was observed in
the aforementioned study that the adsorption of Hg(0) on soil particles was enhanced with
decreasing soil particle sizes [ 17 ]. The total mercury concentration in contaminated soils
referenced in many of these previous studies had similar ranges to those detected in Area IV soils.
4.1.2 Speciation of Mercury(II) in Contaminated Soil
The biogeochemistry of mercury in soils and sediments has been found to be dominated by
inorganic and organic Hg(II) complexes. A summary of the important biogeochemical processes
that determine the valence state of mercury and its speciation is presented in Figure 1. Hg(II) is
generated via the oxidation of Hg(0). Hg(II) can be abiotically reduced to Hg(0) by iron-containing
minerals in soil in anoxic conditions [18]. Bacteria can also promote Hg(II) reduction by catalyzing
electron transfer from an electron donor to Hg(II) [19, 21]. The speciation of Hg(II) complexes
depends on multiple parameters in the subsurface including oxygen level, ionic composition, soil
organic content, and microbial activities. The speciation of inorganic Hg(II) compounds in soil is
affected by the presence of various inorganic ligands.
Under oxidized surface soil conditions, chloride (Cl-), hydroxide (OH-) and sulfate (SO42-) have
the largest influence on Hg(II) speciation. Consequently, HgCl2, HgOHCl, Hg(OH)2 and HgSO4
are the predominant forms of inorganic mercury [14-16]. Under anoxic subsurface soil and
sediment conditions, in the presence of sulfide (S2-) that is produced by sulfate-reducing bacteria
[22-23], Hg(II) speciation is controlled by cinnabar HgS(s) [13,24]. Its dissolved uncharged
complexes, e. g., HgS0 and Hg(HS)2, are capable of passively diffusing into bacterial cells [25-26]
and undergoing methylation to form methyl mercury by sulfate-reducing bacteria [22-23] and in
some cases iron-reducing bacteria [27-28]. In addition, active uptake of mercury sulfide by sulfate-
reducing bacteria is an important pathway for methylation in anoxic conditions [29].

UC Riverside 8
In addition to complexation with inorganic ligands, Hg(II) can be bound by soil dissolved organic
matter (DOM), which is primarily composed of humic substances [30-31]. Among different
functional groups in humic substances, the reduced-sulfur moieties (e.g., thiol, sulfide, and
bisulfide groups) have the highest Hg(II) binding constants and dominate the speciation of Hg(II)-
DOM complexes [32-34]. As a result of this strong association, Hg-DOM complexes are a major
control on the fate and transport of Hg in soil and sediment, except under high sulfidic conditions
[30].
Figure 1: The valence states of mercury and its speciation in contaminated soil controlled by
different biogeochemical processes.
4.1.3 Mobility and Bioavailability of Mercury in Contaminated Soil
The valence state and speciation of mercury significantly affect its solubility and bioavailability in
soil, and consequently impact the choice of remediation options. Meanwhile, mercury adsorption
to soil mineral surfaces also affects its mobility and bioavailability. Prior studies have found that
an increase in chloride concentration and a decrease in pH can decrease mercury adsorption and
therefore increase the labile fraction of mercury [15-16], which can potentially create a more
favorable environment for mercury uptake by plants and application of phytoremediation. Iron-
containing minerals in the clay fraction of soil particles have a strong capability of adsorbing
mercury [35]. In addition, the mobility and bioavailability of mercury can be quite different in
varying depths of the vadose zone. It is expected that in vegetated areas, the surface soil layer near
the roots of vegetation has higher DOM content and thus a potential for higher concentrations of
Hg(II)-DOM complexes. Consequently, the amount and chemical composition of DOM in soil
play a major role in the transport of mercury through soil profiles [36].
Elemental
Mercury(0)
HgCl2; HgO; HgSO4
Hg(II) sulfide
HgS(s); HgS0; Hg(HS)2 without o
xygen
Soil bacteria
Organo Mercury(II)
(e.g. methyl mercury)
me
thy
lati
on
wit
ho
ut
oxy
ge
n
with oxygen
without oxygen
Transient
Mercury(I)
Soil humic substances
Humic substances
associated Hg(II)
Inorganic Mercury(II)
bioavailability
Remediation options
sulfide complexation

UC Riverside 9
4.2 Field Sampling
This study anticipated significant heterogeneity of total mercury concentrations throughout Area
IV soils, so a review of the existing soil analytical chemistry data set was conducted. Soil samples
for this study were then collected and analyzed from four locations previously sampled in 2011.
The sample locations for this study included:
Two locations near the aforementioned primary mercury spill site (SL-284-SA6 and STS-73-
SA6)
One location in subarea 5B near the 17th street pond and drainage area (SL-212-SA5B)
One location in subarea 5D North (STS-113-SA5ND).
For location SL-284-SA6, samples were previously taken from five depths on November 30, 2011:
0.5 to 1.5 ft, 4 to 5 ft, 9 to 10 ft, 14 to 15 ft, and 15.5 to 16.5 ft. Sampling for this treatability study
was then conducted on May 19, 2014 (this date applies to all mercury treatability study samples)
with one sample taken from the soil depth of 0.5 to 1.5 ft.
For site STS-73-SA6, samples were taken from 4 to 5 ft on July 21, 2011. The samples for this
treatability study were taken from 0.5 to 1.5 ft and 3 to 4 ft. For the treatability samples from this
location, the sample ID is “STS-73-SA6RS,” where RS means “resampling.” These samples had
to be re-collected due to shipping issues with the first set of treatability study samples collected
from this location. A duplicate sample was also taken at this location and was named “STS-373-
SA6.”
For site SL-212-SA5B, samples were previously taken from 0 to 0.5 ft on December 20, 2011. The
samples for this treatability study were taken from two soil depths: 0.5 to 1.5 ft and 3 to 4 ft.
For site SL-113-SA5ND, sampling was previously conducted on June 10, 2011 and samples were
taken from two soil depths: 0 to 0.5 ft and 4 to 5 ft. The samples for this treatability study were
taken from 3 to 4 ft.
The sample locations are presented in Figure 2.

UC Riverside 10
Figure 2: Mercury Treatability Study Sample Locations
UC Riverside 11
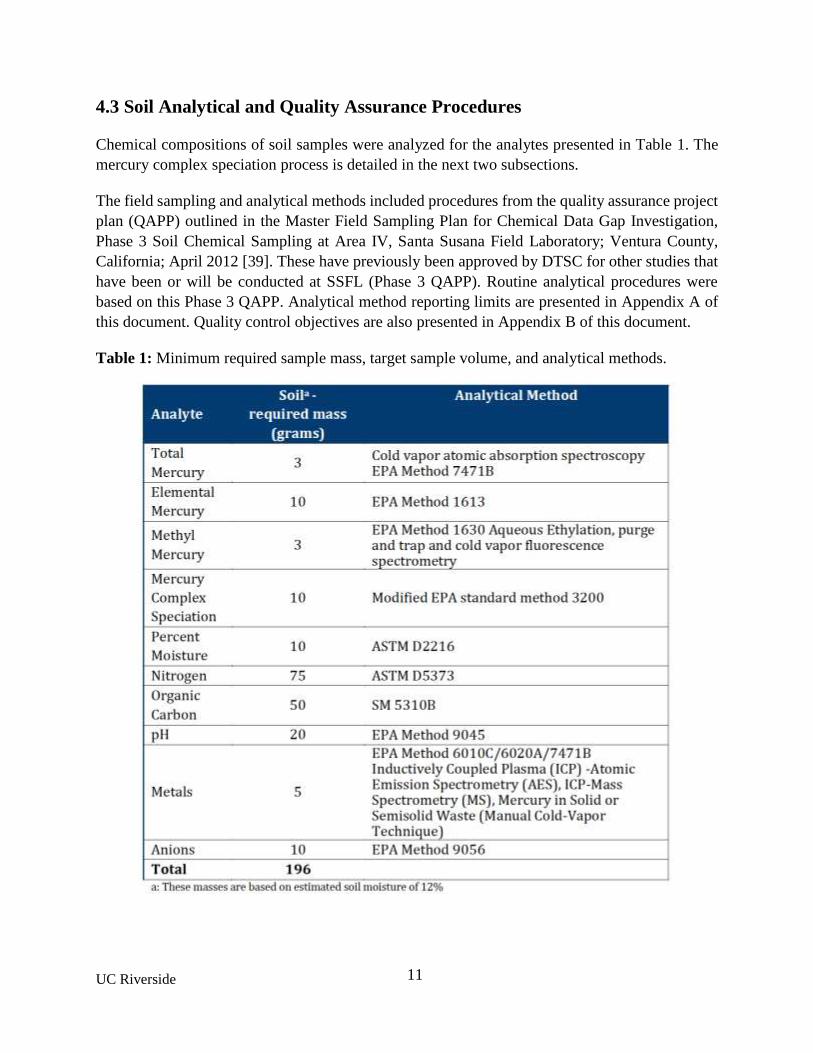
4.3 Soil Analytical and Quality Assurance Procedures
Chemical compositions of soil samples were analyzed for the analytes presented in Table 1. The
mercury complex speciation process is detailed in the next two subsections.
The field sampling and analytical methods included procedures from the quality assurance project
plan (QAPP) outlined in the Master Field Sampling Plan for Chemical Data Gap Investigation,
Phase 3 Soil Chemical Sampling at Area IV, Santa Susana Field Laboratory; Ventura County,
California; April 2012 [39]. These have previously been approved by DTSC for other studies that
have been or will be conducted at SSFL (Phase 3 QAPP). Routine analytical procedures were
based on this Phase 3 QAPP. Analytical method reporting limits are presented in Appendix A of
this document. Quality control objectives are also presented in Appendix B of this document.
Table 1: Minimum required sample mass, target sample volume, and analytical methods.

UC Riverside 12
4.4 Analysis of Mercury Valence State
Analysis of the valence state of mercury was conducted by Eurofins (the contract laboratory). The
following standard analytical methods were used to determine the valence state of mercury in soil
samples.
Total mercury: total mercury in soil samples was measured based on EPA method 7471A,
which is based on cold vapor atomic absorption spectroscopy (CVAFS). In this method, the
soil sample is mixed with high-purity water, nitro-hydrochloric acid and potassium
permanganate. The soil sample is digested and then oxidized to convert the various mercury
forms to labile Hg(II). Mercury Hg(II) is then reduced to Hg(0) by adding stannous sulfate and
purged from solution in a closed system using inert gas. The mercury vapor passes through a
cell positioned in the light path of an atomic absorption spectrophotometer, where the
absorbance of radiation at the 253.7 nm wavelength by mercury vapor is measured as a function
of mercury concentration.
Elemental mercury Hg(0): Analysis of elemental mercury is similar to the EPA method 1613E
that is based on cold vapor atomic fluorescence detection, but the step of adding SnCl2 is
eliminated so that only mercury existing in its original elemental state is trapped on a gold trap
and its vapor is analyzed after desorption by fluorescence detector. Elemental mercury Hg(0)
is sparingly soluble in water and has a significant vapor pressure at room temperature. It is
therefore a suitable candidate for extraction and concentration by purge and trap methodology.
The Hg(0) vapor readily fluoresces under irradiation from a mercury vapor lamp, a property
that allows for very sensitive and specific detection of the element by cold vapor atomic
fluorescence spectrometry.
Hg(II): The concentration of Hg(II) is calculated as the difference between total mercury and
elemental Hg(0) measured based on the previous described steps.
4.5 Analysis of Mercury Complexes
The mobility and bioavailability of mercury in soil is significantly impacted by the speciation of
Hg(II) complexes. Analysis of the speciation of mercury complex was conducted by Eurofins. In
addition to the analysis of the valence state of mercury, a sequential extraction procedure to
determine mercury speciation in the study soil samples was conducted. The sequential extraction
process separates the following fractions: readily soluble mercury (mainly mercury chloride and
mercury hydroxide), mercury bound to humic substances (i.e., Hg(II)-DOM complexes), mercury
sulfide, organic mercury, and elemental mercury. In this process, the soil sample is sequentially
extracted by chloroform, methanol, hydrochloric acid, sodium hydroxide and sodium sulfide.
One previous study using this extraction method successfully separated the contribution of
mercury between a.) mercury bound to humic substance and b.) mercury sulfide in soil samples
[37]. It is found that the mercury bound to humic substances comprised a significant contribution
of the mercury percentage, especially in the top layer of soil. On the other hand, mercury sulfide
was the dominant mercury form in the samples from lower layers of the soil profile in the same
UC Riverside 13
aforementioned study. It is believed that when mercury is bound to humic substances, it can
increase its bioavailability and make phytoremediation possible, whereas mercury sulfide is much
less mobile and therefore much less bioavailable. This same analytical procedure was used in this
study to determine mercury(II) speciation in Area IV soil samples and to help recommend potential
follow-on work to identify potentially feasible mercury remediation techniques.
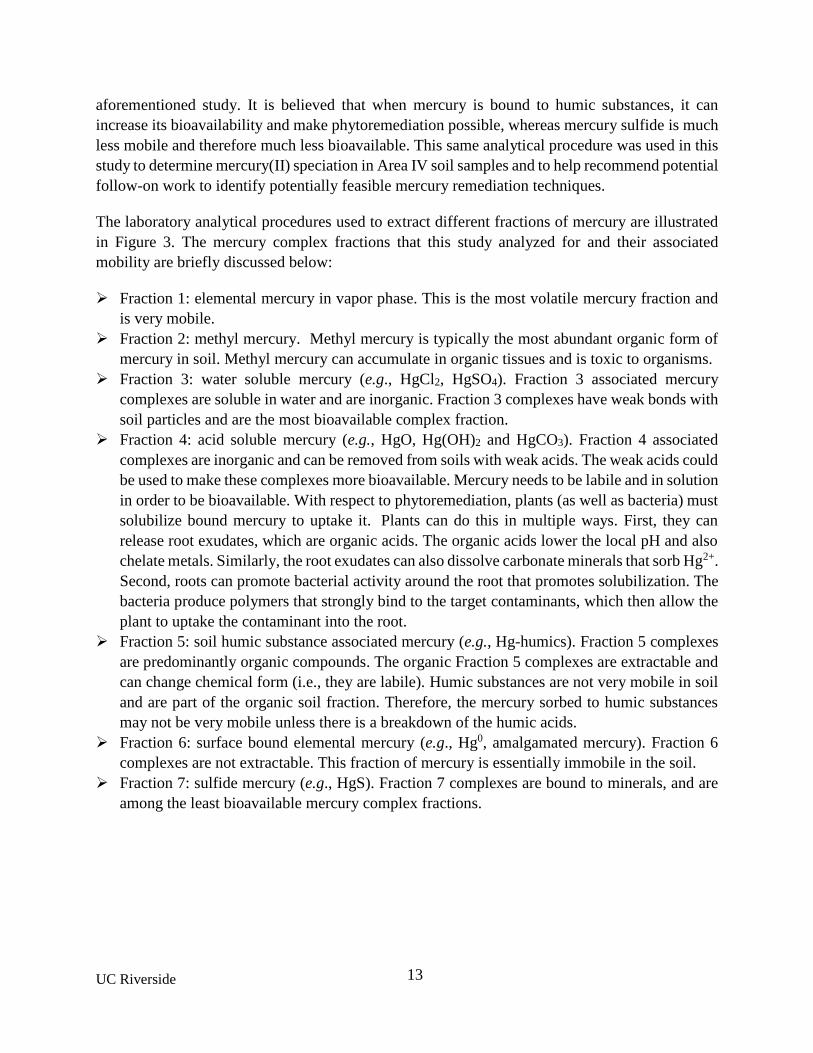
The laboratory analytical procedures used to extract different fractions of mercury are illustrated
in Figure 3. The mercury complex fractions that this study analyzed for and their associated
mobility are briefly discussed below:
Fraction 1: elemental mercury in vapor phase. This is the most volatile mercury fraction and
is very mobile.
Fraction 2: methyl mercury. Methyl mercury is typically the most abundant organic form of
mercury in soil. Methyl mercury can accumulate in organic tissues and is toxic to organisms.
Fraction 3: water soluble mercury (e.g., HgCl2, HgSO4). Fraction 3 associated mercury
complexes are soluble in water and are inorganic. Fraction 3 complexes have weak bonds with
soil particles and are the most bioavailable complex fraction.
Fraction 4: acid soluble mercury (e.g., HgO, Hg(OH)2 and HgCO3). Fraction 4 associated
complexes are inorganic and can be removed from soils with weak acids. The weak acids could
be used to make these complexes more bioavailable. Mercury needs to be labile and in solution
in order to be bioavailable. With respect to phytoremediation, plants (as well as bacteria) must
solubilize bound mercury to uptake it. Plants can do this in multiple ways. First, they can
release root exudates, which are organic acids. The organic acids lower the local pH and also
chelate metals. Similarly, the root exudates can also dissolve carbonate minerals that sorb Hg2+.
Second, roots can promote bacterial activity around the root that promotes solubilization. The
bacteria produce polymers that strongly bind to the target contaminants, which then allow the
plant to uptake the contaminant into the root.
Fraction 5: soil humic substance associated mercury (e.g., Hg-humics). Fraction 5 complexes
are predominantly organic compounds. The organic Fraction 5 complexes are extractable and
can change chemical form (i.e., they are labile). Humic substances are not very mobile in soil
and are part of the organic soil fraction. Therefore, the mercury sorbed to humic substances
may not be very mobile unless there is a breakdown of the humic acids.
Fraction 6: surface bound elemental mercury (e.g., Hg0, amalgamated mercury). Fraction 6
complexes are not extractable. This fraction of mercury is essentially immobile in the soil.
Fraction 7: sulfide mercury (e.g., HgS). Fraction 7 complexes are bound to minerals, and are
among the least bioavailable mercury complex fractions.
UC Riverside 14
Figure 3: Sequential extraction procedures to analyze different speciation of mercury in soil
sample.
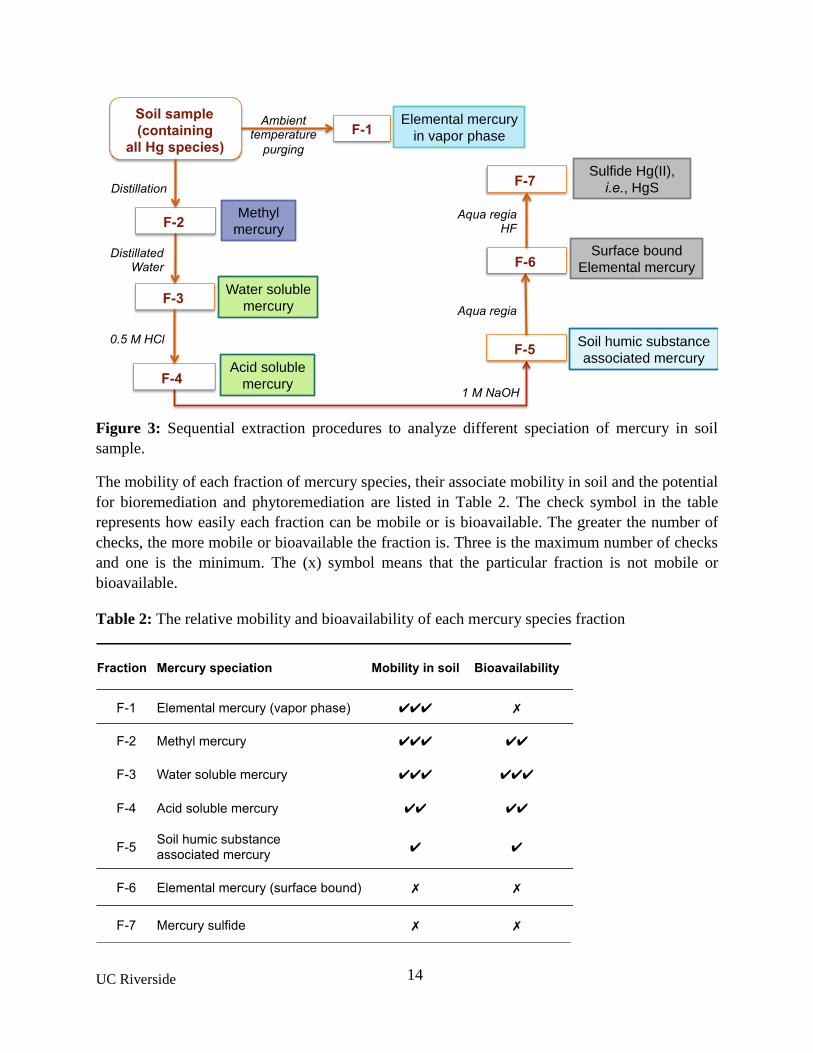
The mobility of each fraction of mercury species, their associate mobility in soil and the potential
for bioremediation and phytoremediation are listed in Table 2. The check symbol in the table
represents how easily each fraction can be mobile or is bioavailable. The greater the number of
checks, the more mobile or bioavailable the fraction is. Three is the maximum number of checks
and one is the minimum. The (x) symbol means that the particular fraction is not mobile or
bioavailable.
Table 2: The relative mobility and bioavailability of each mercury species fraction
Elemental mercury
in vapor phase
Soil sample
(containing
all Hg species)
Ambient temperature
purging
F-3
F-4
Distillated Water
Water soluble
mercury
0.5 M HCl
Acid soluble
mercury
F-5
1 M NaOH
Soil humic substance
associated mercury
F-6
Aqua regia
Surface bound
Elemental mercury
F-7
Aqua regia HF
Sulfide Hg(II),
i.e., HgS
F-2
Distillation
Methyl
mercury
F-1

UC Riverside 15
Elemental mercury in the vapor phase in soil (Fraction F-1) is extremely mobile. Therefore, it
receives three checks for its mobility. The F-1 fraction is not available for bacterial or plant uptake.
Methyl mercury (Fraction F-2) is organo mercury whose mobility depends upon its complexation.
Generally, it can be taken up by plants or bacteria.
Water soluble mercury (Fraction F-3) is basically a dissolved form of mercury, normally existing
as mercury chloride or mercury sulfate. This fraction of mercury can be easily washed away by
rain and actively taken up by plants and bacteria. Therefore, Fraction F-3 receives three checks for
both mobility and bioavailability potentials.
Acid soluble mercury (Fraction F-4) is mostly composed of inorganic mercury minerals that can
be dissolved under acidic conditions, including mercury carbonate and hydroxide minerals. The
dissolution of these minerals can take place when plant roots or bacterial cells exude organic acids
capable of dissolving the minerals. Therefore, this fraction receives two checks for its mobility
and bioavailability.
Soil humic substance associated mercury (Fraction F-5) is not very mobile in soil. Humic
substances are part of the organic soil fraction. Therefore, the mercury sorbed to humic substances
may not be very mobile unless there is a breakdown of the humic acids. This fraction receives one
check for its mobility and bioavailability.
Fraction F-6 is surface bound elemental mercury (mostly as amalgamated mercury). This form of
elemental mercury can only be extracted from soil with very strong acids. Therefore, this fraction
is essentially immobile in the soil and receives symbols of (x) for its mobility and bioavailability.
Finally, Fraction F-7 represents sulfide mercury (e.g., HgS). This fraction of mercury is tightly
bound in a mineral lattice, and is among the least bioavailable mercury complex fractions.
5. Study Findings
5.1 Total Mercury Distribution with Soil Depth
The mercury depth data were analyzed for each of the four treatability study sample locations.
Since sampling at these locations took place in both 2011 and 2014, the depth analysis is based on
an assumption that the mercury did not mobilize over that three year period.
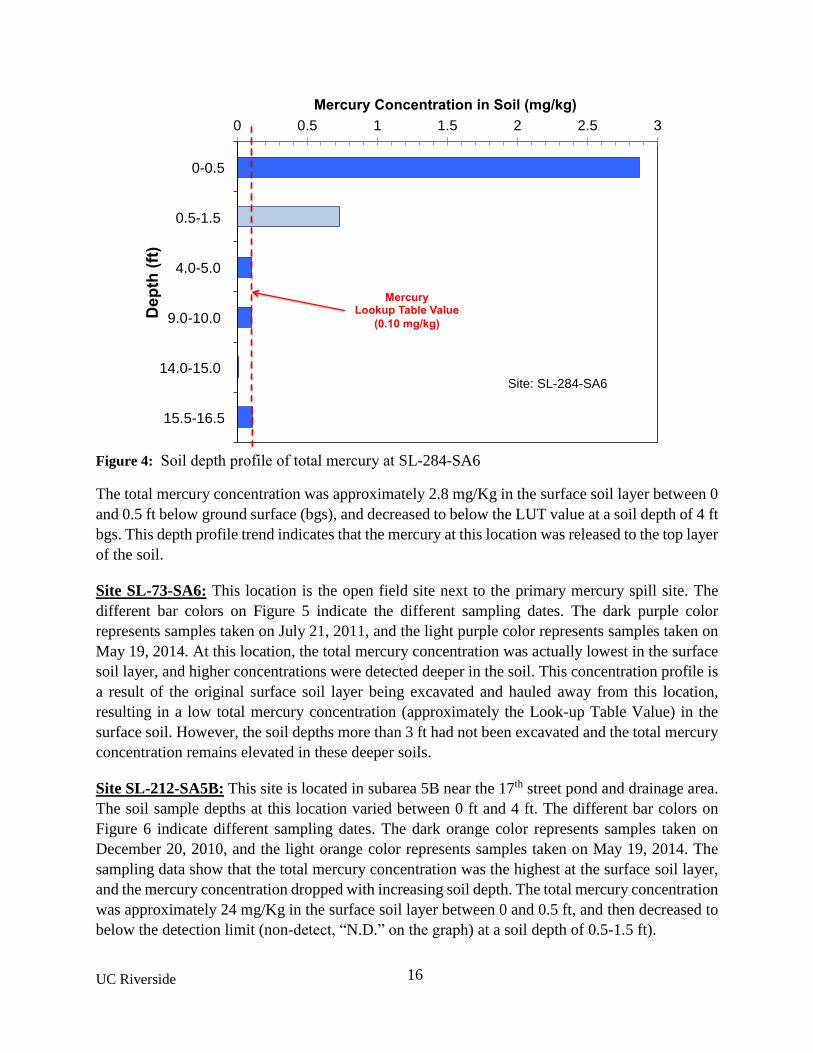
Site SL-284-SA6: This location is the primary mercury spill site. The different bar colors on
Figure 4 indicate the different sampling dates. The dark blue color represents samples taken on
November 30, 2011, and the light blue color represents samples taken on May 19, 2014. The
sampling data show that the total mercury concentration was the highest at the top soil layer, and
its concentration dropped with soil depth. The red dashed line represents the mercury LUT value,
which is 0.10 mg mercury per kilogram of soil.
UC Riverside 16
Figure 4: Soil depth profile of total mercury at SL-284-SA6
The total mercury concentration was approximately 2.8 mg/Kg in the surface soil layer between 0
and 0.5 ft below ground surface (bgs), and decreased to below the LUT value at a soil depth of 4 ft
bgs. This depth profile trend indicates that the mercury at this location was released to the top layer
of the soil.
Site SL-73-SA6: This location is the open field site next to the primary mercury spill site. The
different bar colors on Figure 5 indicate the different sampling dates. The dark purple color
represents samples taken on July 21, 2011, and the light purple color represents samples taken on
May 19, 2014. At this location, the total mercury concentration was actually lowest in the surface
soil layer, and higher concentrations were detected deeper in the soil. This concentration profile is
a result of the original surface soil layer being excavated and hauled away from this location,
resulting in a low total mercury concentration (approximately the Look-up Table Value) in the
surface soil. However, the soil depths more than 3 ft had not been excavated and the total mercury
concentration remains elevated in these deeper soils.
Site SL-212-SA5B: This site is located in subarea 5B near the 17th street pond and drainage area.
The soil sample depths at this location varied between 0 ft and 4 ft. The different bar colors on
Figure 6 indicate different sampling dates. The dark orange color represents samples taken on
December 20, 2010, and the light orange color represents samples taken on May 19, 2014. The
sampling data show that the total mercury concentration was the highest at the surface soil layer,
and the mercury concentration dropped with increasing soil depth. The total mercury concentration
was approximately 24 mg/Kg in the surface soil layer between 0 and 0.5 ft, and then decreased to
below the detection limit (non-detect, “N.D.” on the graph) at a soil depth of 0.5-1.5 ft).
0 0.5 1 1.5 2 2.5 3
0-0.5
0.5-1.5
4.0-5.0
9.0-10.0
14.0-15.0
15.5-16.5
Mercury Concentration in Soil (mg/kg)
De
pth
(ft
)
Site: SL-284-SA6
Mercury Lookup Table Value
(0.10 mg/kg)

UC Riverside 17
Figure 5: Soil depth profile of total mercury at STS-73-SA6
Figure 6: Soil depth profile of total mercury at SL-212-SA5B
0 2 4 6 8 10
0.5-1.5
3.0-4.0
4.0-5.0
Mercury Concentration in Soil (mg/kg)
De
pth
(ft
)
Site: STS-73-SA6
Mercury Lookup Table Value
(0.10 mg/kg)
0 5 10 15 20 25
0-0.5
0.5-1.5
3.0-4.0
Mercury Concentration in Soil (mg/kg)
De
pth
(ft
)
Site: SL-212-SA5B
Mercury Lookup Table Value
(0.10 mg/kg)
N.D.

UC Riverside 18
Site STS-113-SA5ND: This site is located in subarea 5D North. Initial sampling was conducted
on June 10, 2011 with two soil depth intervals collected: 0 to 0.5 ft and 4 to 5 ft (shown in the light
green color in Figure 7). The treatability study sampling was conducted on May 19, 2014 at a soil
depth of 3 to 4 ft. The sampling data show that the total mercury concentration was the highest at
the surface soil layer, and the mercury concentration dropped with increasing soil depth. The total
mercury concentration was approximately 54 mg/Kg in the surface soil layer between 0 and 0.5 ft
below the surface, and decreased to below the detection limit (N.D.) at a soil depth below 3 ft.
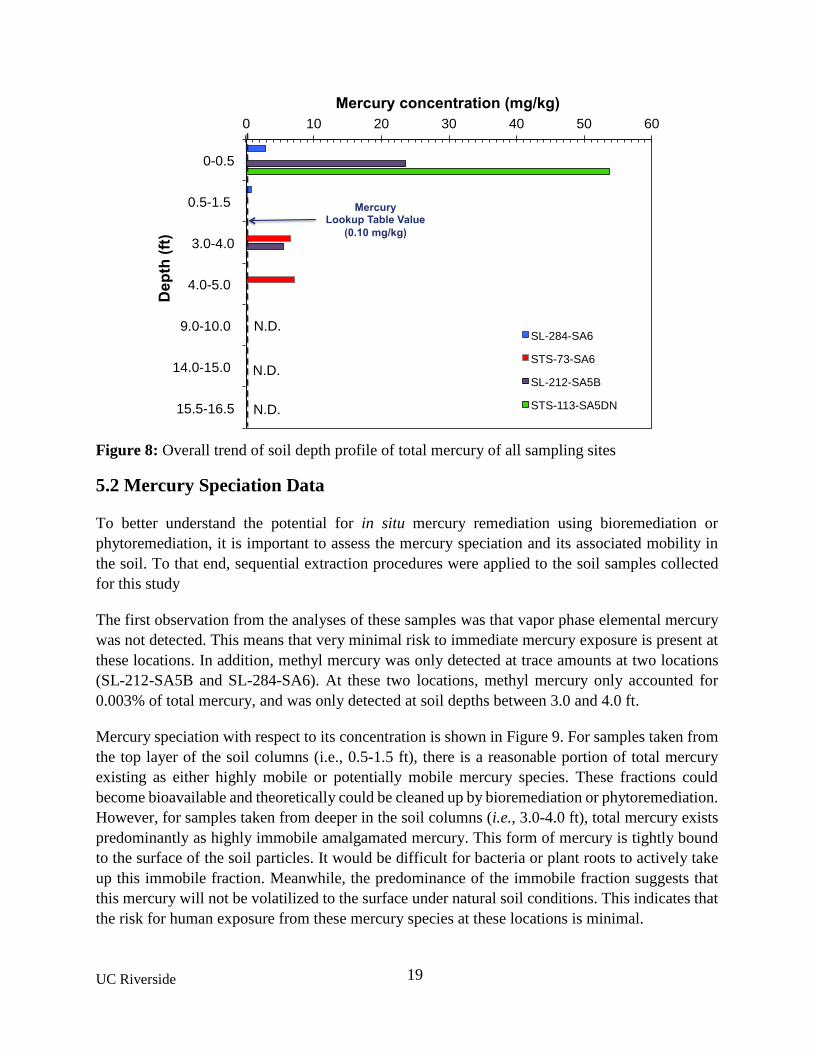
Summary of Total Mercury Analysis with Soil Depths
Based on the sampling data from the four treatability study sample locations, the general trend for
the mercury concentration profile is that total mercury decreases with soil depth (Figure 8), with
the exception of STS-73-SA6. STS-73-SA6 had mercury surface soil concentrations below the
LUT values due to a previous excavation of contaminated surface soils. Below the depth of this
excavation, mercury was elevated above the LUT values.
Figure 7: Soil depth profile of total mercury at STS-113-SA5DN
0 10 20 30 40 50 60
0-0.5
3.0-4.0
4.0-5.0
Mercury Concentration in Soil (mg/kg)
De
pth
(ft
)
Site: STS-113-SA5DN
Mercury Lookup Table Value
(0.10 mg/kg)
N.D.
N.D.
UC Riverside 19
Figure 8: Overall trend of soil depth profile of total mercury of all sampling sites
5.2 Mercury Speciation Data
To better understand the potential for in situ mercury remediation using bioremediation or
phytoremediation, it is important to assess the mercury speciation and its associated mobility in
the soil. To that end, sequential extraction procedures were applied to the soil samples collected
for this study
The first observation from the analyses of these samples was that vapor phase elemental mercury
was not detected. This means that very minimal risk to immediate mercury exposure is present at
these locations. In addition, methyl mercury was only detected at trace amounts at two locations
(SL-212-SA5B and SL-284-SA6). At these two locations, methyl mercury only accounted for
0.003% of total mercury, and was only detected at soil depths between 3.0 and 4.0 ft.
Mercury speciation with respect to its concentration is shown in Figure 9. For samples taken from
the top layer of the soil columns (i.e., 0.5-1.5 ft), there is a reasonable portion of total mercury
existing as either highly mobile or potentially mobile mercury species. These fractions could
become bioavailable and theoretically could be cleaned up by bioremediation or phytoremediation.
However, for samples taken from deeper in the soil columns (i.e., 3.0-4.0 ft), total mercury exists
predominantly as highly immobile amalgamated mercury. This form of mercury is tightly bound
to the surface of the soil particles. It would be difficult for bacteria or plant roots to actively take
up this immobile fraction. Meanwhile, the predominance of the immobile fraction suggests that
this mercury will not be volatilized to the surface under natural soil conditions. This indicates that
the risk for human exposure from these mercury species at these locations is minimal.
0 10 20 30 40 50 60
0-0.5
0.5-1.5
3.0-4.0
4.0-5.0
9.0-10.0
14.0-15.0
15.5-16.5
Mercury concentration (mg/kg)
De
pth
(ft
)
SL-284-SA6
STS-73-SA6
SL-212-SA5B
STS-113-SA5DN
Mercury Lookup Table Value
(0.10 mg/kg)
N.D.
N.D.
N.D.

UC Riverside 20
Figure 9: Mercury speciation with respect to its concentration at all sampling sites
The mobility of the mercury species at the sampling locations is illustrated in Figure 10 with
respect to its concentration, and further visualized in Figure 11 with respect to its percentage. The
total mercury is divided into three categories: mobile mercury (Fraction 3 from sequential
extraction), potentially mobile mercury (Fractions 4 and 5) and immobile mercury (Fractions 6
and 7). The sample ID SL-73-SA6RS is a resample from the same site of SL-73-SA6 on May 19,
2014 for speciation analysis.
For the surface soils, the mercury mobility varies depending upon location. For mercury-
containing deep soils, total mercury exists predominantly as highly immobile amalgamated
mercury (Figure 11). This fraction of mercury is expected to remain stable for a significant time
period, and is resistant to bioremediation or phytoremediation. Thermal treatment could be an
alternative to remediate mercury in deep soil, but additional lab tests would be required to
determine the feasibility of this technology.

UC Riverside 21
Figure 10: Mercury mobility with respect to its concentration at all sampling sites.
Figure 11: Mercury mobility with respect to its percentage of total mercury at all sampling sites.
Note for Figure 11: The numbers at the top of the bars show total mercury concentrations in the
unit of mg/kg.
0%
20%
40%
60%
80%
100%
STS-113-SA5DN
0.5-1.5 ft
SL-373-SA6RS
0.5-1.5 ft
SL-284-SA6
0.5-1.5 ft
SL-212-SA5B
3.0-4.0 ft
SL-073-SA6RS
3.0-4.0 ft
Merc
ury
Mo
bilit
y D
istr
ibu
tio
n
Sampling Location
Mobile mercury
Potentially mobile mercury
Immobile mercury
0.03 0.23 0.73 5.51 6.67
UC Riverside 22
6. Conclusions
Conclusions from this mercury study are presented first, followed by recommendations for
additional consideration.
6.1 Conclusions
With respect to the soil depth profile, the majority of total mercury was distributed in surface
soils with depths between 0 and 1.5 ft.
In three sampling locations, mercury concentrations were highest in surface soils and decreased
with soil depth. Total mercury exceeded Look-up Table Value (0.10 mg/kg) at these locations.
STS-73-SA6 had the soil from 0 to 3 ft excavated and this sampling location did not match the
trend present at the other three sampling locations.
With respect to valence state, no elemental vapor phase mercury was detected in any of the
samples. Elemental mercury tightly bound to soil particles was found mostly in deep soils.
Methyl mercury was detected only in trace amounts at a few locations. Ionic mercury in a
divalent state was widely observed in surface soils.
In some surface soils with depths between 0.5 and 1.5 ft, a considerable fraction of mercury
exists in chemical forms that are mobile or potentially bioavailable. This suggests that soil
washing, bioremediation and phytoremediation, theoretically, could be viable treatment
options to remove the mobile fractions of mercury in these surface soils. However, the
immobile fraction of mercury (i.e., that fraction of mercury not susceptible to bioremediation
or phytoremediation) at many of these same locations is still above the LUT values; therefore,
bioremediation and phytoremediation will likely not be able to achieve LUT values for
mercury at many locations.
In deeper soils below 3 ft, a majority of mercury exists in the immobile elemental form that is
tightly bound to soil particles. Additional testing of potential alternative cleanup approaches
would be required to determine the feasibility of any treatment methods, especially at locations
near the primary mercury spill site.
6.2 Recommendations
Based on the analytical results and conclusions, a number of recommendations are proposed.
Phytoremediation, theoretically, could be a viable treatment for mercury remediation in surface
soil layers. A large fraction of mercury is present in potentially mobile fractions (Fractions F-
3, F-4 and F-5) that are associated with soluble salts and soil organic matter. These fractions
can be solubilized by plant roots and bacteria, which then enhances the mobility of mercury
and promotes its uptake by plants and bacteria from the soil. However, due to the
concentrations of immobile mercury at these locations, it is unlikely that phytoremediation
could achieve LUT values for mercury.
Because a large fraction of mercury is present in potentially mobile fraction in surface soil
layers, soil washing of the top soil layer is potentially applicable to remove the mobile mercury,
UC Riverside 23
but this would require additional testing to determine the feasibility of this technology on Area
IV soils.
Bioremediation or phytoremediation is not likely to be effective for deep soil. The
predominance of mercury in deeper soils is immobile mercury, and mostly in an elemental
valence state and tightly bound to soil particles.
Thermal treatment could be an alternative to remediate mercury in deep soils, but additional
testing would be required to determine the feasibility of using this technology on deep Area
IV soils.
Soil size partitioning has the potential to reduce volume for thermal treatment. Additional
testing on the distribution of mercury species within the soil particle sizes would be required
to determine the feasibility of using this technology on Area IV soils.
7. References
1 Sandia National Laboratories. Soil treatability study: investigation recommended for resolving
uncertainty about soil remediation at ETEC. Department of Energy. 2012.
2 Taube, F.; Pommer, L.; Larsson, T.; Shchukarev, A.; Nordin, A. Soil remediation - mercury
speciation in soil and vapor phase during thermal treatment. Water Air and Soil Pollution. 2008,
193, 155-163.
3 Loppi, S. Environmental distribution of mercury and other trace elements in the geothermal area
of Bagnore (Mt. Amiata, Italy). Chemosphere. 2001, 45, 991-995.
4 Ferrara, R.; Mazzolai, B.; Lanzillotta, E.; Nucaro, E.; Pirrone, N. Volcanoes as emission sources
of atmospheric mercury in the Mediterranean basin. Sci. Total Environ. 2000, 259, 115-121.
5 N.E. Selin, Global biogeochemical cycling of mercury: a review. Annu. Rev. Environ. Resour.
2009, 34, 43-63.
6 Skyllberg, U. Chemical speciation of mercury in soil and sediment. In Environmental Chemistry
and Toxicology of Mercury. Wiley Inc., NY. 2011. pp. 219-258.
7 Wiatrowski, H.A.; Das, S.; Kukkadapu, R.; Ilton, E.S.; Barkay, T.; Yee, N. Reduction of Hg(II) to
Hg(0) by magnetite. Environmental Science and Technology. 2009, 43, 5307-5313.
8 Dash, H. R.; Das, S. Bioremediation of mercury and the impacts of bacterial mer genes: A
Review. International Biodeterioration and Biodegradation. 2012, 75, 207-213.
9 Schroeder, W. H.; Munthe, J. Atmospheric mercury - an overview. Atmospheric Environment. 1998,
32, 14-21.
10 Lin, C.; Pehkonen, S.O. Aqueous phase reactions of mercury with free radicals and chlorine:
implications for atmospheric mercury chemistry. Chemosphere. 1999, 38, 11-23. 11 Batrakova, N.; Travnikov, O.; Rozovskaya, O. Chemical and physical transformation of
mercury in the ocean: a review. Ocean Science. 2014, 10, 1047-1063. f

UC Riverside 24
12 Boszke, L.; Kowalski, A.; Astel, A.; Baranski, A.; Gworek, B.; Siepak, J. Mercury mobility and
bioavailability in soil from contaminated area. Environmental Geology. 2008, 55, 1075-1087.
13 Han, F.X.; Shiyab, S.; Chen, J.; Su, Y.; Monts, D.L.; Waggoner, C.A.; Matta, F.B. Extractability
and bioavailability of mercury from a mercury sulfide contaminated soil in Oak Ridge, Tennessee,
USA. Water, Air, & Soil Pollution. 2008, 194, 67–75.
14 Bernaus, A.; Gaona, X.; van-Ree, D.; Valiente, M. Determination of mercury in polluted soils
surrounding a chlor-alkali plant: direct speciation by X-ray absorption spectroscopy techniques and
preliminary geochemical characterization of the area, Anal. Chim. Acta. 2006, 565, 73-80.
15 Kim, C.S. Characterization and speciation of mercury-bearing mine wastes using X-ray absorption
spectroscopy, Science of the Total Environment. 2000, 261, 157–168.
16 Kim, C.S.; Rytuba, J.J.; Brown, G.E. Geological and anthropogenic factors influencing mercury
speciation in mine wastes: an EXAFS spectroscopy study, Applied Geochemistry. 2004, 19, 379-
393.
17 Terzano, R.; Santoro, A.; Spagnuolo, M.; Vekemans, B.; Medici, L.; Janssens, K.; Gottlicher, J.;
Denecke, M.A.; Mangold, S.; Ruggiero, P. Solving mercury (Hg) speciation in soil samples by
synchrotron X-ray microspectroscopic techniques. Environmental Pollution. 2010, 158, 2702-2709.
18 Wiatrowski, H.; Das, S.; Kukkadapu, R.; Ilton, E.S.; Barkay, T.; Yee, N. Reduction of Hg(II) to
Hg(0) by magnetite. Environmental Science and Technology. 2009, 43, 5307-5313.
19 Barkay, T.; Miller, S. M.; Summers, A. O. Bacterial mercury resistance from atoms to ecosystems.
FEMS Microbiol. Rev. 2003, 27, 355–384.
20 Takeuchi, F.; Iwahori, K.; Kamimura, K.; Negishi, A.; Maeda, T.; Sugio, T. Volatilization of
Mercury under Acidic Conditions from Mercury-polluted soil by a mercury-resistant
Acidothiobacillus ferooxidans SUG2-2. Biosci. Biotechnol. Biochem. 2001, 65, 1981-1986.
21 Wiatrowski, H. A.; Ward, P. M.; Barkay, T. Novel reduction of mercury(II) by mercury-sensitive
dissimilatory metal reducing bacteria. Environ. Sci. Technol. 2006, 40, 6690-6696.
22 Gilmour, C. C.; Henry, E. A.; Mitchell, R. Sulfate stimulation of mercury methylation in freshwater
sediments. Environ. Sci. Technol. 1992, 26, 2281–2287.
23 Compeau, G. C.; Bartha, R. Sulfate-reducing bacterias: principle methylators of mercury in anoxic
estuarine sediment. Appl. Environ. Microbiol. 1985, 50, 498–502.
24 Ulrich, P.D.; Sedlak, D.L. Impact of iron amendment on net methylmercury export from tidal
wetland microcosms. Environmental Science and Technology. 2010, 44, 7659-7665.
25 Benoit, J. M.; Gilmour, C. C.; Mason, R. P.; Heyes, A. Sulfide controls on mercury speciation and
bioavailability to methylating bacteria in sediment pore waters. Environmental Science and
Technology. 1999, 33, 951-957.
26 Drott, A.; Lambertsson, L.; Bjorn, E.; Skyllberg, U. Importance of dissolved neutral mercury
sulfides for methyl mercury production in contaminated sediments. Environmental Science and
Technology. 2007, 41, 2270-2276.
27 Fleming, E. J.; Mack, E. E.; Green, P. G.; Nelson, D. C. Mercury methylation from unexpected
sources: Molybdate-inhibited freshwater sediments and an iron-reducing bacterium. Appl.
Environ. Microbiol. 2006, 72, 457-464.
UC Riverside 25
28 Kerin, E. J.; Gilmour, C. C.; Roden, E.; Suzuki, M. T.; Coates, J. D.; Mason, R. P. Mercury
methylation by dissimilatory iron-reducing bacteria. Appl. Environ. Microbiol. 2006, 72, 7919-
7921.
29 Lin, C.; Yee, N.; Barkay, T. Microbial Transformations in the Mercury Cycle. In: Environmental
Chemistry and Toxicology of Mercury, First Edition. 2012, 155-191.
30 Ravichandran, M. Interactions between mercury and dissolved organic matter - a review.
Chemosphere. 2004, 55, 13-21.
31 Morel, F.M.M.; Kraepiel, A,M,L,; Amyot, M. The chemical cycle and bioaccumulation of
mercury. Annu Rev Ecol Syst. 1998, 29, 543-566.
32 Skyllberg, U.; Bloom, P.R.; Qian, J.; Lin, C.M.; Bleam, W.F. Complexation of mercury(II) in
soil organic matter: EXAFS evidence for linear two-coordination with reduced sulfur groups.
Environmental Science and Technology. 2006, 40, 4174-4180.
33 Skyllberg, U.; Drott, A. Competition between disordered iron sulfide and natural organic matter
associated thiols for mercury(II)-an EXAFS study. Environmental Science and Technology.
2010, 44, 1254-1259.
34 Gasper, J.D.; Aiken, G.R.; Ryan, J.N. A critical review of three methods used for the
measurement of mercury (Hg2+)-dissolved organic matter stability constants. Applied
Geochemistry. 2007, 22, 1583-1597.
35 Kim, C.S.; Rytuba, J.J.; Brown, G.E. EXAFS study of mercury(II) sorption to Fe- and Al-
(hydr)oxides I. Effects of pH. Journal of Colloidal and Interface Science. 2004, 271, 1-15.
36 Semu, E.; Singh, B.R.; Selmer-Olsen, A.R.; Adsorption of mercury compounds by tropical soils.
II. Effect of soil: solution ratio, ionic strength, pH, and organic matter. Water, Air, & Soil Pollution.
1987, 32, 1-10.
37 Boszke, L.; Kowalski, A.; Astel, A.; Baranski, A.; Gworek, B.; Siepak, J. Mercury mobility
and bioavailability in soil from contaminated area. Environmental Geology. 2008, 55, 1075-
1087.

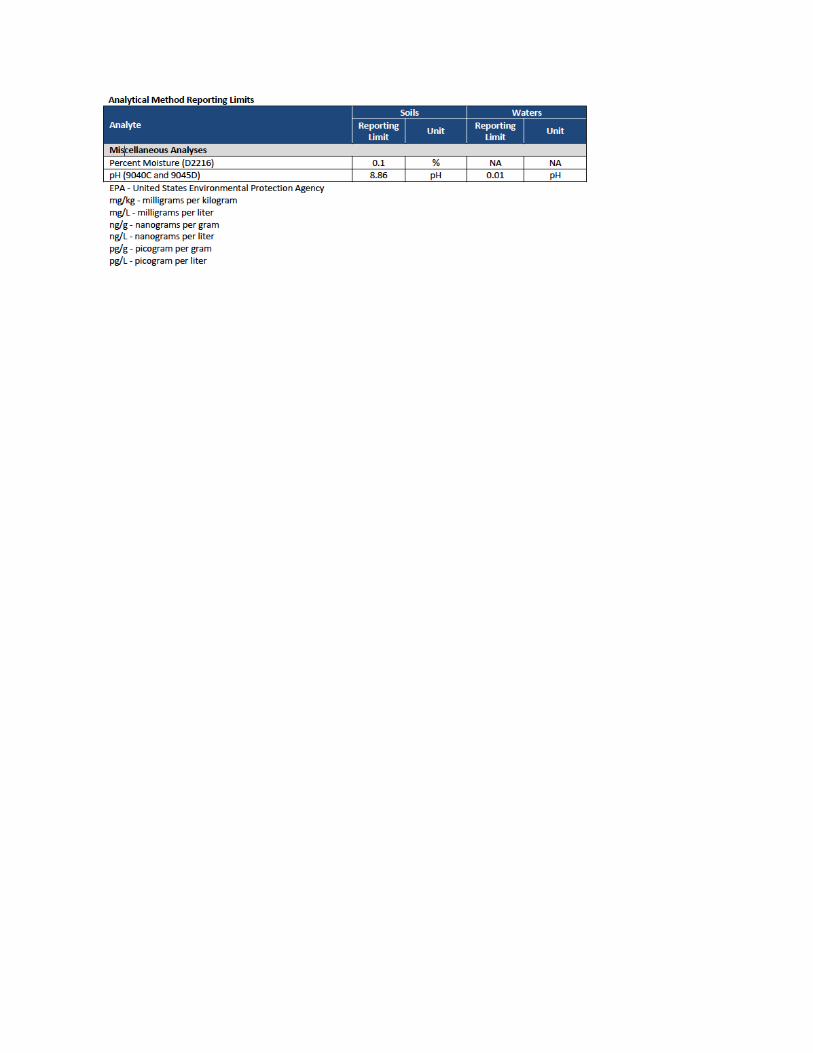
Appendix A
Analytical Method Reporting Limits


Appendix B
Quality Control Objectives for Analytical
Methods