treatability studies in support of the nonradiological
TRANSCRIPT


Piiated in the \.Jgii& States of America. .Available f:nm Netional .I echoici! Information Sexics
U.S. Dep~:ii-t~~eni 0; Commerce 5285 Pori FiOya! Road. Sprii-igfield, Virginia 23161
NTiS price cod.-.s----PmEed Copy: “09 Microfiche ......... .......... .......... ......................... .............
............. .,_.-___ ..........................
This repori v:ds prep 3 as an account of work sponsored by an agency of the United S?atcsGovern nt. NeiIhe,theUnitec;StatesGovernmen! norany agency thereof, n G i hi3k of the!: ei.2ployecs, makes any warranty. express O i ixiplied. or assumes any !ega! liability or responsibility for the accuracy, col-iipleteness, or usefullness of any information. apparatus, product. or process disclosed. or reprdsents that its use ! w u l d not infringt. privately o:.:nec! r~gh is . ecierence here!;. to any specific comme:ci roduct. process, c r service by trade n a i x . !radt.mark, inanufacturer. or othei 2 , does not necessarily constitute or imply iis eodorsemc3:. recorniiianda:ioii, O i favuring by the United Statcs Coveii inlerri or any aozncy thciesf Thn v ie~ .~s and opinions of authsis expressed herein do not necesscrily state or refloct thosa ~f the iJnitc:! Statesiiovc:nmen! or any ZQcncy I l w e o f .

Chemical Technology Division
NUCLEAR AND CHEMICAL WASTE PROGRAMS Enviromental Restoration and Facilities Upgrade Program
(Activity No. KC 02 00 00 0, KGO 2300)
TREATABILITY STUDIES INi SUPPORT OF THE N Q W I O L O G I C A L WASTEWATER TREATMENT PROJECT
J. M. Begovich C. H. Brown, Jr. J. F. Villiers-Fisher v. L. Fowler
Environmental Control Technology Group
Date of Issue - July 1986
Prepared by the OAK RIDGE NATIONAL LABORATORY Oak Ridge, Tennessee 37831
operated by MARTIN MARIETTA ENERGY SYSTEMS, INC.
f o r the
3 4456 0 0 5 4 7 4 5 0


CONTENTS
Pase LIST OF FIGURES . . . . . . . . . . . . . . . . . . . . . . . . vii
. . . . . . . . . . . . . . . . . . . . . . . . . LIST OF TABLES ix
GLOSSARY . . . . . . . . . . . . . . . . . . . . . . . . . . . . Xi
. . . . . . . . . . . . . . . . . . . . . . . . . . . . ABSTRACT 1
. . . . . . . . . . . . . . . . . . . . . . . 1. IMTWODUCTION 2
. . . . . . . . . . . . . 2. CHARACTERIZATION OF FEED STREAMS 4
. . . . . . . . . . . . . . . . . . . 3. SIMPLIFIED FLOWSHEET 9
. . . . . . . . . . . . . . . . . . . . . 4 . PHASE I RESULTS 11
. . . . . . . . . . . . . . . . . . . . 4.1 BACKGROUND.. SI 4.2 METALS REMOVAL VIA PRECIPITATION 16 4.3 REMOVAL OF ORGANIC CONTAMINATION VIA AIR STRIPPING . . 18 4.4 ALTERNATIVE METHODS FOR METALS REMOVAL 23
. . . . . . . . . . . . . . . . .
4.4.1 Batch Adsorption Tests with Amberlite IRC-718 Resin . . . . . . . . . . . . . . . . . . . . 23
4 .4 .2 Heavy-Metals Removal with Cellulose Xanthate. . 27
4.5 SCREENING OF MERCURY REMOVAL FROM MH-190 WATERS BY GAC . . . . . . . . . . . . . . . . . . . . . . . . . 29
. . . . . . . . . . . . . . . . . . . . . 5 . PHASEIIRESULTS 31
5.1 5.2 5 .3 5 .4 5.5 5.6 5.7 5.8
. . . . . . . CHARACTERIZATION OF 190 WEIR BOX WATER 31 PRECIPITATE SETTLING TESTS 31 SLUDGE DEWATERING TESTS 35 . . . . . . . . . . . . . . . . . . . . . . 35 JAR TESTS REACTOR/CLARIFIER-DUAL-MEDIA FILTER 37 AIR STRIPPING OF TRACE ORGANICS - BEAKER TESTS 43 CARBON ISOTHERMS - MERCURY, DBP, AND NAPHTHALENE 4 5 ION EXCHANGE FOR METALS REMOVAL 50
. . . . . . . . . . . . . . . . . . . . . . . . . . . . . . . . . . . . . . . . . . . . . . . . . . . . . .
6. FLOWSHEET ANB DESCRIPTION OF THE MINI-PILOT PLANT . . . . . . . . . . . . . . . . . . . . . . . . . EQUIPMENT 52
. . . . . . . . . . . . . . . . . . . . . . . . . . . . . . . . . . . . . . . . . . . . . . . . . . . . . . . . . . . . . . . . . . . . . . . . . . . . . . . . . . . . . . . . . . . . . . . . . . . . . . . . . . . .
6.1 API SEPARATOR 52 6.2 REACTBR/CWUIIFXER 5 6.3 DUAL-MEDIA FILTERS 6 1 6 .4 AIR STRIPPER 61 6.5 ACTIQATED-CARBON COLUMNS 61 6 .6 ION-EXCHANGE COLUMN. 6 4
iii

CONTENTS (continued)
7 . OPEIIATION OF THE MINI-PILOT PLANT SYSTEM . . . . . . . . . 64
7.1 ACQUISITION OF FEED STREAMS . . . . . . . . . . . . . 64 7.2 SPIKING OF FEED STREAMS . . . . . . . . . . . . . . . 67 3.3 DETAILED FLOWSHEET . . . . . . . . . . . . . . . . . 70 7.4 ACTIIAL OPERATING CONDITIONS . . . . . . . . . . . . . 75
8 . MINT-PILOT P M T ' RESULTS AND DISCUSSION . . . . . . . . . . 77
8.1 APT SEPABATQR . . . . . . . . . . . . . . . . . . . . 77 8 . 2 XEACTOR/CURIFIER . . . . . . . . . . . . . . . . . . 77
8.2.1 Lime.. Soda Softening . . . . . . . . . . . . . . 77 8.2.2 Caustic Precipitation . . . . . . . . . . . . . 79
8.3 DUAL-MEDIA FILTERS . . . . . . . . . . . . . . . . . . 7'9 8.4 AD.SUSlNENT OF pEi . . . . . . . . . . . . . . . . . . . 84 8.5 AIR STRIPPER . . . . . . . . . . . . . . . . . . . . . 85 8.6 CARBQN COLUMNS . . . . . . . . . . . . . . . . . . . . 88
8.6.1 Toxic Trace Elements . . . . . . . . . . . . . 88 8 , 6 . 2 Mercury Removal . . . . . . . . . . . . . . . . 89 8.6.3 Organics Spiking . . . . . . . . . . . . . . . . 89 8.6.4 Chloroform Removal . . . . . . . . . . . . . . 91 8.5.5 Naphthalene and DBP R e m o v a l . . . . . . . . . . 91
Columns . . . . . . . . . . . . . . . . . . . . 91 8.6 .7 Radionuclide Accumulation . . . . . . . . . . . 94
8.6.6 Biogrowth i n Granular Activated-Carbon
8.7 THE 1ON-EXCUNGE SYSTEM . . . . . . . . . . . . . . . 98
8.7.1 Hydraulic Life . . . . . . . . . . . . . . . . 98 8.7.2 Ion-Exchange Coluim Performance . . . . . . . . 99
8.8 PRECIPITATOR SLdDGE . . . . . . . . . . . . . . . . . 99 8.9 MISCELMEOUS RESULTS . . . . . . . . . . . . . . . . 101
8.9.1 Arsenic a r i d Selenium . . . . . . . . . . . . . 101 8.9.2 T o t a l Suspended Solids (TSS) . . . . . . . . . 101 8.9.3 T o t a l Dissolved Solids (TDS) . . . . . . . . . 105 8.9 .4 Total Organic Carbon (TOC) . . . . . . . . . . 105 8.9.5 Biological Oxygen D e m a n d (BOD) . . . . . . . . 105 8.9.6 Biotoxicity Test . . . . . . . . . . . . . . . 105
9 . CUNCLUSIONS . . . . . . . . . . . . . . . . . . . . . . . 106
ACINO\~JLEDGMENTS . . . . . . . . . . . . . . . . . . . . . . . . 111
10 . RKFERENCES . . . . . . . . . . . . . . . . . . . . . . . . 113
iV

CONTENTS ( cont inued)
Page
APPENDIX A . RESULTS OF JAR TESTS . . . . . . . . . . . . . . . . 115
APPENDIX B . SUMMARY OH MPP OPERATIONS . . . . . . . . . . . . . 133
APPENDIX C . MPP DATA SUMMARY . . . . . . . . . . . . . . . . . . 143
V


LIST OF FIGURES
Page Figure
1
2
3
4
5
6
7
8
9
10
11
12
13
14
15
16
17
18
19
20
A simplified flowsheet of the Nonradiological Wastewater Treatment Project . . . . . . . . . . . . Titration of MH-190 weir box water . . . . . . . . . Settling column data: lime and 0.5 mg/L polymer (Percol 727) . . . . . . . . . . . . . . . . . . . . Settling column data: caustic and 2 mg/L polymer (Percol728) . . . . . . . . . . . . . . . . . . . . Trace element precipitation/filtration system . . . . Carbon isotherm for mercury at pH 10 . . . . . . . Layout of mini-pilot plant . . . . . . . . . . . . . APT separator . . . . . . . . . . . . . . . . . . . Sludge-blanket type of reactor/clarifier . . . . . . Rapid mixer f o r precipitator . . . . . . . . . . . . Precipitator/clarifier for caustic campaign . . . . Dual-media filter . . . . . . . . . . . . . . . . . Air stripper . . . . . . . . . . . . . . . . . . . . Granular activated-carbon colwnn . . . . . . . . . . Ion-exchange column . . . . . . . . . . . . . . . . Mini-pilot plant piping and instrumentation diagram . . . . . . . . . . . . . . . . . . . . . . Simplified block flow diagram of the mini-pilot plant . . . . . . . . . . . . . . . . . . . . . . . Metals removal in the mini-pilot plant using lime precipitation . . . . . . . . . . . . . . . . . . . Metals removal in the mini-pilot plant us ing caustic precipitation with metal s p i k e s . . . . . . Metals removal in the mini-pilot plant using caustic precipitation without metal spikes . . . . .
10
32
33
34
39
51
55
54
57
59
60
62
63
65
66
7 1
76
107
108
109
v i i


LIST OF TABLES
Table
1
2
3
4
10
11
1 2
13
14
15
16
17
18
19
20
NPDES effluent limitations for the Monradiological . . . . . . . . . . . . . Wastewater Treatment plant 5
Source characterization of influent wastewaters of the NRWT plant . . . . . . . . . . . . . . . . . 6
Flow rates of wastewater sources of the NRWT plant . . . . . . . . . . . . . . . . . . . . . . . 8
Volumetric proportions of the NRWT raw water composite . . . . . . . . . . . . . . . . . . . . . 12
Raw water assays (mg/L) . . . . . . . . . . . . . . 13
. . . . . . . . . . . . Radionuclide assays (Bq/L) 15
. . . . . . . . . . . . Precipitation test sequence 17
Trace element precipitation . . . . . . . . . . . . 19
Total organic carbon of the emulsion during air stripping . . . . . . . . . . . . . . . . . . . . . 21
IRC-718 capacities for batch-loading tests of trace elements . . . . . . . . . . . . . . . . . . . 25
Control of criteria trace elements with cellulose xanthate . . . . . . . . . . . . . . . . . . . . . 28
Phase I - granular activated-carbon results . . . . 30
Effective trace element removal conditions during the jar tests . . . . . . . . . . . . . . . . . . . 38
Feed stock tests . . . . . . . . . . . . . . . . . . 41
. . . . . . . Softening/filtration process effluents 42
Air stripping beaker tests . . . . . . . . . . . . . 44
Carbon isotherm contact-time study . . . . . . . . . 46
Zero carbon-loading assays . . . . . . . . . . . . . 46
DBP and mercury carbon isotherm tests . . . . . . . 47
Phase I1 bench-scale resin column tests . . . . . . 53
ix

LTST OF TABLES (continued)
Table
21
P
22
23
24
25
26
27
2%
29
30
31
32
33
34
Decrease of nitrate concentration in the Equalization Basin . . . . . . . . . . . . . . . . 68
Proportions o f the various wnstewaters coilectea . . . . . . . . . . . . . . . . . . . . . 68
Relative stream contributions to the precipitator loopintheMPP . . . . . . . . . . . . . . . . . . 69
Pressure drops across dual-media filters during lime-soda campaign . . . . . . . . . . . . . . . . . 8 1
Pressure drops across dual-media filters during caus t ic campaign . . . . . . . . . . . . . . . . . . 82 Chloroform levels at various sample points in the M P P . . . . . . . . . . . . . . . . . . . . . . . . . 86
Pressure drops across GAC columns during lime-soda campaign . . . . . . . . . . . . . . . . . . . . . . 93
Pressure drops across 33%-full GAC columns during caustic campaign . . . . . . . . . . . . . . . . . . 95
Pressure drops across empty and 33%-full tiAC columns . . . . . . . . . . . . . . . . . . . . . . 96
Radionuclide analyses on spent GAC . . . . . . . . . 97
I @ P results from the MPP around the IX column . . . . 100 Centrifuged precipitator sludge from the lime-soda campaign . . . . . . . . . . . . . . . . . . . . . . 102
Centrifuged precipitator sludge from the caustic campaign with metal spikes . . . . . . . . . . . . . 1.03
Dewatered precipitator sludge from the caustic campaign with no metal spikes . . . . . . . . . . . . 104
X

GLOSSARY
AA ACD
A/E
AI s API
BAT
BOD
CDR
COD
DBP
ECT
EPA
GAG
$Pd
ESPm
H F I R
ICP
IX m MBP
NPDES
NRWT
NRWTP ORNL
PPb
PPm
PWTP
R/C TDS
TOC
TRU
TSS TURF
atomic absorption
Analytical Chemistry Division
architectlengineer
air s t r i p p e r
American Petroleum Institute
b e s t available technology
biological oxygen demand
Conceptual Design Report
chemical oxygen demand
dibutyl phthalate
Environmental Control Technology
Environmental Protection Agency
granular activated carbon
gallons per day
gallons per minute
High Flux Isotope Reactor
inductively coupled plasma
ion exchange
rnanho le
mini-pilot plant
National Pollutant Discharge Elimination System
nonradiological wastewater treatment
Nonradiological Wastewater Treatment Project
Oak Ridge National Laboratory
parts per billion
parts per million
Process Waste Treatment Plant
reactoriclarif ier
total dissolved solids
total organic carbon
Transuranium Processing Plant
total suspended s o l i d s
Thorium Uranium Recycle Facility
xi


TREATABILITY STUDIES IN SUPPORT OF THE NONRADTOEOGICAL WASTEWATER TREATMENT PROJECT
J. M. Begovich C. H. Brown, Jr. J. F. Villlers-Fisher V. L. Fowler
ABSTRACT
The Nonradiological Wastewater Treatment Project (NRWTP) will treat nonradiological wastewaters generated at the Oak Ridge National Laboratory (ORNL,) to pollutant levels acceptable under restrictions imposed by the effluent limits of best available technology (BAT) regulations of the U.S. Environmental Protection Agency (EPA), according to the goals established by the Clean Water Act.
resolve many of the uncertainties facing the NRWTP. The first phase consisted of batch simulation of the proposed NRWTP flowsheet in the laboratory. The Phase I results revealed no major problems with the proposed flowsheet. Phase I1 consisted of more-detailed parametric studies of the flowsheet processes at a bench-scale level in the laboratory. planning and design of the Phase I11 study, which consisted o f flowsheet simulation on a continuous basis using a mini-pilot plant (MPP) facility. within two connected semitrailer vans and an analytical trailer.
The purpose of this effort was to simulate the treatment the ORNL nonradiological wastewaters will receive in the NRWT plant. These tests provided the detailed design data needed by the architect/engineer (AI’E) in designing the NRWT plant, served as a performance check to determine plant removal efficiencies and water effluent quality, and identified potential improvements in the proposed flowsheet,
sources and will typically contain occasional surges of the heavy metals (ppm levels or less), lasting up to a few hours, and a wide variety of criteria organics at the ppb level. Sources of feed to the plant include: (1) drainage from various laboratories (chemical, physics, electronics, biological, environmental, and metallurgical); ( 2 ) process wastewater pretreated f o r radionuclides removal; ( 3 ) boiler blowdown from the steam plant; and ( 4 ) aqueous streams from several radiochemical processing plants and reactor operations.
The handling of this wastewater is not a typical treatment problem due to its dilute nature, widely varying composition, and high flow rate - 350 gpm nominal up to 560 gpm maximum.
A three-phase treatability study was conducted to
The Phase I1 results were used to guide the
This facility is contained
The influent to the NRWT plant will come from several
1

2
The following bench-scale treatability studies were performed: titration curves, jar tests to determine the optimum precipitation chemistry, polymer selection, column settling tests, filterability tests, air stripping experiments, carbon isotherm studies, and heavy-netal- selective, ion-exchange resin tests.
In the MPP, all wastewaters, with the exception of those not containing heavy metals, flowed through an API-type separator. removed in the reactor/clarifier as hydroxide precipi- tates. dual-media filters. Wastewaters that had been pretreated 3y ion exchange for radionuclide removal bypassed the first three unit operations and were combined with the other wastewaters prior to air stripping. removed by the air stripper, while heavy (nonvolatile) organics and mercury were removed in the granular activated- carbon calms.
In general, results of the bench-scale treatability studies correlated well with those of the MPP studies. Biogrowth proved to be a major operational consideration in the MPP despite the low available level of total organic carbon ( ~ 8 ppm); it prohibited the continuous operation of the ion-exchange column and dictated special design features for both the air stripper and the carbon columns. necessary design data were provided to the A / E , and operation of the MPP demonstrated that BAT guidelines are achievable for the ORNL nonradiological wastewaters using the selected unit processes.
The criteria metals (except for mercury) were
Overflow from the precipitator was then treated by
Volatile organics were
The
1. INTRODUCTION
The Nonradiological Wastewater Treatment Project (NRWTP) will
treat nonradiological wastewaters, generated at the Oak Ridge National
Laboratory (ORNL), to pollutant levels acceptable under restrictions
imposed by the effluent limits of best available technology (BAT)
regulations of the U.S. Environmental Protection Agency (EPA),
according to the goals established by the Clean Water Act..
Martin Marietta Energy Systems, Inc., Engineering has issued a
Conceptual Design Report (CDR)l and a Design Criteria Document2
concerning the NRWTP.
WWTP, the Environmental Control Technology (ECT) group of the Chemical
Technology Division (Chem Tech) engaged in a three-phase treatability
To resolve many of the uncertainties facing the

3
study of the NRWTP.
activated-carbon (GAC) adsorption and reverse osmosis were operated on
two of the major feed streams to the NRWT plant3.
the main study consisted of batch simulation of %he proposed NRWTP
fiowheet in the laboratory. Phase I1 consisted of more detailed
parmetric studies of the flowsheet. processes at a bench-scale level in
the laboratory. The Phase I1 results were used to guide the planning
and design of the Phase I11 study, which consisted of flowsheet
sitnulation on a continuous basis using a mini-pilot-plant (MPP) facility. This facility is contained within three semitrailer vans
located next to Building 3544 at ORNL and bounded by Building 3544 0x1
the west, Building 3518 on the north, and the 3513 settling basin on
the east.
Initial scouting work was done in which granular
The first phase of
The purpose of the MPP was to simulate the treatment the ORML
nonradiolsgical wastewaters will receive in the NRWT plant. The
results from these tests provided the detailed design data needed by
the architect/engineer ( A / E ) in designing the NRWT facility.
a l s o served as a performance check t o determine plant removal
efficiencies and effluent water quality and helped to identify
potential improvements in the proposed flowsheet.
The tests
The MPP was run in essentially two campaigns over a 5-month
period. In the first, heavy metals (i.e.> Ag, Cd, Cr, Cu, Fe, Ni, Pb, and Zn) were precipitated using calcium hydroxide (lime) and sodium
carbonate (soda ash) in a reactor/clarifier operating with a sludge
blanket. In the second campaign, the metals were precipitated using
sodium hydroxide (caustic) in a reactor, with the subsequent removal of
the floc that formed in a separate clarifier.
Following the precipitation step, the water was treated in a dual-
Next, the pH of the water was media (sand and anthracite) filter.
adjusted to 7 , and the volatile organics were removed by air stripping
in a packed tower.
in series filled with granular, activated carbon in which the
nonvolatile organics and mercury were removed. In both campaigns, the
concentrations of criteria metals were reduced to well below the likely
Finally, the water was passed through three columns

discharge limits sf the National Pollutant Discharge Elimination System
(NPDES) permit.
The remainder of this document det:ails: ( I ) the typical influent
streams the NRWT plant will receive,; ( 2 ) the simplified flowsheet and
results of the Phase I and IT studies; ( 3 ) t he flowsheet and specific
u n i t operations to be used to treat the feed stnmis; ( 4 ) the system
operation, including procedures by which these streams were acquired
for MPP treatability studies and spiked to detectable levels in metals
and organics; (5) the results from the t w o campaigns; and finally,
(6) the conclusions fcnrrnulated by this treatability work.
2 . CI%.ARACTEREZATION OF FEED S T R W S
The influent to the NRWT plant will come from several sources and
will typically contain varying mounts of heavy metals, volatile and
nonvolatile organics, and other pollutants. As ORNL encompasses a wide
variety of disciplines, the process vastewatet- will come from a number
oE different sources, irncluding chemical, physics, electronic,
biological, environmmt.al, and metallurgical laboratories. The
effluent standards that have been listed on the N?S)FS permit' are shown
in Tahle 1.
Sources of feed to the plant include: (1) drainage from the 4500
complex (usually referred to as 198 pond water and marked as Porads 3539
and 3540) ; ( 2 ) treated process wastewater from the Process Waste
Treatment Plant (PSJTY) in Building 3544; ( 3 ) boiler blowdown and
demineralizer regeneration wastes from the steam plant (referred to as
3518 water); ( 4 ) waters from the High Flux Isotope Reactor ( H F I X ) ,
Transuranium Processing Plant (TRU), and Thoriwik Uranium Recycle
Facility (TURF); (5) drainage from t h e Building 2000 and Building 1505
areas; and (6) miscellaneous streams accessible through manholes (MI)
229, 14g9 25, 240, 235, and 189. The, eharacteristjes of these streams,
as taken from the Design Criteria Document2, are shown in Table 2, and
typical flow rates of these streams, also taken from ref. 2, with the
exception of the H F I R and 3544 flow rates, are shown in Table 3 . As
p a r t of the detailed design effort by the A/e fai- the mww, a thorough

5
Table 1. NPDES effluent limitatjons for the Nonradiological Wastewater Treatment planta
Monthly average Daily maximum Parameter (mg/L) (mg/L>
Total suspended solids
Oil and grease
Total t ox ic organics
Cyanide
Cadmium
Chromium
Copper
Lead
Nickel
Silver
Zinc
31
10
--
0.65
0.26
1.71
2.07
0.43
2.38
0.24
1.48
60
15
2.13
1.20
0.69
2.77
3.38
0.69
3.98
0.43
2.61
aStandards listed on the National Pollutant Discharge Elimination System (NPDES) Permit No. TN Q002941 for the NRWT plant at the Oak Ridge National Laboratory.

6
Table 2. Source characterization of influent wastewaters of the NRWT planta
~- .- ~
Parameter 190 Ponds 2000 1505 3544 HFIX TRU TURF 3518 - Flow, gpm PH
COD TQC TS S TDS h 0 n i . a Nitrate
Oil & grease Phosphate
CN Pheno 1s PCB Chloroform ChPOrObenZW-I@
chloride Trichloro- ethylene
Methylene
125 6.8
5 8 8 5 180 0.8 5 5 2
660 450 280 210 6 10 55 220 0 100
4 3 0.1 18 94
530
74 I . , 1, lltrichloro-
ethane 27
10 7.5
5 17 2 5 186 0 5 5 2
11 10 30 58 0.5 12 4 140 0 100
5 2 0.1 10 74
2
100
16
6 6.6
30 6 9 8 178 0,2 5 5 2
140 120 30 340 0.6 39 4 160 0 95
21 4 0.1 8 20
2
45
16
110 8.2
5 6 3 5 793 0.2
5 2
287
9 14 20 140 0.4 10 37 50 0 5
8 1 0.1 5 20
510
62
19
25 6.9
5 5 4 5 350 0 190 5 2
1100 25 360 100 0 . 3 10 46 200 0 120
2 25 0.1 5 33
2
39
17
10 7.3
5 7 3 10 22% 0.2 3 31 2
17 440 200 220 1 120 22 470 0 100
26 9 0.1 3 20
5
41
16
1 7.7
5 5 2 5 166 0 5 5 2
9 17 39 140 0.1 10 9 250 0 100
5 2 0.6 4 22
5
61
16
28 6.3
5 16 8 9 1550 0 20 5 2
52 45 40 560 0.1 27 70 730 0 580
2 1 0.1. 19 25
12
54
16
7
Table 2 (continued)
Parameter 190 Ponds 2000 1505 3544 HFXR TRU TURF 3518
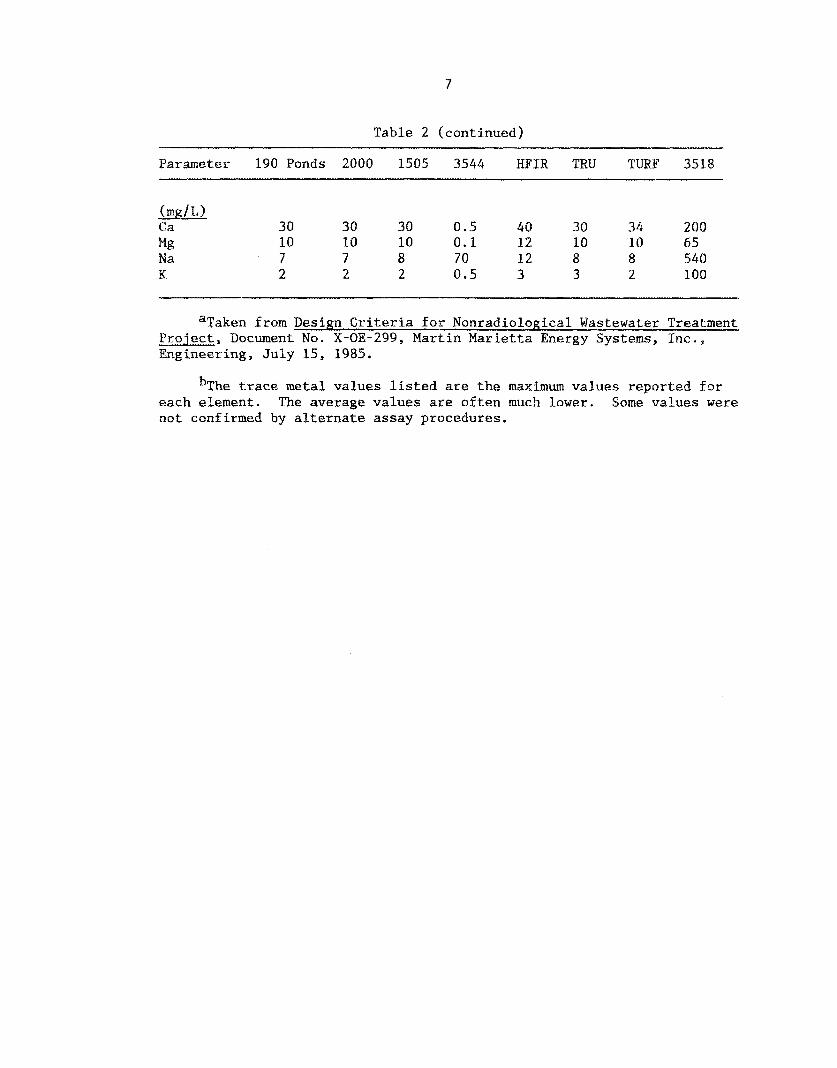
30 30 30 0.5 40 30 3 4 200 Mg 10 10 10 0.1 12 10 10 65 Na 7 7 8 70 12 8 8 540 K 2 2 2 0.5 3 3 2 1 Q Q
aTaken from Design Criteria f o r Nonradiological Wastewater Treatment Project, Document No. X-OE-299, Martin Marietta Energy Systems, Inc., Engineering, July 15, 1985.
bThe trace metal values listed are the maximum values reported for each element. n o t confirmed by alternate assay procedures.
The average values are often much lower. Some values were

8
Table 3 , Flow rates of wastewater sources of the NRWT p lan t”
4500 Area (190 ponds)
2000 Area
125 35
10 3
1505 Area 5 1
Miscellaneous
3518
RFIRt
40 11
30 8
10 3
TRTJ 10 3
TURF
3544b
Total.
1 1
35 12s
356 100
- --
_I-____- Wastewater Treatmen&.J?roj e c t Systems, Inc., Engineering, Document No. X-OF,-299,
Martin Marietta Energy
J u l y 15, 1985.
bpJrenotes change from Table 2 3 , as given i-a above document, t o reflect more likely average flow rates.

evaluation of existing hydraulic data will be performed and the flow
rates adjusted accordingly.
The ORNL nonradiological wastewaters consist primarily of Oak
Ridge city water contaminated with the products of ion-exchange
demineralization of the water and with what appear to be spills or
washdowns of small quantities of criteria trace elements and organics.
The available data suggest that most criteria contamination occurs
randomly at less than the 1-ppm level for any component.
always found at just above the allowable limits in the. 4500 complex
wastes. This may reflect mercury accumulations in the traps, joints,
etc., of this system. Traces of radionuclides are also found in the
wastewaters. In addition, there may be groundwater leakage into the
plant drainage system.
Mercury is
About 70% of the wastewater has a nearly constant composition.
The 190 pond water has occasional 1-ppm spikes of criteria elements and
organics.
contains essentially no multivalent elements. The 3518 water is city
water enriched with the products of its demineralization together with
the demineralization resin regenerants.
discharge (40,000 gpd)a and may be strongly basic or acidic.
and TRU wastewaters are also a mix of city water and demineralization
regenerant water. The 2000 and 1505 area waters are essentially city
waters with traces of contaminants similar to the 190 pond waters.
The 3544 water averages (20 Bq/L of radionuclides and
It enters as a daily batch
The HFIR
3 . SIMPLIFIED FLOWSHEET
The first phase of treatability studies consisted of a cursory
evaluation of the proposed flowsheet f o r the NRWT plant via batch simulation in the laboratory. A block representation of this Elowsheet
is presented in Fig. 1. The plant consists of an equalization capacity
on the front end into which flows all of the Melton and Bethel VaEley
a 40,000 gpd may be an error in a previous report. It represents the maximum winter value. period September 1983 to August 1984, the average value was 20,780 gpd, or 14.4 gpm.
According to steam plant records for the
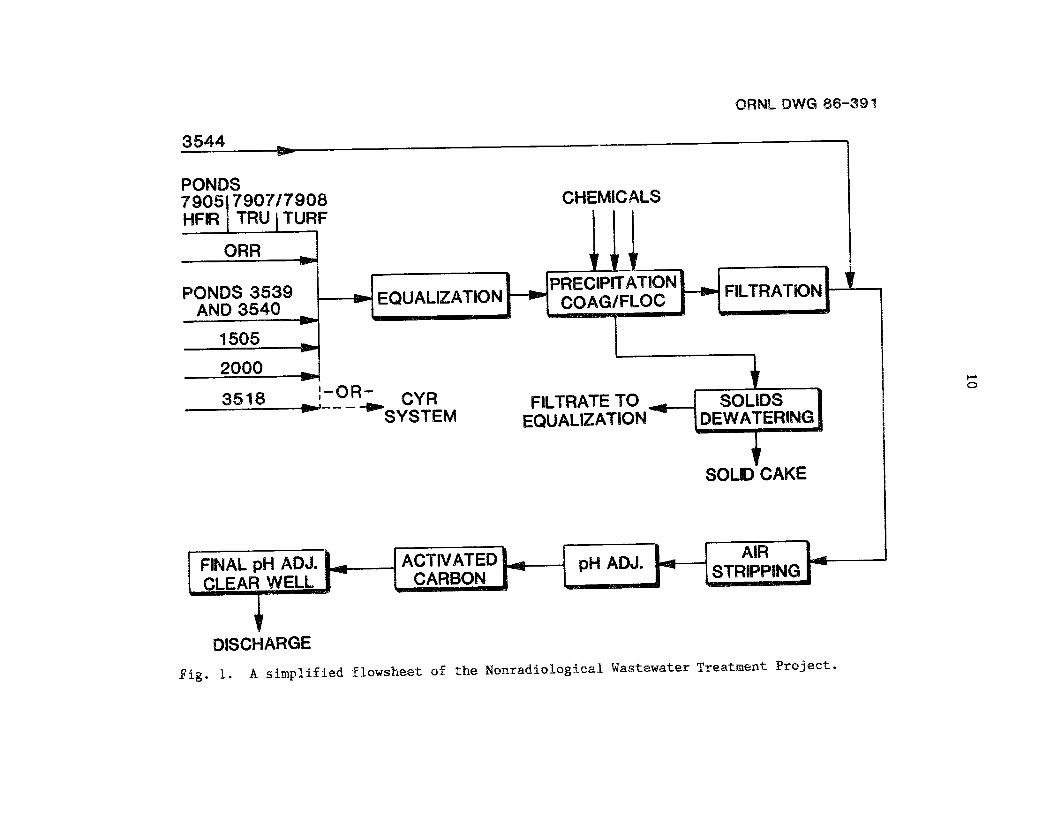

11
streams except the effluent from the PWTP.
Basin, the water is processed first through a reaetor/clarifier to
remove heavy metal contamination via precipitation.
the reactor/clarif ier is dewatered and stored in an undetermined
location, while the aqueous effluent is processed through a filter for
total suspended solids (TSS) reduction.
with the PWTP effluent and processed sequentially through air stripping
(for volatile organic reduction), pH adjustment, activated carbon (for
nonvolatile organic reduction), and final pH adjustment before being
discharged to the environment.
From the Equalization
The sludge from
This stream i s then combined
4 . PHASE I RESULTS
4.1 BACKGROUND
Utilizing wastewater collected in the field and cornposited to
simulate the actual feed to the NRWT plant, the following treatment
steps were tested in the laboratory: (1) metals removal by
precipitation, ( 2 ) volatile organic removal via air stripping, and
( 3 ) metals removal via cellulose xanthate arid chelating ion-exchange
resin.
section.
The tests performed and results achieved are summarized in this
To most closely simulate the NRWT plant feed stream, 48-h
composite samples of each of the contributing waste sources were
collected.
flow rates as shown in Table 4 .
two other streams of interest, the steam plant wastewater discharge
(Bldg. 3518) and the process waste treatment effluent (Bldg. 3544) , are
shown in Tables 5 and 6. The alkali metals, sulfate, and chloride
levels in the composite are higher than that projected from the mix of
process water and the steam plant effluent, suggesting that another
major SQUnx? had contributed water softener regeneration waste.
phenomenon had not been noticed during a sampling program conducted
December 12 to 19 , 1984.
The composites were blended in proportion to their expected
Assays of the blended composite and
This

12
Table 4 . Volumetric propor t ions of t he NRWT raw water composite
WFZR
TRU
190 Pond
1.505
2000
MH-248
MH-2s
MH-149
MH-235
MH-229
M!3- 189
TITRF
3518
21.5
11.4
42 .1
2.5
2 .5
1 . 7
1 . 7
2 . 7
0.7
3.5
0.5
2.2
6.9

13
Table 5. Raw water assays (mg/L)
Composite 3518a 3544b
At3 A l AS B Ba Be Ca Cd Go Cr cu Fe Wf K L i
Mn MQ Na Ni P Pb Slb Se Si Sr Ti v Zn Zr
Mg
so4 NO3 F C1 B r
Total N PO4
E3 NO2 CN Phenols Oil and
grease
(0. 07 0.32
(0. 2 0.11 0.056
(0.001 57 (0.009 (0. 02 0.0034 0.029
0.065 4 (0.02 21
(0. 02 80 <O. 06 0.63 (0.2 (0 .3 (0.4 1.5 1.9 (0.02 (0 .03
(0.06
80 14 1
130 (5 (5 <5 (0.2 ( 5 (0.01 (0.01
(0.03
0.0036
0.084
5
(0.07 0.49
(0.2 0.14 0.18 (0.001
(0.009 (0.02
200
0.051' 0.023 0.14 0.13
0.38
0.039 0.037
12.8
51
620 (0. 06
5 (0.2 ( 0 . 3 (0.4 11 0.57 0.02
(0.03 0.59
(0.06
790 (50 8
940 (50 (50 (5 (0.2
<SO (0.01 (0.01 3
(0.07 0.29
(0.2 0.16
(0.02 (0.001 0.22 (0.009 (0.02 (0.008 (0.02 t o . 03
0.065 1.3
(0.2 0.054
(0.003 (0 * 02
(0.06 (0 .3 (0.2 (0.3 (0.4 1.6
(0.005 (0 e 02 (0.03 (0.02 (0.06
40 220
1 38 (5 (5 54 (0.2 39 (0.01 (0.01 <2
230

Table 5 (continued)
Compos it e 3518a 3544b
Assays by atomic absorption (AA)
Cd Cr cu Pb Ni Zn
0.00044 0.0017 0.00004 0.0005 0.0032 0.0008 0.035 0.019 0.004 0 * 0009 0.0038 0.0025
<O. 005 <o * 005 <O. 005 0.13 0.66 0.01
plant wastewater dischar
b~rocess wastewater treatment plant.
=Believed to be in error. Assays by kA showed (10% of this value. The failure of ICP with this water was never explained.
15
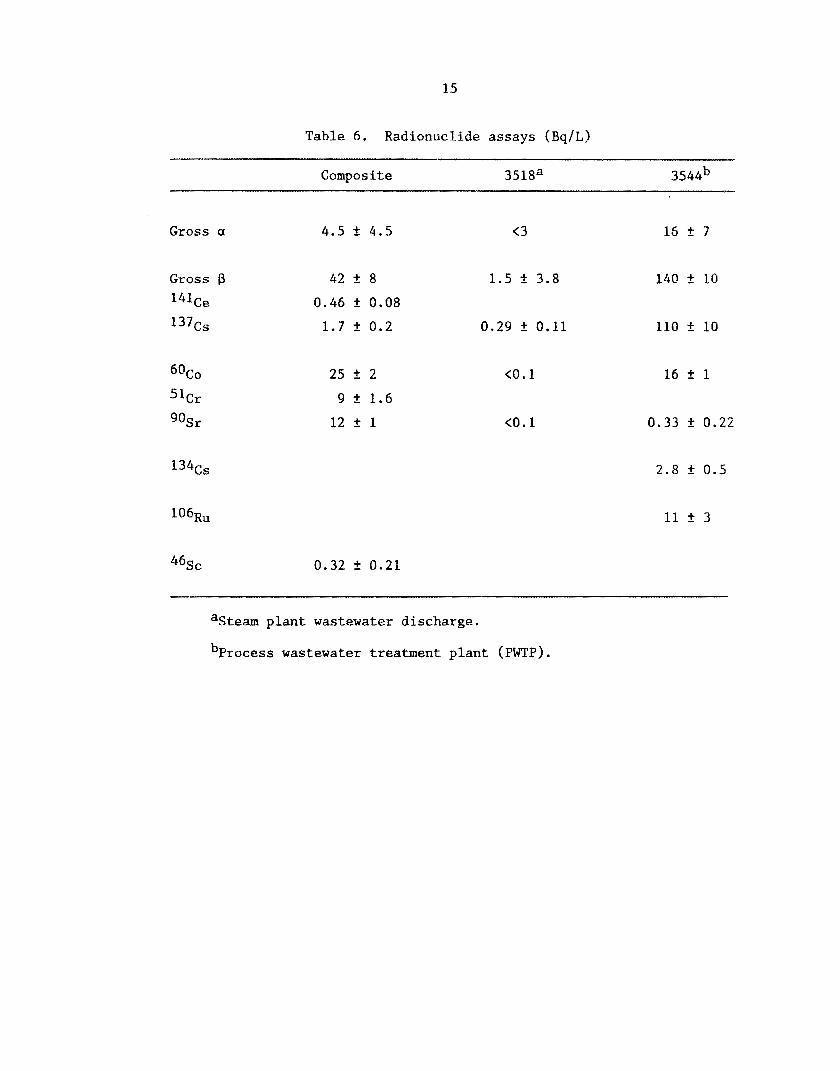
Table 6 . Radionuclide assays (Bq/L)
Composite 3518a 3544b
Gross a 4.5 f 4.5 <3
Gross P 42 2 8 1.5 2 3.8 141ce 0.46 k 0.08 137cs 1.7 f 0.2 0.29 2 0.11
6Oco
51Cr
9 0 ~ r
25 2 2
9 f 1.6
12 k 1
<o. 1
(0.1
16 2 7
140 f 10
110 f 10
16 2 1
0 . 3 3 2 0 . 2 2
134cs 2.8 i: 0.5
4QSc
11 f 3
0.32 f 0.21
plant wastewater discharge.
bprocess wastewater treatment plant (PWTP) .

16
The composite sample (Table 5 ) assayed far below the likely
allowable limits for all the criteria trace elements (Ag, Cd, Cr, Cu,
Fe, Ni, Pb, and Zn) and, in most cases, was below inductively coupled
plasma (ICE') detection limits.
presence of some radioactivity in the composite sample (predominantly
6oCo, 90Sr, and 51Cr) . The Building 3544 effluent contains levels up
to 140 Bq/L of gross p. of radioactivity.
The data in Table 6 indicate the
As expected, the Building 3518 water was free
4.2 METALS REMQVAL, V I A PRECIPITATION
Metals removal utilizing lime [Ca(OH)z] and soda ash (NaZC03) as
the reagents was tested in laboratory jar tests with the composite WWT
feed water.
A water-softening sludge was prepared by treating 100 gal of
process water with 60 g Ca(OH)2 and 42.4 g Na2C03 at pH 11.
element seed was prepared by spiking 1 L of tap water with 5 ppm (parts per million; also mg/L) of each of the trace elements and precipitating
by raising the pH to 10 using 0.01 N_ NaOH.
after the others so that its gel would sweep out any suspended
particles.
sludge and the mix split into four parts.
"sludge blankets" €or the precipitation tests.
Trace
The Fe3+ was added 1.5 h
This precipitate was admixed with 130 mL of water-softening
These parts provided the
Five precipitators were placed in parallel, forming the test
sequence shown in Table 7, described below. Beaker Nos. 2 through 5
had -20 mL sludge in each. In cases 2 through 4 , 1 L of composite
wastewater was spiked with 1 ppm of the trace elements, except iron,
and added t o the sludge. No trace elements were added in case 1. Five
pprn of C r 6 + was added to No. 5 along with 5 ppm Fe2' to reduce the C r 6 +
to Cr3+. This should have reduced the residual C r 6 + to 3.4 ppm.
All waters were partially softened by adding 0.2 g Ca(OH)Z and
Na2CO3 to yield a pH between 10.5 and 10.8. 20 mL of 0.1
S2- was added to beakers No. 3 and No. 4 .
stirring, 1 ppm of the Fe3+ w a s added to Nos. 2 through 5, and the
stirring was reduced to t.he point at which the sludge was just
One ppm of
After 1.5 h of gentle

17
Table 7. Precipitation test sequence
Beaker Initial Iron No. sludgea Aqueous phaseb addit ionC
1 NO None None
2 Y e s A = [ l ppm trace petals €3 = [ l ppm Fe3 except ~e3+1
3 Yes A f 1 ppm sulfide B
4 Yes A t 1 ppm sulfide B
5 Yes 5 ppm Cr6' and 5 ppm Fe2+ B
Sludge separated in cone, supe m a t e filtered and analyzed ?,
sludge recycled
cycle. d f o r second
a40 mL softening sludge seeded with trace metals.
addition to 1 L of composite wastewater; mixture gently agitated €or 1.5 h after addition of 0.2 g Ca(0H)z and 20 mL of 0.1 N Na2C03 resulting in pH 10.5-10.8.
elkon added to 2-5 after 1.5 h a g i t a t i o n ; very gentle agitation continued for 0.5 h.
dAnalysis performed after second cycle; filtered and unfiltered analysis performed a f t e r third cycle on No. 3 .

18
suspended and held at this rate for 0.5 h.
then transferred to settling cones and held for 2 h.
drawn off and returned to the reactor.
Table 7 was repeated for a secand cycle.
The reactor contents were
The sludge was
The procedure described in
Assays of all filtered (1-pm paper) supernatants were run after
the second cyclesand a third cycle was run ~ Q P case 3 - normal spike plus 1 ppm S 2 - for both the filtered and unfiltered supernatant.
assays are presented in Table 8. In the chromate test, the observed
chromium was slightly above the spike of 5.2 ppm, whereas, it should
have been ~ 3 . 5 if the reduction had occurred. All filtered supernatants were at or below ICP detection limits, confirming the
expected low solubilities. However, the unfiltered supernatant from
No. 3 showed high levels of all but lead, with the Cr3' being above the
allowable limit. Evidently, the precipitation technique did not
increase the size of the particles of the trace dements to the size
range where they would settle readily.
These
Hexavalent chromium could enter the NRWT plant feedwater from
unauthorized dumping of glassware cleaning solutions into laboratory
drains.
tested but found to be nonreproducible.
using 100% excess NazSO3 and seed liquor from a strong acid chromium
reduction run. No further study occurred,as it was decided to
eliminate Cr6' via administrative controls.
The traditional reduction of Cr6' to Cr3' with NaZS03 was
It was successful at pH <3
4 - 3 REMOVAL OF ORGAhiIC CONTAMINATION VIA AIR STRIPPING
Fifty grams of an organic present in a 440-gpm stream produces
0.02 pprn of solution.
concentration, it is very difficult to get into solution. Bench tests
indicate that chlorinated hydrocarbons may not form a stable emulsion
even during passage through a centrifugal pump. However, material such
as the relatively so lub le toluene may form a stable emulsion in a pump,
b u t not during passage along a drain. Most of a s p i l l is expected to
either float on the water or move in a thin layer along the drain
floor a
While the organic may be soluble at this

19
83
*
* 8
3
**
C-
IN
0
99
v
e N
N
99
e
e
m
0
9
?
0
V
rb
0
V
Y m
0
V
9
n
0
9
rl
0
V
? rl
0
V
?
r-
0
V
?
rl
N
r. ul
91 c, .rl
i 0 0
9
N
0
V
? N
0
V
9
?“
e
e “
‘J
e
e
N
N
0
V
0
V
ma
00
u
v
??
m
? e
rb
0
V
9
mm
00
v
v
99
am
00
V
99
cr)
0
V
? m
0
V
9
NN
0
99
v
s
N
0
V
?
(0 0
0
? 2 ? 0
rl
rl
00
v
v
99
l-l
mo
V
??
l-l rl
0
c, r
lr
l
00
v
v
99
rl
d
0
99
v
c
4
0
V
9
tc
r.
00
v
v
99
P
I
0
V
9
r.
0
V
9
“1
0
ul
rb
m
u,
rl
rl
r.
rl
P-
N
v)
\o
m
c.l N
rb
3: n
m

20
Small spilJ.s of those organics heavier than water will be trapped
in irregularities a long the drain, while larger spills will be trapped
i.n the weir boxes, etc.
provi.ded w P t h bottom weep hales.
These devices should be kept clean and
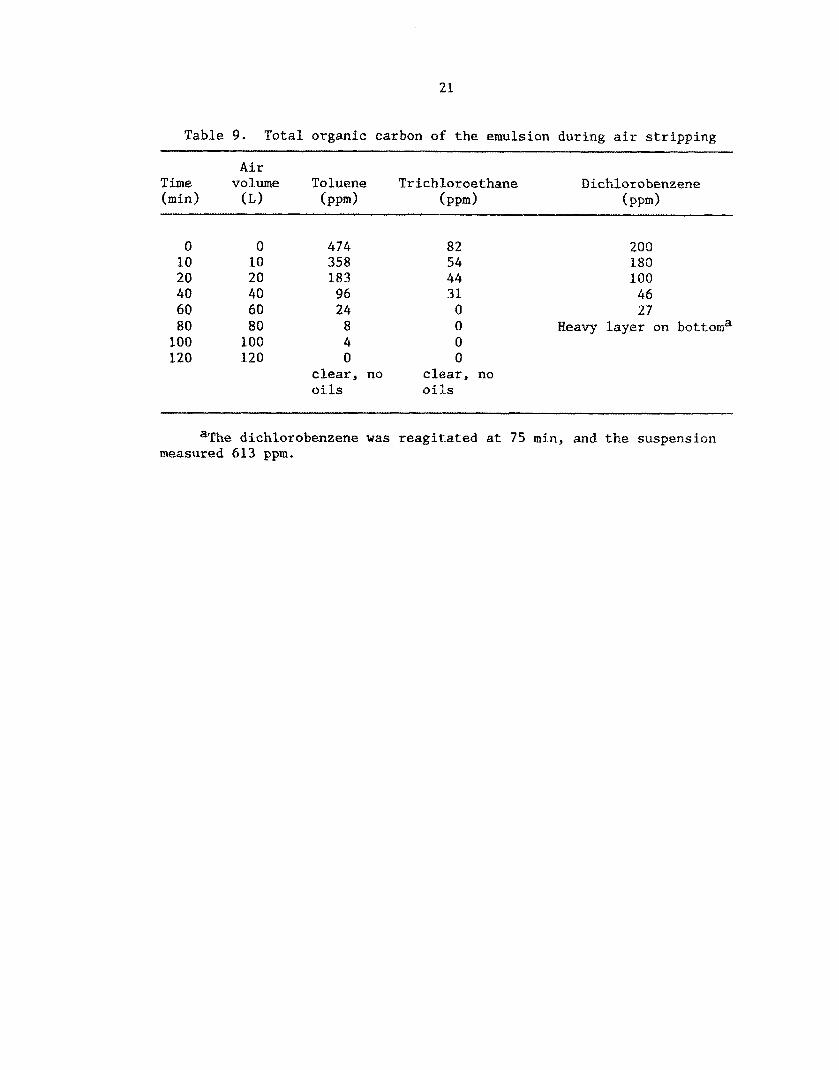
It was felt that a significant fraction of the organic contaminant
load could enter the NRWT plant as an emulsion, which would be the most difficult case to treat via stripping. For these reasons, air
stripping of organic emulsions was examined for three systems: water-
toluene, water-trichloroethane, and water-dichlorobenzene. These
compounds represent a wide range in volatility from relatively high
(toluene) to low (dichlorobenzene) levels. In the t es ts , 3 mL of the
organic was violently agitated with 1600 mL of water in a covered
baffled beaker for 1 h. The emulsion was then settled for 20 min, and
the residual bulk-organic phase was either blotted off of the surface
or the water decanted from the bottom layer. The emulsion was then
stripped with air at a flow rate of 1 L/min. The air entered through a
6-mm-ID tube having an opening = 3 cm above the base of the beaker. The
liquid height above the opening was -12 cm. Using TOC analysis, the
organic concentration i n the aqueous phase was measured as a function
o f time, resulting in the data summarized in Table 9.
Neither the toluene nor the trichloroethane segregated during air
stripping, and no organic phase was visible at the end of the stripping
s t e p . Conversely, the dichlorobenzene emulsion broke during decanting,
and a layer of droplets accumulated at the base of t.he container. The
air bubbler did not disturb this layer, and, consequently, this
material was not st.ripped. The concept that the decrease in the
dichlorobenzene concentration could have been an artifact of the
settling process rather than the air stripping is supported by the fact
that after settling f o r 75 min, the supernate TOC w a s 27 mg/L; upon
agitation and mixing of the two-phase mixture, the TOC was 613 mg/L.
The data indicate that air stripping will be effective f o r volatile
organics in an emulsion form, since toluene was reduced from 474 mg/L
to 4 mg/L via st-ripping with 100 volumes of air. Whether it would be
effective for volatile organics flowing as films down the surfaces oP
the packing in a tower is not known.
21
Table 9. Total organic carbon of the emulsion during air stripping
Air Time volume Toluene Trichloroethane Dichlorobenzene (min) (L) (PPd (PPd (PPd
0 10 20 40 60 80 100 120
0 10 20 40 60 80
100 120
474 358 183
96 24
8 4 0
clear, no oils
82 200 54 180 44 100 31 46
0 27 0 Heavy layer on bottoma 0 0
clear, no o i l s
aThe dichlorobenzene was reagitated at 75 min, and the suspension measured 613 ppm.

22
Emulsion stripping depends greatly on the degree of dispersion.
The component must dissolve, migrate through the water, and vaporize
into the gas. While toluene dispersed very well, trichloroethane was
stable for t he test period but the dispersion was not very fine.
Dichlorobenzene did no t form a stable emulsion.
As a rough check, the vapor pressure in the gas was assumed to be
proportional to the mole fraction in the liquid phase, assuming
everything is in solution. The calculated gas volumes are compared
with the actual volume used at a few points:
Vapor Gas Liquid Calc. req. pressure volume concentration gas
Componen t at 20°C used after A/S, ppm volume
'Toluene 30 m Hg 40 80
Trichloro- ethane
100 mm wg 40 60
96 8
31 22
16 40
3 11
Air stripping of an emulsion approaches the theoretical f o r a
highly dispersed emulsion of reasonably soluble (200-1000 ppm) organic
but falls off rapidly as the ease of dispersion and solubility
decreases.
If emulsions enter the NRWT plant, it is likely that they will
contact softening sludges and materials such as ion-exchange resin and
the activated carbon used for heavy organic removal. It was found that
material which is difficult to emulsify may form stable emulsions in
the presence of sludge precipitates.
dichlorobenzene could not be prepared in the available laboratory
equipment. However, 2 mL of dichlorobenzene was -readily emulsified
wj.th the sludge produced by lime softening of 1600 nib, of tap water.
The oil and solids did not segregate into discrete phases after
standing for 3 d.
A stable emulsion of
An emulsion of 10 mL toluene in 50 mL water w a s drained through
30 mL of ion-exchange resin i n a 1S-mm-ID tube at 6 mL/min. The resin
broke the emulsion and retained 50% of the toluene. An identical test

23
with GAC showed complete toluene retention and even the removal of the
toluene odor. Based on this test, other experience, and GAC
performance published in the literature, GAC columns appear to be
capable of handling many organic emulsions.
4 . 4 ALTERNATIVE METHODS FOR METALS REMOVAL
As part of the Phase I study, methods f o r metals removal, other
than precipitation, were investigated. Since the wastewater sources
are only occasionally contaminated with toxic trace elements, and then
at low levels (i.e., ( 2 ppm and generally (0.5 ppm), these wastewaters
are logical candidates for treatment with ion-selective resins, such as
IRC-718, or with cellulose zanthate. Ideally, an ion-selective resin
having a large preferential adsorption for the trace metals over
calcium and magnesium could operate for months before it approaches
saturation. An insoluble zanthate, which bonds the trace metals in a
manner analogous to sulfide precipitation, could be dumped into a
holding reservoir whenever an exceedence is noted and then filtered out
together with the S2--bonded metals.
cellulose zanthate acts like a sulfide crystal blanket by providing a
point of adherence for the metal sulfides that tend to be present in
colloidal form. The potential for use of the IRC-718 and cellulose
zanthate in the NRWT application was evaluated via batch adsorption
tests.
The cellulose backbone of
4.4.1 Batch Adsorption Tests with Amberlite IRC-718 Resin
Three 10-mL l o t s of resin were repeatedly slurried in 2 L of tap The calcium and magnesium in the supernatant water approached water.
raw water levels after the fourth batch of water. By material
balances, the loadings on the resin were 0.58 g of calcium and
0.08 g of magnesium per liter of resin, in apparent equilibrium with
22 ppm of calcium and 13 ppm of magnesium in the tap water.
preload corresponds to the expected solumn condition at the time a
spike of heavy metals might be encountered in the NRW plant.
This

24
Wastewater assays indicate that these spikes will be somewhat (0.5 ppm,
averaged over a 24-h period, and will occur at 7- to 20-d intervals. The alkali metal-loaded resins were then reslurried in 2 L of tap
The pB levels were adjusted with HNQ3 to 4 for batch No. 1, to water.
5.5 for batch No. 2, and to 7 for batch No. 3 . Each batch was spiked
with 0.01 g-equiv of Coy Cu, and Zn, which is equivalent to 5 ppn of
each element in the supernatant liquid. The batches were agitated for
2 h and settled. The supernate was sampled and assayed. The 100-nL
sample volume was replaced with 100 mL of t a p water, and the spikes
were repeated three more tines without changing the supernatant liquid.
After settling, the supernatants were assayed, resulting in the data
presented in Table 10. The total added metal was 0.04 g per 10 nL of
resin €or each element and the sum of four spikes.
resin batches quoted in Table 10 were derived from material balances.
The loadings on the
A t the low pM, the resin dumped most of the calcium and magnesium,
presumably by If' replacement.
resin. However, at pH 7, the calcium and magnesium displacement is
small and appears to be by replacement with the adsorbed heavy metals.
The dump, 0.25 g equiv/L of resin, is less than adsorption of the spike
elements, which is ~ 0 . 3 8 g equivfl of resin.
Only copper was effectively held on the
'To simulate extended contact of the metal-laden resin with clean
water, the resin batches were reslurried with 2 L of tap water acidiiied to the previously noted pB levels. Significant quantities of
Cobalt and zinc transferred to the fresh water at pll 4 , but very little
was released from the resin at pH 7.
lines denoted as tap water in Table 10.
The supernatant assays are the
The limiting capacity f o r the heavy elements is not known, It
appears to be >0.4 g equivfl resin at concentrations in the wastewater
< 0 . 1 ppm.
concentration.
The sales brochure quotes 1 g equiv/L at an unidentified

Table 10. IRC-718 capacities for batch-loading tests of trace elements
Water phase Resin phase (ICP assay) (material balance)
(DMn) (e-euuiv/L resin)
Q % co cu Zn ca Mg CO CU Zn PH
Saturated w i t h tap water
Batch 1 Spike 1
2 3 4
Tap water 5 6 7 8
after 20 h
Batch 2 Spike 1
2 3 4
Tap water 5 6 7 8
after 29 h
22
89 91 93 94 27 28 32 36 39 39
62 64 72 75 30 28 34 41 45 47
13
19 19 19 19 8 8.2 8.8 9.5 9.9 9.8
17 16 17 17 9 8.3 9.2 10 11 10
0.5 1.7 4.0 7.4 0.5 0.46 1.9 4.2 6.9 8.9
0.2 0.04 0.07 0.4 0.05 0.29 0.23 0.67 2.4 3.7
0.2 0.2 0.05 0.07 0.07 0.02 0.09 0.14 0.14 0.10
0.2 0.04 0.06 0.07 0.14 0.71 0.2 0.09 0.49 0.16
0.5 1.4 3.3 6.2 0.5 0.46 1.7 3.6 6.1 7.8
0.3 0.05
0.4 0.05 0.42 0.27 0.61 2.2 3.3
0.08
0.58
0.0 0.0
0.0
0.0 0.0 0.07 0.07 0.04 0.0
0.2 0.2 0.1 0.1 0.1 0.1 0.17 0.1 0.00
0.08 7
0.0 0.034 0.031 0.031 4 0.065 0.062 0.058 0.0
0.0 0.074 0.093 0.070 0.105 0.124 0.107 0.0
0.0 0.105 0.124 0.107 0.0 0.0 0.128 0.183 0.167
0.133 0.212 0.181 0.0 0.120 0.241 0.180 0.0
Trace elements 0.54 g-equiv/L
0.108 0.154 0.14
4
0.03 0.034 0.03 0.068 0.03 0.101 0.03 0.132 0.04 0.132 0.05 0.162 0.04 0.193 0.00 0.220 0.00 0.237
Trace elements 0
0.031 0.031 5.5 0.062 0.062 0.093 0.093 0.124 0.119 0.124 0.119 0.150 0.153
0.21 0.219 0.237 0.242
o . i w 0.187
5.5 72 g-equivll
N wl

Table 10 (continued)
Water phase (ICP assay)
Resin phase (material balance)
%latch 3 Spike 1
2 3 4
Tap water 5 6 7 a
after 20 h
38 14 3a 14 W, 15 49 15 33 10 35 9.9 41 10 45 10 50 11 58 E2
0.1 (0.02 0.03 0.04 0.05 (0.02 0.12 0.10 0.58 0.35
0.19 0.06 0.08 0.09 0.09
0.03 0.23 0.18 0.21 0.18
0.2 <o. 02 0.05 0.05 0.06 0.04 0.16 0.11 0.56 0.35
0.4 0.4 0.33 0.33 0.03 0.33 0.27 0.23 0.20
0.08 0.08 0.08 0.08 0.08 0.08 0.08 0.07 0.07
0.034 0.068 0.101 0.132 0. I32 0.164 0.196 0.228 0.257
0.031 0.062 0.093 0.124 0.124 0.154 0.183 0.212 0.240
0.031 7 .O 0.062 0.093 0.122 0.122 7.0 0.159 7.7 0.194 0.229 0.263
Trace elements 1.03 g-equivil

27
Selectivities quoted, with respect to calcium, are:
Hg2+ 2800
cu2+ 2300
Pb2+ 1200
Ni2+ 57
co2+ 7
Ca2+ 1
Cd2+ 15
4.4.2 Heavy-Metals Removal with Cellulose Xanthate
Fibrous cellulose xanthate was screened as an adsorbent for the
criteria heavy elements that may contaminate the NRWT plant feedwater.
Cellulose xanthate does not appear to be a practical adsorbent for
controlling these elements at concentrations below a few parts per
mi 11 ion.
The instability of the material dictates its use on demand in a
The xanthate batch-agitated mode followed by removal by filtration.
material was evaluated at two concentrations, 0.05 g and 0.2 g in 2 L of water (see Table 11).
(containing only nitrate anions) were employed. Trace elements, in
their nitrate forms, were added at several concentration levels prior
to the introduction of the xanthate and its subsequent agitation for
preset time periods. The pH was controlled, in cases C and D, by the addition of either nitric acid or sodium hydroxide. The effects of a
chelating agent, ethylenediaminetetraacetic acid (EDTA), were also screened.
Both tap water and a synthetic tap water
The data are summarized in Tabla 11, which shows the filtrate
assays as functions of xanthate addition level, stirring time, pH, and
the presence of EDTA. result of precipitation as the hydroxide at the chosen pH level;
Cr(OH)3 solubility is <1 ppm at pH 7, and Cu(OH)2 solubility may be
near 1 ppm at pH 7.
elements have solubilities >1 ppm at pH 7.
uncertain due to variations in the published data. Results from case
A, in which a 5-ppm spike was added to tap water at pH 7, suggest that
Some of the apparent efficiency may be the
According to the available dat+5*6*7 the other
The exact values are

28
-? l
-b
r-
000000
N-
f-
fN
4;
f
N
N
??
?
000
vv
v
-4
"
080
??
?
N-
SN
??
?
eQ
8
NN
N
080
vv
v
99
9
'9 ,4
0
0,
Fir
+
co
mm
N
NN
I-
N
mo
\
000
SNS
??
??
O
OQ
O
vv
vv
d
???Y
dd00
NN
NN
9
99
9
0"8$
V O
OB
O
N3
N-
f
NN
In
0
9
? 0
0
00
??
N
N
00
N
0
29
either copper solubility exceeds 3 ppm or the rate of Cu(OH)2
precipitation is very slow.
The very poor xanthate performance in case A could be the result
of xanthate quality. The product is under development by the
manufacturer, and the first test run was made with a different xanthate
batch than the last three runs. The data do not rule out the use of
xanthate, but its performance was not sufficiently promising to justify
further development.
4.5 SCREENING OF MERCURY REMOVAL FROM MH-190 WATERS BY GAG
The behaviors of two activated-carbon columns, one filled with
coconut char and one filled with coal-based char (Filtrasorb 300), were
followed for a 30-d period.
1.1 and 1.9 ppb (parts per billion or pg/L). The effluent levels (see
Table 12) ranged between 0.5 and 1.1 ppb from the coconut char and 0.1
and 0.8 ppb fo r the Piltrasorb.
June 7 exceeded the goal of 0.5 ppb.
performances is unknown.
The inlet mercury levels ranged between
The Filtrasorb effluents of May 30 and
The reason for these poor
Assays performed during the first week of the test showed 8 to
15 ppm of TOG.
biogrowth on the adsorption media.
up throughout the beds, resulting in back-pressures that made flow
control of the very simple flow circuits quite difficult.
backwashing did not remove the sludge.
rodding while in the backwash mode, which caused some carbon mixing in
the beds.
30-d period.
The level of organics was sufficient to permit
With time, a gelatinous mass built
Simple
The beds were kept open by wire
This cleaning procedure w a s ineffective by the end of the
Since column lives should exceed several months, it may prove
necessary to operate with a number of beds in series, each having
provision for air scouring.
scouring yields a back-mixed carbon bed.
beds might be of value.
be demonstrated; for example, discharge of an effluent containing
biocides is likely to be unacceptable.
The design will have to recognize that air
Periodic Sterilization of the
However, a safe sterilization technique must

30
a Table 12. Phase I - granular activated-carbon results
MH-190 water Coconut Filtrasorb 300 inlet effluent effluent
mercury mercury mercury Date. ( PPb 1 (PPb) (PPb)
5 / 2 3 / 8 5
5 / 2 4 / 8 5
5/25/85
5 / 2 6 / 8 5
5 / 2 7 / 8 5
5 / 2 8 / 8 5
51 29 / 85
51 30 /85
6/07/85
6/10/85
6/21/ 85
1.9
1.8
1.2
0.8
0.6
1.5
2.1
1.1
1.4
1.8
1.5
0 . 3
0.4
0 . 4
0.7
0.6
1.1
0.9
0.8
1.1
0.4
0.6
0.1
0.2
0.2
0.1
0.2
0 .4
0 .4
0.6
0.8
0.2
0.2
depths 30 in., column diameter 1-in. ID, column height 48 in., carbon charge Filtrasorb 300 - 198.8 8 , coconut 171.5 g. Nominal flow rate 250 d / m i n through each co~umn.
31
5. PHASE I1 RESULTS
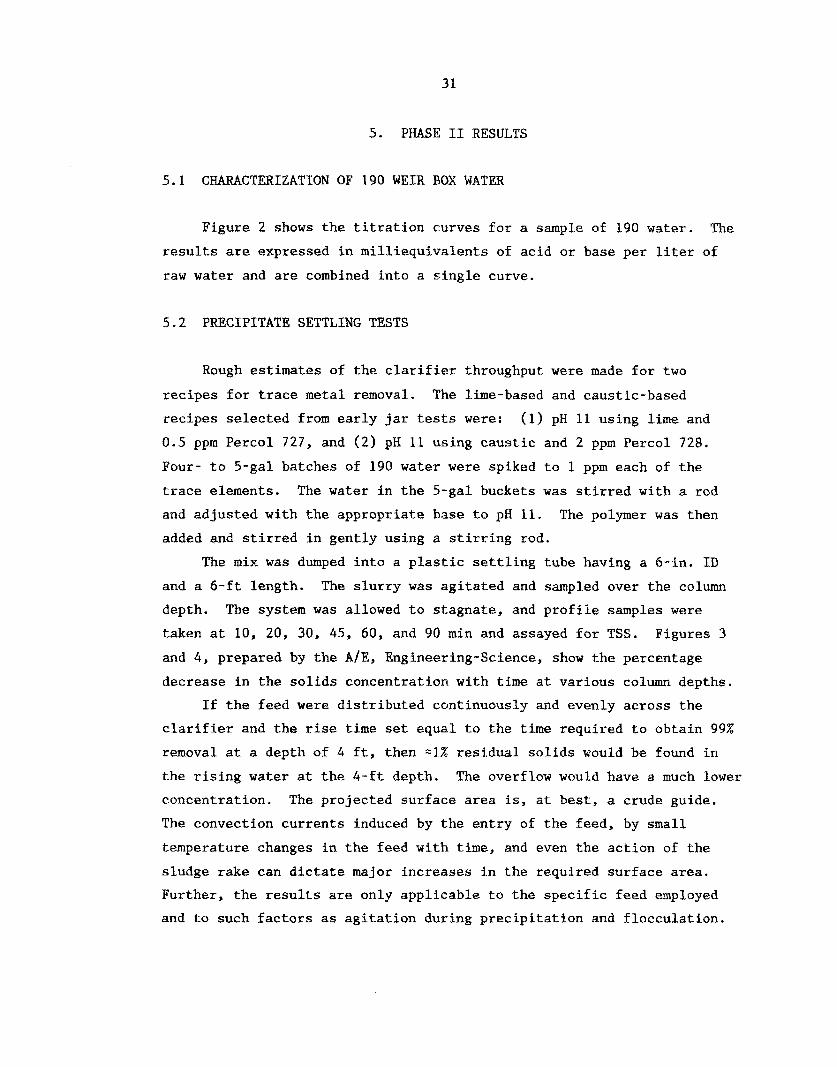
5 .1 CHARACTERIZATION OF 190 WEIR BOX WATER
Figure 2 shows the titration curves for a sample of 190 water. The
results are expressed i n milliequivalents of acid or base per liter of
raw water and are combined into a single curve.
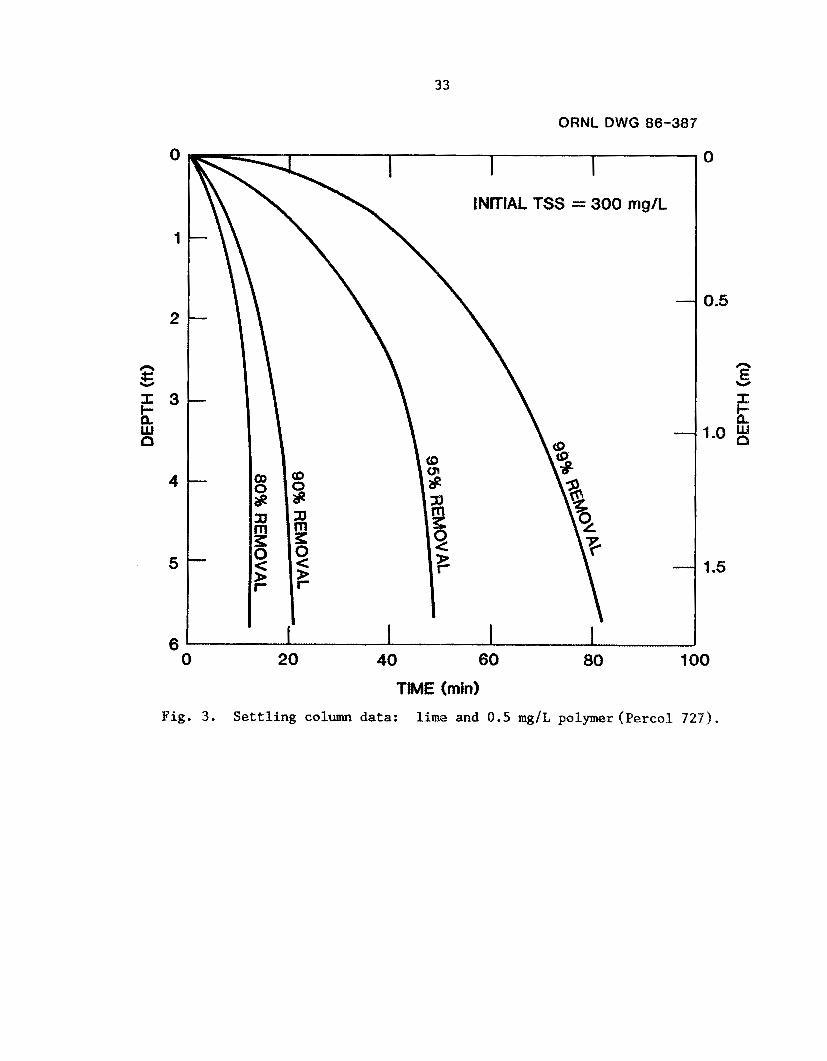
5.2 PRECIPITATE SETTLING TESTS
Rough estimates of the clarifier throughput were made for two
The lime-based and caustic-based recipes for trace metal removal.
recipes selected from early jar tests were: (1) pH 11 using lime and
0.5 pprn Percol 727, and ( 2 ) pH 11 using caustic and 2 ppm Percol 728.
Four- to S-gal batches of 190 water were spiked to 1 ppm each of the
trace elements.
and adjusted with the appropriate base to pH 11.
added and stirred in gently using a stirring rod.
The water in the 5-gal buckets was stirred with a rod
The polymer w a s then
The mix was dumped into a plastic settling tube having a 6-in. ID
and a 6-ft length.
depth.
taken at 10, 20, 30, 45, 60, and 90 min and assayed for TSS. Figures 3
and 4 , prepared by the A/E, Engineering-Science, show the percentage
decrease in the solids concentration with time at various column depths.
The slurry was agitated and sampled over the column
The system was allowed to stagnate, and profile samples were
If the feed were distributed continuously and evenly across the clarifier and the rise time set equal to the time required to obtain 99%
removal at a depth of 4 ft, then ~ 1 % residual solids would be found in
the rising water at the 4-ft depth.
concentration. The projected surface area is, at best, a crude guide.
The convection currents induced by the entry of the feed, by small
temperature changes in the feed with time, and even the action of the
sludge rake can dictate major increases in the required surface area.
Further, the results are only applicable to the specific feed employed
and to such factors as agitation during precipitation and flocculation.
The overflow would have a much lower
32
b
33
ORNL DWG 86-387
TIME (mid Fig. 3. Settling column data: lime and 0.5 mg/L polymer(Perco1 727).
34
v! 0
v! ?-

35
5.3 SLUDGE DEWATERING TESTS
Five 200-L batches of 190 water were treated serially in a stirred
Each batch was spiked to 10 ppm in each of and baffled 55-gal drum.
the eight criteria trace elements.
addition while stirring rapidly for 5 rnin. The agitator speed was then
reduced to gentle action, polymer w a s added, and stirring continued for
15 min.
into a 5-gal carboy.
employed in the settling tests (i.e,, one sludge employed lime plus
0.5 ppm Percol 727 while the other employed caustic plus 2 ppm Percol
728).
The pH was raised to 11 by alkali
The liquor was settled for 30 min, and the sludge was drained
The precipitation recipes were the same as those
The sludge was processed in the Engineering-Science test system,
which consisted of a 60-psi gas-pressurized sludge receiver connected
by an underflow line to a small plate and frame filter.
was 1.9 cm thick and had a diameter of 10.8 cm to give a cross-
The plate used
sectional area of 92 cm 2 . A typical run charged the receiver with 7 L
of lime slurry. Upon pressurization, 0.75 L of solids-laden solution
was followed by 2.75 L of clear filtrate.
until the flow decreased to a very slow trickle (1 to 2 h). There was
3.25 L left in the receiver, while 171 g of wet cake filled the press.
The cake initially assayed 409. solids, while a repeat test assayed 43%
solids. The sludge produced by caustic treatment could not be
contained by clean cloth. However, 3 to 7 g of filter aid
(diatomaceous earth) applied as a precoat contained the sludge in the
filter.
day.
Pressure was maintained
The 155 g of wet cake assayed -45% solids when dried the next
5.4 JAR TESTS
The proposed removal of the criteria trace elements (Ag, Cd, Cr3+,
Cu2+, Fe3+, Ni, Pb, and Zn) by precipitation at an elevated pH followed by filtration was screened for the optimum operating conditions by
means of a series of jar tests. The jar tests model precipitation

36
followed by clarification.
cannot be modeled effectively on a very small scale.
The more efficient sludge-blanket R / C
The proposed process system removes the trace elements as their
hydroxides in the sludge blanket, while carryover is removed in a
downstream dual.-media filter. Incidentally, silver is likely to
precipitate as the chloride, and lead may come down as a basic
carbonate in the wastewaters of concern. Precipitation as the sulfide
is R potential alternate t n hydroxide precipitation, as the
solubilities of many sulfides are extremely low.
would remove mercury and has been reported to be effective for Cr6* removal and the removal of chelated metals. 8
Sulfide precipitation
Removal of the trace elements by the precipitation-settling-
filtration process sequence depends on adequate crystal growth,
particulate agglomeration, flocculation, and sedimentation rates. Only
a small fraction of the crystals should carry over into the filter.
Further, these crystals must be large enough to be removed in the
granular filter bed. The bc.st results are achieved by flash mixing in
the presence of recirculating precipitate to minimize nuclei formation
and maximize crystal growth.
are best achieved in a slowly mixed suspension.
Crystal agglomeration and flocculation
The jar tests, six of 1 -L beakers in parallel, employ a 5-min
rapid-mix period, a 15-min slow-mix period, and finally, a 30-min
settling period.
the rapid mix period.
during the slow-mix period. Filtration in these tests was through a
0-45-wm membrane,
Reagents such as alkali and sulfide are added during
Flocculants such as alum and polymer are added
The results of the jar tests provide a guide to the optimum
process conditions, although the jar does not duplicate the
concentration and sludge profiles in a conmereial unit. Many
impurities in wastewaters hinder crystal growth. The plant water
contains traces of many impurities, and their concentrations are
continually changing. Storage of large quantities of composite water
is not a solution because of the biological processes occurring in the
wastewaters. A reproducible, generally low level of each trace element
i n the effluent may be a better guide to the optimum than a very low-

37
level spot value.
were pH 10.5 to 11.5 using lime, lime and soda, or caustic. The
clarification step could be improved by the use of appropriate organic
polymers in the range of 0.5 to 2 ppm. Table 13 provides a quick
reference to the jar test data for these optima.
of the jar tests are presented in Tables A.l to A.16 in Appendix A.
The optimum conditions for the MH-190 weir box water
The detailed results
The additions of Na2S, NaBH4, and Na2S03 were screened under
several conditions. Sodium borohydride improved trace element removal
in some cases, although the improvement was relatively small, while
sodium sulfite addition was deleterious. There is no clear evidence
that Na2S enhanced the removal of the trace elements despite the lower
solubilities of the sulfides, which may indicate that the crystals were
not growing to capture size. In the electroplating industry, the
sulfide sludge blanket is the key to the success of the sulfide
precipitation step;9 however, the jar tests did not model a sludge
blanket.
5.5 REACTOR/CLARIFIER-DUAL-MEDIA FILTER
Bench-scale operation of a sludge blanket lime softener followed
by a dual-media (anthracite and coal) filter was attempted (see Fig.
5). The reactor/clarifier had a residence time of 1.5 h at 70 niL/min.
An even distribution of liquid through the blanket was unattainable.
Most of the particulates in the overflow were trapped in the 3- to 6-mm
anthracite layer at the top of the dual-media bed.
the sheet formation, which would choke off flow within 24 h, is not
clear.
over from the precipitator, appears to initiate the process.
Postprecipitation of CaC03 may then strengthen the bridges to the point
where they resist the available driving force of 5 to 10 psi on the
liquid.
The mechanism of
Bridging of the voids by large flocs, which occasionally came
Iron addition at 6 ppm and Purifloc (a polyelectrolyte) additions
between 0.3 and 3 ppm did not impede: the growth of the layer.
layer appeared to be weaker during Purifloc additions between 0.3 and
1 ppm, but this is a very subjective judgment.
This
In the complete absense

38
Table 13. Effective trace element removal conditions during the jar tests
Set 1 pH 11 11.5 11.5
7a 11
8
9
10
11 11.5 10.5 11
11.5 10.5
10.5 11
15 11.5
16 11.5
with NaOH with Ca(OH)2 with Ca(OH)z -k Na2C03
with Ca(0H)z + Na2C03 + polymer with NaOH with Ca(0W)Z + Na2C03 with Ca(OH)* + Na2CO3 + NaSH4 with NaOH + polymer with Ca(OH)z + Na2C03 with Ca(0H)z f Na2C03 + NaBH4 with Ca(OH)2 + NazCO3 + NaBH4 with NaOH -k polymer
with Ca(OH)2 + Na2S with NaOH + Na2S
%et 7 illustrates improvement in the settling rate attainable with the choice o f the correct polymer.

39
ORNL DWG 86-392
VSP INDICATES VARlABuE SPEED PERISTALTIC PUMP
Fig. 5 . Trace element precipitation/filtration system.

40
of polymer, a thin brittle sheet was formed that frequently had to be
broken up by rodding.
Filter backwashing might have to be very frequent if floc floaters
and supersaturatian cannot be controlled.
resolved in much larger-scale equipment. Only tap water spiked with
1 ppm each of the trace elements Cd, Co, C r , Cu, Ni, Pb, and Zn was
employed in the tests.
spiked with the trace elements.
by recirculating the water with 2-gpm pumps.
remained in suspension or solution.
most of the chromium and copper was filterable from the feed stock with
1-pn filters. Some precipitation of lead occurred as well as
unexpected precipitation of z inc .
This problem can only be
The water was charged to 55-gal drums and
A weak agitation level was maintained
The trace elements
Assays (see Table 14) showed that
The Ga(OH)Z for the softening reaction was formed in the
precipitator by the reaction of feed solutions of NaOH and CaC12.
the flow rates employed, 26 mL/min of mixed reagents, lime slurry
pumping was too unreliable.
calcium in the tap water precipitated in the pH range of 9 . 4 to 10,
while 85% of the calcium precipitated at pH 10.6.
At
The added lime and 30 to 50% of the
The assays showed that the trace elements were effectively
precipitated at pH values >9.5. However, only those initially in
solution were effectively removed by the precipitation and filtration
process. Chromium was a consistent offender, showing 0.1 to 0.2 ppm in
the product, whether filtered or unfiltered through 1-pm paper. The
extremely insoluble Cr(OH)3 probably approached colloidal dimensions
and was not agglomerated by the reagents employed. These conclusions
are derived from the limited data base presented in Table 15, showing
the process effluents as functions of process and additives employed,
The last two sets show unfiltered and filtered effluent samples after
20 h of dual-media filter use (partially plugged) and after 4 h of
filter use (free flowing).
effective f o r all materials but chromium.
The partially plugged condition is

41
Table 14. Feed stock testsa
Ca Mg Cd Co Cr cu Ni Pb Zn
Unfiltered 35 10 1 1 1 1 1.1 1 1-2
Filtered 35 10 1 1 0.1-0.2 0.05-0.1 1.1 0.4-0.6 0.6-0.7
Unfiltered 36 10 1.1 1.0 0.96 1.0 1.2 0.92 1.3
Filtered 36 10 0.91 0.74 0.10 0.05 0.97 0.35 0.11
a All results are given in parts per million (ppm).
Table 15. Softening/filtration process effluents
Softening Purifloc ASSaV (DDm)
Pb Zn process addition Fe3' PH preparation Ca Mg Cd co Cr Cu Ni
Lliaelsoda
Lime
Lime
Lime
Lime
Lime
- - 10.6
- 9.8 6 PPX
0.6 ppx - 9.7
0.6 ppm - 9.7
1.0 ppm - 9.5-10 (after 20 h through dual-media)
1.0 ppm - 9.5-10
(after 4 h through dual -media)
Unfiltered
Unf i 1 tered
Unfiltered
Unfiltered
Unfiltered Filtered
Unfiltered Filtered
7 4
18 6
24 a
14 8
15 7 14 7
23 7 22 7
(0.01
0.01
0.02
0.04
0.02 (0.01
0.04 <o.oa
(0.02 0.2
(0.02 0.08
(0.02 0.2
0.04 0.2
0.03 0.08 (0.02 0.07
0.11 0.12 (0.02 0.07
(0. 02
(0.02
(0.02
(0.02
(0.02 (0.02
0.05 (0.02
(0.05 (0.2
(0.06 (0.2
(0.06 (0.2
(0.06 (0.2
(0.06 (0.2 (0.06 <0.2
0.13 (0.2 (0.06 (0.2
0.1
0.03
0.04
0.05
0.03 0.02
6 N
0.12 (0.02
43
5.6 AIR STRIPPING OF TRACE ORGANICS - BEAKER TESTS
A 20-L sample of MH-190 water was collected in a polyethylene
carboy and spiked with 200 ppb of CHC13 (chloroform), 100 ppb of CgHl0 (naphthalene), 25 ppb of dibutyl phthalate (DBP), and 5000 ppb of NH3
(ammonia).
45 ppb C8H10, 65 ppb DBP, and 210 ppb NH3. The water was transferred
to 1-gal glass jugs, adjusted to several pH levels, and air stripped,
using an open tube immersed in the water in 4-L glass beakers.
Based on the
The mix was sampled immediately and assayed 176 ppb CHCl3,
The accuracies of the assays are uncertain.
residuals noted in waters treated in the MPP system through the three
carbon columns, the lower detection limit is 2 to 8 ppb. If we assume
an accuracy of lo%, then the CHC13 inlet may be 200 ppb and the outlet
=1D ppb (for 95% removal) after 30 gas volumes per volume of liquid
(see Table 16).
Superficially, CHC13 stripping is efficient. However, naphthalene
stripped to very similar levels, but its vapor pressure is <0.001 times
the chloroform vapor pressure. The change in concentration of
naphthalene should be undetectable.
from the system before stripping commenced (according to the feed
analysis), the DBP assay more than doubled.
anomalies, the possibility that the chloroform data are a lso
untrustworthy must be kept in mind.
our organic collecting and sample-preparation procedures may be in
question.
While ammonia simply disappeared
In view of these
Indeed, the validity of much of
Assuming that the measured feed concentration for chloroform is
correct and ignoring the 433-ppb value measured at pH 5, the stripping
data show >90% removal at all five pH levels tested.
assuming that the ammonia feed concentration had been accurately made
up to the 5-ppm level, the stripping data show >85% removal for pH
levels >5.5.
Similarly,

44
Table 16. A i r stripping beaker tests - ~~ ____ __
Gas/ liquid Dibutyl T ( L air/ Chloroform Naphthalene phthalate m a n i a
PH "c: L water) (PPb) ( PPb 1 (PPb) (PPd
4 21 30 4 21 100
7 1
17 12
48 69
0 . 6 4 2.34
5.5 21 30 5.5 24 100
433 4
9 11
100 94
0.3.5 0.24
7 23 30 7 23 100
18 4
9 8
86 63
0.16 0.16
8.5 23 30 8.5 23 100
14 4
37 21
95 91
0.60 0,18
10 24 30 10 23 100
8 3
31 14
70 72
0.40 0.41
Desired feed concentration 200 100 25 5
Measured feed concentration 176 45 65 0.21
Detection limit 1 7 9

45
5 . 7 CARBON ISOTHERMS - MERCURY, DBP, AND NAPHT)IALENE
Before performing the carbon isotherm tests, a contact-time study
was made to determine the amount of time that each isotherm test should
keep the carbon in contact with the liquid.
spiked with 25 ppb DBP; 350 mL of this water was then contacted with 50
rng of the two carbons tested - Filtrasorb 300 and Hydrodarco 4000..
Four tests were run in parallel, with the contact time varied from 0.5
to 4 h. A s can be seen in Table 17, a contact time of 0.5 h was
suff cient to reach equilibrium for both carbons tested.
Fresh MH-190 water was then collected and separated into three
The MH-190 water was
lots each -5 L. The containers were adjusted to pH 4 , pH 7, and pH 10
and then spiked with 25 ppb of DBP. The water normally contains 1 to
2 ppb of mercury.
carbon levels between 0 and 100 mg in fixed liquid volumes of 350 mL.
Shake tests were performed with two carbon types at
Assays of the product filtrates for mercury, DBP, and naphthalene
showed that there were major unknowns in the system, the assay
reliability, or both. The zero carbon samples should show the initial
liquid composition corrected for any adsorption on the container walls.
The zero carbon compositions are shown i n Table 18.
Taking a simplistic view, at pH 4 , mercury is strongly adsorbed on
the container walls; but at pH 7 and above, the mercury remains in
solution or suspension. At pH 4 , the DBP is not adsorbed; however, the
analytical system is reading twice the level of the spike. Above pH 4 ,
the phthalate is strongly adsorbed onto the container walls. Although
naphthalene was not added to the wastewater, values of 3 to 12 ppb were
reported. These results may reflect trace inputs of naphthalene in the
wastewater, noise from other unknown compounds, or analytical error.
The observed liquid concentrations are shown as functions of added
carbon levels and pH in Table 13.
to 0.2 ppb; consequently, the quantities adsorbed from the liquid at
pH 4 cannot be estimated. At pH 7, -50% is removed, irrespective of
carbon loading up to 40 mg. The sudden drop t o 0.1 ppb for the 100 mg
loading is contrary to adsorption behavior, suggesting that an unknown
mechanism o r an error in procedure is involved.
Mercury sensitivity levels are 8.1
The mercury data at

46
Table 17. Carbon isotherm contact-time studya
Mercury DBP 2 remaining Contact time concentration Concentration b in liquid
Carbon type ( 1 1 ) ( PPb 1 ( PPb ) Hg DBP
Feedwater 1.3 2500 100 100
P-300 HD-’4000
0.5 0 .5
0.3 0.3
15 14
23 0.6 23 0.6
F-300 HD-4000
1 1
0.3 0.2
17 11
23 0.7 15 0.4
2 2
0 . 3 0.3
14 10
23 0.6 23 0 .4
I?-300 W)-4000
P-300 Ha-4000
4 4
0.1 0.2
12 12
8 0.5 15 0.5
%tudy conducted with 50 mg carbon plus 350 mL of water at 23°C.
bDBP concentration given with range of 25 ppb.
Table 18. Zero carbon-loading assays
Carbon typea Mercury Dibutyl phthalate Naphthalene PB
4 F-300 0.2 48
4 EID-4000 0.2 4 8
7 P-300 1.5 1
7 HI-4000 1.5 1
10 F-300 1.3 0
10 HD-4000 1.3 0 __ -~ __ _
aF-300 is Filtrasorb 300, while Ha-4000 is Hydrodarco 4000.

47
Table 19. Dibutyl phthalate and mercury carbon isotherm tests
Adsorbate Weight Volume adsorbed
of of Liquid Amount per unit Sample carbon liquid concentration adsorbed wt of c No. (mg) (mL) (pg /L) (Hg/mL) (mg ads/g C)
A-0949 A-0951 A-0955 A-0959 A-0963 A-0967
A-0948 A-0950 A-0954 A-0958 A-0962 A-0966
A-0949 A-0953 A-0957 A- 096 1 A-0965 A-0969
A-0948 A-0952 A-0956 A-0960 A-0964
Test conditions: Carbon type F-300, pH = 4, T = 23°C
Mercury
0 350 0.2 - 1 4 350 0.2 0 0
i
350 0.1 0.1 0.0350
10 350 8.1 0.1 0.0035 40 350 0.1 0.1 0.0009
100 350 0.1 0.1 0.0004
Dibutyl phthalate
0 350 43 - 1 350 42 6 4 350 45 3
10 350 55 0 40 350 31 17
100 350 2 1 27
-
Test conditions: Carbon type HD-4000, pH = 4 , T = 23°C
Mer cur y
0 1 4
10 40
100
0 1 4
10 40
350 350 350 350 350 350
350 350 350 350 350
0.2 0.1 0.1 0.1 0.1 0.1
Dibutyl phthalate
48 33 40 24 31)
- -Hg 0.1 0.0350 0.1 0.0088 0.1 0.0035 0.1 0.0009 0.1 0.0004
- 15
8 24 18 30 A-096% 100 350 18

48
Table 19 (continued)
Adsorbate Weight Volume adsorbed
Of of Liquid Amount per unit Sample carbon liquid concentration adsorbed wt of C No. ( m e ) (mL) (cle/L) (L4dd-J (mg a w g c>
Test conditions: Carbon type F-300, pH = 7, T = 23°C
Mercury
A-0971 0 350 1.5 - - A-0973 1 350 0.8 0.7 0.2450 A-0993 4 3.50 0.6 0.9 0.0788 A-0997 10 350 0.7 0.8 0.0280 2182 40 350 0.6 0.9 0.0099 2186 100 350 0.1 1.4 0 0049
Dibutyl phthalate
A-0970 0 350 I - - A-0972 1 350 12 0 A-0992 4 350 19 0 A-0994 10 350 0 1 A- 1000 40 350 12 0 2185 100 350 0 1
Test conditions: Carbon type IED-4000, pH = 7, T = 23°C
Mer cur y
A-0971 0 350 1.5 - A-0975 1 350 0.9 0.6 A-0995 4 350 0.6 0.9 A-0999 10 350 0.9 0.6 2184 40 350 0.7 0.8 2188 100 350 0.1 1.4
Dibutyl phthalate
A-0970 0 350 1 - A-0974 1 350 13 0 A-0994 4 350 5 0 A-0998 10 350 0 1 2183 40 350 0 1 2187 100 350 0 1
- 0.2100 0.0788 0.0210 0.0070 0.0049

49
Table 19 (continued)
Adsorbate Weight Volume adsorbed
Of of Liquid Amount per unit Sample carbon liquid Concentration adsorbed wt of c No. (me> (A> (ug/L) (I.cg/d) (mg ads/g C >
Test conditions: Carbon type F-300, pH = 10, T = 25°C
Mercury
2190 2192 2196 2200 2204 2208
2189 2191 2195 2199 2203
2190 2194 2198 2202 2206 2210
2189 2193 2197 2201 2205 2209
0 350 1.3 1 350 0.7 0.6 0.2100 4 350 0.5 0.8 0 0700
10 350 0.4 0.9 0.0315 40 350 0.2 1.1 0 * 0096
100 350 0.2 1.1 0.0039
- -
Dibutyl phthalate
0 350 0 1 350 9 0 4 350 12 0
10 350 31 0 40 350 127 0
-
Test conditions: Carbon type HD-4000, pH = 10, T = 25°C
Mercury
0 350 1 . 3 0.5 0.8 0.2800 1 350
4 350 0.4 0.9 0.0788 10 350 0.5 0.8 0.0280 40 350 0.3 1.0 0.0088
100 350 0.2 1.1 0.0039
- -
Dibutyl phthalate
0 350 Q 1 350 2 0 4 350 13 0
10 350 15 0 40 350 70 0
100 350 9 0
- -

pW 10 produce reasonably normal types of adsorption isotherms, as can
be seen in Pig. 6 . Based on these isotherms, there i s little
difference to choose between the carbons.
The scatter of the DBP data at pR 7 and pH 10 suggests that the
assays are not valid at readings <20 ppb and that the system is
sensitive to unknown interferences.
at levels >25 ppb, the pH 4 data may imply very little adsorption at
carbon loadings up to 10 and possibly 40 mg, although DBP should be
strongly adsorbed by activated carbon.
Assuming an uncertainty o f 215 ppb
Although little can be learned about carbon performance from these
isotherm tests, two important observations emerge: ( 1) uncertainties
exist in the analytical procedures for the (100 ppb region, and
(2 ) possibilities occur for component loss by adsorption during sample
collection. In addition, the observations that efficient mercury
adsorption at pH 4 and phthalate adsorption above pW 4 occur are
entirely unexpected.
5 .8 ION EXCHANGE FOR METALS REMOVAL
A large batch of IRC-718 resin was presaturated with calcium and magnesium by passing tap water through the bed until the influent and
effluent hardnesses were equal. The waters for the subsequent,
controlled-pH column tests were distilled-water stripped of CO2 by N2
sparging and spiked with 30 ppm Ca and 10 ppm Mg as nitrates.
water was then spiked with 1 pprn each of Cd, Co, Cr3', Cu, Ni, Pb, and
Z n as their nitrates. Nitric acid addition was used to control the pM.
The liquid residence time in the resin beds was 0.7 to 0.8 min, about a
third of the IX column residences of the PWTP. Batches of resin were
run using pH 6 . 8 , 5.8, 5.5, and 5 feed stocks. The pH rose between 0.5
and 1.0 units during passage of the spiked feed through the beds. This
rise is believed to be associated with the displacement of the more
alkaline calcium and magnesium by the heavy trace elements.
The
The trace elements in the feed stock partially precipitated when
the pH was held at levels >5.8. These precipitates stayed in
suspension and did not dissolve during passage through the resin. As

51
ORNL DWG 86-389
A / /@
/ A i
/- @ # A
CARBON TYPE
A HD-4000 0 F-301)
/
PH 10 -
0.00 1 0 0.2 0.4 0.6 0.8 1 .o
RESIDUAL MERCURY (pg/kg) Fig. 6 . Carbon isotherm for mercurv at nW I n -
4 - - c-- - - -

52
' seen in a comparison of filtered and unfiltered samples o f run 10 with
those of runs 9 and 11 (Table 201, the feed stack did not precipitate
at pI4 5.2, but some precipitation occurred in passage through the bed.
No precipitation occurred in the system at an inlet pH of 5 (run 12).
Column performance appears to have improved with decreasing pH
despite the Hf competition. precipitate dissolution processes.
at the 1-ppm level is borderline at pH 5 under ideal conditions, The practical operating pH of the feed is likely to be ~ 4 . 5 a t the column
inlet.
This may, however, be an artifact of
Precipitation of the trace elements
The resin cannot break up EDTA complexes with the trace elements, as shorn in runs 5 and 6. Thus, the control of trace elements in the
presence of strong csmplexing agents is an unresolved problem.
G. FLOWSHEET AND DESCRIPTION OF THE MINI-PILOT PLANT EQUIPMENT
The physical layout of the mini-pilot plant in the two semitrailer
vans is presented in Fig . 7. The trailers contain three feed tanks,
three dual-media filters, an air stripper, am ion-exchange column, a
reactorjclarifier, a phase separator, three GAC columns, an ozonation
unit, and a reverse osmosis unit.
in this study).
various panels for the automatic process control of the equipment were
(The latter two units were not used
A chemical addition rack f o r the precipitator and
a l s o included.
6.1 A P I SEPARATOR
The A P I separat , illust ted schematically i Fig . 8, acts a.
phase separator. Light, insoluble organics (e.g., oil) float to the
top of the center section, while any solids (e.g., dirt) settle to the
bottom. The unit w a s sized to give a residence time of -1 h at a flow
rate of 2 gpm.

Table 20. Phase I1 bench-scale resin column testsa
Starting conditions: 7.4 mL IRC-718, f 10 mumin of tap water spiked w i t h 1 ppm each of Cd, Co, Cr, Cu, Ni, Pb, and Zn; Ca 9 30 ppm, Mg 9 10 ppm.
Effluent Feed Effluent volume (L) pH Cd co Cr CU Ni Pb Zn pH Cd Go Cr cu Ni Pb Zn Run No.
8.7
6.5
10.9
6.3
11.5
21.9
24.4
3.5 5.7
8.5 11
12
6.8
6.2
5.6
5.5
5
5.4
5.0
4.9 4.9
5
5
0.99 0.98
1.0 1.0
0.93 0.94
0.93 0.92
1.0 1.0 0.92 (0.02
1.0 0.9 0.95 0.04
0.91 0.86 0.94 0.84
(0.93 0.90 0.91 0.88
1.1 0.096
1.0 0.34
0.97 0.97
1.0 0.97
1.0 1.1 1.2 7.4 0.12 0.19 0.58 0.93 0.26 0.95 0.08 0.09 0.04
6.5 0.05 0.11 0.55 0.09 0.11 0.03
1.1 1.0 1.1 6.3 1.0 0.64 1.2
6.0 0.05 0.66 0.12 0.09 0.09 0.05
6.4 0.15 0.17 0.18 0.17 0.17 0.02
0.90 0.97 1.0 0.99 0.97 1.0
6.1 0.38 0.40 0.33
6.6 0.01 0.01 0.05 5.7 0.02 0.03 0.08
0.03 0.04 0.07
flow rate reduced to 5 mllmin
6.3 0.01 0.02 0.06 6.2 0.01 0.02 0.07
0.98 1.1 1.2 6.2 0.98 1.0 1.1
0.56 0.07
0.45 0.05
0.07 0.05
0.1 0.04
0.22
(0. 02 (0.02 0.02
(0.02 (0.02
0.14 0.01
0.09 0.08
(0.06 0.98 0.13 0.13
0.33
(0.06 (0.06 (0.06
(0.06 C0.06
(0.2 0.28 (0.2 0.13
(0.2 0.38 (0.2 0.16
(0.2 0.17 (0.2 3.13 (0.2 0.23 (0.2 0.21
(0.2 0.45
(0.2 0.07 (0.2 0.09
c0.2 0.18
(0.2 0.14 (0.2 0.09
unf i 1 tered 9 f ilteredb
unfiltered 11 filtered unfiltered filtered
unfiltered 10 filtered unfiltered filtered filtered unfiltered unf i 1 tered
unfiltered 12 unfiltered filtered
unfiltered unfiltered unfiltered filtered

Table 20 (continued)
Starting conditions: 7.4 mL IRC-11s plus = 10 mL/min of distilled water
Effluent Feed Effluent R u n No. Ni Pb Zn volume ( L ) pH Cd co Cr cu Ni Pb Zn pH Cd Co Cr cu
11.3
1 6 . 0
31.2
51.1
nominal 1 ppm Ni2+, 1 ppm Zn2+, 29 ppn Ca2+, 10 ppm Mg2+ as nitrates, 20 ppm Na2 EDTA, distilled water
48.8
10.4 14.6 28.5 N a 2 DTA, distilled water. Source 4 7 . 3 of zn2+ unknown
nominal 1 ppm Cu2+, 29 ppm Ca2+, 10 ppm ~ g ~ + as nitrates, 10 ppm
1.0 1.0 1.8 1.1 1 . 1
1.0 1 . 0 filtered 5 2.0 1.1 unfiltered 0.98 1.2 unfiltered 1.0 1.2 diltered 1.0 1 .1 filtered
0.06 riltered 5 0.45 unfiltered 0.5 unfiltered 0.26 unfiltered 0.44 filtered
%'est results expressed in parts per million (ppm).
kltered through 0.45-pm paper.
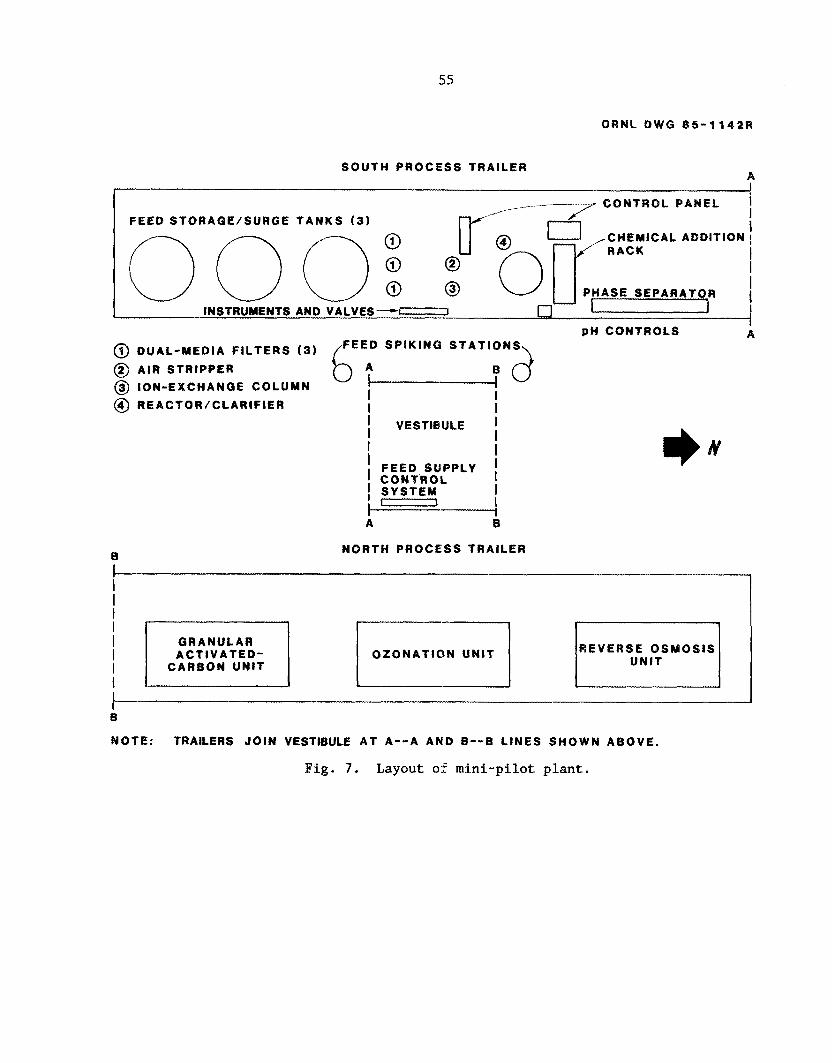
55
QRNL DWG 85-1142R
SOUTH PROCESS TRAILER A
CONTROL PANEL I 1 I I
,CHEMICAL ADDITION I I I I
/- __--- FEED STORAGEISURGE TANKS (3)
RACK
PHASE SEPARATOR I INSTRUMENTS AND VALVES---
pH CONTROLS A @ DUAL-MEDIA F ILTERS (3) @ AIR STRIPPER @ ION-EXCHANGE COLUMN
FEED SPIKING STATIONS
I I @) REACTOR/CLARIFIER I I
I VESTIBULE I I I I I ' FEED SUPPLY I I
I I CONTROL I SYSTEM '0 I l------------1 A B
NORTH PROCESS TRAILER B
I I I I I I I I
GRANULAR ACTIVATED-
CARBON UNIT QZONATIQN UNIT REVERSE OSMOSIS
UNIT
t B
NOTE: TRAILERS JOIN VESTIBULE AT A--A AND B--B LINES SHOWN ABOVE.
Fig. 7. Layout of mini-pilot plant.

56
ORUL DLVG 86-343R
INLET
Fig . 8. API separator.

57
.ET
OUTLET
Fig . 9. Sludge-blanket type of reactor/clarifier.

58
Criteria trace-element precipitation is the method that was used
for removing metals from the feed water in this study.
MPP campaign, most of the criteria metals were removed by the reactor/clarifier ( R / C ) , shown in Fig. 9, using lime and soda ash. The
critical aspect of this approach is the growth of the trace-element
particulates and other precipitates to sufficiently large sizes to
settle out.
In the first
The W/C is a device that allows introduction of the feed water
below the surface of a developed blanket of sludge containing heavy-
metal hydroxides in addition to the calcium carbonate/hydroxide-
magnesium hydroxide mixture which comprises the bulk of the solid
phase.
A rapid mixer (Fig. 10) blends lime and sodium carbonate to form
insoluble calcium carbonate and increases the pB to =9.5, The criteria
elements then precipitate either as hydroxides or as carbonates. After
20 to 30 s of intense mixing, the slurry is dumped into a slow-mix zone
in the R / C (i.e., center of the unit) where the particles grow within a
blanket of existing sludge. A flocculant (polyelectrolyte) is added to
this zone for the purpose of bonding gel particles together. The
addition of this agent also serves to enhance system operation by
minimizing the sludge volume.
The liquid in the R / C passes successively into the outer section,
up through a sludge blanket, and into the settling zone. Although the
effluent from the settling zone is typically rather clear, it must be
filtered in order to remove suspended criteria trace-element particu-
lates.
In the second MPP campaign, in which caustic was used to
precipitate the criteria trace metals, the R/C w a s modified as shown in
Fig . 11. The rapid mixer was used to blend the incoming pracess
wastewater with caustic and the polymer.
a 15-gal tank which was used as a reactor with a slow mixer.
overfl.ow from the reactor was subsequently piped to the bottom of the
The overflow was collected in
The

59
ORNL DWG 86-342 R
OUTLET
Fig. 10. Rapid mixer for prec ip i ta tor .

60
OUTLET
NL DWG 86-413R
----
INLET
Fig. 11. Precipitator/clarifier far caustic campaign.

61
former R/C in which the slow-mix zone had been removed; at this point,
the vessel simply served as a clarifier.
6 , 3 DUAL-MEDIA FILTERS
Two, identical dual-media filters, capable of removing >1- to 5-Nrn
particulates, were installed in parallel f o r treating the effluent from
the R/C.
Approximately 12 in. of 1.7- to 1.9-m anthracite coal was placed in
the g-in.-diam by 5-ft-long unit on top of another 12-in. layer of 0 . 6 -
to 0.8-mm sand particles. Coarse particulates were trapped on the bed
and in the voids between the particles a s the influent flowed downward
through the column.
A schematic of one of these filters is shown in Fig. 12.
While one of the units was in operation, the other unit was being
Polyelectro- regenerated by backwashing in upflow with process water.
lyte could have been added to the latter stages of the backwash
solution so that it could be adsorbed onto the filter particles.
treatment would probably improve the capability of the filters for
trapping very small particulates but was not done in this study.
Such
6 . 4 AIR STRIPPER
A schematic of the air-stripping column is presented in Fig. 13.
The column packing (5/8- by 5/8-in. stainless steel Pall rings) allows
for a large interfacial area between the downflowing liquid and the
upflowing air and, thus, ensures equilibrium between the two phases.
The liquid stream is stripped with 50 to 150 volumes of air per volume
of water.
removed in this type of unit.
The volatile organics and emulsions are typically well
6.5 ACTIVATED-CARBON COLUMNS
Activated carbon is a very effective medium for removing organics
in solution as well as organics that exist as emulsion phases.
Nonvolatile organics and mercury were removed by a series of three

6%
INLET
OUTLET
F i g . 12 . Ilual-media filter.

63
LIUUID
AIR INLET /
ORNL DWG a 6 - 3 4 7 ~
AIR OUTLET
\r LlQUlD OUTLET
F i g . 13. Air stripper.

6 4
lO-in.-diam GAC co l l i~~ i i s f i l l e d with 8 x 30 mesh Calgon F-300 a c t i v a t e d
carbon. I n t h e f i r s t MPY campaign, ~ 9 0 l b of carbon vas Loaded i n t o
oaci? colwiin, resulting i n a packed depth of 5 f t ; i n t h e second MPP
campaign, t h e loading w a s reduced to 30 l b . A schematic of a t y p i c a l
column is shown i n P j g . l A * The e f f l u e n t from the GAC eolurnns is t h e
s imulated aqueous discharge from the NRWT p l a n t .
An ion-exchange ( I X ) colmm was operated i n p a r a l l e l w i th the R / C
i n t h e MPP i n ordel- t o eva lua te the long-term perfornance of hber 'Lite
IRC-718, a che la t ing , heavy-metal-select ive r e s i n . The colurnn used
(see Fig. 15) was 8 in . i n diameter and contained 1 f t 3 of r m i n .
7. OPERATION OF THE MINI-PILUX PLANT SYSTEM
The 190 pond and Building 3544 waters, which flow a t nea r ly
s t e a d y - s t a t e condi t ions and are r e a d i l y a v a i l a b l e , provided t h e base
feed t o the MPP. The 190 pond water W i X S pm~ped cont inuously from the
weir hox a t Mi-190 t o t h e trailers. A s p e c i a l n ix ing chmber was added
below t h e veir t o permit c o l l e c t i o n of samples r e p r e s e n t a t i v e of both
f l o a t i n g and d isso lved organics i n the wastewaters. L J n f ~ r t u n a t ~ l y , the
f r o t h generated by t h e f a l l over the weir i n t o t h e chamber d i d not
allow enough clear l i q u i d t.o be pumped t o t h e trailers.
this problem, t h e area above t h e w e i r w a s used f o r water c o l l e c t i o n .
The l i q u i d c o l l e c t e d i n t h i s way was gene ra l ly f r e e o f coa r se
p a r t i c u l a t e s and o i l d rop le t s . The nmntral ized PWTP e f f l u e n t was a l s o
cont inuously pumped Sroin t h e clearwell b e h w the UuiIding 3544 e f f l u e n t
w e i r . To avoid t h e introduction of n i t r a t e s , the Building 3544
e f f l u e n t w a s n o t pumped t o t h e MPP u n t i l i t s n i t r a t e concent.xation had
been reduced. T h i s s t e p WRS accomplished by rou t ing t h e n i t r i c a c i d
r i n s e water t o t h e 3.51.8 bas in i n s t e a d of r e tu rn ing i t t o t h e 3524
Equal iza t ion Basin. The decrease i n n i t r a t e concont ra t ion as a
To circumvent.

65
INLET
-L
ORNL DWG $6-344R
Fig. 14. Granular activated-carbon column.

66
ORNL DWG e 6 - 3 4 a ~
INLET
OUTLET
Fig. 15. Ion-exchange column.

67
function of time is summarized in Table 21.
effluent to the MPP was started on August 5.
The feed of Building 3544
After an initial period of operation with only the 190 pond and
Building 3544 waters, the remaining significant wastewaters were also
fed to the MPP. Water from MH-229, which was located nearby, was
pumped directly to the MPP.
TRU, TURF, Building 1505, and MH-143, MH-235, and MH-240) were
collected via truck on a routine basis and held in storage at the MPP. These streams were then introduced into the system at rates
proportional to their generated rates. Based on the information in
Table 3, these wastewaters were collected as indicated in Table 22 and
were metered into the system in proportion to the 190 pond water (see
Table 2 3 ) .
The remainder of the sources ( i . e . , HFIR,
7.2 SPIKING OF FEED STREAMS
Since the presence of contaminants in the ORNL wastewaters is
fairly rare, except for mercury and some volatile organics, it was
necessary to spike these wastewaters with the appropriate criteria
metals (i.e., Ag, Cd, Cr, Cu, Fe, Pb, Ni, and Zn) and organics. The
criteria metals were solubilized as nitrate salts and were metered into
the main wastewater flow so that the stream that was fed to the API separator contained ~1 mg/L (1 ppm) of each metal except for Ag and Fe,
which were each fed at a concentration of only -0.1 ppm.
simulate the expected pulse nature o f contaminants in the 190 pond
water, the MPP feed was typically spiked with the solution of metals for 24 h twice per week.
In order to
Spiking of the influent streams with organics was done on a
schedule similar to that described far the metals.
chosen, with the help of the ACD, to cover a wide range of volatility.
These organics - chloroform, naphthalene, and dibutyl phthalate
(DBP) - could also be more easily analyzed, which would reduce the required analytical costs substantially.
with naphthalene to a level of 100 to 200 ppb, while the Building 3544
water (which enters the MPP just prior to the air stripper and the
Three organics were
The 190 feed water was spiked

68
Table 21. Decrease of nitrate concentration i n the Equalization Basin
Nitrate concentration Date Tine ( PPm 1
8/1/85 0830
8/2/8!ja 0830
8/3/85 0830
8 / 4 / 8 5 0830
8/5/85 0830
8/6/85 0830
8 /7 /85 0830
427
106
60
32
15
8
11
aThe XX column r i n s e was switched from the Equalization Basin to the 3518 bas in on 8/2/85 a t 1630.
Table 22. Proportions of t h e various wastewaters collected
Source % of t o t a l
BF IX
TRU
TURF
Building 1505
MH- 149
MH-229
MH-235
m- 240
24
20
4
18
8
14
5
7
Total 100
-

69
Table 23. Relative stream contributions to the precipitator
loop in the MPP
Source % of total
190 pond
HF IR
TRU
TURF
Building 1505
MH- 149
MH-229
MH-235
MH-240
56 .1
1 0 . 3
9 . 0
1 . 8
7 . 6
3 .6
6 . 3
2 . 2
3 . 1
Total 100.0
70
activated-carbon columns) was spiked with chloroform to a level of 200
ppb and with DBP to levels of 25 to 100 ppb.
contaminants present in the raw wastewaters were also present in the
feed to the MPP.
exceeded on several occasions during the 5-month period of MPP
operation.
Of course, any
Thus, the proposed discharge limits were probably
7 . 3 DETAILED FLOWSHEET
The piping and instrumentation diagram for the MPP is shown in Pig. 16. The basic connectivities are described in the paragraphs
br! low
Wastewater from the 190 pond entered the MPP at the API separa-
tor. After phase separation, it was divided into two fractions. One
fraction went first to tank T-301, where the pH was adjusted to 4 .7 ,
then to the dual-media filter, and finally, to the IX column. The
effluent from the IX column was removed from the system. The other
fraction went to the R / C . After treatment in the X/C, the stream was
routed first to the filtrate equalization tank and then through one of
the two dual-media filters.
the wastewater flowed downward through the air stripper and was
subsequently pumped through the GAC columns.
After pH adjustment to 7 in tank T-201,
Since the Building 3544 wastewater had already been treated for
metals removal, it bypassed that step in the MPP and entered the
process directly at the air stripper for removal of volatile organics.
The removal of heavy organics and mercury was achieved in the GAC
columns, along with the remainder of the process wastewaters,
One of the 725-gal tanks (T-401) was used as a supplemental feed
tank. Wastewaters from HFIR, TRU, TURF, and Building 1505, etc., were
trucked to the MPP and pumped into tank T-401. From there, they were
transferred to the head of the process (i.e., the API separator) and
were subjected to the same steps as was the 190 pond water.

71
r r-
0
-c m
,, I"
I I
t
.- ---I___-
-
I m

72
P ...
.*

73

74
I -
75
7.4 ACTUAL OPERATING CONDITIONS
Typical flow rates at various points in the flowsheet are shown in
Fig. 17, along with the numbered sample points (e.g., S-1 ) . The total
flow of 2 gpm from the A P I separator was divided so that 1 gprn went to
the IX column and 1 gpm went successively to the R/C and the dual-media
filter.
Building 3544 wastewater before entering the air stripper. Thus, the
air stripper and the GAC columns processed feed at the rate of
~1.5 gpm.
The effluent from the filter was combined with 0.5 gpm of
In the first MPP campaign, the pH of the entering water was
adjusted to ~ 9 . 5 by using lime and soda ash. Typical flow rates used
were as follows:
water), 10 mL/min of 1.3% soda ash solutian (i.e*, 35 ppm in soda ash
after mixing with the l-gpm stream), and 20 mL/min of a 0.01% polymer
solution (for a concentration of 1 ppm).
initially used as the polyelectrolyte, subsequent jar tests indicated
that Betz 1100 was superior in flocculating the precipitates. Thus,
Betz 1100 was used throughout most of the MPP operation. campaign, only the 190 pond and Building 3544 waters were used, and
spiking with metals and organics was done one to three times per week.
In the second MPP campaign, the pH was adjusted to -10.5 by using
12 ml/min
17.4 ml/min of 2% lime solution (500 g in 25 L of
Although Purifloc A-23 was
During this
caustic alone.
of 1 p3 caustic and 5 mL/min of polymer (at a concentration of 15 g/20
L, this resulted in a polymer dosage of 1 ppm).
all of the significant process wastewaters were fed to the MPP. column was not operated because of biogrowth and pressure drop
problems, thereby decreasing the flow rates through the API separator by 50%.
with metals and organics as before.
operation, however, the metal-spiking step was omitted. This course of
action allowed the system to simulate actual NRWT plant operation.
The following typical flow rates were used:
During this campaign,
The IX
In the first half of this campaign, the waters were spiked
During the last 2 weeks of
A summary of the entries into the logbooks detailing the
operations in the MPP is presented in Appendix B.

76
ORNL DWG 86-341R
ORGANICS
DUAL-MEDIA
1.6 gpm
Pig. 17. Simplified block flow diagram of the mini-pilot plant.

77
8. MINI-PILOT PLANT RESULTS AND DISCUSSION
8.1 API SEPARATOR
The API separator never accumulated light or heavy oil phases that
were identifiable; however, a layer of biomass built up on the walls
and the floor, and the surface became covered with a greasy-looking
scum which had a distinct rigidity.
significantly. Agitation of the scum caused it to settle to the
bottom. When some of the scum was collected and acidified to a pH <2,
the resulting ICP analysis showed that the scum contained considerable amounts of metals as shown below (the values given are in ppm):
Ag - 1 A1 - 8 Ca - 120 Cd - 46 Cr - 190 CU - 140 Pe - 12 Mg - 24 MO - 3 Na - 36 Ni - 53 P - 210 Pb - 16 Sb - 6 Si - 4 Zn - 180
This layer of scum did not thicken
It appears that the scum did an excellent job of concentrating the above metals.
The need for an oil-water separator is based on observations at
the 190 weir, where large globs of black sludge entered the pool and
settled out. Droplets of light oil rose from these globs.
generally clean operation of the API separator is probably the result
of the location of the collection pump in the pool.
pilot-plant feed-pump location was such that neither phase was likely
to be collected.
handled the larger globs.
The
The practical
Further, it is doubtful that the pump could have
8 .2 REACTOR/CLARIFIER
8 . 2 - 1 Lime-Soda Softening
The API separator overflow was pumped to the rapid-mixer vessel
above the R/C.
metered into this vessel.
pH level at ~9.5; however, the lime feed was difficult to control, and
the pH fluctuated between 9 and 10.
A lime slurry and a sodium carbonate solution were
The lime feed was adjusted to maintain the
Lime addition was typically

-180 ppm, and soda ash addition was =35 ppm. The calcium carbonate
precipitation was very close to the equivalent of the added lime.
The overflow from the rapid-mix zone fell into the central
compartment of the R/C, where it was gently mixed with added polymer
(0.5 to 2 ppm). The sI.urry then flowed under the bottom edge of the
central partition and into the apex of the conical bed of carbonate
sludge . Later, the partition was sealed to the base of the cone, and the
slurry entered the sludge bed via 22 0,14-in.-diam holes drilled around
the circumference of the partition 51 in. above the rim. Of the
several modes tested, this modification provided the best distribution
into the sludge bed, Some "rat-holing" occurred even with this
distributor and led to jets of fines circulating up through the
clarifier zone.
to minimize fines carryover. The worst condition was the use of the
optimum dosage, 3 ppm of Betz 1100, as determined by the use of jar
tests. At. this dosage, the sludge blanket became a gurmny mass. The
best dosage was (1 ppm, but the system was never optimized. A
reasonably well-behaved blanket ultimately developed near the end of
the campaign while a 1-gpm recycle of liquid through the blanket was
used *
The polymer type and dosage were varied in an attempt
Liquid recycles as high as 5 gpm had been tried in an effort to
produce a fluidized sludge blanket.
decreased and was 21 gpm at the end of the lime-soda campaign.
timing of the appearance of the well-behaved sludge blanket with the
1-gpm recycle could be coincidental.
was probably an artifact of the clarifier configuration, since such
recycle is generally unnecessary. Also, about this time, the
analytical equipment ( ICP unit) came back on-line.
skowcsd that the dual-media filters had removed the fines carryover and
that the trace elements were captured in the blanket and in the filter
under all operating conditions. Thus, a sludge blanket R / C is a very
forgiving unit. However, because optimum conditions were not
established, it might be possible to greatly reduce the amount of
The recycle rate was slowly
The
Further, the need for the recycle
The ICP analyses

79
carbonate that has to be precipitated.
at worst, small.
Carbonate supersaturation w a s ,
A summary of analytical data collected is given in tables in
Appendix C, and the results are keyad to the sample points as shown in
Fig. 17.
(sample point 8) occurred on August 30, 1985, when the toxic trace
elements ranged between 70 and 110 ppb each. All of these values were
well below the allowable limits.
not known, although the lime addition record suggests that the lime
feed rate might have been low. Unfortunately, the clarifier pH was not
recorded for this date.
The only set of "high" results out of the dual-media filter
The cause of this poor performance is
8.2.2 Caustic Precipitation
The R/C was modified to a reactor-settler configuration by
overflowing the rapid-mix zone into a 10-min-residence slow-mix vessel
and from this down an overflow tube to the apex of the upright cone in
the original shell.
No interaction between new slurry and old sludge occurred. The
clarifier w a s operated at a pH of 10.5 by metering caustic solution
into the rapid-mix zone. Betz polymer at 1 ppm was also added at this
point, Very few fines were produced under these conditions. However,
a significant amount of sludge floated to the surface as flow were
suspended by attached gas bubbles.
The slurry settled into the circular vee trough.
Trace element removal was as efficient as in the R/C in the lime-
soda campaign.
problem in the small pilot-plant lines, as this occurrence could lead
to concretion in the dual-media filters, although none was observed in
the 1-month pilot-plant campaign.
Postprecipitation of calcium carbonate was a major
8 . 3 DUAL-MEDIA FILTERS
The outflow from the clarifier was filtered through dual-media
(anthracite and sand) filter beds pri.or to neutralization with sulfuric
acid. The filter beds were composed of 12 in. of anthracite OR top of
12 in. of sand. Line and control valve pressure drops led to a circuit
80
consisting of a 25-psi centrifugal pump, a level control valve, and
another 25-psi centrifugal pump.
inherent in this circuit is not anticipated in the full-scale plant.
Despite the shredding action, the filters removed all. but a f e w parts
per million of solids.
entrapment over the full depth o f the beds, The rates of pressure rise
across the filters were extremely variable. An attempt was made to
measure the pressure drop-vs-flow rate profile across a clean dual-
media filter using the pressure gages located at the inlet and outlet
of filter No. 3. The filter was operated in the downflow mode, and the
effluent was piped to the top of a tank whose elevation is above that
of the filter head.
2-2 psi.
rate :
The level of particulate milling
One visual observation indicated solids
The hydraulic head between the pressure gages was
The following pressures were recorded as functions of flow
Top Bottom Corrected bottom Filter pressure Flow pressure pressure pres sure drop
0.9 5.2 6.9 4.7 0.5 1.3 10.0 11.0 8.8 1.2 2.0 20.7 23.0 20.8 -0,1
(wig) (wig) (PSh) - (psi)
It was concluded that the pressure drop across the clean dual-media
filter bed was below the sensitivity of the pressure gages.
During the lime-soda campaign (see Table 2 4 ) , the pressure drop
across the filter remained <3 psi €or 2 to 4 d , doubled in the next 1
to 1.5 d, and then began increasing rapidly, In one case, the rise was
16 p s i in 24 h.
pressure-drop period was 1 to 3 d using two filters in parallel. The
use of two filters in parallel in this latter case was dictated by the
need t o minimize pressure drop. The rate of pressure-drop rise caused
by solids deposit-ion in the transfer lines was such that the necessary
flow through the filters could not always be maintained overnight. On
a few occasions, deposition was noted downstream of the filters.
During the caustic campaign (see Table 251, the low
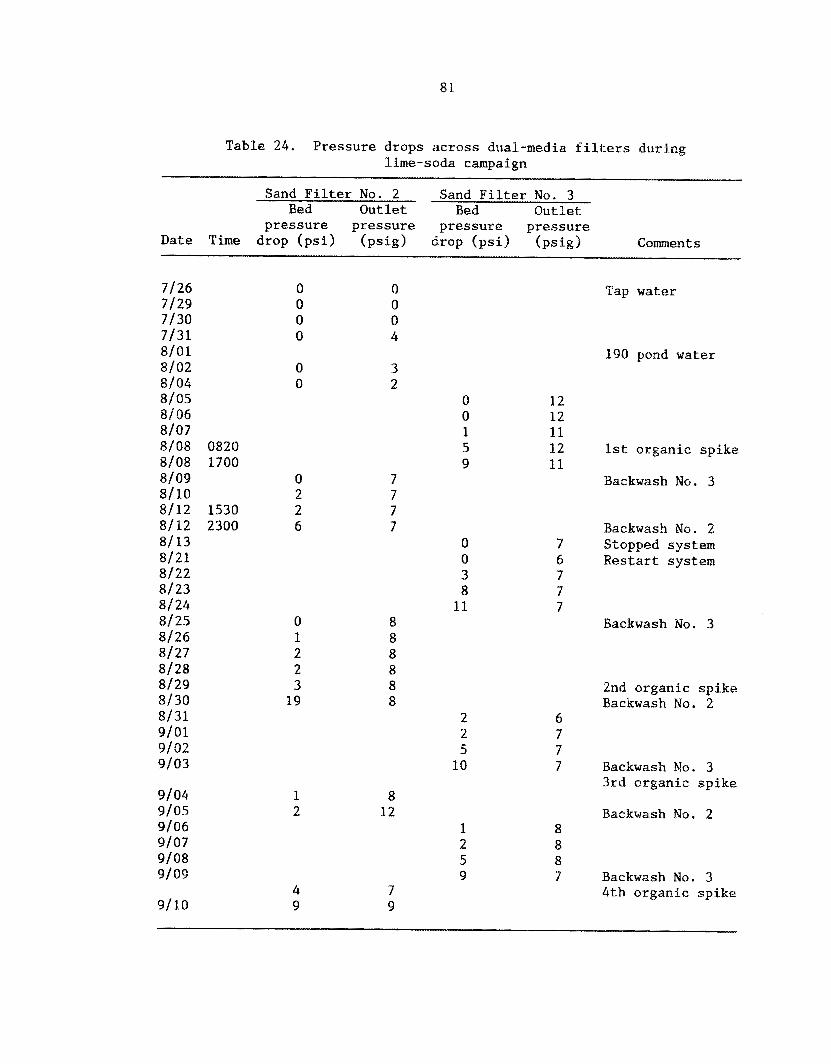
81
Table 24. Pressure drops across dual-media filters during lime-sada campaign
Sand Filter No. 2 Sand Filter No. 3 Bed Outlet Bed Outlet
pressure pressure pressure pressure Date Time drop (psi) (psig) drop (psi) (psig) Comments
7/26 0 0 7/29 0 0 7/30 0 0 7/31 0 4
8/02 0 3 8 / 0 4 0 2 8/05 8/06 8/07 8/08 0820 8/08 1700 8/09 8/10 8/12 1530 8/12 2300 8/13 8/21 8/22 8/23 8/24 8/25 8/26 8/27 8/28 8/29 8/30 8/31 9/01 9/02 9/03
8/01
9/04 9/05 9/06 9/07 9/08 9/09
9/10
0 2 2 6
0 1 2 2 3
19
0 0 3 8
11 8 8 8 8 8 8
1 2
4 9
2 2 5
10
8 12
1 2 5 9
7 9
Tap water
190 pond water
12 12 11 12 11
1st organic spike
Backwash No. 3
Backwash No. 2 Stopped system Restart system
7 6 7 7 7
Backwash No. 3
2nd organic spike Backwash No. 2
6 7 7 7 Backwash No. 3
3rd organic spike
Backwash No. 2 8 8 8 7 Backwash No. 3
4th organic s p i k e

82
Table 25. Pressure drops across dual-media filters during caustic campaign
P - Saiid Filter No. 2 Sand Filter No. 3
pressure pressure pressure pressure Bed Outlet Bed Out let
Bate Time drop (psi) (psig) drop (psi) (psig) Comenits - 101 16 10117
10118 1230 10118 10119 1100 10120 10121. 10122
10122 1210 10122 1600 10122 10/23 0845
10123 1340 10123 1440 10124 10125 10126
10127 10128 0820
10128 10129 0830
10129 1540 18/30 10/31. 0815
10131 1.500 11/01 11/02 11103 11/04
11/05 11/06 11107 11/08 0900 11/08 1500
1 8
10 3
4
1 1
3 1
9
0 0 G
1 0 1 3
1 4 2 6 0
10 8
10 11
11
12 14
1 7 16
10
8 8
10
10 12 1 7 20
9 11 14 10
9
1 4
8
3
0
0 4
5 7 2 5 9
3 3
2
0 3 7
2 3 3 2 5
2 4
1
7 8
10
9
19
10 6
12 12 14 14 14
16 16
8
8 9 9
9 10 10 15 19
9 11
9
Organic spike, purge exit. line Backwash No. 3 Purge exit line Backwash No. 2 Backwash No. 3
Organic spike, purge exit line Backwash No. 3 Purge lines
Replace 318-in. lines with 112 in.
Backwash No. 3 Backwash No. 3
Backwash Nos. 2 and 3
Organic spike, purge exit lines
Backwash Nos. 2 and 3
Organic spike, backwash Nos. 2 and 3
Backwash Nos. 2 and 3, purge lines Backwash No. 2 Backwash No. 3 Purge lines Backwash No. 2

83
Table 25 (continued)
Sand Filter No. 2 Sand Filter No. 3 Bed Outlet Bed Outlet
pressure pressure pressure pressure Date Time drop (psi) (psig) drop (psi) (psig) Comments
11/09 1 11/10 5
11/12 11/ 13 5
11/11 6
11/14 0820 >30 11/14 11/ 15
14 3 12 10 5 10 11 7 10 Backwash No. 3
2 12 Backwash No. 2 12
Backwash No. 3 2 10
11 12

84
The pressure-drop increase caused by solid deposits on the pipe
walls will be much slower in the full-scale plant. However, provision
for occasional a c i d rinsing appears to be desirable.
Some shredding of the clarifier outflow may actually be desirable
During the earlier tests using a bench scale R I G unit, the clarifier over€low dropped directly onto the dual-media surface, The largest
f l o c s were able to bridge the spaces between the granules, causing a
filter cake to build up om the bed surface. The particles cemented
together to produce a weakp brittle sheet, which did not disintegrate
during air scouring.
Coarse floc must be shredded to the point where it is trapped
throughout the depth o f the bed.
investigated.
Indeed, it did not break up readily when radded.
This aspect o f filter design was not
8 . 4 ADJUSTMENT OF pW
The 1-gpn stream e x i t i n g the dual-media filters was rneutralized in
tank T-201 using sulfuric acid.
noted that the acid consumption required to adjust the pH to 7 was in
excess of t.ha,t projected from the caustic addition to the precipitator
feed. Carbon dioxide release during recirculation in tank T-201 was
examined as a possible explanation.
During the caustic campaign, it was
A 250-mL sample of 190 pond water was raised from pB 7 to pM 10.6
The pH was then lowered to 6.0 using 7 mL using 5.9 d, of 0.1 E NaQB. of 0.1
produce a small vortex at the surface using a magnetic stirrer.
w a s allowed to rise to -7 and was then titrated back to ~ 6 . 5 . The
history of this test follows:
H C 1 at 0910 h. The sample was subsequently agitated to
The pW

85
Accumulated Time Initial pH Final pH 0.1 N H C 1 use 0910 6.0 0.0 0930 7.0 6.6 0.5 1045 7.6 6.6 2.3 1230 7.6 6.6 2.7 1309 7.1 6.5 3-2 1615 6.9 6 . 2 3.7 1659 7.1 6.7 3.9
Total acid used = 7 + 3.9 = 10.9 mL. Total base used = 5.9 mL.
It appears that bicarbonate was being replaced by chloride at pH
6.5 to 7 as the GO2 was being stripped out by the air at the surface
during stirring.
8.5 AIR STRIPPER
The air stripper s,,owed surprisingly low chloroform removal
efficiencies. Based on data in the Chemical Engineers' Handbook, 4th
ed.,l0 the NTU value for 30 in. of 5/8-in. P a l l rings is 23. Table 26
lists the chloroform levels at sample points along the process system.
Sample point S - 1 describes the 190 water entering the API separator,and
S-2 describes supplemental waters which were fed only during the last 4
weeks of operation. During these weeks, S - 1 was 0.6 gpm, and S-2 was
0.4 gpm.
API separator, S - 3 , was treated in the R/C.
The 1 gpm of water leaving the sand filter and continuing to the
This mix entered the API separator. The effluent from the
stripper is designated S - 8 , while S-9 describes the 0.5 gprn of 3544
water which was mixed with the S - 8 water. MIX is the calculated
chloroform content in the water entering the stripper, and S-10 is the
water leaving the stripper.
within the stripper is expressed as VZ/VL.
The volumetric ratio of air to water
Percent removal is the percentage reduction of the chloroform
content of MIX as a result of its transfer to the air stream.
an NTU value, the reduction may be calculated from the re1ationship:ll
Assuming

86
Table 26. Chloroform levels at various sample points in the MPP
x Date Time 59-1 S-2 S-3 S-8 S-9 MIX S-PO VG/VL removal
08/07 09/03 09/04 09/09 091 10
lo l l5
l o l l 8 10122 10123 10125 10/28 10129
10130
10131 11/01
11/05
11/06 11/07 11/07 11/08 11/08 11/08
10117
1900 1715 0830 1500 0830
32 58 6 4 282 21 236 97 29 56
1 7 14 380 144 SO 56 98 200a 225 86 26 56
8 9 232 88 10 56
new packing in stripper
1500 25 16 722 270 44 55 0900 412 13 347 133 86 55 1300 44 45 328 146 50 66 1400 10 7 424 156 38 76 1400 84 5 25 14 5 2 74 1500 59 2 36 14 523 199 55 74 1500 14 3 9 8 709 252 7 1 74
steam-stripped packing
1515 25 6 1 7 15 365 140 126 79 0900 966 2 10 10 1231 444 168 79
removed =4 in. (152) of packing, steam-stripped remainder
1500 0900 1400 0900 1300 1400
9 1610 579 203 95 8 1700 610 178 95
15 1644 594 241 95 9 1449 521 277 95 9 1644 591 260 95
10 783 285 159 95
70 65 70 89
84 35 56 76
72 7 1
10 6 2
65 7 1 59 47 56 44
aThe value assumed for the calculation of MIX is 10 ppb since no chlorform should have been present in S-8, especially not higher than the value determined at S-3.
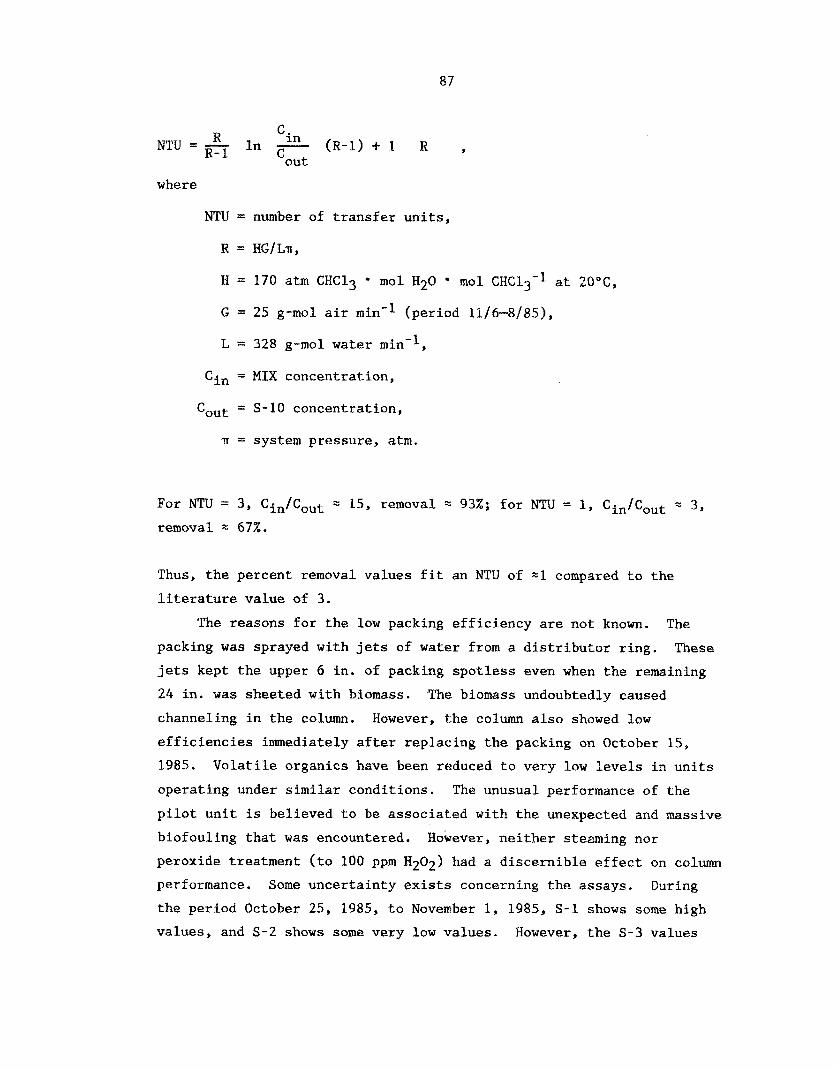
87
where
NTU = number of transfer units,
R = HG/Ln,
H = 170 atm CHC13 mol H20 mol CHC13-l at 20°C,
G = 25 g-mol air min'l (peri.od 11/6-8/85),
L = 328 g-mol water min-I,
Cin = MIX concentration,
Gout = S-10 concentration,
TI = system pressure, atm.
For NTU = 3, Cin/Cout = 15, removal = 93%; for NTU = 1, Cin/Cout = 3,
removal z 67%.
Thus, the percent removal values fit an NTU of -1 compared to the
literature value of 3.
The reasons for the low packing efficiency are not known. The
packing was sprayed with jets of water from a distributor ring.
jets kept the upper 6 in. of packing spotless even when the remaining
24 in. was sheeted with biomass.
channeling in the column. However, the column also showed low
efficiencies immediately after replacing the packing on October 15,
1985. Volatile organics have been reduced to very low levels in units
operating under similar conditions.
pilot unit is believed to be associated with the unexpected and massive
biofouling that was encountered.
peroxide treatment (to 100 ppm H202) had a discernible effect on column
performance. Some uncertainty exists concerning the assays. During
the period October 25, 1985, to November 1, 1985, S - 1 shows some high
values, and S-2 shows some very low values. However, the S-3 values
These
The biomass undoubtedly caused
The unusual performance of the
HokFever, neither steaming nor

88
are incompatible with the mix values calculated when S-1 was high.
5-3 value should be very close to S - 8 , but this was not the case on
September 3, September 9, and October 18, showing significant random
deviations can occur. However, the tests of November 6 through
November 8 show consistent levels, which should be sufficiently above any noise level to make the tests fairly reliable. These assays also
indicate low column efficiencies.
The
Batch air-stripping tests, described earlier, show that emulsified
toluene and dissolved chloroform can be air stripped to low organics
levels using gas-to-liquid volume ratios of 50 to 100. These tests are
in direct contrast to the column tests.
The column tests have shorn that biomass buildup is a major
problem and that its control is uncertain.
sources could have accounted for the biomass buildup: the use of
methanal to introduce the organic spikes, and the operation of a
biodenitrifieation column in Bldg. 4505 during the time the MPP was in
operation. Although that particular bioproject has since been
completed, it should serve to remind us that the types of operations
and experiments occurring at OWL cover a broad range and are extremely
variable.
cond it ions.
At least two possible
Thus, it will be prudent to be prepared for a wide range of
8.6 CARBON COLUMNS
8.6.1 Toxic Trace Elements
The carbon columns proved to be efficient trace element
sczavengers. Both particulate filtration and chemisorption are likely
mlechanisms; however, crediting one or the other is impossible because
the solubilities of the trace elements are not accurately known.
Except. for iron and zinc, the residual trace elements are (20 ppb. The
iron ranges from 0 to 30 ppb and is almost certainly in a particulate
or possibly colloidal form. In general, zinc ranges from 25 to 50 ppb,
which may be its solubility limit. If this is the case, then sorption
is not important for zinc.
element.
The scavenging mechanisms may vary w i t h the

89
8.6.2 Mercury Removal
The API separator effluent, S-3, ranged between 0.5 and 4.0 ppb of
The mercury concentration mercury, with an average value of 2 ppb. leaving the dual-media filters, at sample point S-8, ranges between 0.4
and 1 ppb, showing that about half of the mercury is stripped out in
the R / C system. The IX column, sample points S - 3 to 5-5, also removed
about half the input mercury from a parallel stream.
drops from 0.4 to 1.0 at S-10 to 0.1 t o 0.3 ppb at the outlet of the
first carbon column, S-11. The S-11 values are at the limits of
detection. The outlet values for the next two columnsp 5-12 and S-13,
are similar.
outlet levels (0.5 ppb.
The mercury level
The carbon beds should be able to maintain the mercury
8 .6 .3 Organics Spiking
Volatile organics were represented by chloroform, and semivolatile
and nonvolatile organics were represented by naphthalene and dibutyl
phthalate (DBP), respectively. This selection was strongly influenced
by the ease and sensitivities of the available assay procedures.
Because the phthalate ester is susceptible to hydrolysis at high pH and
because chloroform losses to the atmosphere might be high in the pilot-
plant system, these two organics were introduced just ahead of the air
stripper. The naphthalene was introduced ahead of the API separator. Because of the difficulty of dissolving these organics in water,
they were introduced as (0.1% solutions in methanol.
methanol solution and water produces, at worst, an extremely fine
emulsion of the organic in water.
chloroform, 250 ppb of naphthalene, and 40 ppb of DBP. These values
are well within the solubilities of the organics in water and well
above the reported detection limits of the assay procedures.
The mixing of the
Design goals were 300 ppb of
The feed waters, 190 pond and 3544 plant waters, normally contain
(20 ppb of chloroform and only traces of DBP and naphthalene.
likely deviation would be very short-term spikes of chloroform in the
190 waters.
The most

90
In light of the pilot-plant results, it is important to remember
that only naphthalene was introduced into the 190 water ahead of the
API separator and only chloroform and DBP were introduced into the 3544
water. Further, naphthalene was dissolved in methanol and added to the
190 feed pot, while chloroform and DBP were dissolved together in methanol and added to the 3544 feed pot. Any mix-up would have shown
all three at high levels in a given pot because of the pot recharging
procedures. Also, the concentration of naphthalene would have been
very much greater than that of DBP. No evidence of a mix-up can be
found; however, DBP and naphthalene do appear together in the assays
where they should not have (see tables in Appendix C).
The feed pot assays should be 475 ppn~ naphthalene in the 190 pot
and 40 ppg DBP plus 300 ppg chloroform in the 3544 pot.
the 1-gpm discharge from the API separator, sample point S - 3 , should be
~ 2 5 0 ppb naphthalene, with only traces of DBP and perhaps 25 ppb
chloroform. The assays of the 0.5-gpm 3544 water, S-9, should be
~ 3 0 0 ppb chloroform and 40 ppb DBP, with only traces of naphthalene.
Only chloroform should be removed in the stripper.
observed stripper efficiency, the chloroform levels in the 3544 feed
were nearly tripled near the end of the campaign in the hope that this
would override any interference that might be influencing the assay
results.
The assays of
Because of the low
The activated-carbon columns should reduce the chloroform, DBP, and naphthalene levels to below detection limits, provided these
materials are in solution.
However, some emulsions (e.g., skim milk) are not removed by activated
carbon. Whether material. adsorbed onto biosolids or other particulates
can be removed by the carbon is not known.
The same should apply to most emulsions.
A major sampling/assay problem does exist. Chloroform appears by
itself in the September assays of the 3544 feed pot at levels >100 ppm,
which is correct. However, the August and September assays show 50 to
350 ppm DBP in the 190 feed pot and only 0.1 to 5 ppm DBP in the 3544
feed pot, which is the reverse of what must be.
this time range from 1 to 100 ppm in the 190 feed pot, whereas the
values should be greater than 100 ppm. On the other hand, most of the
Naphthalene assays of
91
October and November data show negligible quantities of DBP and naphthalene in either feed pot.
8.6.4 Chloroform Removal
Practically all the chloroform entering the columns is removed in
the first bed, and probably in the first foot or so, because the beds
were only ~2 ft deep after September 15, 1985. Because the chloroform
levels were very high near the end of the program, the wave front must
be very steep to completely remove the chloroform in the first bed.
8.6.5 Naphthalene and DBP Removal Naphthalene values at S - 3 range from 30 to 100 ppb, against
projected values of 250 ppb. During the lime-soda campaign, the
naphthalene exiting the sand filters, S - 8 , was (10 ppb. During the
caustic campaign, after September 15, S-3 ranged from 20 to 100 ppb,
with one value at 480 ppb; 5-8 ran from 70 to 580 ppb.
be questioned because S - 8 levels are frequently above those of S - 3 .
The values must
The DBP numbers are even more confusing. The data for October 17,
1985, show both 5-3 and S-9 at about 40 ppb DBP. Thus, the carbon
column feed should also have been 40 ppb.
the assays along the carbon columns showed 130 to 220 ppb. Data for
October 31 through November 1 show the reverse behavior, with the DBP
disappearing in the column inlet and throughout the beds. The data for
October 23 and October 25 show no removal by the carbon beds.
the data show low, but increasing, DBP concentrations as the exit of
the carbon columns is approached.
However, the feed into and
Most of
The data are so conflicting that major flaws must exist in the
sampling and analytical techniques.
stripping tests have been noted earlier in this report.
Similar problems with the batch
8.6.6 Biogrowth in Granular Activated-Carbon Columns
Plugging of the granular activated carbon (GAC) by biogrowth was a
major operating problem. During the Pime-soda campaign, most of the
growth appeared to be confined to the upper 25% of the first of the
three columns (operated in series). No particular eEfort was made to

92
delineate the zones of high pressure drop.
relatively ineffective in reducing the pressure drop.
the upper 25% of the first column followed by water backwash was very
effective. The use of 20-pm wound polypropylene filters ahead of the
carbon beds had no noticeable effect.
Water backwash was
An air scour of
The possibility of associated postprecipitation of calcium
carbonate was considered. However, only one assay showed a calcium
decrease, in excess of the normal scatter, across the column. A l s o ,
carbonate did not appear to be a constituent in the few backwashes
examined.
Pressure drop data are presented in Table 27 for the lime-soda
campaign. For the first 5 d, the columns operated on tap water,
Jiiiy 25 to August 1, and showed no pressure drop increase. The carbon
columns were switched to plant water (190 pond) on August 1, and 3544
water was added on August 5. The first noticeable increase in pressure
drop occurred on August 7. The next day, the pressure drop was high
enough, 21 psi, to cause operating problems. Water backwash reduced
the pressure drop to 6 psi.
the overnight (August 8-9) organic spike and then increased
exponentially after the termination of the spike, reaching 33 psi at
1200 h on August 10.
The pressure drop built up slightly during
The columns were taken off-line on August 10 and brought back on-
After 4 d of line with fresh carbon in column 1 (C-301) on August 21.
operation with 190 plus 3544 water, the pressure drop became
noticeable; it doubled i n the next 48 h and almost doubled again in the
next 8 h, reaching 20 psi across column 1 at 0830 on August 28. 'The
last increase occurred despite treatment with 30 ppm hydrogen peroxide
and the introduction of a 20-wm wound polypropylene filter ahead of
column 1.
Subsequently, air scouring followed by water backwash w a s needed
on column 1 every 2 to 4 d. Note that treatment with up to 100 ppm
H202 had no noticeable effect.
of little value, and its use was discontinued on September 4 .
Further, the prefilter appeared to be
The only organics in excess of the 4 - 8 ppm TOC in the feed waters
were a few hundred parts per million of methanol for 24 h during the

93
Table 27. Pressure drops across GAC columns during lime-soda campaign
C o l m Inlet pressure pressure drop (psi) (psig) Organic
Date Time No. 1 No. 2 No. 3 spike Comment
Tap water 190 pond water 3544 water added
7/26 2 3 3
8/05 1 1 4 8/06 2 3 4 8/07 7 2 4
8/01
8/08 Start 1240 8/08 1700 21 8/09 End 1100 Backwash No. P 8/09 6 8/09 1500 10 8/09 1700 9 8/09 2050 18 8/09 2310 22 8/10 1200 33
8/21 GAC columns on-line
2 4
1 2 1 2 1 2
GAC columns off-line Bed No. 1 replaced
8/22 0 0 2 8/23 2 2 2
7 0 2 10 0 2
8/26 12 2
8/24 8/25
8/27 0830 13 0 Prefilter added,
8/27 2310 15 8/28 0830 20 1 2 Backwash No. 1 8/28 1805 2 8/29 Start 1340 8/29 1700 10 1 2 New prefilter at 2110 8/30 0830 20 1 2 Stop 1100 Backwash No. 1 at 1415 8/30 1830 100 ppm peroxide 9/01 9 0 2 New prefilter 9/02 11 1 2 New prefilter 9/03 0840 16 Backwash No. 1 9/03 1400 5 1 2 Start 1300 9/04 7 1 Stop 1245 Prefilter removed,
backwash No. 1
9/05 7 1 2 Backwash No. 1 9/06 13 0 2 Backwash No. 1
27 pplin peroxide 0 2
0 1
9/07 2 0 2 9/08 2 1 2 9/09 3 1 2 Start 1007 9/10 13 1 2 Stop 0845

94
organic spikes.
might be attributable to the methanol food supply.
effect rapidly disappeared.
Part of the rapid rise in pressure drap at this time
In any case, its
The system was shut down between September- 11 and October 16.
During this shutdown, the plant was redesigned for operation with
caustic only. The carbon columns were recharged with new carbon.
Further, the fill in each was only 332. The i n t e n t of the low fill
was, in part, to permit intense air scouring,
During the shutdown, most of the process line segments were
modified t o permit blasting out any biogrowth or precipitates with
90 psi process water.
backwash when the pressure drop became significant and thereby minimize
upsets associated with rapid pressure rises.
The new operating philosophy was to purge or
Table 28 presents the pressure drop histories of the shallow
carbon beds. The histories are similar to those of the lime-soda
campaign.
to be largely associated with the buildup of an adherent material in
the drain line. The virtually trouble-free operation during the period
between November 5 and November 15, during which waters from other
sources were added ta the 190 and 3544 waters, has not been explained.
Samples of backwash from the first GAC c o l i m measured 346 ppm TSS and
8 ppm volatile suspended solids (VSS).
The slow rise in the inlet pressure to colurm 3 is believed
Measurements of pressure drop vs flow rate were made on the empty
e o l m s and shallow beds prior to restarting the MPP.
located at mid-elevation on the inlet lines to every column. A s can be
seen in Table 29, the pressure drops are essentially the s a m e with and
without carbon. A s was the case with the dual-media filters, the
clean-carbon-bed pressure drops were below the sensitivity af the
pressure gages.
Gages were
8*6 .7 Radionuclide Accumulation
At the end of the lime-soda campaign, the carbon was removed from
the three GAC columns and stored in two 55-gal drums. Samples removed
from each drum were sent to ACD f o r radionuclide analysis, with the
results listed in Table 38. The first saniple (B-1685) was from the

95
Table 28. Pressure drops across 33%-full GAC columns during caustic campaign
Column Inlet pressure pressure drop ( p s i ) ( p s i g ) Organic
Rate Time No. 1 No. 2 No. 3 spike Comment
10116 10/17 lo/ 18 10/19 10/20 10121 10/22 1220 10123 10/24 10/25 10/26 10127 10128 10/29 0815 10/30 10/31 11/01
11/02 11/03 11/04
11 105 11/06
11/08 11/07
11/09 11/10 11/11 11/12 11/13 11/14 11/15
1 1 4 6 0 2 4 5 0 1 1 1 1 6 0 0 3
0 1 1
0 0 1 1 0 1 0 0 0 0 1
0 0 0 1 1 0 1 1 0 0 1 1 1 0 2 1 4
1 2 2
0 0 0 0 0 0 0 0 0 0 0
2 2 1 2 2 3 3 4 2 3 4 4 5 6 4 5 12
4 8 10
5 S 5 7 9 8 8 8 8 9 9
Start 0935 Stop 0910
Backwash No. 1
Start 1235 Stop 1430 Backwash No. 1
Start supplemental feed
Start 0945 Stop 1010 Backwash No. 1
Start 1040 Stop 0940 Backwash Nos. 1, 2,
and 3
Backwash Nos. 1, 2, and 3, purge lines
Start 09 30
Stop 1300
Start 1500 Stop 1400
Backwash Nos. 1, 2, and 3

96
Table 29. Pressure drops across empty and 33Z-fu11 GAC c o l m n s
0.6
1.5
2.4
3.5
0.6
1.5
2 . 4
3 . 2
Empty c o l m s
3 3
4 5
11 9
20.5 17
Charged c o l m s
3 2
6 5
12 9.5
22 15
2
3.5
6
10
2
2.5
6
9

97
Table 30. Radionuclide analyses on spent GAGa
Radionuclide (Bq/kg) B- 16Sb B-1686" B-168gd 3-169Oe B-1691f
Gross a
Gross f3
6Oco
75Se
I. 3Ru
lo6Ru
137cs
152Eu
154Eu
155Eu
4,200
11,000
4,400
320
1 , 400
3,300
840
470
460 3,800
2 , 900 65,000
260 76,000
600
130
6,200
2,600 2,900
130 5,200
55 2,600
420
2,200
36 , 000 41 , 000
200
3,300
2,100
3,500
1,700
1,400
22,000
25,000
90
1,500
2,608
2,100
1,400
aA blank entry indicates that the radionuclide was not detected.
bSample from drum containing primarily contents of the first GAG column.
CSample from drum containing primarily contents of the third GAG colm.
dSample from first GAC column taken at end of MPP work.
eSample from second GAG column taken at end of MPP work.
fSample from third GAG column taken at end of MPP work.

98
dr-urn containing primarily the contents of the first GAG column, while
the second sample (B-1686) is more representative of the contents of
the third column.
passed through the GAC colunws during the lime-soda campaign.
from each of the three GAC columns were again taken at the end of the
MPP w ~ r k , Samples B-1689, B-1690, and B-1691 were taken from GAG
columns 1, 2, and 3, respectively. These carbon samples had been
exposed to all of the waters that will be treated in the NRWT plant.
The results of the radionuclide analysis are also shown in Table 30.
It is apparent that the spent carbon from the GAC colunwns af the NRWT plant will likely require special handling and disposal.
It should be noted that only 190 and 3544 waters
Samples
8.7 TIBE ION-ICXCEIWNGE SYSTE3
8.7.1 Hydraulic Life
The ion-exchange (IX) column was fed 190 pond waters, which had
been filtered through a dual-media filter (SF No. 1) and then acidified
to pH 4 .7 to 5.0 in tank T-301 us ing HaSO4.
continuously and was periodically subjected to the same trace element
s p i k e s that were introduced into the R / C circuit.
was not subjected to the organic spikes (except for naphthalene).
The column was on-line 240 d before t h e p re s su re drop became
The column operated
However, the coliunn
excessive.
Bioniass formed in tank 'T-301 and periodically fouled the lines between
it and the IX column and jammed the rotameter, FI-301, which indicated
the flow into the I X column.
the ran, the line between T-301 and the TX co:umn had t o be replaced
because of unpurgeable slime buildup.
The pressure drop appears to be the result of biogrowth.
About three quarters of the way through
The column was opened a€ter =35 d o f 190 water treatment. Biomass
hung in sheets down the 8-in. tube wall, and a layer of slime covered
the bed surface. The t o p 0.5 in. of r e s i n was connected together and
broke up, on rodding, like a fragile, b r i t t l e solid. In the upper
6 in., the beads were covered with a black film, and the interstices
were at least partially filled with biamass. Stirring with a steel rod

99
suggested that, below the 6-in. level, the resin was not bonded and
flowed readily; top-to-bottom mixing was avoided during this stirring.
The pressure drop across the column developed slowly over the
40-d operating period.
the slime had little effect on the pressure drop.
column was attempted after a 1-month shutdown, the pressure drop went
out of control after 2 d.
the month of anaerobic storage might have been responsible for this
rapid "plugging. I '
Breakup of the top layer at 35 d and removal oi
When restart of the
Changes in the biomass within the bed during
8 . 7 . 2 Ion-Exchange Column Performance
The IX column, at an inlet pH between 4.5 and 5, controlled the
trace elements (see Table 31) during its life, which was determined by
biomass buildup rather than bed saturation. There is no question that
the resin efficiently removed Cd, Ni, Pb, and Zn. It may have been
losing some of its capacity for cadmium toward the end of the run. It
appears to be removing Cu, Cr, and Pe, but so much of these elements
was removed by the dual-media filter that the resin efficiencies are
hard to judge. The lone high chromium value, occurring August 27, may
be in error because the feed concentration was only a third of the
effluent concentration, and the earlier sample of this date showed low
inlet values.
The IX system should be a practical means of controlling trace
element spills providing it is placed on-line only during the periods
of high metal levels. Biomass plugging prohibits continuous operation.
8.8 PRECIPITATOR SLUDGE
Sludge was removed from the MPP precipitator on three occasions for radionuclide analysis and the EP Toxicity test: (1) after
centrifugation following the lime-soda campaign, ( 2 ) after centrifugation following the first half of the caustic campaign in
which the 190 feed water was spiked with metals, and ( 3 ) after
dewatering in the Engineering-Science filter press from the second half
of the caustic campaign in which no metal spikes were added.

Table 31. ICP resuits fron the MfP around t ha IX coPurnna
Sample Sample §pike point No. ca Mg Cd Cr hr Fe Ni Pb Zn PH Date Time On?
s-4 s-5 S-3
s-3.5
s-4
s-5 s-3
§ - 3 . 5 S-4
s-5
s-3 s-4
S-5
s-3
S-4
s-5 s-3
s-3.5 s-4
s-5 s-3
s-4
s-5
B-0876
B-0886
B-0877
B-0887
B-0901
B-oam B-0902
B-0903 B-0904
B-0905
B-0936
~ - 0 9 ~
B-0919
B-0928
B-0930
B-0931
B-1261
B- 1262
B-1263
B- 1264 B-1294
B-1296
3-1297
33
32
32
31
30
32
29 31 32
32
31
29
28
31
30
30
30
35
31
30
32
35
34
a 7 7
7
7
7
7
7 7
7 7
7 7
5 7
7
8
4
3
8
9 9
9
1
1 480 340
110 21
500 400 I70
36
590
350 60
650
400
6 3
47 0
460
270 1
7 1 320
2
6
9
650 27
33
23 490
10
27
1 7
7 10
15 1s
7 50
40
121 440 170
150
14
250
210
22
7 1
6 930
84
73
19
640 46
64
1 7
970
51 11
950
90
18
550
230
190
5
350
270
7
95
130
280
28
22
26
130 19 24
20 140
37
28
180 18
21
120
82
65
47 130
84
16
12
31 5 10 340
180
40
500 410 230
40
580 350
59 630
390
56 490
570
360
0
7 1
380
0
34
0 660
70
62
0 550
56
56 0
750
93
0
790
130
0 480
170
140
0 240
2 10
0
91
14 810
230
160
55
610 120 140
40
900 110
29 9 10
150
29
690
320
240
12 430 330
I6
4.8
4.8 6.9
0.0
0.0
0.0
0.0
0.0 0.0
0.0
7.2 0.0
0.0
7.2
0.0
0.0 6.9
6.7
4.0
5.2
7.4
3.7
5.3
1000
1000
1800 iaoo 1800 1800
2200
2200
2200 2200
0900
0900
0900
1215 1215
I215
1500 1500
1500
1500 0900
1840 1840
N N Y Y Y Y Y Y Y v P
Y 0
Y Y Y Y Y Y Y Y I! Y Y '*'
0
aValues for calcium andl magnesium are expressed in ppm; other values are in ppb.

101
Prior to centrifugation, the slurries were typically -1% solids;
afterwards, they were -10% solids.
filter press ran -20% solids after being pressed for 1 h.
was still exiting the press at the end of this time, a higher solids
content could have been obtained if the press time had been extended.
A total of 3.6 ga l of sludge was produced during the second half of the
caustic campaign without the addition of metal spikes to the 190 water.
During this time, a total of 16,100 gal flowed through the
precipitator, giving a sludge production rate of 22 x l oq5 gal sludge per gal of water treated.
The caustic slurry dewatered in the
Since water
The analytical results, given in Tables 32 to 34, show that all
three sludges contained radionuclides, especially that formed from the
treatment of all of the major streams required for treatment by the
NRWT plant. The most likely treatment scheme, that of using caustic
and polymer, did not produce an EP Toxic sludge when treating the
unspiked waters. Thus, the NRWT plant will likely produce a
nonhazardous, radioactive sludge. Provisions will have to be made both
for the dewatering of this sludge and its disposal.
8 . 9 MISCELLANEOUS RESULTS
8.9.1 Arsenic and Selenium
Samples were taken for AA analysis on five occasions during operation of the MPP (8/7, 8 / 1 4 , 8/26, 10/25, and 11/14) at the
following sample points: S-3 , 5-4, S-5, 5-8, S-9, S-10, and 5-13. I n
all cases, the arsenic and selenium concentrations were below the
detection limits of 2 ppb for arsenic and 5 ppb for selenium.
8 . 9 . 2 Total Suspended Solids (TSS)
Typical TSS were as follows:
s-7 24 ppm (exit of precipitator/clarif ier)
S-8 14 ppm (exit of dual-media filter)
S-13 9 ppm (exit of third GAC column).

102
Table 32. Centrifuged precipitator sludge from the lime-soda campaign
E?? Toxicity test
El@[email protected] A3 AS Ba Cd Cr Pb H% Se
Measured, ppm (0.8 <1.1 0 .4 3.8 <0.4 ( 2 . 2 0.001 <2 .2
Limit, ppm 5 5 100 1 5 5 0.2 1
Corrosivity: No Ignitability: No Sulfides: 0.02 mg/E CN/Liq: 0.070 mg/L CN/Solid: 11.6 Mg/g
Radionuclides, B&
8500 gross p, 518
290 I3’Cs
70 1910,
11 60Co
9900 gross a.
Alpha analysis, Bq/kg: 1500 238U
700 234U
150 235U

103
Table 33. Centrifuged precipitator sludge from the caustic campaign with metal spikes
EP Toxicity test
Element Ag As Ba Cd Cr Pb H?J Se
Measured, ppm 0.05 (0.1 0.8 8.1 0.14 <0.2 (0.2
Limit, ppm 5 5 100 1 5 5 0.2 1
Pesticide Endrin Lindane Methoxychlor Toxaphene 2,4-D Silvex
Measured, ppb (0.2 <2 (8 <5 (10 (10
Limit, ppb 20 400 10000 500 10000 1000
Corrosivity: No Ignitability: No Sulfides: 61 mg/L CN/Solid: 3 . 7 pg/g
Radionuclides, Bq/kg
6100 gross a
2600 gross p
1700 6oCo
940 137C.s
100 54Mn
46 15*Eu
3 3 lS4Eu

104
Tab1.e 34, Dewatered precipitator sludge from the caustic cmpaign with no metal spikes
EP Taxicity test
Element A8 As Ba Cd cr Pb JMg Se
Measuredg ppm (0.05 < Q . 1 0.2 (0.005 ( 0 . 0 4 <0.2 ((2.3
Limit, ppm 5 5 LOO 1 5 5 0.2 1
Pesticide Endrin Lindane Methoxychlor Toxaphene 2,4-D Silvex
Measurad, ppb <0,2 (2 <8 <S (10 <10
500 10000 1000 Limit, pph 20 400 1000O
Corrosivity: No Ignitability: No Sulfides: 145 mg/L CN/Solid: 0.25 pg/$ S2': 160 Hg/g
Radionuclides , Bq/k$ 7,500 gross a
510,000 gross p
85,000 6 o C ~
19,000 137cs
2,500 152Eu
2,300 154Eu
410 lS5Eu

105
8.9.3 Total Dissolved Solids (TDS)
Typical TDS were as follows:
s-7 270 ppm
s-8 385 ppm
S-13 315 ppm
8 . 9 . 4 Total Organic Carbon (TOC)
Typical TOC analyses were as fallows:
s-3 7 ppm (exit of API separator) s- 10 5 ppm (exit chf air stripper)
S-13 3 PPm
8.9.5 Biological Oxygen Demand (BOD)
One set of measurements taken near the end of the MPP operations yielded the following BOD results:
s-3 10 PPm s-10 <5 PPm
S-13 <5 PPm
8.9.6 Biotoxicity Test
During the last week of MPP operation, final effluent from the NPP
was sampled and subjected to two different acute bioassays: one used as
an endpoint 24-h survival of fathead minnow larvae, Pimephales
promelas, and the other used as an endpoint 24-h survival of the
microcrustacean, Ceriodaphnia dubia/affinis. In the first test, all
minnow larvae survived in all dilutions: lo%, 50%, and 100% full-
strength effluent. Two replicates were run at each concentration, and
6 larvae were used per replicate. In the second test, all Ceriodaphnia
survived in all dilutions: 1%, lo%, 25X, 50%, and 100% full-strength
effluent. Ten replicates were run at each concentration, and one
animal was used per replicate.
These results indicate that the sample was not acutely toxic ts
either fathead minnow larvae or Ceriodaphnia. It should be noted,
however, that it is difficult to estimate chronic toxicity by
extrapolating from results obtained using only 24-h acute tests.

106
The treatability work described herein resulted in running the MPP
in two campaigns. En each, the goal of reducing the trace elements
below the likely NPDES permit values was reached, as can be seen in Pigs. 18 to 20. Thus, the flowsheet tested in the MPP should have no
trouble in producing process wastewater that meets a l l applicable
regulations. This flowsheet includes the following unit operations:
oil/water separation, chemical precipitation, dual-media filtration, pH
adjustment, air stripping, and granular activated carbon.
The removal efficiency of organics was less well demonstrated.
Anomalous results indicate that problems exist in the collection,
preparation, and analysis for very low organic concentrations.
However, if biogrowth can be controlled in the NRWT plant, it is
expected that air stripping will remove the volatile organics, while
the GAC columns will remove any residual organics and a lso remove any
mercury present.
The sludges from either lime-soda or caustic trsatment should be
nonhazardous (as determined by the EP Toxicity Test).
showed only cadmium exceeding the limits during the metal-spiking
campaign.
period near the end of the program showed values far below the
allowable limits. Since that period should be representative of the
actual NRWT plant operations, the sludge produced in the plant should be nonhazardous.
spent carbon removed from the GAC column will have to be handled as
1.0~-level radioactive wastes.
Both treatments
The caustic sludge produced during the organics-only spiking
Both the sludge produced in the precipitator and the

ORNL D W G 86-521
s-3 5-7 s--8 S - I O s--13 SAMPLE POIh'T
Fig. 18. Metals removal in the mini-pilot p l a n t using lime precipitation.

108
b
0
ul 3
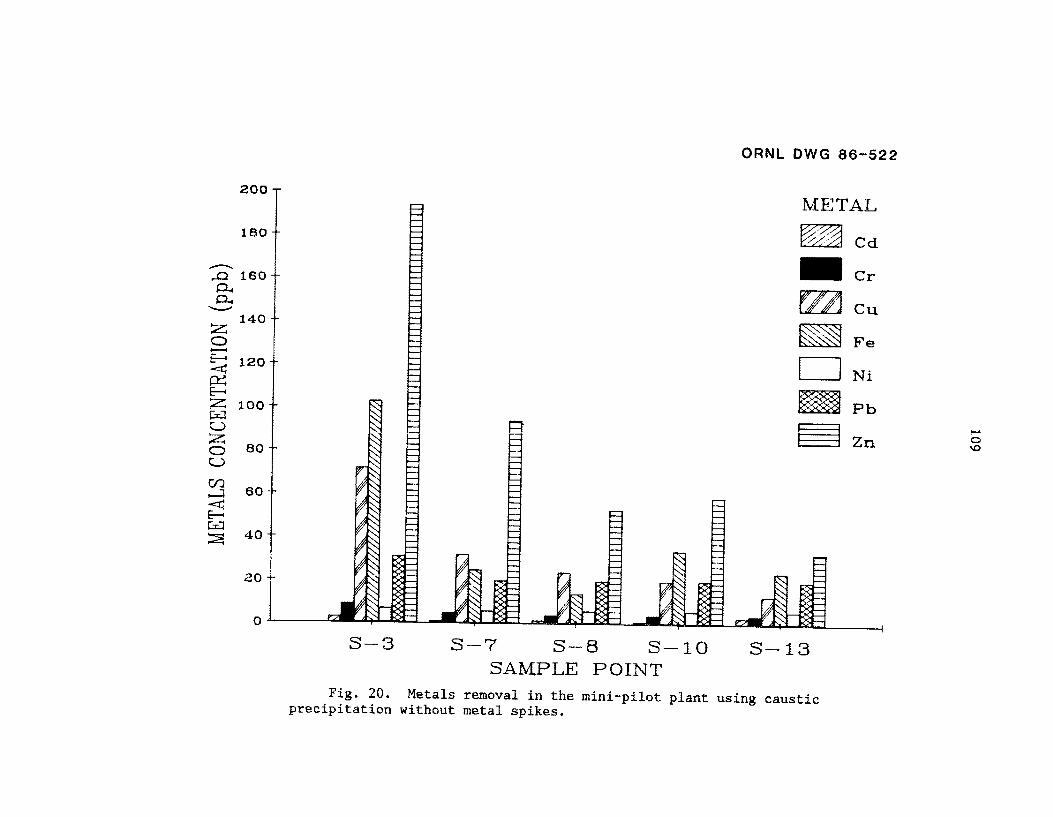
ORNL D W G 86-522
20c
180 - 9 160 pc c4
W 140
120
100
80
60
40
20
METAL
Cd
m cu Fe
N i
0
S-13 5-3 S--7 S--8 s-10 SAMPLE POINT
Fig. 20. Metals removal in the mini-pilot plant using caustic precipitation without metal spikes.


111
ACKNOWLEDGMENTS
This work was sponsored by the Environmental Restoration and
Facilities Upgrade program.
ERFU Project Manager, B. D. Patton, was very much appreciated. Similarly, the principal engineer for the NRWTP, W. T. Thompson, provided invaluable guidance and assistance. A number of helpful discussions and meetings were held with the A/E, Engineering-Science of
Atlanta, Georgia, particularly with E. H. Snider and G. C. Patrick. N. W. Kingham of their staff performed most of the jar tests, along with the column settling tests and the sludge dewatering tests.
The support and encouragement given by the
A number of other people provided the bulk of the work that went
into the treatability study. Technicians J. D. Hewitt and D. R .
McTaggart were primarily responsible for the operation of the MPP, with
assistance from D. W. DePaoli, G. B. Dinsmore, H. L. Jennings, and W. H. Woodruff. In the Analytical Chemistry Division, J. E. Caton and
his staff provided the EP Toxicity tests and organic analyses; Ferguson and her staff provided the Hg, A s , and Se analyses; T. G. Scott and his staff provided the radionuclide analyses; and J. H. Stewart and his staff provided the ICP, ammonia, and nitrate analyses.
The quick turnaround for mercury and ICP results was especially
helpful.
N. M.


1.13
10. REFERENCES
1.
2.
3.
4 .
5.
6.
7.
8.
9.
10.
11.
Conceptual Design Report f o r Monradiological Wastewater Treatment Project, Document No. X-OE-293, Martin Marietta Energy Systems, Inc., Engineering, May 3, 1985.
Design Criteria €or Nonradiological Wastewater Treatment Project, Document No. X-OE-299, Martin Marietta Energy Systems, Inc., Engineering, July 15, 1985.
J. F. Walker and C. H. Brown, Jr., Scouting Treatability Studies Performed in Support of the Nonradiological Wastewater Treatment Facility Feasibility Study, OWi/TN-9667, A p r i l 1986,
National Pollutant Discharge Elimination System Permit No. TN0002941, Pt. I, pp. 1-38-I-41.
EPA Treatability Manual, Vol. 111, EPA-600/2-82-00PC, Environmental Protection Agency, September 1981.
R. C. Weast, ed., CRC Handbook of Chemistry and Physics, 55th e d . , CRC Press, Cleveland, Ohio, 1974-1975.
J. A . Dean, ed,, Lange's Handbook of Chemistry, 12th ed., McGraw-Hill, New York, 1979.
K. F. Cherry, Plating Waste Treatment, Ann Arbor Science Publishers, Ann Arbor, Michigan, 1982, p a 49.
EPA Summary Report: Metal Finishing Industry - Sulfide Precipitation, EPA-625/8-80-003, Environmental Protection Agency, April 1980.
Control and Treatment Technology f o r the
R . H. Perry, C. H. Chilton, and S. D. Kirkpatrick, e d s . , Chemical Engineers' Handbook, 4th ed., McGraw-Hill, New York, 1963, pp. 18-36.
W. P. Ball, M. D. Jones, and M. S . Kavanaugh, "Mass Transfer of Volatile Organic Compounds in Pazked Tower Aeratim," J. Water Pollut. Control Fed. 56 (21, 127-36 (1984).


APPENDIX A . RESULTS OF JAR TESTS


Table A . l . Jar test set 1 - sodium hydroxidea,b>c Sludge
Sample ICP concentratio b Filtered TSS volume No. ~g Cd Cr Cu Fe nN? ;b Zn (Y/N) (PPm) (a) Comments
A-07b5 A-0746
A-0747 A-0748
A-0749 A-0750
A-0751 A-0752
A-0753 A-0754
A-0755 A-9756
A-0757 A-0f58
7
720 490
750 470
410 300
430 51
61 (5 12
41
72 41 63
390 430 51
580 630 97
110 130
260 280 42 2 1
41 9 13 55
31
850 7 30
850 680
580 480
460 70
(6
84 75
430 460 39
540 650 28
230 140
370 300
35 42 66
310 79 230
M Y
N Y
N Y
N Y
N Y
N Y
N Y
14 190 water, no spike
3 (1 Blank
3 (1 pH adj to 8 using
4 (1 pH adj to 9 using
4 (1 pH adj to 10 using
9 1 pH adj to 11 using
9 1 pH adj to 12 using
caustic
caustic
caustic
caustic
caustic
Detection 50 5 40 20 30 60 200 20 limits
Y-12 BAT 240 260 120 500 1600 170 210 660 limits
$H was adjusted using NaOH.
bA blank entry indicates the value was below the detectable limit.
%etals spike did not contain s i lver .

Table A.2. Jar test set 2 - lhe and soda ashapbpc Sludge
ICP concentration (DDb) Filtered TSS volume Sample NO. Ag Cd Cr Cu Fe Ni Pb Zn (Y/N) (ppm) (6) conanents
A-0759 A-0760
A-0761 A-0762
A-0763 A-0764
A-0765 A-0766
A-0767 A-0768
A-0769 A-0770
A-0771 A-0772
Y-12 BAT limits
270 670 440 470 87 780 480 610 IN 75 440 680 36 Y
130 260 110 120 270 150 N 17 110 10 6 22 83 64 13 Y
72 36 N 6 8 10 4 25 (6 48 14 Y
110 280 48 44 360 95 N 63 170 160 Y
69 29 N (5 7 8 4 10 7 37 10 Y
110 320 79 7t 440 130 N 59 210 250 Y
69 54 44 74 42 N 7 Y
240 260 120 500 1600 170 210 660
19 pH adj to 8.5 using lime
19 3 pH adj to 10 using lime
28 6.5 pH adj to 11.5 using lime
66 (1 50 ppm soda ash, pH adj to 10 using lime
24 3 50 ppm soda ash,.pH adj to 11.5 wmg lime
33 (1 100 ppm soda ash, p!
0 10 100 ppm 5oda ash? pH
adj to 10 using lune
adj to 11.5 usmg lime
Detection 50 5 40 20 30 60 200 20 limits
%H was adjusted using lime.
bA blank entry indicates the value was below the detectable limit.
O ~ S S of influent = 14 ppm.

Table A.3. Jar test set 3 - sulfuric acid and limeapb Sludge
Sample ICP concentration (mb) Filtered TSS volume No. Ag Cd Cr Cu Fe Ni Pb Zn (Y/N) (ppm) (A) Cments
A-0791 280 760 330 310 42 840 420 530 N 1 (1 Blank with A-0792 67 660 810 310 Y spike
A-0793 170 450 400 430 190 490 370 470 N 15 2.5 pH 4, then A-0794 55 110 140 Y pH 9.5
A-0795 110 110 100 100 31 110 110 N 12 4 pH 4 , then A-0796 (10 15 10 (4 19 (12 (40 13 Y pH 11
A-0797 81 130 53 54 210 54 N 0 2 pH 3, then A-0798 72 97 25 160 Y pH 9.5
A-0799 85 84 71 67 77 86 N 12 4 pH 3, then A-0800 18 Y pH 11
A-OS01 35 36 100 N 1 A-0802 9 36 100 Y
190 water, no spike
Detection SO 5 40 20 30 60 200 20 limits
Y-12 BAT 240 260 120 500 1600 170 210 660 limits
%€i was adjusted using sulfuric acid and lime
bA blank entry indicates the value was below the detectable limit
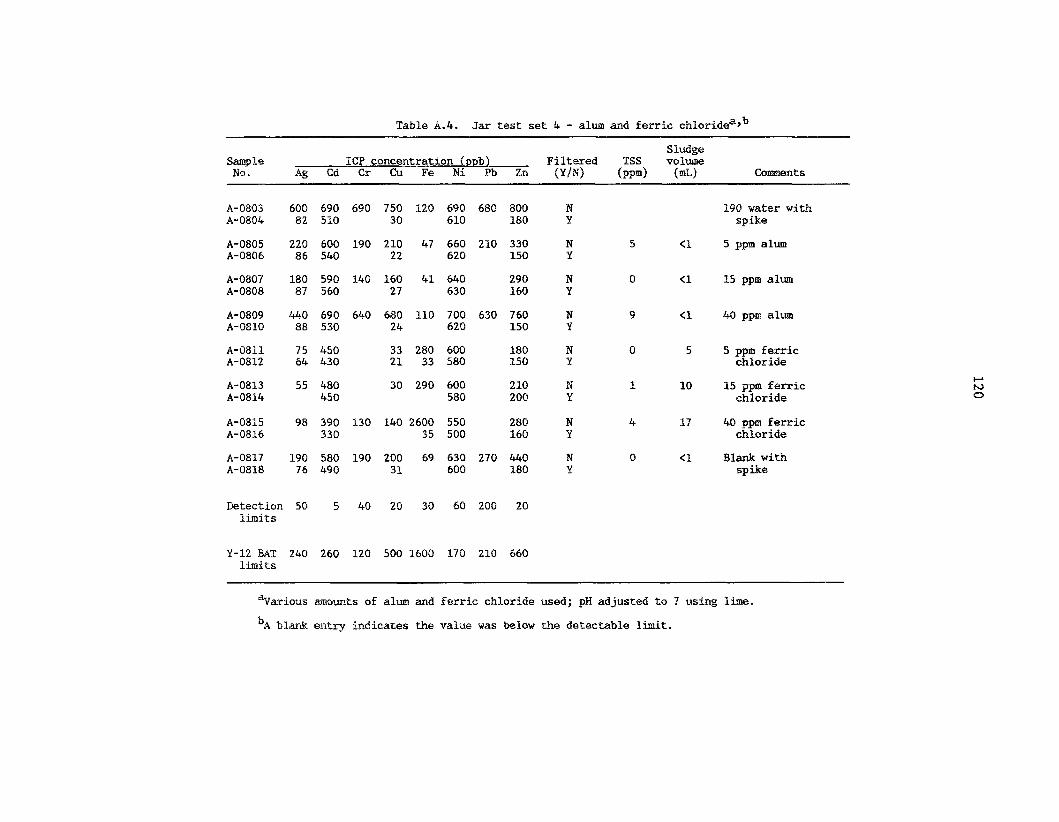
Table A.4. Jar test set 4 - alum and ferr ic chloridea*b
Sludge S q 1 e ICP concentration (pvb) F i l t e r e d TSS volume No. Ag Cd Cs Cu Fe Ni Pb Zn (Y/N) ( p p ) (mL) Comnts
A-0803 A-0804
A-0805 A-0806
A-0807 A-0808
A-0809 A-0810
A-0811 A-OB12
A-0813 8-0814
A-0815 A-OB16
A-0817 A-0818
600 690 82 510
220 600 86 540
180 590 87 560
440 640 88 530
75 450 64 430
55 480 450
98 390 330
190 580 76 490
690 750 120 30
190 210 47 22
140 160 41 27
640 680 110 24
33 280 21 33
30 290
130 140 2600 35
190 200 69 31
690 680 800 610 180
660 210 330 620 150
640 290 630 160
700 630 760 620 150
600 180 580 150
600 210 580 200
550 280 500 160
630 270 440 600 180
Detection 50 5 40 20 30 60 200 20 limits
Y-12 BAT 240 260 120 500 1600 170 210 660 limits
N Y
N 5 (1 Y
N 0 (1 Y
N 9 <P Y
N 0 5 P
M 1 10 Y
N 4 17 Y
N 0 (1 Y
198 water w i t h spike
5 pgm alum
15 ppm alum
bo ppm aPUm
5 ppm chloride ferr ic
15 ppm ferric chloride
40 pppm ferr ic chloride
Blank w i t h spike
~~
aVarious amounts of alum and ferric chloride used; pH adjusted to 7 rasing lime.
bA blank entry indicates the value w a s below the detectable P h i t .

Table A.5. Jar test set 5 - sodium borohydrideapbsc Sludge
Sample ICP concentration (DDb) Filtered TSS volume No. Ag Cd Cr Cu Fe Ni Pb Zn (Y/N) (ppm) (d) Comments
A-0819 A-0820
A-0821 A-0822
A-0823 A-0824
A-0825 A-0826
A-0827 A-0828
A-0829 A-08830
340 770 8 7 590
120 590 100 620
120 75
100 (5 61
97 (5 63
94 80
690 760 110 780 38 690
75 100 690 37 740
58 67 62
41 57 60 4 6 1 2 7
47 4 6 42 11
31
700 800 N 160 Y
220 N 180 Y
63 N Y
66 N 37 9 Y
47 PI 38 22 Y
44 N 35 Y
Detection 50 5 40 20 30 60 200 20 limits
Y-12 BAT 240 260 120 500 1600 170 210 660 limits
190 water with spike
spike
with lime
0 (1 Blank with
2 3 pH adj to 10
5 4 pH adj to 10
2 5 50 ppm soda ash, pH
1 5 100 ppm soda ash, p M
with lime
adj to 10 with llme
adj to 10 with lune
ppm of sodium borohydride with 1 h reaction time used in each test except the blank and 190 Yater.
bpH adjusted to 10 with lime.
‘A blank entry indicates the value was below the detectable limit.

Table A.6. Jar test set 6 - sdim ~ulfite~,~
Sludge Sample ICP concentration Ipnb) A4 Filtered TSS volume No. Ag Cd C r Cu Fe Ni Pb Zn Hg (YJN) ( p p ) (dl Oonaoents
A-0834 A-0835
A-0836 A-0837
A-0838 8-0839
8-0840 A-0841
A-0842 A-0843
A-0844 ~-0845
A-0846 A-0847
A-0848 A-0849
A-0850 A-OB51
A-0852 A-0853
8
690 790 65 660
140 680 56 640
310 710 73 670
130 640 100 580
400 630 300 230
740 710 710 660
930 680 930 660
900 270 830 200
660 45 580 15
77 59 74 31
790 860 146, 790 790 27 7 40
140 150 40 750 230 21 7 10
136 140 44 750 230 26 720
130 130 33 740 250 22 7 10
540 590 120 620 540 160
130 150 33 750 240 38 690
120 i30 46 750 240 30 710
36 200 23 70
28 160
200 2 10
990 320
4.40 310
480 370
330 180
7 10
5w 395
400 216)
89 22
91 28
N Y
1.2 N 0.6 Y
M Y
0.8 N 0.5 P
0.9 El 0.9 Y
1.2 N 1.0 Y
1.1 w 1 . 3 Y
1.0 ls 1.8 Y
1.2 M 2.8 Y
1.1 bj 0.7 Y
Detection 50 5 40 20 30 60 200 20 0.1 limits
Y-12 BAT 240 260 120 500 1600 170 210 660 3.5 limits
21
21
0
0
1
5
4
7
l J
a3
190 water, no
190 water w i t h
spike
w* Blank w i t h
s p i k e
pH 7 10 ppm sulfite,
10 ppm sulfite,
10 pgm sulfite,
pH 8.5
pH 10
pH 7 50 p sulfite,
50 ppm sulfite,
50 p sulfite,
pH 8.5
pH 30
IO PQm sulfite? pf3 ad j to 10 using 1% and 50 ppm soda ash

Table A.7. Jar test set 7 - polymer screening testsapb Sludge
Sample ICP concentration (Dab) Filtered TSS volume No. Ag Cd Cr Cu Fe Ni Pb Zn (Y/N) (ppm) (I&) Comments
A-0900 A-0901
A-0902 A-0903
A-0904 A-0905
A-0906 A-0907
A-0908 A-0909
A-0910 A-0911
A-0912 A-0913
A-0914 A-0915
100 510 420
270 720 51 630
55 98 27
46 17
94 21
170 23
360 870 7 10
200 70
110 130 92 660 250 190 29 33 610 45
450 510 120 730 810 600 27 710 130
35 30 190 52 32
27 74 26 37
45 48 48 140 97 31
57 50 31 220 99
53 65 39 180 89 23
Detection 50 5 40 20 30 60 200 20 limits
Y-12 BAT 240 260 120 500 1600 170 210 660 limits
N Y
N Y
N Y
N Y
N Y
N Y
N Y
N Y
6 2.1 4 ppm Percol 726, pH adj to 9 using caustic
190 water with 1 ppm metals spike
8 2 4 ppm Percol 726, pH adj to 11 using lime
3 ppm Percol 727, pH adj t o 11 using lime
3 ppm Percol 728, pH adj t o 11 using lime
3 ppm Percol 757, pH adj to 11 using lime
New 190 water with 1 ppm metals spike
and 50 ppm soda ash
and 50 pprn soda ash
and 50 ppm soda ash
and 50 ppm soda ash
7 3
12 2.5
11 4
11
25 5 2 ppm Betz 1100, pH adj to 11 using caustic
apolymer screening tests: Percol 726 is a high MW, high charge, anionic polymer. Percol 727 is a very high MW, medium charge, anionic polymer. Percol 728 is a high MW, medium charge, cationic polymer. Percol 757 is a high MM, high charge, cationic polymer. Betz 1100 is a high filw, weak charge, anionic polymer.
bA blank entry indicates the value was below the detectable l i m i t .
+ N w
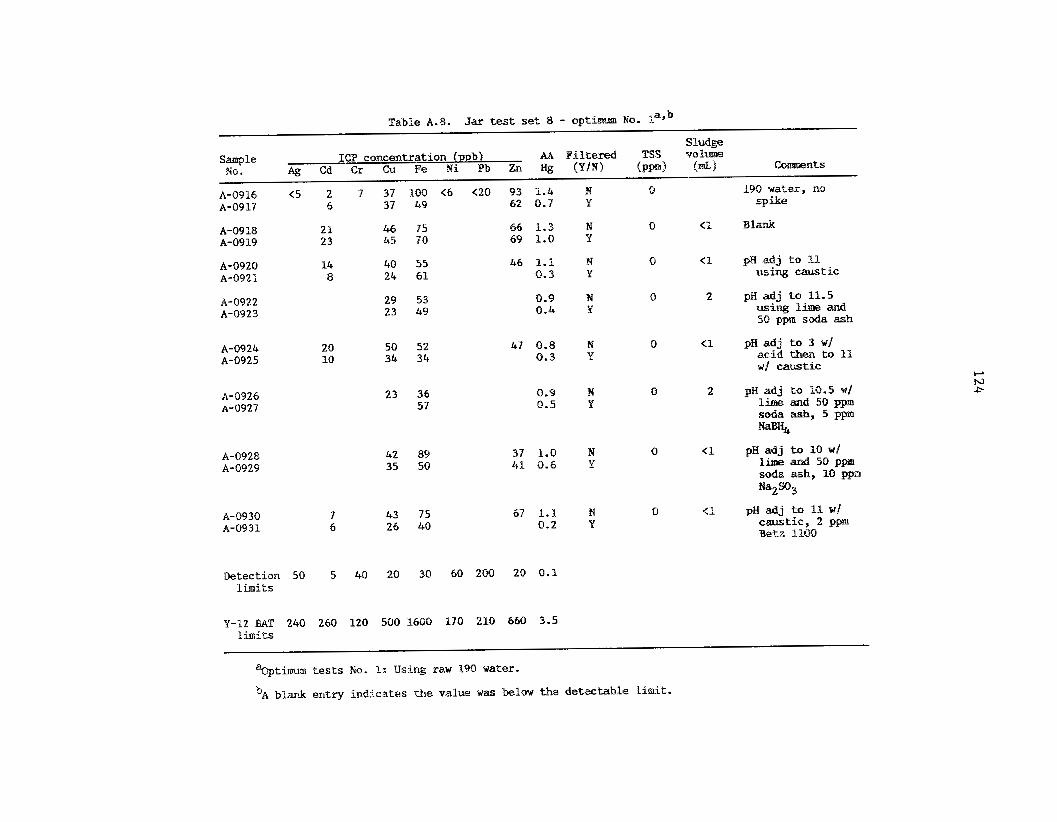
t.J W
??
u
l9
ex
0
N
??
0
0
\DID
N
N
ul.F
WN
00
WU
r-
0
WU
l C
N
f
PI9
Wb
) 0
A P
??
00
@a
NN
W
N
NN
W
G
PU
l O
W
0
N

Table A.9. Jar test set 9 - optimum No. 2a3b Sludge
Sample ICP concentration tmb) Filtered TSS volume No * Ag Cd Cr Cu Fe Ni Pb Zn (Y/N) (ppm) (mL) Comments
A-097 6 A-0977
A-0978 A-0979
A-0980 A-0981
A-0982 A-0983
A-0984 A-0985
A-0986 A-0987
A-0988 A-0989
A-0990 A-0991
-. 471 805 789 832 171 807 766 821 N 615 27 34 700 121 Y
137 663 124 111 60 744 216 253 N 52 613 29 48 704 132 Y
55 97 25 32 a0 27
N Y
60 25 32 34 N 26 9 6 5 38 (6 38 13 Y
52 64 46 33 31 N 39 26 48 Y
35 34 43 14 23 34
N Y
209 165 92 76 54 313 120 N 152 95 22 99 Y
69 166 34 33 149 47 N 56 23 38 Y
190 water with 1 ppm metals spike
spike
using caustic
pH adj to 11.5 using lime & 50 ppm soda ash
pH adj to 3 w/ acid,
(1 Blank with
(1 pH adj to 11
1
(1 then to 11 w/ caustic
1 pH adj to 10.5 w/ lime and SO ppm soda ash, 5 ppm NaBH4
pH adj to 10 w/ lime & 50 ppm soda ash,
2
10 Ppm %503
2 pH adj to 11 w/ caustic, 2 ppm Betz 1100
Detection 50 5 40 20 30 60 200 20 limits
Y-12 BAT 240 260 120 500 1600 170 210 660 limits
%timum tests No. 2: using 1 ppm metals spike.
I- N wl
bA blank entry indicates the value was below the detectable limit.

Table A.lO. Jar test set 10 - o p t i m a No. 3a,b
Shdae Sanple ICP concentration I.mbl Fil tered TSS vol&
No. Ag Cd Cr Cu Fe N i Pb Zn (Y/N) (pprn;) (sltj Comments
2211 2212
2213 2214
2215 2216
2217 2218
2219 2220
2221 2222
2223 2224
2225 2226
2227 2228
5060 212
285 1 8 1
204 1 2 1
253 133
235 165
106
2 3 1 233
233 6
234 1 7 1
7870 6390
6660 6270
2 1 1 109
95 28
187 64
263 39
328 167
276 67
1100 4 3 1
8050
313
8 1
143
104
316
503 2 3 1
257 7
5 8 1
7980 885 54 40
320 58 40 59
95 58 20 5 4
149 44 25
108 55 24
315 62 2 1 3 1
273 56 44
262 56 8 1 3
5 7 1 101 22 33
7700 6900
7110 6720
81
a3
111
232
455 260
2 0 1 10
1410 259
8070 7570 638 2240
1120 2530 753 2200
252 77
496 1 2 1 325
463 113
314 278
218 228
375 218 9 4 2 1
662 708
N Y
N Y
N Y
N Y
N Y
N Y
N Y
N Y
N Y
10
20
40
20
40
30
20-40
20-40
190 water w i t h 10 ppm metals spike
Blank with spike
pH adj t o 11
pH adj to 11.5 using
pH ad j t o 3 w/ acid,
using caastic
lime & 50 ppm soda ash
then t o 11 w/ caustic
pR ad j t o 10.5 v/ lime & 50 ppm soda ash, 5 pprn N&Hb
10 ppm Na2S03
pH ad j t o 10 w/ lime & 5 0 pprn soda ash,
pH adj t o 11 wl
pH adj t o 9.8 w/
caustic, 2 ppgl Betz
and 35 ppm soda ash, 1 ppm Betz
Detection 50 5 40 20 30 60 200 20 1 h i t s
Y-12 BAT 240 260 120 500 11600 170 21Q 660 limits
"optimum tests NQ. 3: using 10 pprn metals spike.
bA blank entry indicates the value was below the detectable linit.

Table A.11. Jar test set ll"9b,c9d
Sludge Sample ICP concentration (DDb) AA Filtered TSS volume No. Ag Cd Cr Cu Fe Ni Pb Zn Hg (Y/N) (ppm) (mL) Comments
2233 200 99 91 90 39 86 540 81 0.9 N 9 Supernate from 2234 140 18 390 0.5 Y primary treatment
2237 170 35 28 440 22 1.3 N 6 2238 120 1 2 31 290 0.6 Y
Blank
2241 160 69 62 62 470 56 0.9 N 9 1 2 PPmNdH4, 2242 10 35 310 0.4 Y pH 11
2245 150 69 61 64 49 470 56 0.7 N 19 2246 3 10 0.4 Y
2249 160 83 73 78 60 66 400 67 0.6 N 9 2250 8 310 0.4 Y
2253 160 69 59 58 50 490 54 0.6 N 18 2254 310 0.3 Y
Detection 50 5 40 20 30 60 200 20 0.1 limits
Y-12 BAT 240 260 120 500 1600 170 210 660 3.5 limits
5 PPm N-4, pH 11
2 PPm NaBH4, pH 10
pH 10 5 ppm N d H 4 ,
aSecondary treatment using sodium borohydride.
b15 min reaction time used.
'Raw 190 water contained 1.2 ppb mercury.
'A blank entry indicates the value was below the detectable limit.
Primary treatment consisted of adjusting 190 water, spiked with 10 ppm metals, t o a pH of 11 using lime and adding 0.5 ppm Percol 727.

Table A.12. Jar test sot 12a9b9c,d
Sludge Sample ICP concentration (mb) M Filtered TSS volume No. Ag Cd Cr Cu Fe Ni Pb ZR Hg (Y/N) (ppm> (mL) Conrments
-. 2233 200 99 91 90 39 86 540 81 0.9 N 9 Supernate from 2234
2237 170 35 28 440 22 1.3 N 6 Blank 2238 120 12 31 290 0.6 Y
2251 130 43 40 31 460 31 0.4 N 6 1 5 PPm N?S, 2258 11 3 8 28 <6 54 9 0.2 Y pH 11
140 i a 390 0.5 Y primary treatment
2261 120 41 41 32 440 24 0.4 N 7 10 ppm Na2S, 2262 6 0.2 Y pH 11
2265 130 52 52 2266
450 35 0.6, N 5 5 PPm N%S, <0.1 Y pH 10
2269 120 55 52 34 410 37 0.4 N 5 10 PPm N%S, 2270 30 0.1 Y pH 10
Detection 50 5 40 20 30 60 200 20 0.1 limits
Y-12 BAT 240 260 i20 500 1600 170 210 660 3.5 limits
%econdary treatment using sodium sulfide.
bSupernate has a tan or yellow color after Ma2S is added.
‘Raw 190 water contained 1.2 ppb mercury.
dA blank entry indicates the value was below the detectable l imi t .
Primary treatment consisted of adjusting 190 water, spiked w i t h 10 ppm metals, to a pH of 11 using 1be and adding 0.5 ppm Percol 727.
Some color filters out using a 0.45-pro filter.

Table A.13. Jar test set 13a*b#c7d
Sludge LCP concentration (rmbl AA Fil tered TSS volume
Ag Cd C r Cu Fe N i Pb Zn Hg (Y/N) (ppm) (mL) Comments sample
No.
2274 380 980 930 1000 130 940 1200 1000 1.1 N 9 Supernate from 2275 93 52 31 38 0.7 Y primary treatment
2278 120 110 87 94 63 81 230 70 1.0 N 12 Blank 2279 74 48 57 53 1.0 Y
2282 110 67 54 39 220 30 0.9 N 2 1 2ppmNaBHb, 2283 (5 37 17 20 20 14 150 16 0.4 Y pH 11
2286 100 80 50 69 50 220 51 0.7 N 8 1 5 PPm NaBHq, 2287 34 0.3 Y pH 11
2290 110 150 89 100 37 95 220 77 0.9 N 6 1 2 ppm NaBH41 2291 46 0.3 Y pH 10
2295 47 55 0.4 Y pH 10 2294 110 100 55 7 1 32 50 0.8 N 12 1 5 P P N a q + . .
Detection 50 5 40 20 30 60 200 20 0.1 limits
Y-12 BAT 240 260 120 500 1600 170 210 660 3.5 limits
%econdary treatment using sodium borohydride.
b15-min reaction time used.
cA blank entry indicates the value w a s below the detectable l i m i t .
dF?aw 190 water contained 2.8 ppb (unfi l tered sample).
Primaxy treatment consisted of adjusting 190 water, spiked with 10 pprn metals, t o a pH of 11 using caustic and adding 2 ppm Percol 728.

130
r-r /i 38
s 3 i;.
4%
n rk
-Io
1)k
> Z*
rl"; d0
0
0 0
d
0
0
N
d
0
d Om
d
Od
mm
om
4 0 m ON
mrr,
01
OO
cam
m
m
4ul
P-I-
NN
N
N

Table A.15. Jar test set 15 - sodium sulfidea’b’c Sludge
sample ICP concentration (Dpb) AA Filtered TSS volume NO. Ag Cd Cr Cu Fe Ni Pb Zn Hg (Y/N) (pprn) (mL) Coments
A-1045 A-1046
A-1047 A-1048
A-1051 A-1052
A-1055 A-1056
A-1059 A-1060
A- 1063 A-1064
A-1067 A-io68
A-1071 A-1072
880 70
390
200
2 10
84
200
52
6 11
950 960 690 45
810 760 620
780 610 36
780 680 100
260 270
720 660 6 t
64 68
53 58
990 31
790 2 1
430
540
120
520
48
79 48
160
140
110
120
58
120
59
960 a70
940 820
810 560
780 460
270
740 410
77
190 0.8 200 0.5
930 1100 330
750 lo00 1.8 160 1.1
620 780 0.6 73 0.1
680 810 0.9 36 0.2
250 310 0.3 (0.1
650 710 0.7 <O.l
160 0.2 27 (0.1
Detection 50 5 40 20 30 60 200 20 0.1 limits
Y-12 BAT. 240 260 120 500 1600 170 210 660 3.5 limits
N Y
N Y
N 1 2 Y
N 10 Y
N 13 Y
N 12 Y
N 15 Y
N 15 Y
(0.5
(0.5
(0.5
20
(0.5
10
Raw 190 water
190 water with spike
Blank
15 ppm Nap, p H 9 using caustic
15 ppm N?S, p H 11.5 using caustic
15 ppm NazS, pH 9 using lune
15 ppm N%S, pH 11.5 using lune
aPrimary treatment using sodium sulfide on 190 water spiked with 1 ppm metals.
bSolids have a light brown color after N%S is added. After settling or filtration, the supernate is clear.
‘A blank entry indicates the value was below the detectable limit.
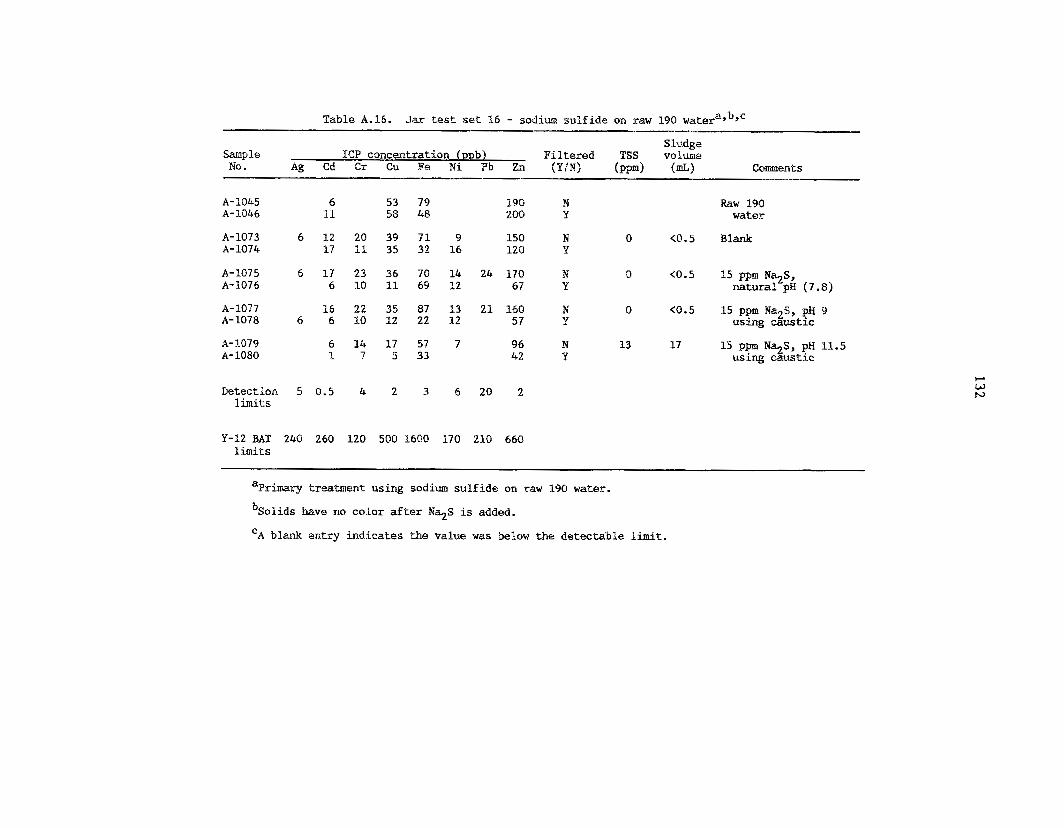
Table A.16. Jar test set 16 - sodium sulfide on raw 190
Sludge - Sample ICP concentration (pob) Filtered TSS volume EO. Ag Cd Cr Cu Fe Mi Pb ZA (Y/N) (ppm) (I&)
A-1045 6 53 79 190 N A- 1046 11 58 48 200 Y
Raw 190 water
A-1073 6 12 20 39 71 9 150 N 0 (0.5 Blank A-1074 17 11 35 32 16 120 Y
A- 107 5 6 17 23 36 70 14 24 170 M 0 (0.5 15 ppm N?S, A- 107 6 6 10 11 69 12 67 Y natural pH (7.8)
A-1077 16 22 35 87 13 21 160 N 0 <0.5 15 ppm Na2S, pH 9 8-1078 6 6 10 12 22 12 57 Y using cauStlC
A-1079 6 14 17 57 7 96 N 13 17 15 ppm Na.$, pH 11.5 A- 1080 1 7 5 3 3 42 Y using caustic
Detection 5 0.5 4 2 3 6 20 2 1 h i t s
Com@nts
Y-12 EAT 240 260 120 500 1600 170 210 660 limits
a P r h r y treatmenr using sodium sulfide on raw 190 water.
%olids have no color after N%S is added.
‘A blank entry indicates the value wa5 below the detectable dimit.

I
APPENDIX B . SUMMARY OF MPP OPERATIONS


135
SUMMARY OF MPP OPERATIONS
Date
7/22
-
7/23
7/24
7/25
7/26
7/29
7/30
7/31
811
812
81 5
Page
7
9
11
12 16-17
19
21 23
25 28
32-35
36
37
39
44
48
50 52 62
66
Comments
Started process water (PW) flow. through LCV-30 & air stripper (A/S). gpm. Start loading F-300 into GAC columns.
Shakedown of system Running at 1.5
Set-up skirt in reactor/clarifier (R/C) - clearance 1/8 to 1/4 in. Add 0.8 gpm of FW through A/S to simulate 3544 flow.
All carbon loaded and backflushed. Startup ti shutdown procedures for R/C loop.
Sand filters loaded - 12 in. anthracite on top of 12 in. sand. Pall rings loaded - 30-in. depth. Startup & shutdown procedures for IX loop - 1 gpn. Start lime slurry flow to R/C.
pH control on T-201 and T-301 installed. Sludge ( “ 3 kg from Phase I1 studies) loaded into R/C. Running on PW. Until now, system shut down each evening. Left R/C loop running overnight and through weekend.
Calibration curves for: FI-301, FRC-25, Peristaltic and LMI pumps. IX column loaded with 1 cu.ft. of IRC-718. Start PW flow. Start adding Purifloc A-23 to R/C.
Add 5 lb CaCO3 in 20 L water to R/C center well. another 2 lb later.
Add
Start flow through rest of system after R/C. recycle jet installed. in. per min.
R/C Chart speeds all set to 3 / 4
Started sampling 3544 feed daily for nitrate. Start real 190 water feed.
Problems with R/C. IX column inlet and outlet pH same. 3544 acid rinse switched to 3518 basin.
Flow through A/S & GAC columns started with 3544 effluent.

136
s i 6 70
8 /8 98
100
102
103
819 103 105
109
a/ la 115
8/ 12 119 120
124 126
8/ 13 127 130
135-137
139
8 / 1 4 142
145
146
Stop 190 flow for INSTTUFBRM repair of HH-190 far 4 h. Nitrate level in 3544 inlet water down to 8 PPma
Metals spike on at 1220. 190 organics feed pot contains naphthalene while 3544 feed pot contains chloroform and dibutyl phthalate (DBP) a
Backwash C-301 at 1725. Organics spike stopped until 2010 when rest of system restarted, System shutdown at 2030 due to R / C problems. sludge drained and new slotted skirt installed. Recharged R/C at 23138 and put 190 water through at 1.5 gpm to drain. Restarted IX unit at 2300 at 1 gpm,
Organics s p i k e an at 1240,
R/C
Restart rest o f system with 3544 effluent feed. Sand filter (SF) No. 3 backwashed. Waxy organic skimmed from API separator. Flows scaled back - 1 gpm through R/C, 0.53 gprn 3944 effluent feed t o A / S . FRC-40, FRC-20, FRC-401, and FI-381 calibrations.
Effluent from LCV-50 sent to drain.
Material at top of C-301 removed - biogrowth, APT separator skimmed. Same biogrowth as in C-301? Installed prefilters (30 pm cloth) in front of GAC columns. Removed carbon from C-301. Backwash SF No. 1. New reagent flows (for reduced 190 flow rate): g/d QP lime, 200 g/d of soda ash, and 3.5 g/d of polymer (Purif loc A-23).
500
Backwash SF No. 2. Conduct sludge characterization tests - fluidization and settling. S. Lewis' analyses of biogrowth from API separator and C-301. Recycle of R / C sludge attempted. drain.
LCV-30 flow to
R / C sludge recycle emptied 1 / 3 of R / C . recycling liquid back to center well for higher velocity in clarifier and through the sludge blanket. -5 gpm total through R/C. Stop 190 flaw and switch to PI+. INSITUFORM will be working on 190 line in morning. Added Purifloc to R / C - to get 3 - 5 ppm total.
Change to

137
81 15 150 New carbon in C-301 ready. from R/C. Polymer dosage jar tests. Jar tests.
2.5 gal sludge removed
152-155 156-157
81 16
8 / 17
81 18
159 Added Betz 1100 to R/C - =3 ppm total.
162 Shutdown entire system. Empty R/C and clean.
Installed new R!C skirt with twenty two 9/64-inS-diam holes. Sealed bottom of skirt.
164
8/ 19
8/20
166
175
More jar tests.
Put R/C sludge back into unit. 4.1 gpm (total of 5.1 gpm through blanket). 190 flow to R / C and IX.
Use liquid recycle at Restart
8/21 Cut R/C recycle to 2 gpm. Start using Betz 1100 in R / C at 3 ppm. prefilters removed. GAC columns. also.
GAC 3544 water started to A / S and
Started 190 water through A / S and GAC
177 184
8/22
8/23
186
194
Hydrogen peroxide put through GAC columns.
Metals spike started at 1230. Lowered Betz to 1.5 ppm. sludge.
R/C sludge thick - rod stands by itself in
8/24
8/26
196 Metals spike ended during night. SF No. 3 backwashed.
202 Peroxide put through GAC columns. set to 1 gpm (total of 2 gpm through blanket. spike on at 1230. GAC prefilters reinstalled.
R/C recycle rate Metals
203
8/27
8/28
8/29
8/30
205 210
GAC prefilter changed. Metals spike of f at 1230.
213 C-301 backwashed. Prefilter on 3544 feed installed. Cut Betz to 1 ppm.
219
222
Metals spike started at 1230. Organics spike on at 1340. GAC prefilter changed.
Spikes off at 1100. C-301 backwashed. Switch GAC prefilters. SF No. 2 backwashed. Peroxide put through T-201.

9/ 2
913
914
232
233
243
248
249
916 255
918 260
9/ 9 26 1
263
9/10 267
9/11 270
Switch GAC prefilters.
Backwash 6-301. Metals spike started at 1232. Organics spike started at 1300. SF No, 1 and No. 3 backwashed.
Spikes off at 1300. piping with 90 psi air. Backwash C-301. Heavy sludge removed From XX column. out of system - ineffective anyway. API separator cleaned out. Backwash C-301 again. GAG prefilters back in system.
Blow aut FCV-40 and associated
GAG prefilters taken
GAC prefilters bypassed. piping backflushed. allow air agitation during backwash. c-301.
LCV-30 and associated Air added t o GAC columns to
Backwashed
IX lines cleaned out. C-301 backwashed, Thermometer added at T-30, T-SO, & S-13. Empty T-201 and "-301 to get rid of biomass in each tank. Backflush almost all lines. Change out piping at bottom of C-301.
SF No. 1 backwashed.
R/C recycle rate set to 1.74 Lpm. SF No. 3 backwashed. Metals and organics spikes started at 1000. SF No. 1 backwashed. R / C recycle reset to 4 Lpm. Stripper flooding - reduced air flaw from 25 to 20% (22 psig).
Spikes off at 0900. C-301 backwashed. Shut R / C loop down at 1400.
Backwash SF No. 1. Shutdown IX sysrtem. Biomass on top of resin. 10-12 in. resin.
Sludge removed by gently stirring top
9/16-29 271-8 Jar tests by Engineering-Science. Carbon isotherms and air stripping tests. 1 kg sludge removed from R/C for EP Tox testing. 279
9 / 2 4 280 E-S column settling and sludge dewatering tests. Further jar tests.
10/7 288 Pall rings from A/S covered with algae. Studied ways to remove. in two 55-gal drums. cleaned unit-.
Lime sludge removed from X / C and stored Removed center well & acid

139
1018
1019
10110
10/ 14
101 15
10/ 16
10117
101 18
10/ 19
10121
10122
10123
10124
29 1 Obtained empty column (SF) pressure drop profile. GAC columns emptied and flushed. flow rate test run.
Pressure drop-vs-
29 1 P vs Q test in SF No. 3 - 13 in. each of sand and anthracite. full.
Start recharging of GAC columns - -1/3
292 Wooden underflow dam installed in MH-190. P vs Q run in C-301, 2 & 3. Reactor modified for caustic use. Backwash circuits completed.
294 Removed 32 02. of lime sludge from 55-gal drum for radionuclide analysis. First pickup of HFIR water - put into T-401.
295 190 water started through new system. 15 min RT in reactor. IX flow also restarted. Large impeller put into reactor. mixer setup.
Bet2 addition at 2 ppm into rapid
298 Reagent flows started - caustic anld Betz. New logbook 2 Spikes started at 1000. 3 API separator surface skimmed. Air sparge in T-201
stopped. C-301 backwashed. IX column stopped at 1930. T-301 to be used for supplemental feed in future.
6 Spikes off at 0920. Metals had stopped during night.
11 All lines backwashed as per procedure. Acid addition SF No. 3 backwashed.
strength increased from 833 to 1700 mL concentrated sulfuric acid per 20 L water. Reduce Betz flow to 1 ppm. SF No. 1 backwashed.
12 Backwash C-301 and SF No. 2.
14 API separator surface skimmed. TRU and TURF water collected. SF No. 3 backwashed. 1505, MH-240, MI- 235, and MH-149 collected.
16 Spikes started at: 1240. MH-229 water pumped in. SF No. 3 backwashed.
23 Spikes off at 1430. Backwash C-301 and SF No. 3.
27 Start supplemental feed at 0.44 gpm.

140
10125 30
19/26 31
10/28 35
10/29 34
10131 44
1111 46
49
1112 49
1114 50
1115 55
11/6 55
60
11/7 57
11/8 58
Trouble with FR@-401 - wild oscillations. Rerouted flow from T-401 through SF No. 1 before FRC-401. Supplemental feed off for weekend at 1600.
SF No, 2 and No. 3 backwashed.
Supplemental feed restarted at 0930, at 0940. f o r EP TOX test. centrifuge.
Spikes started ~4 L sample of sludge taken from clarifier
Sludge filtered poorly - used
Spikes off at 1010. SF No. 2 and No. 3 backwashed. C-301 backwashed. Lines purged. A/S steamed f o r 10 min at 100°C.
SF No. 2 and No, 3 backwashed. Spikes started at 1030.
Metals spike off at 1035. Organics o f f at 0940. A I S top removed - packing too high and close to air exit which probably l e d to flooding. Increasing amaunt of biogrowth going down through the packing. packing. C-301 backwashed. SF No. 2 and No. 3 backdashed. APT separator surface skimmed.
Steamed
(2-301 backwashed.
Shut down system. sludge. Replace trim in FCV-401 with t w j sizes larger trim. Backwash SF No, 2 and No. 3 . SF No. 1 taken out of Supplemental feed circuit. feed on at 1210. System restarted.
Empty clarifier of metal-spiked
Supplemental
Recycle SF backwash to rapid mixer.
Collection of MH-235 and MI-149 termii.ated due tQ purnping into MI-235 with "hot" water. Reset FRC-SQ1. Backwash SF No. 2 - -20 gal recycled to rapid mixer. Removed 2 gal of old caustic sludge r'or radionuclides analysis and EF Tox test. Organic spike (chloroform only) on at 0930.
Backwash SF No. 3 .
C-301 backwashed. SF No. 2 back ashed. Supplemental feed stopped at 1400 for weekeni. Using excess acid to neutralize T-201 water. 1300.
Orpmic spike off at

141
11/11 65 SF No. 3 backwashed. A/S reset to 52% at 33 psig for an air to l iquid volume ratio of 150. Chloroform spike started at 1500.
11/12 66 SF No. 2 backwashed. HFIR water too "hot" to collect. Reset FRC-401. Chloroform spike of€ at 1400.
11/14 72 Backwash SF No. 3.
11/15 73 SF No. 2 and No. 3 backwashed, C-301 backwashed. All flows off at 1325.
The above information is summarized from registered notebooks No. A- 101836-G and A-101913. The sample information data were recorded in notebook No. A-101837-G.


APPENDIX C. MPP DATA StJMMARY


Table C.1. SCP results from the MPP for the period 08/22 - 09/10/85 using lime plus soda ash precipitationapb
~ ~ ~~~
Sample Sample Spike point No. Ca Mg Cd Cr cu Fe Ni Pb zn PH Date Time on?
A C D ~ s-4 5-5 5-7 s-10 s- 3 s-3.5 s-4 s-5
S-7 s-10 S-13 s-3 s-3.5 3-4 s-5 5-7 s-10 S-13 s-11 s-3 s-4 s- 5
5-7 s-10 S-13 s - 3 s-4 s-5
s-10 S-13 s-3 s-3
s-10 S-13 s-3
s-a
s-a
s-a
s-a
B-0876 E-0877 ~-0889 ~-0a9i ~-0886 E-O~W
B-oaaa E-0901
B-0890 E-0906 E-0908 E-0909 B-0902 B-0903 B-0934 B-0905 B-0920 B-G922 B-0925 B-0923 B-0916
B-0919 B-0921 B-0932 B-0934 B-0937
E-0930 E-0931 B-0933 B-0945 B-0946 E-0947 E-0953 B-0956 B-0958 B-0959 B-0963
~-0918
B-ogza
33 32 32 23 32 31 30 32 32 37 22 21 29 31 32 32 36 19 18 19 31 29
29 39 20 19 31 30 30 33 20 18 32 34 29 20 2
32
213
8.0 7 .O 5.0 4.0 7.0 7 .O 7.0 7.0 6.0 6.0 4.0 4.0 7.0 7 .O 7 .O 7.0 6.0 4.0 4.3
7.0 7.0 7 .O 6.0 6.0 5.0 5.0 6.0 7.0 7.0 7.0 4.0 4.0 8.0 8.0 7.0 5.0 4.0 8.0
1 1 1
100 4
480 340 110 21 23 130 7 1
500 400 170 36 170 11 1 3
590 350 60 26
19 2
650 400 63
22 1 3 3 7
iao
48
a 510
4 6 9 90 25 650 27 33 23 22 120 20
490 10 27 17 140 10
7 10 15 11 12 140 9 4
750 40 121 11 10
91 7 5 62
590
2 71 6
160
930
73 19 47 160 19
640 46 64 17
ia
a4
iao ia
3 970 51 11 21
16
950 90
iao
ia 28 22
21
35 32
620
a3
3 95 130 65 19 280 28 22 26 16 53 22 16 130 19 24 20 49 27 34 39 140 37
13 63 27 10
18 21
17 14
45
2a
iao
18
270
6 12 31 140 13 510 340
40 57 170 19
500 410 230 40
16
10
350 59 24 19 0 17
630 390 56 32 17
44
iao
iao
580
540
20 34
93
660 70 62
140
550 56 56
iao
7 50 93
27 180
790 130
34
26 24 21
440
2 91 14 190
810 230 160 35 58 170 24 16 610 120 140
i iD 180 41 25 29
900 110 29 28 190 32 23 910 150 29 25 54 40 41 110 39 50 3
700
2a
4.8 4.8 9.9
6.9
9.9
9.6
7.2
9.6
7.2
9.4
5.7 7.2 8.7
7.2
oa122185 08/22/85
oat 26i 85 081 26/85 081 26/85
08 I26 i 85 081 26/85 oai261a5 08/26/85 081 261 a5 oa I 2 6 185 oa I 26 185 oalzti ias oaf27 /a5
081 27 185
0812 J 185 08/27 /a5 oat 2 J 185 oat 27 / a5
oa/2~/as 081 27 l a5 oa/2~/a5 oai27/a5 oa i 27 /a5 0812 7/85 oai2aias
oaiza/m 081 28/85 oat 28/85 081 29 185
08/26/85
08/26/85
08f 26/85
0812 7 185
081 2 7 /85 08/27/85
Oaf 2 7 185 081 2 7 185
081 28/85
1000 1000
1800 1800
iaoo
iaoo iaoo
iaoo 1800
2200 2200 2200 2200 2200 2200 2200 0900 0900 0900 0900 0900 0900 0900 0900 1215 1215 12 15 12 15 1215 1215 121s 1715 1715 1630 2300 2300 2300 2300 1700
NO No Yes Yes Yes Yes Yes Yes Yes Yes Yes Yes Yes Yes Yes Yes Ln Yes Yes
Yes Yes Yes Yes Yes Yes Yes Yes Yes Yes Yes Yes No No No No NQ NO NO Yes
CL c-
Y0S

Table C.l (continued)
Sample Sample Spike point XO . Ca Mg Cd Cr CU Fe Ni I% Zn PB Date Time on?
5-7
s-10 s-13 s-11 S-3 s-7 S-8 S-90 s-13 5-3 s-7 S-8 s-lo 5-13 S-3 S-8 s-13 5-3 5-7 s-8 s-10 S-13 s-3 5-7 S-8 s- 10 s-13 s-11 5-3 s-7 S-8 S-10 s-13 S-3 S-8 s-IO s-13 S-3 S-7 s-8 s-7 S-3
s-a B-0967 B-0968 B-0970 B-0973 €3-0971 B-0995 B-0999 B-1000 B-1002 3-1003 B-1022 B-1026 B-1027 B-1029 B-1030 B-1057 B- 1065 3-1066 B-1068 8-1072 B-1073 B-1075 B- 1076 B-1098 B-1102 B-1103 B-1105
B-2.196 B-PI30 B-1134 B-1135 B-1137 B-1138 13-1971 €3-1173 3-1176 '8-1177
8-1179 3-1180 B-1200 8-1196
B- 1108
~-1178
33 27 13 21 21
24 25 18 20 29 33 33 21 20 40 43. 32 37 28 25 23 1 7 26 22 19 12 13 12 31 37 29 13 12 30 31 28 23 29 44 35 36 29
28
7.0 7.0 4.0 5.0
8.0 6.0 6.0 4.0 4.0 4.0 4.0 4.0 4.0 4.0 7.0 5.0 5.0 6.0 6.0 5.0 4.0 3.0 6.0 6.0 6.0 4.0 5.0
7.0 7.0 6.0 4.0 4.0
7.0 5.0 5.0 7.0 7.0 6.0 7.0 7.0
130 a7 6 4
490
23 12 6
490 130 70 30
6 4 1 3
360 74 34 20 2
73 11 8 4 8
450 130 29 9 3 2 2
5
I 1
100 450
a
a2
380
a
I
120
720
9 a9
550 130 68
9 5 14
6
330 85 38 52
430 99 13 10
6 7
2200 180 19 9 5 12 14 12
5 9 a 7
99 430
160 42 25
740 120 49 25
650 190 110
2 1
110 13 4
330 3.10
56 58
560 130 19 19
3 34
260 35 14
96 50 61
120 54 23 170 650
a20
30
120
170 24 li 24 23 34 20 22 110
36 41 33 12 96 33 12 15 19 11 100 53 11 22 17 97 38 63 27 52 4+ 19 53 160
f90 31
7
520 120 34 10
520 180
95 25 16
22 7
360 93 41 15
390 120 25 22 9 22 470 140 26 15 7
ia
9 9
140 480
100
570
26 ao
550 160
7 3
66
340 72
23
k90 77
47 0 200 34
91 40 28
100 34 21 110 550
I80 46 41 49 47 730 130 58 61 56 670
110 35 54 110 35 36
390 238 46 35 12 560 140 48 57 36 120 650 280 52 32 34 69 23 95 25 84 50 25 160 620
iao
9.2 9.2
9.5 9.2
9.5
7.3
7.2
I 8.9
7.3 8.6 9.a
6.3 6.9 9.3 9.8
7.1 9.0 7.2 6.9 7.3 10.1
a 8.3 7.2
08/29/85 os/29/as 08/29 /a5 08 /29/a5 081 29 185 oa/29/85 oa I 29/85 oa/zs/as oa/2ca/85
081 30 /a5 08/30/85 081 30 185 08/30 185 08/ 31/85 09/03/85 09/03/85 09 l o a 1 a5
08J29f 85
08lSOl85
09/03/85 091 03/85 09/03/R5 091 03 / 85 09 1041 85 09/04/85
09 1 0 4 8 5 09/04/8~
os/osm 09 I obi a5 OS IO4 185 09/04 /85 09 i 04 I a5 09 /04/85 09/04/85 os/os/ss 09 /05 /85 09/05 .IS5 09/05/85 09 1061 85 09 / 06 /85 09/06/85 09 /a9 / 85 09 /09/ 85
1700 1700 1700 1700 1700 2140 2 140 2140 2140 2 140 1000 1000 1000 1000 1000 1330 0845
13 15 1715 1715 1715 1715 0830 0830 0830 0830
0845
0830 3830 12m 1240 1240 1240 3240 1500 1500 1500 1500 0830 0830 0830
1500
Yes Yes Yes Yes Yes Yes Yes Yes Yes Yes Yes Yes Yes Yes Yes NO NO NO +
.c. Yes Yes Yes Yes Yes Yes Yes Yes Yes Yes Yes Yes Yes 'Pes Ye5 No NO No NO No NO NQ Yes Yes
YE?§ QI

Table C.l (continued)
Sample Sample Spike point NO. Cr cu Fe Ni Pb Zn PH Date Time On?
S-8 s- 10 S-13 s-11 s-3 s-10 S-13 s-11
8-1201 B-1203 B-1206 B-1204 B-1228 B-1235 B-1238 B-1236
32 7.0 29 23 40 21 4.0 10 19 29 22 4.0 3 5 20 1 5 4 32 8.0 590 590 720 ia 4.0 24 7 14 ia 4.0 2 5 19 5 4
16 35 24 34 8.3 22 23 51 14 10 29 10 18 71 590 630 710 7.4 15 21 22 6.8 22 30 7.1
20 7.1
osios/as os/os/as 09 t 091 as 09/09/a5 091 LO185 09 I io /a5 o w ioia5 09 I 10 I 85
~~
1500 1500 1500 1500 0830 0830 0830 0830
Yes Yes Yes Yes Yes Yes Yes Yes
%alcium and magnesium results expressed as ppm; other values expressed as ppb.
bA blank entry indicates the value was below the detectable limit.
‘ICP x 10 detection limits.

Table C.2. ICP results from the HPP for the period 10/17 - 11/18!85a3b Sanple Sample Spike point No. Ca Mg Xa Ag Cd Cr Cu Fe Ri Pb Zn pH Date T k on?
Y-13C ACD s-3 s-3.5 s-4 s-5 s-1 S-8 S-9 s-10 s-1% s-4 s-5 s-3 s-7 S-8 s-9 S-I0 S i 3 S-3 S-: S-8 s-9 s- 10 s-11 s-12 S-13 S - 3 S-7 S-8 S-9 s- 10 S-11 s-12 S-E3 S-1 S-2 s - 3 S-7 S-8
8-1261 B-1262 B-1263 B-1264 B-1265 B-1266 B-1261 B-1268 B-1269 B-1296 B-1297 5-1294
B-1299 B-1300 B-1301 B-13GZ 13-1343 3 - 1 3 U B-1345 B-1346 3-1347 B-1348 B-1349 B-1350 B-1385 B-1386 B-1387 B-1388 B-1389 B-1390 B-1391 13-1392 B-2416 8-1411 3-1418 b-1L19 5-11;20
B-1298
30 1.9 18
31 8.0 25 30 7.6 26 2 1 7.4 120 23 6.9 120
70 16 4.8 93 16 4.8 92 35 9.2 30 34 8.7 28 32 8.5 32 31 5 . 3 120 19 7.0 110 28 5.4 390 21 6.0 373 28 6.5 200 31 8.2 30 28 7.4 110 26 6 . b 110 1 0.1 100 14 4.6 110 16 5.1 120 1 5 4.6 9113 14 4 . 3 95 30 8.1 45 27 7 . 3 120 21 6 .8 120
140 13 4.3 120 14 4 . 4 120 15 4.8 130 13 4.1 120 26 7.1 34 25 6.8 14 26 6.8 27 24 6.7 78 16 5.5 69
35 3.8 16
240 260 120 500 1600 5 2. 4 2 3 6 410 440 550 120
460 170 230 82 210 150 190 65 1 14 5 47
160 56 87 28 81 3 31 13
17 84 39 8 23 43
40 320 2i0 210 84
2 22 7 16 9 11 250 350 130
31 29 67 27 18 11 31 11
4 1 140 14 5 15 33 28 5 36
9 690 610 750 11'3 140 66 118 38 37 9 25 19
34 98 F 8 37 61 3 10 34 2 3 33 2 26
260 500 290 110 130 100 73 22 69 18 18 15
12 60 52 13 20 23 20 7 8 58 11 5 2 24 7 31
7 42 330 450 150 13 50 130
16 17 630 790 410 14 39 l10 15
9 ? 53 17
3
170 6
490 570 360
190 94
52
380
71 20 9
8 29 820 190 33 1
16
100 260 21
23 15 14 12 61 19 130 16
210 660 20 2 480 690 6.9 170 320 6.7 140 240 4.0
12 5.2 1-10 520 110.6 37 55 10.6
20 7.4 51 1.0 2 1 8.2
210 330 3.7 16 5.3
240 k30 7.4 39 110 10.5
56 10.5 27 38 7.0
40 8.4 150 7.8
640 860 7.1 96 130 10.7
34 10.1 39 6.3 39 7.2 45 7.0 48 7.8 36 7.7
150 150 10.6 33 15 10.6
15 1 . 1 25 21r 1 . 3
24 7.1 31 6.9 38 7.2
320 510 7.5 56 7.9
630 990 7.5 u 100 10.5
28 10.4
570 680 7.5
16)/11 185 10/17/85 10/17/85 101 17/85 lo/ 17 185 10~71a5 lo! 17/85 10/11/85 101 17 185 IO/ 11 185 10/17/85 mi ia/a 101 18/05 iojia/85 10/1%/ 85 IO/ 16/85 IO/ 18/85 10/22/85 iOi22185 10122 (85 10/22/85 10122IB5 l0/22/85 10/22!85 1a/zz/ss 10 f 23/85 10/23/85 10/23/85 30 /23 /85
10123185 10123185 101 23/85 101 2S/85 101 25 185 10/25/8S 1.3 ! 2 5 I85 10!25/ 85
10123 a5
1500 1500 1500 1500 1500 1500 I500 1500 1500 1840 a%40 0400 0900 0900 0900 0900 0900 1300 1300 1300 1300 1300 1300 1300 1300 1400 1400 3400 1400 1400 1400 1400 1400 1400 1400 1400 1400 1400
Yes Yes Yes Yes Yes Yes Yen Yes Yes Yes Yes Yes
xo KO NO NO NO
Yes Yes Yes Yes Yes Yes Yes Yes Yes Yes Yes K C 5
Yes Yes Yes YEIS No NO NO No Ro

Table C.2 (continued)
Sample point
Spike on?
Sample No.
B-1421 B-1422 B-1423 B-1455 B-1456 B-1457 B-1458 B-1459 B-1460 B-1461 B-1462 B-1463 B- 1464 B- 1488 B- 1489 B- 1490 B-1491 B-1492 B-1493 E-1494 B-1495 B-1496 B-1497 B-1518 B- 1519 B-1520 B-1521 B-1527 B-1528 B-1529 B-1530 B-1531 B-1532 B-1533 B-1534 B-1535 B-1536 B-1564 B-1565 B-1566 B-1567 B-1568
ca - hz - 0.2 4.3 4.4 8.9 8.7 8.9 8.2 7.6 0.1 2.4 5.0 5.3 4.7 9.0 8,5 8.6 6.9 5.6 0.1 5.1 4.6 5.0 4.4 7.8 7.1 7.4 7.5 7.5 7.6 7.7 6.7 7.8 0.1 5.5 5.9 5.6 6.1 7.2 7.4 7.3 7.4 6.3
Na Cr - Ni - Pb - Date Time Cd CU
9 27
Fe
38 32 8
750 91 93 36 9
100 13 33 16 30 3 60 35
S-9 s-10 S-13 s- 1 s-2 5-3 s-7 S-8 s-9 s- 10 s-11 s-12 5-13 s-1 s-2 s-3 s-7 S-8 s-9 s-10 s-11 s-12 S-13 s- 1 s-2 s-3
s-1 S-2 s-3 s-7 S - 8 s-9 S-10 s-11 5-12 S-13 S-1 S-2 5-3 s-7 s-8
s-a
79 82 84 32 10 24 76
56 34 71 76 64 40 13
81 64 78 98 90 97 83 20 9 16 87 55 17 36 82 96 160 110 120 110 130 56 8 35 83 98
78
28
13 20 13
7100 79 340 120 26 16 24 41 46 44
5600 360 7000 170 18 18 18 24 36 36 120 110 120 37
1600 1100 1400
io/ 2 5 I 85 10/25/85 101 25/85 io/28/a5 10/28/85 10/28/85 io mta5 10/28/85 io/ 28/85
io/ 28/85 i012ai85
io/29/a5 io/ 29/85
19/29/85
10/28/85
lO/28/85 10/29/85
10129185
10/29/85 10129185 10/29/85 10129185 io/ 29/85 lot 301 85
io130185
101 301 85 10/30/85
101 3 11 85 10/31/85 10/31/05 i0131/85 101 3 11 85 10/31/85 10/31/85 10/31185 101 3 11 85 101 31 185 iitoi/a5 11/01/85 11/01/85 11/01/85 11/01/85
1400 1400 1400 1500 1500 1500 1500 1500 1500 1500 1500 1500 1500 1000 1000 1000 1000 1000 1000 1000 1000 1000 1000 1400 1400 1400
No No NO
Y e s Y e s Y e s Y e s Y e s Y e s Y e s Y e s Y e s Y e s Y e s Y e s Yes Yes Y e s Y e s Y e s Y e s Y e s Y e s NO NO No No
Y e s Y e s Y e 5 Y e s
Y e s Y e s Yes Y e s Y e s Y e s Y e s Y e s Y e 5 Yes
Y e s
1 13
7.5 7.7 6
2 1100 15 100 43 16
14 32 31 30 28 24 1 8 16 17
8.3 7.1 8.1 7.5 10.1 10.0 6.6 7.5 7.1 6.9 7.0 7.3 8.1 7.7 10.6 10.5 7.3 7.1 6.9 6.8 6.7 7.4 7.8 7.4 10.4 7.2 7.5 7.4 10.4 10.4
91
10 6
5700 13 250 86 22
2000 63 130 55 19 14
3500 24
560 250 53 21 14 14
9 2600 200 2700 270 18
8
5500
250 94 22
5 5 5 7
980 73
15 16 6
4900 260 6100 140 5
6
12 7 2
1600 130
15 32 115
12 65 9
4700 280 5700 210
30 29 24 15
13 12 13 11
1100 67
2000 53
320 12
4 7 12 9 3
14 53 31 3
4 6 5 16 11 13 8
1000 400 7 10 180 91
30 7 5 6
940 8
850 200 16
14 9 11 9 18 8 12
1600 490 900 300 180 19 56 13 9
7 12
6 32 30
8 25
10 11
1600 950 1299 160 32
5 10 7 5
580
1600 9 1
32 53
11 32
43
26
1400 850 1200 200 53
31 5 6 11 14
51 21
1400
1100 170 52 10 24 9 3
520 64
1400 97 12
a70
55 13 240 160 270 30 25 120 31 16 11 28 120 27 160 12
22 32
1400 1515
33 32 28 28 1 16 17 16 17 30 31 30 26 21
1515 1519 1515 1515 1515 1515 1515 1515 1515 0900 0900 0900 0900 0900
7 10
200 79 15 48 35 30 38 540 130 1500 98 17
7.4 7.7 1.3 7.2
12 1400
7.2 7.1 7.7 7.3 10.4
7 630
35 6 5
1100 280 21
1401) I70
10.3

Table C.2 (continued)
Sample Sample Spike point No. Ca Mg Na Ag Cd Cr Cu Fe Ni Pb Zn pH Date T h e on?
s-9 s-10 s-11 s- 12 S-13 S-8 S-2 s-2 S-7 s-8 s-9 s- 10 s-11 s-12 S-13 s-3 S-7 S-7 5-8 S-8 S-13 T-201 T-201 S-13 S-1 S - 7 s-8 s-9 s-10 s-11 s-12 S-13 s-2 S-13e
B-1569 B-1570 B-1571 B-1572 B-I573 B-1594 B-2607 B-1608 B-1609 B-1610 B-1611 B-1612 B-1613 B-1614 B-1615 B-1644 B-1645 B-1655 3-1646 B- 1647 B-1648 B-1649 B-1650 B-1657 B-1659 B-1661 B-1662 B-1663 B-1664 B-1665 B-1666 B-1667 B-1660 B-1656
~~ ~ ~
0.1 93 1 6 15 5.4 110 1 2 4 14 5.4 100 14 14 5.2 100 14 13 4.1 92 a 1 21 6.2 89 18 30 8.1 35 9 24 30 7.8 6 1 4 31 8.4 81 2 6 27 13.3 81 2
97 15 4.5 86 1 16 4.8 81 3 16 4.8 79 4 16 4.8 83 5 28 7.8 25 1 26 8.3 95 1 22 7.8 96 1 22 8.0 100 3. 24 8.4 100 2 13 5.6 83 3 5 19 7 .7 96 2 14 8.13 110 4 14 5.5 88 2 34 8.5 47 6 3 33 7.6 97 1 5 25 7.7 88 1
15 5.2 89 1 1 2 4.9 85 1 12 5.3 93 2 11 4.6 83 1 35 7.8 8 6 1 9 14 5.6 91 9 62
0.1 68
12 12 5
16 72 35 25 18 3
14 6
42 35 37 29 25 29 4
21 30
150 37 25 9
25 5 2
69 45
~ ~~~
51 17 21 22 19 19 10 28 26 18 28 29 9 25 30
18 24 22 15 160 9 70 180 120 170 47 110 23 57 79 16 38 39 21 7 33 19 30 40 9 33 66 100 15 91
7 25 6 19
15 48 42 45 14 55
4 26 18 6 25 210 31 150 13 89 38 18 30 9 78 16 44 11 40 8 26
150 1 2 310 27 28 47 110
40 58
6.8 7 . 1 7 . 1 6.9 6.9
10.4 7.5 7.6
10.2 10.2 8.8
7.0 6.8 6.7 7 -4
10.3 10.3 10.2 10.3 6.9 7.0 6.9
7.8
7.2 7.4
10.5 10.5 6.9 7.5 7.3 7.3 7.3 7.6
w o i / a 5 11/01/85 11/01/85 11/01/85 11/01/85 11/01/85 ll/O 7/85 11/07/85 11/07/85 11/07/85 11/07/85 11/0 7 185 11/07/85 11/07/85 11/07/65 11/12/85 111 12/85 11/12/85 111 12/85 11/12/85 11/12/85 11/12/85
111 13/85 111 141 85 11/14/85
11/14/85
11/14/65 11/14/85 11/14/85 11/ 14/85
11/12 1135
i i 1 1 m 5
11114/85
w 1 a i a 5
0900 0900 0900 0900
1000 1400 1400 1400 1400 1400 1400 1400 1400 1400 1400 1400 1400 1400 1400 1400 1400 1400 0915 1300 1300 1300 1300 1300 1300 1300 1300 1500 1530
0900
Yes Yes Yes Yes Yes Yes No NO No NQ NO NO No No NO NO NO No NO NO No NO NO NO No NO NQ No NO NO NO NO No NO
%lcium, Mg, and Na results are e-Tressed as ppm; other values are in ppb.
bA blank entry indicates the value was below the detectable limit.
‘Y-12 BAT liaits.
dICP x 10 detection limits.
eSme as 8-1657, but held for 5 d.

151
Table C . 3 . Volatile organics results from the mini-pilot plant
Spike Date Time O n ?
Sample Sample point No.
s-3 S-8 s - 9 s -10 s-11 s- 12 S-13 s - 3 S-8 s - 9 s- 10 s-11 s-12 S-13 190Fa 3544Fb s- 3 S-8 s - 9 s -10 S-11 s -12 S-13 190F 3544F s-3 S-8 s - 9 s-10 s-11 s-12 S-13 190F 3544F s - 3 S-8
B-0729 B-0734 B-0737 B-0739 B-0742 B-0744 B-0746 B-1086 B-1087 B-1088 B- IO89 B- 1090 B-1091 B-1092 B-1093 B- 1094 B-1118 B-1119 B-1120 B-1121 B-1122 B-1123 B-1124 B-1125 B-1126 B-1216 B-1217 B-1218 B-1219 B-1220 B-1221 B-1222 B-1223 B-1224 B- 1248 B- 1249
32 50
6 4 2 1 1
282 21
236 29 3 0 2 7
99,999 17 14
380 50
0 2 2 0
99,999 98
200 225
26 3 1
1016 0
258 8 9
081 07 / 85 08/07/ 85 08/07/85 08/07/85 08/07/85 08/07 185 08/07/85 09/03/85 09/03/85 09/03/85 09/03/85 091 031 85 09/03/85 09/03/85
091 031 85 09/04/85 09/04/85 09/04/85 09/04/85 09/04/ 85 09/04/85 09/04/85 09/04/85 09/04/85 09/09/85 09/09/85 09/ 09/ 85 09/09/85 09/09/85 09/09/85 09/09/85 09/09/85 09/09/85 09/10/85 09/10/85
09/03/85
1900 1900 1900 1900 1900 1900 1900 1715 1715 1715 1715 1715 1715 1715 1715 1715 0830 0830 0830 0830 0830 0830 0830 0830 0830 1500 1500 1500 1500 1500 1500 1500 1500 1500 0830 0830
No No No No No NO No Yes Yes Yes Yes Yes Yes Yes Yes Yes Yes Yes Yes Yes Yes Yes Yes Yes Yes Yes Yes Yes Yes Yes Yes Yes Yes Yes Yes Yes

152
T a b l e C . 3 (continued) --- -_
Sp i k e Date T i m e O n ?
Sample Sample point. No.
s - 9 s-10 s-11 s-12 S-13 190F 3544F s-3 s-8 s-9 s-IO s-11 s-12 S-13 19OF 3544F s - 3 s-8 S-9 s-10 S- I1 s-12 S-13 19OF 35414F s-3 s-8 S-9 s-10 S-11 s-12 S-13 190F 3544F s-3 S-8 S-9 S-10 S - l l s-12
B- I250 B-1251 x- 1252 33-1253 B- 1254 B-1255 B-1256 B- I282 0-1283 B- 1284 B- I285 13-1286 '8-1287 B- 1288 8- 1289 B-1290 B-1312 €3-1313 B-1314 B-1315 13-1316 3-1317 B-1318 E-1319 3-1320 B- 1363 B- 1364 B-1365 B- 1366 B- 1367 R - 1368 8- 1369 W- 1370 B-1371 3-1402 3-1403 B- 1404 B- 1405 A- 1406 B- 1407
232 10
0 0 0 0
218 25 16
722 44
3 2 2 0
1000 412
13 347
86 3 1 2 0
1000 44 45
328 50
2 1 0 0
623 10
7 424
4 0
3a
09/10/85 09/ 10 / 85 09/10/85 09/ 10/85 09/10/85 09/ 10/85 09/ 10/85 10/17/85 lO/lS/SS 10/17/85 10/17/85 10/ 17/85 10/ 17/85 10/17/85 10/17/85 10/ 17/85 10/18/85 10/18/85 10/18/85 10/ 18/85 10/ 18/85 10/ 18/85 10/18/85 10/18/85 10/ 18/85 10/22/85 1 O / 22/ 85 18/22/85 10/22/85 10/22/85 10/22/%5 10/22/85 10/22/85 10/22/85 10/23/85 10/23/85 10/23/85 10/23/85 10/23/85 10/23/85
0830 0830 0830 0830 0830 0830 0830 1500 1500 1500 1500 1500 1500 1500 1500 1508 0900 0900 0900 0900 0900 0900 0900 0900 0900 1300 1300 1300 1300 1300 1300 1300 1300 1300
1400 1400 1400 1400 1400
i 4 a o
YES
Y e s Yes Y e s Yes Y e s Y e s Y e s Y e s Y e s Y e s Yes Yes Yes Y e s Yes Yes Yes Yes Yes Y e s Yes Y e s Yes Y e s Y e s Y E S
Y e s Yes Y e s Yes Y e s YES
Y e s Y e s Yes Y e s Y@S Yes Ye S

153
Table C.3 (cont inued)
Spike Date T ime On?
S a m p l e Sample po in t No.
S-13 s-1 s - 2 5-3 S-8 s - 9 s -10 s-11 s-12 S-13 s-1 s-2 s - 3 5-8 s - 9 s -10 s-11 s-12 S-13 s- 1 s - 2 5 -3 S-8 s-9 s-10 s-11 s-12 S-13 s- 1 s-2 s - 3 5-8 s - 9 s- 10 s-11 5-12 S-13 190F 3544F s-1 s - 2 5-3 S-8 s - 9 s -10
3-1408 B-1433 B-1434 B-1435 B- 1436 B-1437 B-1438 3- 1439 B- 1440 B-1441 B-1474 B-1475 B-1476 B-1477 B- 1478 B-1479 B-1480 B-1481 B-1482 B- 1507 B-1508 B-1509 B-1510 B-1511 B-1512 B-1513 B-1514 B-1515 B-1548 B-1549 B- 1550 B-1551 B-1552 B- 1553 B-1554 B- 1555 B-1556 B-1557 B-1558 3-1583
B-1585 B- 1586 B-1587 B- 1588
B- 1584
5 84 5
25 14 5 2 4 2 2
59 2
36 14
523 56
6 2 2
14 3 9 8
709 7 1 8 2
30 25
6 1 7 15
365 126
9 2 2 1
5775 966
2 10 10
1231 168
10123185 1 O / 251 85 101251 85 101 251 85 10125185 101 251 85 10/25/ 85 10/25/85 101 251 85 10125185 10128185 10128185 10128185 10128185 l0 /28/85
10128185 10/28/85 10/28/85 10/28/85 10/29/85 101 291 85 10/29/85 10/29/85 10/29/85 10129185 10/29/85 10129185 10131 f 85 101 3 1 / 85 10/31/85 10/31/85 10/31/85 10131185 10/31/85 10131185 1013 1 / 85 101 31 185 101 31 / 85 11 /01/85 11/01 / 85 11/01/85 11/01/85 11/01/85 1110 1/85
io / 281 85
1400 1400 1400 1400 1400 1400 1400 1400 1400 1400 1500 1500 1500 1500 1500 1500 1500 1500 1500 1500 1500 1500 1500 1500 1500 1500 1500 1500 1515 1515 1515 1515 1515 1515 1515 1515 1515 1515 1515 0900 0900 0900 0900 0900 1000
Y e s Yes Yes Y e s Y e s Yes Y e s Y e s Y e s Yes Yes Yes Yes Y e s Y e s Y e s Yes Y e s Y e s Y e s Y e s Y e s Y e s Yes Yes Yes Yes Y e s Y e s Y e s Y e s Y e s Y e s Y e s Yes Y e s Yes Y e s Yes Y e s Y e s Yes Y e s Y e s Yes
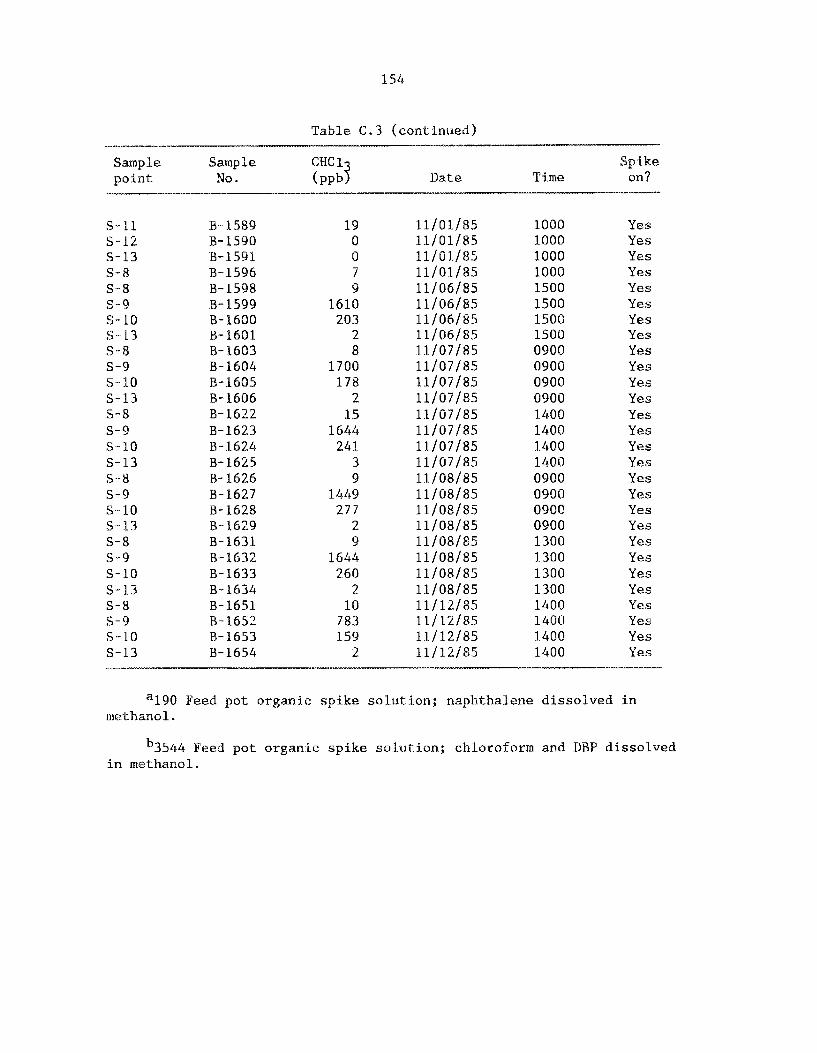
154
Table C. 3 (cont inued)
Spike Date T i m e on?
Sample Sample pQ i n t No.
s-11 s-12 S-13 s-8 5-8 s-9 s-10 S- 13 5-8 s-9 s-10 S-13 5-8 S-9 s-10 5-13 S-8 s-9 S-10 54-13 5-8 S-9 s -10 s - 1 3 S-8 s-Id s- 10 S-13
R- 1589 B- 1590 8-1591 B-1596 13- 1598 B- 1599 B- 1600 B- 1601 B- I603 B- 1604 B- 160% B- I606 B-1622 €3-1623 R- I624 13-1625 R- 1626 18-1627 B- 1628 B- 1629 B-1631 B- 1632 E-1633 B- 1634 B- 1651 B- 1652 R- 1653 B- 1654
19 0 0 7 9
1610 203
2 8
1700 178
2 15
1644 24 1
3 9
1449 277
2 9
1644 260
2 10
783 159
2
11/01/85 11/01/85 11/01/85 11/01/85 11 /06 / 85 11/06/85 11/06/85 11/06/85
11/07/85
11/07/ 85 11/07/85 11/07/85 11/03/85
11/08/85 11/08/85 11/08/85 11/08/85
11/08/85 11/08/85 11/08/85 11/12/85 11/12/85 11 /12/85
11 /07 / 85
11/07/85
11/87/85
11/88/85
11/12/85
1000 1000 1000 1000 1500 1500 1500 1500 0900 0900 0900 0900 1400 1400 1400 1400 0900 0900 0900 0900 1300 1300 1300 1300 1400 1400 1400 1400
Yes Yes Yes Yes Yes Yes Y e s Yes Yes Yes Yes Yes Yes Yes Yes Yes Yes Yes Yes Yes Yes YES
Yes Y@S Yes Y e s Yes Y e s
a190 Feed po t organic s p i k e solution; naphthalene d i s so lved i n methanol .
b3544 Feed pot organic spike solution; chloroform and DBP d i s so lved i n methanol.

155
Table C.4. Semi-volatile organics results from the mini-pilot plant ~- -
Dibutyl Sample Sample Naphthalene Phthalate Spike point No. (PPb) ( PPb 1 Date Time on?
ACDa s-3 5-8 s-9 s-10 s-11 s-12 5-13 5-3 S-8 s-9 s-10 s-11 s-12 S-13 190Fb 3544FC s-3 S-8 s-9 s-10 s-11 s-12 S-13 190P 3544F s-3 S-8 s-9 s-10 s-11 s-12 S-13 190F 3544F s-3 5-8 s-9 s-10 s-11 s-12 S-13
B-0731 B-0736 B-0738 B-0741 B-0741 B-0745 B-0748 B-0974e B-0975 B-0976e B-0977 B-0978 B-0979 B-0980 B-098ld B-0982d B- 1004d B- 1005 B-1006e B-1007 B-1008 B-1009 B-1010 B-lOlld B- 1012d3 B-1031f B-1032f B-1033f B- 1034f B- 1035f B-1036 B-1037f B-1038f B-103gf B-1077 B-1078 B- 107ge B- 1080 E- 1081 B-1082 B-1083
7 2 2 2 4 4 4 5 2 25 5 6 9 9 9
23800 1206 128 9 12 6 10 11
8 4908 559 7 6 5 4 6 5 6 5 6 27 5 4 4 7 11 8
9 7 3 0 0 5 7 4 1 6 1 3 15 10 13
206500 5600 55 13 35 3 19 14 13
18040 1962
6 8 13 15 3 5 6 8 0 8 1 0 0 18 33 15
06/01/85 08/07/85 08/07/85 08/07/85 081 071 85 08/07/85 08/07/85 08/07/85 08/29/85 08/29/85 08/29/85 O B / 29/85 08/29/85 081291 85 08/29/85 08/29/85 08/29/85 08/29/85 08/29/85 08/29/85 08/29/85 08/29/85 08/29/85 08/29/85 08/29/85 08/29/85 08/30/85
08/30/85 08/30/85 08/30/85 08/30/85 08/30/85 08/ 30185 08/30/85 09/03/85 09/03/85 09/03/85 09/03/85 09/03/85 09/03/85 09/03/85
08/30/85
0800 1900 1900 190Q 1900 1900 1900 1900 1700 17Q0 1700 1700 1700 1700 1700 1700 1700 2140 2140 2140 2140 2140 2140 2140 2140 2140 1000 1000 1000 1000 1000 1000 1000 1000 1000 1715 1715 1715 1715 1715 1715 1715
NO NO NO NO
No No NQ No Yes Yes Yes Yes Yes Yes Yes Yes Yes Yes Y e s Yes Yes Yes Yes Yes Yes Yes Yes Yes Yes Y e s Yes Yes Yes Yes Yes Yes Yes Yes Yes Yes Yes Y e s

156
Table C,4 (continued)
D i but y 1 Samp1.e Sample Naphthalene Phthalate Spike p o i n t No. (PPb) (PPb) Date T i m e on?
190F 3544F s - 3 s-a S-9 s-10 s-11 s-12 s-13 190F 3544P s-3 s-8 S-9 S-10 s-11 s-12 S-13 190F 3544F s - 3 5-8 s-9 s-10 s-11 s-12 s-13 190F 3544P s - 3 s-8 s-9 S-1.0 s-11 s-12 s-13 190F 3544F s - 3 S-8 s-9 S-10
B- 1084 B- 108Sd B- 1109 B-1110 B- l l l le B-1112 €3-1113 B-1114 B-1115 B-11 16d
€5-1139 B-1140 B- 1141" B-1142 B-1143 B-1144 B-1145 B-1 146d 8- 1 147d B-1207e €3-1208 B- 1209@ B-1210 B-1211 B-1212 3-1213 A-1214d B-1215d B- 1239 B-1240 B-1241 B- 1242 B- 1243 A- 1244 B- 1245 B- 1246d B-1247d B- 1273 B-1274 B-1275 B-1276
B-1117d
17348 89 56 14 4 5 6 5
13 34502
2791 44 13 5 4
10 10 22
1790 325
60 7 4 4 8 4
15 17453
71 73
7 4 7 8 8 9
97009 420
36 16
0 0
57339 247 299
23 6 2
18 8
25
8727 215
23 2 0
13 23 42
346296 1618
232 10
2 8
35 1
90 57457
170 297
1 0 2 4
14 20
306770 4420
46 1 2 40
130
i146a2
09/03/85 09/03/85 09/04/85 09/04/85 09/04/85 09/ 04/ 85 09/04/85 09/04/85 09/04/85 09/04/85 09/04/ 85 09/ 04/ 85 09/04/85 09/04/85 09/04/85 09/ 04/ 85 09/04/85 09/04/85
09/04/85 09/09/85 09/09/85 09/09/85 09/09/85 09/09/85 09/09/85 09/ 09/ 85 09/09/85 09/09/85 09/ 10/85 09/10/85 09/10/85 09/10/85 09/10/85 09/ 10/85
09/10/85 091 10/85 10/17/85 10/17/85 10/17/85
09/04/85
09/ 10/8S
10/17/85
1715 1715
0830 0830 0830 0830 0830 0830 0830 0830 1240 1241% 1240 1240 1240 1240 1240 1240 1240 1500 1500 1500 1500 1500 1500 1500 1500 1500 0830 0830 0830 0830 0830 0830 0830 0830 0830 1500 1500 1500 1500
0830
Yes Yes Yes Y e s Yes Yes Y e s Yes Yes Yes Yes Yes Yes Yes Yes Yes Yes Yes Yes Yes Yes Y e s Yes Y e s Y e s Y e s YES Y e s YES Yes Yes Yes Y e s Y e s Yes YES Yes Y e s Y e s Yes Yes Yes

157
Table C. 4 (continued)
D i b u t y l Sample Sample Naphthalene Phthalate Spike point No. (PPb) (PPb) D a t e Time on?
s-11 s-12 5-13 190F 3544F s-3 S-8 s-9 s-10 s-11 s-12 S-13 190F 3544F s-3 S-8 s-9 s-10 s-11 s-12 S-13 190F 3544F s-3 S-8 s-9 s-10 s-11 s- 12 S-13 s- 1 5-2 s-3 S-8 S-9 s-10 s-11 s-12 S-13 s- 1 5-2 5-3 S-8 s-9 s-10 s-11 s-12
B-1277 B-1278 B-1279 B-1280 B-1281 B-1303 B- 1304 B-1305 B-1306 B-1307 B-1308 B- 1309 B-1310 B-1311 B-1354 B-1355 B- 1356 B-1357 B- 1358 B- 1359 B-1360 B-1361 B-1362 B- 1393 B- 1394 8- 1395 B-1396 B-1397 B-1398 B-1399 B- 1424 B- 1425 B- 1426 B-1427 B-1428 B-1429 B-1430 B- 1431 B- 1432 B- 1465 B- 1466 B-1467 B- 1468 B-1469 B-1470 B-1471 B- 1472
0 0 0
195 0 22 93 9 53 0 0 0
192 0 29 71 6 12 0 0 0
145 0
112 70 12 0 0 0 0 0 0 0 0 0 0 0 0 0
1099 0
598 416
0 35 32
0
220 190 140
0 132 170 160 140 164 106 99
0 137 100
0 50 66 50 50 50
0 87
0 0
117 50 50 40 30 45 67 50 60 40 45 37 38 40 0 52
0 0 43 3 1
51
189
101 17/85 10/17/85 10/17/85 10/17/85
10/18/85 10/18/85 101 18/85 10/18/85 10/18/85 10/18/85
10/18/85 101 18/85 10122185 101 221 85 101221 85 10122185 10/22/85 10122185
10122135 101 22 135 10123135 10123185 10/23/85 10123185
10/17/85
101 18/85
10/22/85
101 231 85 10123185 10123185 1 Q/ 25 1 85 10125185 10/25/85 101251 85 10/25/85 10125185
10/25/85 10/25/85 10/28/85 10128185 10128185 10128185
10/25/85
10/28/85 io/28/8s 10/28/85 10/28/85
1500 1500 1500 1500 1500 0900 0900 0900 0900 0900 0900 0900 0900 0900 1300 1300 1300 1300 1300 1300 1300 1300 1300 1400 1400 1400 1400 1400 1400 1400 1400 1400 1400 1400 1400 1400 1400 1400 1400 1500 1500 1500 1500 1500 1500 1500 1500
Y e s Y e s Y e s Y e s Y e s Y e s Y e s Y e s Y@S Y e s Y e s Y e s Y e s Yes Yes Yes Yes Y e s Yes Yes Y e s Y e s Y e s Y e s Y e s Y e s Y e s Y e s Y e s Y e s NO NO
NO
No NO No No NO No Y e s Y e s Y e s Y e s Y e s Y@§ Y e s Y e s

158
D i b u t y 1 5 anp Le S m p le Naphtha lene Phtkn la t e S p i k ? po i nt No. ( PPb) ( PPb 1 Date Time? on?
s-13 s-1 s-2 s-3 5-8 s-9 S-10 S-E1 s-12 S-13 s- 1
S-3 s-8 s-9 5-10 s-ll S-12 5-13 190P 3544E’ s- 1 s-9 L
s-3 s-8 5-9 s- 10 s-11 s-12 S-13 s-s
c?-7 ,2 h
B.- 1473 B -. 149 8 B- 1499 B- I500 B-P501 B-1562 B .. 15 r3 a B- 1504 B-1505 B-1506 3-1537 B- 1538 B-1539 B- 1540 B-1541 B- 1542 B- 1543 B- 1.544 B- 1545 B- I546 B- 1547 B- 1574 R-1575 €3-1576 B-1577 B-1578 B - 1579 B- 1580 B-1582 8.- 158% El- 159s
0 48 18
100 286 557
9 0 0 0
381 30 sa;
384 14 0 0 0 0 0
174 326
44 480 582 102
0 0 0 0
573
35 100 100
13 220
0 40 15 25 2 5
250 25 25 25 0 0 0 0 0
5069Q 13070 4000
0 159
0 0 0 0 0 0
30
lO/ZS/SS 10/29/a5 1 0 / 29 / 8.5 10/29/85 1 o / 29/ 85 10/29/85 101 29/ 85 10/ 29/ 8.5 10/29/85 10/29/85 10/ 3 1 / 85
10/ 31/85 10/31/85 10/3 1 / 85 10/31/85 10/31/85 10/31/85 10/31/85 10/31/85 10/31/85
1 1 / 0 1 / 8.5 11 / O 1/ 85 11/01/85 11 / 0 1/85 11/01/85 11/ 0 1/85 11/01/85 11/01/85 11/01/85
aead31lss
11/01/85
1500 1000 1000 1000 1008 1000 1000 1000 1000 1000 1515 1515 1515 1515 153.5 1515 1515 1515 1515 1515 1515 0900 OQOO 0900 0900 0900 1000 1000 1000 1000 1000
Yes Yes Yes Yes Yes Yes Yes Yes Yes Yes YES
Yes YES
Yet3 Yes Yes YES
YES
Y e s Y e s Y e s Yes Y e s Y e s Y e s Y e s Yes Y e s Y e s Y e s Yes
aACh) d e t e c t i o n l i m i t s .
%eed p o t o rgan ic s p i k e sclvtiorr f o r Pond 190 w a t e r ; naphthalene dissolved i n methanol.
@Feed po t organic s p i k e s o l u t i o n f o r Bui ld ing 3544 water; ch1oroEor-m and DBP d i s so lved i n methanol.
“Samples gave very high p r e s s u r e drop during e x t r a c t i o n . Resu l t s may be low.
r *Samples experienced very i r r e g u l a r flow during e x t r a c t i o n . 12esukl-s
may be suspec t .
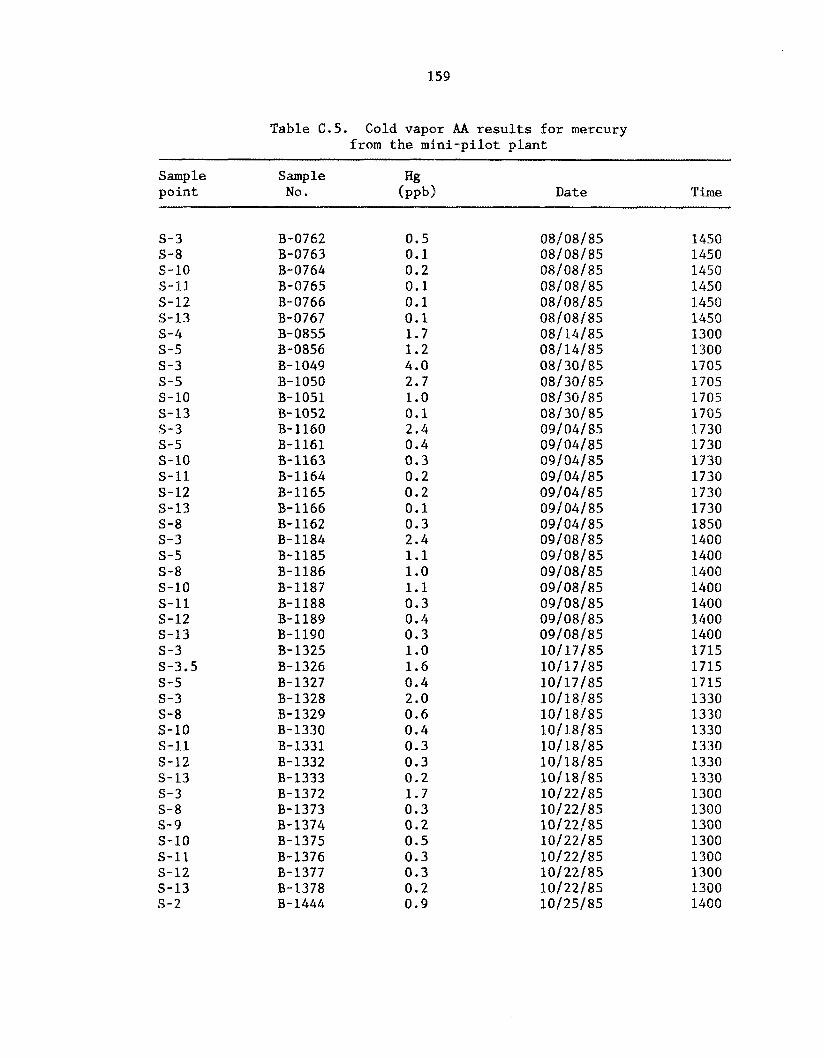
159
Table C.5. Cold vapor AA results for mercury from the mini-pilot plant
Sample Sample HE4 point No. (PPb2 Date Time
s - 3 S-8 s -10 s-11 5-12 S-13 s - 4 s-5 5-3 s-5 s-10 5-13 s-3 5-5 s- 10 s-11 5-12 5-13 S-8 s-3 s-5 S-8 s-10 s-11 s-12 S-13 s-3 s-3.5 s-5 s - 3 S-8 s -10 s-11 5-12 S-13 5-3 S-8 s - 9 s -10 s-11 s- 12 S-13 s-2
B-0762 B-0763 B-0764 B-0765 B-0766 B-0767 B-0855 B-0856 B- 1049 B-1050 B-1051 B- 1052 B- 1160 B-1161 B-1163 B-1164 B-1165 B-1166 B-1162 B-1184 B-1185 B- 1186 B-1187 B-1188 B-1189 B-1190 B- 1325 B-1326 B-1327 B- 1328 B-1329 B-1330 B-1331 B-1332 B- 1333 B-1372 B-1373 B- 1374 €3-1375 B-1376 B-1377 B-1378 B-1444
0.5 0 .1 0.2 0 .1 0.1 0 .1 1 . 7 1.2 4.0 2.7 1.0 0.1 2.4 0.4 0.3 0.2 0.2 0.1 0.3 2.4 1.1 1.0 1.1 0 . 3 0.4 0.3 1.0 1 .6 0.4 2.0 0.6 0.4 0.3 0.3 0.2 1 . 7 0 .3 0.2 0 .5 0 .3 0 .3 0.2 0.9
08/08/85 08/08/85 08/08/85 08/08/85 08/08/85 08/08/85 08/14/85 08/14/85 081 30/ 85 08/30/85 08/30/85 081 30/ 85 09/04/85
09/04/85 09/04/85 09/04/85 09/04/85 09/04/85 09/08/85 09/08/85 09/08/85 09/08/85 09/08/85 09/08/85 09/08/85 10/17/85 101 17/85 101 17 / 85 10/18/85 10/18/85 10/18/85 10/18/85 10/18/85 l o / 18/85 10/22/85 10122185 10/22/85 10/22/85 10/22/85 10/22/85 101221 85 101251’85
09/04/85
1450 1450 1450 1450 1450 1450 1300 1300 1705 1705 1705 1705 1730 1730 1730 1730 1730 1730 1850 1400 1400 1400 1400 1400 1400 1400 1715 1715 1715 1330 1330 1330 1330 1330 1330 1300 1300 1300 1300 1300 1300 1300 1400

160
Table C . 5 (continued)
s-3 S-8 s-9 s-11 s-12 5-13 S-3 s-8 2-9 S-11 s- 12 5-13 MH2 2 I)
B-1616 B-1617 E-1618 8-1619 B-1620 B-1621 B-1668 B-1669 B-1670 B-1671 8-1679. 8-1673 m-229
2.2 0.4 0.9 0.3 0.3 0.2 1.5 0.4 0.4 0.3 0.2 0.2 5.4
11/Q7/85 11/07/85 11/07/85 11/07/85 11/07/85 11/07/85 11/ 14/85 11/14/85 11/ 14/85 11/ 14/85 11/14/85 11/ 14/85 01/14/86
1400 1400 1400 1400 1400 1400 1300 1300 1300 1300 1300 1300 1030

161
INTERNAL DISTRIBUTION
1. 2-6.
7 . 8-12.
13. 14. 15. 16. 17.
18-20. 21. 22. 23. 24. 2 5 . 26. 27. 28. 29. 30. 31. 32. 33 34.
35-36. 37. 38. 39. 40. 41. 42. 43.
J. F. Alexander J. M. Begovich J. B. Berry C. H. Brown, Jr. R, M. Canon K. W. Cook T. L. Donaldson B. M. Eisenhower D. E. Ferguson V. L. Fowler C. L. Fox R. K. Genung R. W. Glass C. W. Hancher M. V. Helfrich J. D. Hewitt J. R. Hightower F. J. Homan H. L. Jennings E. K. Johnson J. M. Kennerly L. C. Lasher D. L. Lennon R. E. Leuze L. E. McNeese D. R. McTaggart C. Miller M. E. Mitchell M. I. Morris F. R. Mynatt T. E. Myrick T. W. Oakes
44. 45-46.
47. 48. 49. 50. 51. 52. 53. 54 * 55. 56. 57. 58. 59. 60. 61. 62. 63.
67. 68. 69. 70. 71. 72. 73
74-75. 76. 77.
64-66
J. R. Parrott B. D. Patton W. W. Pitt D. R. Reichle A. L. Rivera S. M. Robinson P. S. Rohwer T. P. Scanlan C. B. Scott C. D. Scott B. M. Spanin C. L. Stair M. G. Stewart L. H. Stinton W. T. Thompson W. W. Thompson D. W. Turner V. L. Turner V. C. A. Vaughen J. F. Villiers-Fisher J. F . Walker D. M. Walls R. G. Wymer H. R. Yook E. L. Youngblood Central Research Library OWL-Y-12 Technical Library Document Reference Section Laboratory Records Laboratory Records, OWL-RC ORNL Patent Section
EXTERNAL DISTRIBUTION
78. R. W. Peters, Environmental Engineering, School of Civil Engineering, Purdue University, W. Layfayette, IN 47907
79. F. L. Culler, EPRI, 3412 Hillview Ave., Palo Alto, CA 94303 80. Director, Industrial Environmental Research Laboratory, U.S.
Environmental Protection Agency, Cincinnati, OH 45268 81. Director, U.S. Environmental Protection Agency, Research
Triangle Park, NC 27711 82. K. A. Debelak, Vanderbilt University, Nashville, TN 37235 83. W. W . Eckenfelter, Jr., Vanderbilt University, Nashville, TN
37235

162
84.
85.
86.
87.
88.
89.
90. 91. 92. 93.
94.
95-121.
M. Fuchs, Radian Gorp., 8501 Mo-Pac Blvd., P. 0. Box 9948, Austin, TX 78166 G. E. Bswald, Department of Public Works, City of Austin, P. 0 . Box 1088, Austin, TX 78767 G. R. Hill, Department of Civil Engineering, University a f Utah, Salt Lake City, ITT 84112 P. A , Krenkel, University of Nevada, P. 0. Box 60220, Rem, NV 89506 R. D. Neufeld, Environmental Engineering Program, 949 Benedum Hall, University of Pittsburgh, Pittsburgh, PA 15261 Office of Assistant Manager, Energy Research and Development, DOE-ORO, P. 0 . Box E, Oak Ridge, TN 37831 A . P. DuhameL, DOE-Environment, Washington, DC 20545 J. K. Alexander, DOE-ORO, P. 0. Box E, Oak Ridge, TN 37831 J. K . Eastman, DOE-QRO, P. 0. Box E, Oak Ridge, TN 37831 G. C. Patrick, Engineering-Science, Inc., Suite 590, 57 Executive Park South, NE, Atlanta, GA 30329 E. 8. Snider, Engineering-Science, I ~ C . ~ Suite 590, 57 Executive Park South, NE, Atlanta, GA 30329 Technical Information Center, Oak Ridge, TN 37831