report: treatability study of in situ technologies for
TRANSCRIPT

SDMS Document
109274
Treatability Study of In Situ Technologies for Remediation of Hexavalent Chromium in Groundwater at the Puchack Well Field Superfund Site, New Jersey
Final Report
Vince R. Veraieul Jim E. Szecsody Mike J. Tmex Carolyn A. Bums Don C. Girvin Jenry L. Phillips Brooks J. Devary Ashley E. Fischer Shu-Mei W. Li
January 2006
Pacific Northwest National Laboratory Richland, Washington 99354
3 0 2 9 5 1
n

DISCLAIMER
This report was prepared as an account of work sponsored by an agency of the United States Government. Neither the United States Government nor any agency thereof, nor Battelle Memorial Institute, nor any of their employees, makes any warranty, express or implied, or assumes any legal liability or responsibility for the accuracy, completeness, or usefulness of any information, apparatus, product, or process disclosed, or represents that its use would not infringe privately owned rights. Reference herein to any specific commercial product, process, or service by trade name, trademark, manufacturer, or otherwise does not necessarily constitute or imply its endorsement, recommendation, or favoring by the United States Government or any agency thereof, or Battelle Memorial Institute. The views arid opinions of authors expressed herein do not necessarily state or reflect those of the ^ United States Government or any agency thereof.
f
PACMC NORTHWEST NATIONAL LABORATORY ^ operated by BATTELLE
for tlie UNITED STATES DEPARTMENT OF ENERGY
under Contract DE-AC06-76RLO 1830
Printed in the United States of America
Available to DOE and DOE contractors from the Office of Scientific and Technical Information, P.O. Box 62, Oak Ridge, TN 37831;
prices available from (615) 576-8401.
Available to the public from the National Technical Information Service, U.S. Department of Commerce, 5285 Port Royal Rd., Springfield, VA 22161
3 0 2 9 5 1 f?

Executive S u m m a r y
This treatability study was conducted by Pacific Northwest National Laboratory (PNNL), at the request of the Enviromnental Protection Agency (EPA) Region 2, to evaluate the feasibility of using in situ treatment technologies for chromate reduction and immobilization at the Puchack Well Field Superfund site in Permsauken Township, New Jersey. In addition to in situ reductive treatments, which included the evaluation of both abiotic and biotic reduction of Puchack aquifer sediments, nattiral attenuation mechanisms were evaluated (i.e., chromate adsorption and reduction). Chromate exhibited typical anionic adsorption behavior, with greater adsorption at lower pH, at lower chromate concentration, and at lower concentrations of other competing anions. In particular, sulfate (at 50 mg/L) suppressed chromate adsorption by up to 50%. Chromate adsorption was not influenced by inorganic colloids.
Results from long-term experiments indicate that natural chromate reduction occurs in Puchack sediments. Sediment composites of seven different Puchack aquifer units showed either no reduction or very slow chromate reduction (0.3 to 3.1 year half-life). However, three selected sediments showed much more rapid reduction (half lives: 49 h to ~3000 h;). Although the spatial variabiUty in natural reductive capacity appears to be relatively large, experimental results indicate that chromate reduction can remain viable even in the presence of dissolved oxygen. Most sediments that showed some natural reduction of chromate had very small reductive capacities (average 2.76 ± 1.02 umol/g), but one sediment had a large reductive capacity (636 umol/g) with considerable amorphous ferrous iron and 2.25% organic carbon (i.e., contained clays, iron oxides, and possibly lignite). There was wide variability in the iron oxide content of Puchack sediments.
Results from chemical reduction experiments on Puchack sediments, showed a considerable increase in the reductive capacity (average 60.2 ± 25.6 umol/g, maximum of 390 umol/g), indicating that reductive treatment may be an effective approach when deployed at the field scale. The average measured reductive capacity, assuming typical groundwater chemistry conditions, would result in a treatment zone longevity of 360 pore volimies or, for a uniform treatment zone 40 ft wide and an average groimdwater velocity of 1 ft/d, 39 years of treatment. It was also shown that reductive capacity is a ftmction of pH. The capacity of the sediment column to consume 2.0 mg/L chromate and 8.4 mg/L dissolved oxygen (saturated conditions) was estimated to be 310 pore volumes at pH 4.5 and 480 pore volumes at pH 7.0. Chromate reduction/immobilization was shown to be effective in four long-term column studies at pH 4.5 to 7.0, where chromate was removed in all columns initially, then partial chromate breakthrough occurred by 170 pore volumes (pH 4.5, 5.3), 280 pore volumes (pH 6.2), and 340 pore volumes (pH 7.0). There was no evidence of mobile Cr(in) species at any pH. Iron (II) mobility increased under acidic pH with 3.6 to 10.5% of the Fe(n) mobilized at pH 4.5 compared with 0.1 to
302952

0.35% at pH 7.0. Dithionite reduction of sediment, therefore, produced mainly immobile Fe(II) species in Puchack sediments; likely reduced structural iron in clays or mixed Fe(II/m) oxides.
Biostimulation of Puchack sediments would be difficult at the field scale, as iron-reducing bacteria were present in sediments at very low population densities of <20 cells per g sediment and sulfate-reducing bacteria were only detected in one sediment sample. In contrast, aquifers in E. and W. Washington show population densities of 10 to IO"* and greater, and are sufficient for biotic or coupled abiotic/biotic degradation.
In summary, the combination of natural chromate reduction (natural attenuation) and abiotic reduction (In Situ Redox Manipulation treatment with dithionite) of specific aquifer zones shows promise as an effective remedy for chromate contaminated groundwater at the I*uchack Well Field site. Although these studies confirm the presence of mechanisms attributing to the natural attenuation of chromate in the Puchack subsurface environment, the field scale effect of these mechanisms must be better quantified to determine the suitability of monitored natural attenuation (MNA) as a remedial altemative. Based on the EPA framework for the application of MNA (OSWER Directive 9200.4-17P), both bench and field scale data should be used when evaluating the site specific suitability of MNA as a remedy. In addition to chromate trend monitoring at the site, numerical groundwater flow and reactive transport models could be developed that incorporate the rate and treatment capacity data resulting from these studies. These models could be used to make predictions of long-term field scale attenuation of the Chromate plume and expected impact at potential receptor locations.
302953

Table of Contents
EXECUTIVE SUMMARY I
INTRODUCTION 1
1.1 Site Description 1 1.2 Site History 2 1.3 Site Hydrogeology 3 1.4 Treatability Study Objectives 4
BACKGROUND 5
2.1 Chromium Transport and Immobilization in the Subsurface 5 2.1.1 Cr speciation 5 2.1.2 Cr(Viy reduction and precipitation 6 2.1.3. Chromium adsorption 8
2.2 Abiotic Technology Description 8 2.2.7. Iron Reduction Mechanism 9 2.2.2. Sediment Oxidation and Chromate Reduction Mechanism 9 2.2.3. Trichloroethylene Reduction Mechanism 11
2.3 Biotic Technology Description 14 2.3.1. Direct Cr(VI) Reduction Approach 14 2.3.2. In Situ Reaction Zone Approach 75 2.3.3. Sulfate Reduction Process 75 2.3.4. Biotic Iron Reduction Process -..16
EXPERIMENTAL METHODS 18
3.1 Sampling 18 3.2 Sediment Physical Properties and Groundwater Analysis 18
5.2.7 Groundwater Analyses 75 3.3 Column Experiments 19
3.3.1 Sediment Reduction by Dithionite ; 19 3.3.2 Sediment Oxidation with dissolved O2 '. , 20 3.3.3 Chromium Transport in Untreated Sediments 27 3.3.4 Chromate Transport in Reduced sediments .27
3.4 Batch Experiments 22 3.4.1 Chromate Adsorption Edge 22 3.4.2 Chromate Adsorption Isotherm ; 22 3.4.3 Natural Attenuation Studies 22 3.4.4 Iron Extractions of Treated and Untreated Sediments 23
3.5 Biotic Studies 24 5.5.7 Sediments 24 3.5.2. Microbial Batch Tests 24
RESULTS....... 25
4.1 Sediment and Aqueous Sample Collection 25 4.7.7 Sediment Sample Collection 25 4.1.2 Sediment Physical Property Analysis 25 4.1.3 Groundwater Chemistry Analysis 33
4.2 Natural Attenuation of Chromate (Cr(VI)04) -Adsorption 37 4.2.7. Influence of Time and Solution Composition on Chromate Adsorption 37 4.2.2 Influence ofpHon Chromate Adsorption 39
3 0 2 9 5 4

iv M
4.2.3 Adsorption Isotherm - Influence of Chromate Concentration on Adsorption 41 4.2.4 Influence of Sulfate on Chromate Adsorption 42 4.2.5 Influence of Colloids on Chromate Adsorption 43
4.3 Natural Attenuation of Chromate - Reduction by Natural Aquifer Sediments 43 4.3.1 Rate of Chromate Reduction by Natural Aquifer Sediments 44 4.3.2 Influence of Dissolved O2 on the Natural Chromate Reduction Rate 49 4.3.3 Influence of Natural Organic Matter on the Natural Chromate Reduction Rate. 57 4.3.4 Redox Reactive Phases in Natural Puchack Sediments 52
A.A Chromate Reactive Transport in Natural Puchack Sediments 55 4.5 Chemical Reduction of Puchack Sediments 59
4.5.1 Barrier Capacity and Longevity 59 4.5.2 Redox Reactive Phases Produced with Dithionite Reduction 63 4.5.3 Trace Metal Mobilization with Dithionite Reduction 63
4.6 Chromate Immobilization and Changes in Other Metals in Reduced Sediments ..67 4.6.1 Chromate Transport and Reduction 67 4.6.2 Trace Metal Mobility Changes During Reduced Sediment Oxidation 69
4.7 Biostimulation 77
CONCLUSIONS 82
Chromate Adsorption 82 Chromate Reduction in Natural Puchack Sediments 83 Chromate Reactivity in Dithionite-Reduced Sediments 83 Biostimulation of Iron-Reducing and Sulfate-Reducing Bacteria 85 Recommended Future Studies 85
REFERENCES 88
APPENDIX A. PHYSICAL CHARACTERIZATION OF PUCHACK SEDIMENTS 94
APPENDIX B. CHROMATE ADSORPTION TO NATURAL SEDIMENTS 103
APPENDIX C. CHROMATE REDUCTION BY NATURAL ATTENUATION 108
APPENDIX D. SEDIMENT REDUCTIVE CAPACITY .......126
APPENDIX E. CHROMATE TRANSPORT AND REDUCTION 131
APPENDEX F. X-RAY DIFFRACTION SPECTRA 136
APPENDIX G. GROWTH MEDIA FOR BIOTIC STUDIES 140
3 0 2 9 5 5

List of Figures
2-1. StabiUty of Cr(ni/VI) at different pH and Eh 5 2-2. Cr(in) aqueous speciation at equilibrium 5 2-3. Solubility of (Cr,Fe)(0H)3 precipitates 6 2-4. Rate of chromium reduction by aqueous ferrous iron as a fimction of pH 7 3-1. Fraction collection of column effluent into anaerobic vials 19 3-2. Sediment column oxidation system with automated calibration of oxygen electrodes.. 21 4.1-1. Sieve analysis of sediment from 162.5' depth of MW-37S-C 26 4.1-2. Sieve analysis of sediment from 171.5' depth of MW-37S-F 26 4.1-3 Sieve analysis of sediment from 190.5' depth of MW-37S-G... 26 4.2-1. Time to reach a stable pH as chromate adsorption equilibrium is approached.... 39 4.2-2. Approach to chromate adsorption equilibrium 39 4.2-3. Dependence of chromate adsorption on pH 40 4.2-4. Chromate adsorption edge using two contact times 40 4.2-5. Chromate adsorption isotherm 41 4.2-6. Evaluation of potential interference of SO4 with Cr analysis 42 4.2-7. Decrease in chromate adsorption with an increase in sulfate 42 4.2-8. Reduction in the chromate K^with increasing sulfate 42 4.2-9. Evaluation of chromate adsorption to colloids 43 4.3-1. Reduction of chromate by selected natural aquifer sediments , 44 4.3-2. Reduction of chromate by sediment composites .'. 48 4.3-3. Comparison of chromate reduction for natural sediments with oxygen 49 4.3-4. Long term chromate reduction by a reduced sediment column 50 4.3-5. FTIR spectrum of the base soluble components of NRS-1 51 4.3-6. Chromate reduction rate a) NRS-land b) NRS-1 base/heat treated 51 4.4-1. Chromate adsorption at pH 4.8 and 3.85 during reactive transport 57 4.4-2. Chromate adsorption at pH 7 during reactive transport 57 4.4-3. Comparison of K versus pH from batch and column experiments 58 4.5-1. Oxidation of a reduced sediment column 60 4.6-1. Chromate transport in reduced sediment at pH 4.5 67 4.6-2. Chromate transport in reduced sediment at pH 5.3 67 4.6-3. Chromate transport in reduced sediment at pH 6.2 67 4.6-4. Chromate transport in reduced sediment at pH 7.0 67 4.6-5 Ferrous iron mobilization during chromate transport 68 4.6-6 Mobilization of iron during chromate transport 70 4.6-7 Mobilization of Hg and As during sediment oxidation 72
302956

List of Tables 1
' j 4.l-L Aquifer Core Samples for Well MW-36 27 '
4.1-2. Aquifer Core Samples for Well MW-37 28
4.1-3 Aquifer core samples for Well D-1 29 [ \
4.1-4. Aquifer core samples for Well D-2 30
4.1-5. Sediment Core General Physical Properties 31
4.1-6. List of Composite Sediments 32
4.1-7. Aqueous Samples Collected During Well Drilling 35 |
4.1-8. Field and Laboratory Analysis of Aqueous Samples 36
4.2-la. Water quality data from Puchack monitoring wells 38 j")
4.2-lb. Composition of synthetic groundwater used in adsorption experiments 38 ^'
4.3-1. Sediments used in studies of natural chromate reduction 44 ,-,
4.3-2. Natural attenuation rates of chromate observed in experiments 45 , |
4.3-3. Carbon analysis of selected sediments 46
4.3-4. Natural sediment reductive capacity and iron phases 53
4.5-1. Dithionite-reduced sediment reductive capacity and iron speciation 62
4.5-2. Metal mobility during sediment reduction in columns 65 1
4.5-3. Hg mobility during reduction and oxidation 66
4.6-1. Iron mobility during reduced sediment oxidation..... 71 )
4.6-2. Metal mobility during sediment oxidation at pH 4 73 - '
4.6-3. Metal mobility during sediment reduction at pH 5.3 74 , ,
4.6-4. Metal mobility during sediment oxidation at pH 6.2 75 l ]
4.6-5. Metal mobility during sediment oxidation at pH 7.0 76
4.7-1. Puchack Sediment Cores Selected for Microbiology Studies 79 i
4.7-2. Summary of Iron-Reducing Bacteria Enumeration and Emichment 80
4.7-3. Summary of Sulfate-Reducing Bacteria Enumeration and Enrichment 81 j
5-1. Influence of pH on Reduced Sediment Barrier Longevity 84
• ' )
I ,. i
302957

Introduction
This report describes results from bench scale laboratory experiments documented in a test plan entitled Bench Scale Test Plan: Treatability Study of In Situ Technologies for the Remediation of Hexavalent Chromium in Groundwater. These treatability studies were conducted using sedirtient and groundwater samples collected from the Puchack Well Field Superfund Site in Permsauken Township, New Jersey. Results are reported for specific laboratory experiments that were conducted to evaluate mechanisms that could contribute to attenuation of the chromate plume and potential technologies for the remediation of chromate contaminated groundwater. Three general categories of technologies that were evaluated include: a) abiotic reduction of ferric oxides in sediments to create a reduced zone (In Situ Redox Manipulation or ISRM), b) biostimulation (nutrient injection) of the natural microbial population to create a reduced zone, and c) natural attenuation of the chromate plume.
1.1 Site Description
The Puchack Well Field Superfvind Site is located in a commercial/industrial and residential neighborhood of Pennsauken Township, Camden County, New Jersey. Because of the nature and complexity of the Site, involving a large contaminant plume containing chromium and numerous volatile organic compounds, the United States Environmental Protection Agency (EPA) is handling the investigation and cleaiiup in two distinct phases, called operable units. Operable Unit 1 (OUl), deals solely with the investigation and cleanup of Site contaminated groundwater. Operable Unit 2 (0U2), deals with the investigation and clean up of the source areas that contributed to the groundwater contamination.
Puchack Well Field Superfund Site OUl (Puchack OUl) is defined by the location of the chromiiom contamination in groundwater, which is defined by the 100 microgram per liter {[ig/L) chromium isoconcentration line. The 100 fxg/L chromium isoconcentration line was chosen because this is the EPA and the New Jersey Department of Environmental Protection (NJDEP) Maximum Contaminant Level (MCL) for chromium. Since the shape of the chromium 100 [igfL isoconcentration line may change over time in response to groundwater flow and other geochemical factors, the boundaries of OUl may shift.
The Puchack Well Field is located vsdthin OU 1 and consists of six public supply wells that are owned and were operated by the City of Camden. The six public water supply wells are referred to as Nos. 1, 2, 3 (also referred to as 3 A), 5 (also referred to as 5A), 6, and 7. During operation, the six wells had a combined capacity of six million gallons per day (mgd). The area surrounding the well field is used for residential, commercial, and industrial purposes. Several hundred single and multi-family residential buildings, commercial buildings, and industrial facilities are located within a two-mile radius of the site. One section of the Pennsauken Industrial Park is located approximately
302958

one-half mile to the northeast of the site while another section of the industrial park is located approximately one-quarter mile to the southwest. Conrail railroad tracks are situated approximately 500 feet to the northeast and southeast of the well field and the ' ) tollgate for the Betsy Ross Bridge (Route 90) is located approximately 250 feet to the i east.
1.2 Site ffistory
Contamination was first detected at the Puchack Well Field in the early 1970s with the presence of trichloroethane (TCE), 1,2-dichloroethane (1,2-DCA), tetrachlorethane (PCE), and chromium compounds in well No. 6. Further sampling indicated the presence of total and hexavalent chromium at concentrations above the U.S. Public Health Standards Maximum Contaminant Level (MCL), which resulted in the well being removed from service in 1975. In 1978, chxomivim was detected in Puchack Well No. 5. In 1982, chromium was detected in Puchack Well Nos. 2, 3, and 7. Historical chromium concentrations ranged from 1500 to 3000 micrograms per liter (ug/L). In 1984, general use of the Puchack Well Field was terminated, and all wells were removed from service, except for Well No. 1, which under permit, NJDEP allowed to be pumped at approximately 800,000 gallons per day, to help prevent the plimie from spreading to other public supply wells. Well No. 1 was removed from service in March 1998. The area encompassed by the Puchack Well Field is approximately 450,000 square feet, or 10.33 acres.
In 1986, Camp Dresser and McKee (CDM) investigated the chromium contamination in the well field on behalf of the NJDEP. CDM foimd chromium concenfrations up to 1000 ppb, mercury concentrations up to 5.8 [xgfL, and TCE concentrations up to 70 \xgfL in the well field. However, according to NJDEP, in October 1989, the highest chromium concenfration ever in a water supply well in NJ was detected in Puchack supply well No. 3 at a concentration of 4,180 [xg/L.
In March of 1996, NJDEP collected additional groundwater samples from the Puchack supply wells and monitoring wells. Samples were analyzed for VOCs, total metals, and cyanide. Analytical results indicated the continued persistence of chromium, low concentrations of mercury, and TCE in all Puchack water supply wells. Detected chromium concentrations ranged from 46.6 [xg/L in Well. No. 1 to 1,410 \xgfL in Well No. 7. Mercury concentrations ranged from 0.15 [xg/L in Well No. 6 to 0.77 |j,g/L in Well No. 2. TCE concenfrations ranged from 0.3 pig/L in Well No. 5A to 20 \ig/L in Well No. 2 (Weston 1997).
Several contaminated sites were identified by NJDEP in Pennsauken TowTiship in the early 1980s. Potentially contaminated sites located within or near the Puchack Well Field Site include SGL Modem Hard Chrome Service (SGL Chrome), King Arthur, Mercon, and Supertire, among others. The SGL Chrome site was used for chromium plating and is currently a parking lot with no structural features remaining.
302959
In 1997, the NJDEP and the United State Geological Survey (USGS) initiated an investigation of the groimdwater contamination of the Pennsauken Township area. Groundwater contaminated with chromium was found in the Middle Aquifer in two isolated areas, one is located at the SGL Chrome property and one area located to the north that is not related to the site (associated with the Permsauken Landfill). The SGL site is also the location of the highest chromium groundwater contamination in the Middle Aquifer at 8,000 [xg/L. As a result, it is suspected that the SGL site is a major contributor of chromium contamination to the groundwater. It is suspected that chromium contamination migrated from the SGL site into the Middle Aquifer, then to the Intermediate Sand layer, and finally to the Lower Aquifer. There may be other potential chromium sources within the area that will be investigated during the OU 2 Remedial Investigation. The chromium plume in the Intermediate Sand has migrated towards the east, while the chromium plume in the Lower Aquifer had been drawn back towards the north under the influence of the Puchack Well Field pumping. Chromium levels in the Middle Aquifer, Intermediate Sand, and Lower Aquifer generally range from 700 to 8,000 \i§/L, from 1,000 to 6,000 \xg/L, and from 200 to 1,500 [ig/L, respectively.
VOC contamination is more widespread, with multiple sources, and is present in pockets near contaminant source areas. VOCs detected include PCE; TCE; 1,1-dichloroethene (1,1-DCE); 1,1,1-trichloroethane (1,1,1-TCA); dichloromethane; and benzene. VOC contamination in the three aquifer levels has commingled with the chromium plume and is generally larger in size. Total VOC levels in the Middle Aquifer, Intermediate Sand, and Lower Aquifer generally range from 3 to 700 =jj,g/L, 5 to 140 jxg/L, and 1 to 50 \xgfL, respectively.
In 1997, the NJDEP recommended the Puchack Site be listed on the National Priorities List (NPL), to be addressed under CERCLA, as a Superfund Site. The Puchack Site was proposed for inclusion on the NPL in September of 1997. The Puchack well field became final on the NPL on March 6, 1998, and EPA became the lead agency for this site. NJDEP is the support agency.
1.3 Site Hydrogeology
The Puchack Well Field Site is situated in the outcrop area of the Potomac-Raritan-Magothy (PRM) aquifer system in the New Jersey Coastal Plain physiographic province. This aquifer system is the primary source of drinking water in northwestern Camden County. Groundwater is still being used for potable water in several nearby well fields including Morris and Delair well fields to the northwest, Park Avenue well field to the east, Marion and Woodbine well fields to the southeast, and Browning well field to the south. Some of these well fields are contaminated with volatile organic compounds (VOCs). As a result, water pumped from some of these well fields is freated to remove organic compounds prior to distribution for public use.
The PRM aquifer system is a high yielding formation with several sfratigraphic layers. These include the Upper Aquifer, Upper/Middle Confining Unit, Middle Aquifer,
302960

Middle/Lower Confining Unit (which contains an intermediate sand layer), Lower Aquifer, and Lower Confining Unit (bedrock). In the vicinity of the site, the major aquifer units include the Upper Aquifer (0 to 20 feet below ground surface (ft bgs)). Middle Aquifer (30 to 60 ft bgs), Intermediate Sand (100 to 120 ft bgs), and Lower Aquifer (160 to 250 ft bgs). These hydrostratigraphic layers dip to the east. The water table typically is encountered at 30 to 50 ft bgs and due to pumping from inland well fields, groundwater flow is generally towards the east, away from the Delaware River.
1.4 Treatability Study Objectives
The primary objective of this study was to determine the feasibility of using an abiotic or biotic technology to create a subsurface reduced zone in the aquifer that will reduce and permanently immobilize Cr(VI) species. In addition, natural processes such as chromate adsorption and reduction were assessed with Puchack aquifer sediments for two reasons: 1) to determine how much Cr(VI) mass could be immobilized naturally in the subsurface with no freatment; 2) to quantify the effects of these natural processes on in situ reductive treatment. A secondary objective of the freatability study was to assess the technologies effectiveness for the treatment of VOC contamination (i.e., TCE). To date this objective has not yet been address and should if the client wishes be completed in time for our final report in January.
The specific objectives of testing the abiotic technology included: a) determine whether a stable (immobile) reduced sediment barrier can be created in Puchack sediments at pH 4.5 to 7.0, b) determine what the longevity of this barrier would be, and c) determine whether reduced sediments immobilize Cr(VI) species and reductively dechlorinate TCE at pH 4.5 to 7.0. The specific objectives of testing the biostimulation technology included: a) determine whether appropriate populations of microorganisms can be biostimulated within the Puchack sediments to catalyze either direct chromium (VI) reduction or reduction of iron and sulfate to establish a reduced sediment barrier, b) quantify the relevant microbial reduction processes and determine appropriate amendments to stimulate these processes, and c) assess the stability of the reduced Cr(in) species within a biologically-reduced sediment at pH 4.5 to 7.0. The specific objectives of the natural attenuation studies included: a) determine the influence of adsorption (i.e., how much Cr(VT) mass is on surfaces relative to in solution) and b) detennine whether there is any significant natural reduction of Cr(VI) species in the targeted aquifer units (primarily intermediate sand and lower aquifer units).
Experimental results provided in this report will provide the basis for developing an in situ freatment approach for the Puchack site, which may be subjected to pilot scale field testing. Results from both the bench and pilot scale testing would then be used along with hydrogeologic and well field operational information to determine locations for cost effective deployment altematives.
3 0 2 9 6 1

Background
Following is a discussion of the various elements that have been investigated to determine the efficacy of in situ treatment technologies for the remediation of hexavalent chromium in groundwater at the Puchack Well Field Superfund Site.
2.1 Chromium Transport and Immobilization in the Subsurface
In a reducing subsurface environment, whether natural or artificially created, hexavalent chromium contaminated groundwater can, under favorable pH and reducing (Eh) conditions, be reduced and be permanently immobilized as a mixed Cr-Fe precipitate. As the dissolved hexavalent chromium in an oxic environment (Figure 2-1, high Eh) enters the reducing environment, it will react with reduced species including ferrous iron and sulfides (and also organic matter or microbial enzymes) and be reduced to the trivalent form (Figure 2-1, low Eh). Once Cr(ni) precipitates form, they are extremely difficult to oxidize (and remobilize), even though under geochemical equilibrium conditions, Cr(VI) species should be formed.
As a consequence, Cr(lll) precipitates are permanently immobilized in subsurface systems at 4 < pH < 13 even under highly oxidizing conditions. This activation barrier for Cr(ni) oxidation is the basis for the success of in situ chromium immobilization.
2.1.1 Cr speciation Chromium occurs in the +2, +3, and
+6 oxidation states in water, although only +3 and +6 are common. Aqueous hexavalent chromium (as Cr(VI) species) are toxic and highly mobile, exhibiting no sorption at a pH >7 in most sediments. Cr(VI) species include HCr04' (pH < 6.5) and Cr04^" (pH >
pe i
15
10 -
5 -
0 -
-10 -
Figure 2-1. Stability of Cr(VI) and Cr(III) phases at equilibrium at different pH and Eh (Stumm and Morgan, 1996).
10'
io -»K\ \
1uppm
i(r»
lOppb
lOra
i(r">
T
Frontier Site
^' ' \ \ Vancouver,
s' . \ WA CrtHDr
L JCVJC crtOH)! \ *K r .... y"t\T
I Puchacw
• A \ '-•-. USlJ lAU i.
pH
Figure 2-2. Cr(ni) aqueous speciation at equilibrium without additional organic or inorganic liaands.
6.5) when Crtotai < 0.1 mol litef % and HCr207" (pH < 1), Cr207 ' (1< pH <7.5), Cr04-
302962

(pH > 7.5) when Crtotai > 0.1 mol liter"'. Common Cr(III) species (Figure 2-2) include Cr(0H)3 [aqueous and precipitate], Cr(0H)4" [pH > 9], CrOtf"", Cr(0H)2'', and Cr3(OH)4'^
5+, Although Cr3(OH)4 should dominate aqueous solubility at pH < 8, it is slow to form, and a state of nonequilibrium of these Cr(lll) species can exist in natural waters. Cr(in) complexes with many inorganic ligands (including sulfate, oxalate, ammonia, and fluoride) and organic ligands in natural waters. In contrast to the few Cr(VI) aqueous species, there are thousands of synthetic Cr(Ill)-ligand complexes used in various industries, so natural and synthetic Cr(in) complexes can be found in contaminated groundwater. In addition, metals including Cr have been found associated with suspended clay and organic matter (i.e., colloids), indicating the need to filter samples to separate out transport mechanisms. Because these aqueous Cr(ni) species can be oxidized to Cr(VI) species, total chromium [Cr(VI) and Cr(III) species] is the basis of EPA water-quality standards, even though only Cr(VI) is considered toxic.
2.1.2 Cr(VI) reduction and precipitation
Cr(VI) species that exist under highly oxidizing conditions are rapidly reduced to Cr(lll) species (rate described below). Over much of the pH range of natural waters, a Cr(0H)3 precipitate forms (Figure 2-1), where the small Cr(III) aqueous solubility is theoretically shown in Figure 2-2. An iron-reducing or sulfide environment (biotically or abiotically created) exhibits an order of magnitude less solubility than shown in Figure 2, because when trivalent chromium is precipitated as a nlixed (Cr,Fe)(OH)3 precipitate it has lower solubility. This effect was demonstrated in a series of mixed solubility experiments (Figure 2-3), where a lower fraction of Cr in the precipitate has much lower solubility than pure Cr(0H)3. The ratio of Cr/Fe in precipitates has also been quantified (Eary and Rai, 1988, Loyaux-Lawniczak et al., 2000; Patterson and Fendorf, 1997).
While the three example sites provided (Figures 2-1 and 2-2, two at the Hanford, WA site, and one at the Frontier site in Vancouver, WA) where the ISRM technology has been previously demonstrated cover the pH range from 6.5 to 8.3, evidence exists that aquifers at a pH as low as 4.1 will also reduce and form Cr(lll) precipitates that remain immobile. Under highly acidic conditions, CrOtf"^ and other aqueous Cr(III) species form, so reduction does not result in precipitated species. For a pure laboratory system containing only Cr(VI), these mobile Cr(ni) species form at a pH < 4.3 (Figure 2-2). As described above, the mixed (Cr,Fe) hydroxides that form have lower solubilities, so sediments with
Figure 2-3. Solubility of (Cr,Fe)(0H)3 precipitates with: a) 1% Cr, and b) 69% Cr, relative to theoretical Cr (0H)3 (Sass and Rai, 1987).
3 0 2 9 6 3

•
iron reducing conditions typically have a large excess of ferrous iron relative to the chromate. For example, the Frontier Hard Chrome site (Vancouver, WA) with 10 ppm chromate has 2500x more ferrous iron (46.1 fxmol/g reducible iron), which demonstrates why precipitates will typically contain a small Cr fraction. In a weathered shale (Jardine et al., 1999), natural ferrous iron present in the sediment at pH 4.6 results in significant chromate reduction and permanent immobilization, based on long-term (10 month) 1-D laboratory transport studies. At a landfill in northern France, ferrous iron in green clay at pH 4.1 has also resulted in the reduction and precipitation of Cr(VI) species (Loyaux et al., 2001). In contrast, at a pH of 3.0, Cr(ni) species remained in aqueous solution in an aquifer (Seaman et al., 1999), possibly due to acetate or sulfate complexation. Reduction and precipitation of Cr(VI) has also been demonstrated in the laboratory with amorphous iron sulfide from pH 5 to pH 8 (Patterson and Fendorf, 1997), with mackinawite (FeS) at pH 5 (Boursiquot et al., 2002), and wdth hydrogen sulfide from pH 6.5 to pH 10 (Kim et al.,2001).
In a natural subsurface system, the redox environment is controlled largely by microbial reactions and to a small extent, abiotic reactions. Oxidation of natural organic matter by dissolved oxygen, then nifrate, ferric iron, sulfate, and fiirther ecological succession reactions are all microbial mediated. Carbon addition to an electron donor limited aquifer (i.e., little organic matter) can stimulate microbial activity, driving the consumption of these election acceptors, as described in further detail in Section 1.4. At sites such as the Puchack well field with sufficient organic matter, sufficient reducing conditions can exist in specific localized zones (lignite deposits, for example. Murphy et al., 1992) that could reduce Cr(VI) species.
10000
1000
The rate of Cr(VI) species reduction by ferrous iron has been extensively studied in a variety of geochemical conditions. For a pH from 4.4 to 7.2, tiie Cr(VI) reduction rate decreases from seconds at pH 7 about three orders of magnitude by pH 4.4 (Figure 2-4; Buerge and Hug, 1997). At a pH > 10, and at lower pH in solutions containing significant phosphate, chromate is less efficientiy reduced by ferrous iron (Eary and Rai, 1988). In a field system, both ferrous iron and organic matter appear to influence the rate of Cr(VI) reduction, and a faster rate was observed with lower pH in one case (Anderson et al., 1994). The rate of Cr(VI) reduction by hydrogen sulfide increases significantiy with decreasing pH between pH 6.5 and pH 10, potentially due to the dependence of the reduction on the concentration of HjS (Kim et al., 2001). Data describing the rate of Cr(VI) reduction by iron sulfide materials is limited.
Figure 2-4. Rate of chromium reduction by aqueous ferrous iron as a function of pH (Buerge and Hug, 1997).
302964

2.1.3. Chromium adsorption At neutral and alkaline pH, chromate moves nearly unretarded in aquifers
(Fruchter et al., 1998), whereas under acidic conditions, considerable chromate sorption has been observed (Zachara et al., 1987; Jardine et al., 1999; Seaman et al., 1999). At a pH of 4.6 in a weathered shale, nonlinear sorption with an affinity parameter of 15.6 was observed (S (sorbed mass) = 15.6 C*' ^ where C = aqueous chromate mass). This sorption increased four fold with the addition of natural organic matter (NOM; S = 65 C"^'), indicating in this case, it appears that sorption was dominated by organic matter. Interestingly, this same sediment also exhibited some reduction of chromate, which did not change with the addition of organic matter. Sediments from the Savannah River site (pH 5.3, 5.52) exhibited some sorption, but apparently not related to organic matter. At high NOM (0. 76 g /lOO g), littie sorption was observed (K^ =0.1 cm^/g), whereas at low NOM(0. 02 g /lOO g), moderate sorption was observed (K^ =1.5 cm^/g; Seaman et al., 1999)
2.2 Abiotic Technology Description
The In Situ Redox Manipulation (ISRM) approach involves the creation of a permeable treatment zone downsfream of a contaminant plume or contaminant source through injection of a chemical reducing agent to alter the redox potential of aquifer fluids and sediments (Fruchter et al., 2000, 1994; Vermeul et al., 2002; Szecsody etal., 2003). Redox-sensitive contaminants migrating through this freatment zone are immobilized (metals) or destroyed (organic solvents). Injected reagents create the zone through reactions that reduce iron naturally present in aquifer sediments from Fe(III) to Fe(II). Use of standard wells for freatment zone creation allows treatment of contaminants too deep for conventional french-and-fill technologies.
This technology has been successfully demonstrated in two field tests at the Hanford Site in Washington State for the remediation of hexavalent chromium in the groundwater (Fruchter et. Al., 2000,1996; Williams et al, 2000). One site is a single-well demonstration, whereas the other site is a 65-well subsurface barrier that is 2300' long and installed in a 15 to 30 ft thick aquifer located approximately 85 ft below ground surface. A thfrd ISRM barrier has been installed to remediate hexavalent chromium in groundwater at the Frontier Hard Chrome Superfund Site, Vancouver, WA (Vermeul et al., 2003). In all cases, mobile Cr(VI) species at this pH (6.5 at Frontier, 7.5 to 8.3 at Hanford) have been reduced and immobilized to below detection limits.
The reducing agent used in these field and laboratory tests is Sodium Dithionite (Na2S204). Sodium Dithionite is a strong reducing agent and it possesses a number of desirable characteristics for this type of application, including instability in the natural environment (~ days) with reaction and degradation products, which ultimately oxidize to sulfate. A potassium carbonate/bicarbonate pH buffer is also added to the injection solution to enhance the stability of dithionite during the reduction of available iron.
.. . >
3 0 2 9 6 5

2.2.1. Iron Reduction Mechanism The dithionite chemical treatment dissolves and reduces amorphous and some
crystalline Fe(III) oxides': The reduced Fe(n) created by the dithionite chemical freatment appears to be present in several different Fe(n) phases: adsorbed Fe(n), Fe(II)-carbonate (siderite), and FeS (iron sulfite), although adsorbed Fe(n) appears to be the dominant Fe(n) phase. There may be other, unidentified Fe(n) mineral phases produced. Although more than one iron (HI) phase is likely reduced in a natural sediment, it can be useful to determine how simple a chemical model is needed to generally describe the observations. The reaction that describes a single phase of iron that is reduced by sodium dithionite:
S2O4-2 + 2=Fe3+ + 2H2O «> 2==Fe2+ + 2S03'2 + 4H+ (1)
demonstrates that the forward rate is a function of the dithionite concentration and the square of the reducible iron concentration (rate is overall a third-order function of concentration). The aqueous Fe(II) produced has a high affinity for surfaces, so is quickly adsorbed. Therefore, Fe(n) mobility in mid- to high pH, low ionic strength groundwater is extremely limited, and iron is not expected to leach from sediments during the dithionite treatment. Aqueous iron measurements in previous studies have shown < 1% iron leaching even after 600 pore volumes of groundwater through a sediment column. Corresponding solid iron measurements of sediments used in these columns showed 4-10% loss of iron. Iron mobility is somewhat higher during the actual dithionite injection because, at high ionic strength (~0.3 mol/L in this case), other cations compete for the same adsorption sites as Fe " , resulting in some Fe ^ desorption. If the number of slowly reducing sites is small and the mass of iron is far in excess of the dithionite, reaction 1 can be reduced to a first-order reaction in which Fe^^ remains constant. Another reaction occurs in the system, which describes the disproportionation of dithionite in contact with sediment:
2S2O4-2 + H2O O S2O3-2 + 2HSO3- (2)
This reaction accounts for the mass loss of dithionite that caimot be used for iron reduction. Previous studies have shown that this reaction has a half-life of ~27 h (basaltic sediments). The consequence of this reaction is to limit how slowly dithionite can be reacted with sediment in the field (i.e., minimum injection rate). If dithionite is injected too slowly, a significant amount of the mass is lost to disproportionation. Although iron(in) phases are the most significant phase that reacts with dithionite, other mineral phases present in natural sediments may also be reduced, and utilize some of the dithionite. Previous studies have shown that some Mn reduction occurs as a result of the dithionite treatment of Hanford sediment, although reduced Mn° phases were only 3 to 4% relative to reduced iron phases.
2.2.2. Sediment Oxidation and Chromate Reduction Mechanism The oxidation of the adsorbed and structural Fe(n) in the sediments of the
permeable redox barrier occurs naturally by the inflow of dissolved oxygen and other
302966

10
contaminants such as chromate, TCE, nitrate, uranium, or other electron acceptors. If redox equilibrium completely defined the mechanism (i.e., no effects from activation energies or surface catalysis) and the following contaminants were present in equal molar concentrations, they would be reduced in the following order:
chromate > dissolved oxygen > nitrate > uranium > pertechnetate > TCE (3)
In most aquifers, dissolved oxygen in water is the dominant oxidant of reduced iron species, as contaminants are generally present in lower molar concentrations relative to dissolved oxygen. The oxidation of reduced iron in pure mineral phases is described by the following reactions for dissolved oxygen and chromium. Fe(n) species that are known to exist in the dithionite-reduced sediments include adsorbed Fe(n) and siderite [Fe(n)C03]. A single mole of electrons is consumed as a mole of these species are oxidized:
Fe2+ <» Fe3+ + e' Eh =-0.771 v (4)
FeC03(s) + 3H2O <J Fe(0H)3(s) -1- 2H+ + HCO3- + e' (5)
The use of dissolved oxygen as an oxidant is generally divided into two electron sequences, which combined:
O2 + 4H+ + 4e- <» H2O, Eh = 1.23 V (6)
show that 4 moles of electrons are needed per mole of O2 consumed. The rate of this reaction (6) has generally been observed to be first-order at fixed pH and the rate increases 100 fold for a unit increase in pH. Experimental evidence during iron-oxidation experiments indicates that two differing reduced iron species is present (adsorbed ferrous iron and siderite). Combining the two iron oxidation half reactions with oxygen reduction:
4 = Fe2+ + O2 + 4H+ O 4 = Fe3+ + H2O Eh =-1.85 v (7)
4 s FeC03(s) + O2 + 4H+ <» 4 == Fe^+ + 2 H2O + 4C03^- (8)
yields 4 moles of Fe(n) are oxidized and 4 moles of elections transferred per mole of Oj consumed. At oxygen-saturated conditions (8.4 mg L"' Oj, 1 atm, 25°C), 1.05 mmol L"' Fe(n) is consumed. Experimental evidence indicates that the oxygenation of FeCH) in solutions (pH >5) is generally found to be first order with respect to Fe(II) and O2 concentration and second-order with respect to 0H-. The rate of oxidation of aqueous Fe "" by oxygen at pH 8 is a few minutes (Eary and Rai, 1988, Buerge and Hug, 1997). In contrast, the oxidation rate (as a half-life) observed in natural sediments [surface Fe(n) phases mainly adsorbed Fe(n) and Fe(n)C03] was foimd to be 0.3 to 1.1 h.
The reduction rate of Cr(VI) species by ferrous iron has been extensively studied under various geochemical conditions. For chromate:
Cr04- + 4H2O + 3e- O Cr(0H)3 + 50H- Eh =-0.13 v (9)
3 mole of electrons are consumed per mole of chromate reduced. Since the reduction potential of this half reaction (9) per electron is greater than that for oxygen (7), chromate
302967

11
reduction would proceed before oxygen and more rapidly in the presence of ferrous fron, if present in equimolar concentrations with dissolved oxygen (and activation energy did not affect the reaction rate). The reduction of one mole of chromate oxidizes three mole of Fe(n), or 41 mg L ' chromate is needed to oxidize the equivalent mass of Fe(II) as water saturated with dissolved oxygen [1.05 mmol L"' Fe(n)].
In a pure laboratory system, the Cr(VI) reduction rate (by aqueous ferrous iron) at pH 7.0 (seconds to minutes) decreases about two orders of magnitude as the pH decreases to 4.5 (Buerge and Hug, 1997). In natural aquifer sediments, however, the Cr(VI) reduction rate actually increases (Anderson et al., 1994) with lower pH, possibly due to both ferrous iron and organic matter.
2.2.3. Trichloroethylene Reduction Mechanism The degradation pathway of TCE by dithionite-reduced sediment has been
previously investigated in two bench scale studies as well as in at Ft. Lewis (Tacoma, WA) at the field scale. Degradation pathways for most organic compounds including TCE are complex, involving multiple and potentially parallel reaction steps. Of four possible abiotic degradation pathways for TCE, the two considered most common are reductive elimination and hydrogenolysis. Reductive elimination has been shown to be the major pathway in other studies using zero-valent and ferrous iron (Sivavec et al. 1996; Orth and Gillham 1996). Reductive elimination reactions include (Roberts et al. 1996):
TCE + 2e" <=> chloroacetylene + 2a"; Eh = 0.60 v (10) PCE - + 2e" <=> dichloroacetylene + 20"; Eh = 0.63 v (11) cis-, trans-DCE -h 2e- <=> acetylene + 2 0 - ; Eh = 0.56 v (12)
which describes the destruction of TCE and polychloroethylene (PCE) to easily degraded (abiotically or biotically) chlorinated acetylene products. Abiotic degradation of these products by hydrogenolysis:
dichloroacetylene + H* + 2e" <=> chloroacetylene + Q"; Eh = 0.56 v (13) chloroacetylene + ff + 2e' <=> acetylene + Q"; Eh = 0.50 v (14) acetylene + 2 ^ + 2e" <=> ethylene; Eh = 0.39 v (15)
apparentiy proceeds rapidly as chlorinated acetylenes are unstable (Delavarenne and Viehe 1969). The degradation of TCE to ethylene by reductive elimination (or hydrogenolysis discussed below) involves the production of 6 moles of electrons, or 22 mg L' TCE needed to oxidize the equivalent mass of Fe° as water saturated with dissolved oxygen (1.05 mmol L" Fe°). In the event that the reduced iron barrier is exhausted, previous laboratory studies with the Hanford lOOD and lOOH sediment have shown that sediment can be re-reduced with only a small (5% to 10%) loss in capacity. Hydrogenolysis reactions include:
TCE + H* + 2e- <=> 1,1-DCE (more likely) or cis-DCE + Q"; Eh = 0.51 v (16)
302968

12
1,1-DCE or cis-DCE + ff + 2e" <=> vinyl chloride + CI"; Eh = 0.41 v (17)
which describes the degradation of TCE involving the production then destruction of dichloroethylene (DCE) and vinyl chloride intermediates (generally more difficult to degrade). These reduction potentials are lower than reductive elimination, indicating they are less likely to occur abiotically. Activation energies and the specific electron transfer mechanism, which does involve the Fe™ oxide surface, may also influence which reactions actually do occur. Studies of TCE degradation pathways using zero-valent iron and various Fe° minerals (Roberts et al. 1996; Sivavec and Homey 1995; Thomton et al. 1998) indicate that reductive elimination is the major pathway, with minor amounts of DCE isomers and vinyl chloride produced from the hydrogenolysis pathway. One study also indicates that the DCE isomers and vinyl chloride slowly degraded to ethylene.
2.2.3.1. TCE Dechlorination Rate in Reduced Sediment The TCE reaction pathway can be used to model the observed rate of TCE
degradation. Because acetylene is the main reaction product observed in previous studies, the combination of reactions (6), (10), and (14) described the major TCE degradation pathway:
TCE + ff + 4Fe'^ <=> acetylene + 30" +4Fe'^ (18)
The mass flux equation for TCE:
dTCE/dt = -kf2o [TCE][Hl[Fe'^'' + -k o [acetylene] [CI"]' [Fe'^' (19)
describes mass fluxes as a function of each constituent concentration to each respective stoichiometric coefficient. A set of differential equations for all redox reactions can be numerically solved (55 mixed equilibrium and kinetic reactions with 71 species described in Szecsody et al. [1995, 1998a, 1998b]), but this type of detailed modeling is useful only if extensive knowledge of the reaction parameters exists. In the case of TCE degradation, not enough information is known about the reaction pathways and reaction parameters to justify this approach. Simpler models can be used to accurately describe the TCE degradation rate under specific conditions. The equation describing the TCE degradation rate can be greatiy simplified assuming no backward mass flux and that the pH is buffered:
dTCE'/at = -k'QolTCE][Fe'Y (20)
which shows that the TCE degradation rate is a function of a rate coefficient (k' jo), the TCE concentration, and the ferrous iron concentration (raised to a power >1). Therefore, as the sediment is slowly oxidized by both dissolved oxygen (reaction 7) and TCE (reaction 18), the observed overall TCE degradation rate (dTCE'/dt) will decrease. Over a small number of pore volumes, the Fe "" concentration can be assumed constant, and the TCE degradation rate simplifies to a first-order reaction that can be integrated:
aTCE"/at = -k"ao|TCE] (21) TCE =TCE,^e-^' (22)
3 0 2 9 6 9
• • ' \

13
Both the pseudo-first-order approach (reaction 21) and the fixed-pH approach (numerical solution to reactions (7) and (20)) were used in this study to describe the TCE degradation data. As stated earlier, because the actual TCE degradation rate is a function of Fe " and decreases over time, the first-order half-life will appear to decrease at progressively later points in time. As the overall TCE degradation rate decreases, the relative concentrations of degradation products change during flow through a redox barrier in an aquifer. In general, final degradation products (ethylene, ethane) appear when all reactions are occurring at the fastest rates, and as reactions slow, intermediates (acetylene) and finally the initial degradation product of TCE dechlorination (chloroacetylene) appears.
The observed TCE degradation rate (reported as first-order half-life) varied over an order of magnitude from 0.013/h (low iron content Hanford sediment) to 0.2/h (high iron content Ft. Lewis sediment). Assuming a first-order dependence of Fe° on the intrinsic TCE degradation rate, the rate variability was reduced to 3x (0.0018 to 0.0054), so is likely the correct dependence:
kf.in,rinsic = 0.0034 ± 0.0014 l/[h fxmol Fe"] (23)
Assuming a second-order dependence of Fe°, intrinsic rate values that varied 2.5 orders of magnitude, and assuming a thfrd-order dependence of Fe" , intrinsic rate values that varied 4 orders of magnitude, so are most likely not the correct dependence of Fe° on the intrinsic TCE degradation rate.
2.2.3.2. Influence of Partial Iron Reduction on TCE Degradation Rate The election-transfer mechanisms of TCE dechlorination by surface Fe° phases
are not completely understood, and as a consequence, there is a lack of ability to predict the TCE degradation rate with sediment that is only partially reduced. Two aspects of the electron transfer reactions are known: abiotic dechlorination of TCE and other chlorinated organic compounds requires both available Fe° as an electron donor and the presence of an iron oxide or zero-valent iron surface. The surface is necessary for the electron transfer reaction as laboratory experiments have shown that TCE and carbon tetrachloride are not dechlorinated in the presence of only aqueous Fe°. The role of the surface is not well understood, although may act as a catalyst, a semiconductor, or provide the necessary surface coordination for the electron transfer reactions (Scherer et al. 1999; Wehrli 1992).
The role of the iron oxide surface on TCE dechlorination was also experimentally investigated by developing a relationship between fraction-reduced fron and the resulting dechlorination ability of the sediment. In these experiments, sediment was reduced in batch systems and the mass of reduced iron measured by different types of fron extractions including oxygen breakthrough in colunms. Batch time-course experiments were used to determine the resulting TCE dechlorination rate. Because TCE degradation requires both an electron donor (adsorbed Fe°) and a surface (fron oxide or clay), the rate of dechlorination is not a simple function of the mass of reduced iron. This fact is
3 0 2 9 7 0

14
significant at the field scale because sediments cannot be uniformly reduced, so studies were conducted to determine the rate of TCE degradation as the reduced iron mass was varied. The TCE degradation rate is highly dependent on the fraction of reduced iron in ' 1 sediment and varied from >1000 h or 11% reduced to 1.2 h for 100% reduced iron (Ft ) Lewis, Wa sediment). The intrinsic TCE degradation rate varied two orders of magnitude, and there appeared to be a significant increase in the TCE degradation rate 1 between 30% and 45% reduced sediment. The intrinsic degradation rate had a second- J order dependence on the fraction of reduced iron, which may be caused by the influence of the surface on the TCE degradation rate. These results are consistent with a long-term \ j (4-month) column study with Hanford sediments in which the TCE degradation rate - ' decreased significantly when the sediment was <50% reduced.
2.2.3.3. Influence of Temperature on the TCE Degradation Rate ' The potential role of the iron oxide surface as a catalyst for TCE dechlorination
was investigated by batch TCE dechlorination time-course experiments over a distinct f temperature range. In contrast to a simple chemical reaction, a chemical reaction that * requires a surface catalyst will likely show a more complex relationship between reaction rate and temperature, because the catalyst may cease to function as the temperature \ decreases beyond a specific value. The ambient temperature of the Ft. Lewis (Tacoma, Wa.) aquifer is unusually cold at 11°C to 12°C (compared with many aquifers in the ,. 16°C to 19°C range). Batch experiments conducted from 2°C to 25°C showed a regular '; decrease (2.67x/10°C) in TCE degradation rate with lower temperature. The activation energy (42 kJ/mole) indicated that the observed rate was chemically controlled and not diffusion controlled, and similar to that reported for reduction of vinyl chloride by Fe° Peng, 1999].
2.3 Biotic Technology Description
Biostimulation of indigenous bacteria can be applied to dfrectly reduce Cr(VI) in situ or to reduce other species such as fron and sulfate to create an in situ reactive barrier capable of abiotically reducing Cr(VI). Applying biostimulation involves disfributing an appropriate substrate (e.g., organic acid) in the subsurface that is subsequently metabolized by existing bacteria. Electron acceptors coupled to substrate metabolism include Cr(VI), Fe(in), and sulfate. The specific elecfron acceptor reduced during metabolism is dependent on the type and population of microorganisms in the aquifer, the concentration of each potential elecfron acceptor, the type of substrate present, and the geochemical conditions such as pH that impact the metabolic rate of different microbial species in the subsurface.
2.3.1. Direct Cr(VI) Reduction Approach Enzymatic reduction of Cr(VI) has been demonsfrated in laboratory and field
settings. Cr(VI) competes as an electron acceptor with other elecfron acceptors present in the groundwater. However, the enzymatic reduction of Cr(VI) can occur under a wide range of redox conditions including in the presence of small amounts of oxygen.
3 0 2 9 7 1
.; )

15
Reduction of Cr(VI) has been demonstrated under aerobic conditions (e.g., Bopp and Ehrlich, 1988; Horitsu et al., 1987; Ishibashi et al., 1990), by DIRB (e.g., Caccavo, 1992), under nifrate- or fiimarate-reducing conditions (e.g., Viamajala et al., 2002), and by sulfate-reducing bacteria (SRB) (e.g., Lovley and Phillips, 1994).
To apply dfrect Cr(VI) reduction as an in situ process, substrate must be disfributed and mix with the Cr(VI) within the aquifer. This type of mixing typically requfres a groundwater recfrculation system. Contaminated groundwater is exfracted, amended with substrate, and then re-injected to the aquifer. It is also possible to inject a subsfrate solution and rely on dispersive mixing of the substrate and Cr(VI), but this technique may not provide sufficient contact for effective dfrect Cr(VT) reduction.
2.3.2. In Situ Reaction Zone Approach Fe(in) and sulfate can be biologically reduced because they .are electron acceptors
for microbial metabolism. Microorganisms that can use Fe(lll) and sulfate as electron acceptors can be found in many different envfronments, however, they actively reduce Fe(III) or sulfate only under anaerobic conditions. While oxygen is generally present within the contaminated aquifer, addition of a microbial substrate will rapidly deplete the oxygen and create the anaerobic conditions conducive to Fe(III) and sulfate reduction.
The reduced fron and sulfide produced by microbial metabolism can be used to form an in situ reactive barrier for Cr(VI). The in situ reactive barrier is formed because the reduced iron and sulfide products are immobilized (dependent on pH) as either precipitates, mineral forms, or sorbed phases. The concept for implementing a reactive barrier involves biostimulation of a relatively small amount of in situ biomass to reduce sufficient iron and sulfate to enable long term reduction of Cr(VI) as it passes through the barrier. As with the abiotically-produced barrier, the capacity of the biotically-produced barrier depends on the number of moles of reduced fron and sulfide present in the barrier. Reduced fron processes are the same as those described above for the abiotic technology description. Amorphous fron sulfide produced by sulfate reduction has also been shown to reduce Cr(VI) (Patterson and Fendorf, 1997). The dominant reaction appears to be:
3Cr04^" +2FeS + 9H2O => 4[Cro.75, Feo.25](OH)3 + Fe^^ + 8203^" + 60H" (24)
whereby the reduction product is a mixed Cr, Fe precipitate that is also produced under reduced fron conditions. Compared to the rate of dfrect enzymatic reduction of Cr(VI), reduction by Fe(II) or sulfide appear to be significantly faster (Wielinga et al., 2001). However, microbial processes can play a key role in producing and maintaining reduced fron and sulfide in the aquifer.
2.3.3. Sulfate Reduction Process
Sulfate-reducing bacteria produce hydrogen sulfide (H2S) by coupling the reduction of sulfate to the oxidation of organic compounds (e.g., lactate, acetate, ethanol) or hydrogen (Widdel, 1988). Hydrogen sulfide is highly reactive, causmg the reductive
3 0 2 9 7 2

16
dissolution of some amorphous and poorly crystalline Fe(in) oxides (e.g., ferrihydrite) and the subsequent precipitation of the Fe(II) as amorphous FeS (Matsimaga et al., 1993). The reduction of sfructural Fe(III) in layer silicates without dissolution may also occur (Gan et al., 1992). These reduced phases store reductive capacity in sediments and subsequently can reduce soluble contaminants such as Cr(VI) to form insoluble precipitates (Amonette et al., 1994; Fredrickson and Gorby, 1996; Deng and Stone, 1996). Additionally, H2S may dfrectly reduce metallic contaminants such as Cr(VI) (Kim et al., 2001; Bidoglio et al., 1993)
The metabolic activity of sulfate reducers is not limited to the reduction of sulfate. Sulfate reducers may also directly reduce Cr(VI) (Lovley and Phillips, 1994) resulting in formation of insoluble compounds. Structural Fe may also be reduced dfrectly as an electron acceptor for sulfate reducers (Cohnan et al., 1993, Lovley, 1994) creating reactive sites for contaminant reduction. In this way, sulfate reducers perform the same function as other Fe(ni) reducers such as Shewanella sp. or Geobacter metallireducens. Sulfate reduction and the dfrect reduction of Fe(ni) can occur simultaneously depending on how labile the Fe(III) is to microbial reduction (Lovley and Phillips, 1987).
In addition to possessing the capability for both dfrect and indfrect metal reduction, sulfate reducing organisms have also shown a remarkable ability to withstand high concentrations of toxic heavy metals. The minimum inhibitory concentration of Cr(VI) on pure sulfate reducer cultures were observed to range from 0.7 to 1.4 mM (35 to 70 mg/L) (Kamachuk, 1995) indicating that Cr(VI) concentrations in this range would have little to no effect on sulfide production. Sulfate reducer consortia have been shown to reduce Cr(VI) to Cr(lII) as amorphous precipitates at concentrations up to 2000 ppm and to simultaneously precipitate mixtures of Cr(VI) with U(VI) or Zn (Fude et. al, 1994).
The pH of the aquifer will tend to increase during active sulfate reduction and decrease during sulfide oxidation. The extent of this change is related to buffering by carbonate-or hydroxide-containing minerals (Walter et. al., 1994). Dissolution of fron sulfide wdll tend to increase the pH.
2.3.4. Biotic Iron Reduction Process Some bacteria are able to couple oxidation of hydrogen or organic compounds to
the reduction of Fe(in), thereby gaining energy for growth. Some of the common Fe(III) reduction reactions catalyzed by these organisms are outlined by Lovley (1994). These bacteria perform what is termed dissimilatory iron reduction and are corhprised of species from several different genera, including Geobacter, Desulfuromonas, Pelobacter, Shewanella, Ferrimonas, Geovibrio, Geothrix, and Bacillus (Fredrickson and Gorby, 1996). Also of note is that Desulfovibrio spp., may be an important catalysts of Fe(ni) reduction in the envfronment (Coleman et al., 1993). These bacteria, grouped together by thefr ability to perform dissimilatory fron reduction, have a broad spectrum of other metabolic capabilities. For instance, Shewanella alga can use O2, NO3", U(VI), Mn(IV), and Fe(III) as elecfron acceptors. Desulfovibrio desulfuricans is a well-known sulfate
3 0 2 9 7 3

17
reducing bacteria, but can also use Fe(III), U(VI), and Cr(VI) as elecfron acceptors (Lovley and Phillips, 1992,1994).
Dissimilatory fron reducing bacteria and other species such as Desulfovibrio sp. Have potential for use in bioremediation as a result of 1) the reduction of mineral-associated Fe(III) to produce reactive sites within these minerals and 2) the dfrect reduction of contaminants such as U and Cr. The capability to reduce structure Fe(III) in minerals has been established for a number of species in the genera listed above. The Fe(in) in minerals such as amorphous and poorly crystalline Fe (e.g., ferrihydrite) (Lovley, 1991,1994; Coleman et al., 1993), crystalline Fe-oxides/hydroxides (e.g., hematite, goethite, and magnetite) (Arnold et al., 1988; DiChristina, 1994; Roden and Zachara, 1996; Kostka and Nealson, 1995) can be microbially reduced and create the potential for subsequent Cr(VI) reduction.
302974

Experimental Methods
3.1 Sampling Sediment and aqueous samples were collected in accordance with requirements
documented in the drilling statement of work and accompanying sampling and analysis plan. Due to the nature of the sediment samples being collected, special collection, handling, and preservation requirements were specified. Specifically for samples used for biologic analysis, these were collected using an aseptic sampling protocol and samples collected for the determination of naturally occurring reduced species were collected using an anoxic sampling protocol. All other samples were collected using similar methodologies, but with less stringent requfrements for sample collection, handling, and preservation. Aqueous samples were collected for the determination of field parameters and a subset was submitted for laboratory analysis.
3.2 Sediment Physical Properties and Groundwater Analysis The dry bulk density and porosity of Puchack sediments were measured on the
intact cores, i.e., whole sediment properties. As the core samples were unpacked, the wet weight, dry weight, and core volume were used to calculate the dry buUc density and porosity. Where necessary glass beads or boiling chips were used to compensate for the "missing" volume of the sediment cores that were not fiilly packed which was corrected for when calculating the bulk density and porosity. The sediment samples were oven dried at 45° C until constant weight.
The sediment size fractions were determined by ASTM sieve analysis (18 sediments) and additionally by hydrometer analysis to accurately determine the clay fraction (10 samples). The entfre sediment size fraction was not used in laboratory experiments since large cobbles exhibit essentially no geochemical conttol (i.e., the surface area of gravels are extremely small relative to clays), and experiments of this scale would not be practical. For example, a sediment oxidation experiment (described below) requfres 1200 pore volumes and would take a considerable amount of time with a column containing the full sediment size fraction. Thus, only the < 4 mm size fraction was used. Composite sediments were made from a range of different sediment cores. The composite sediments were analyzed using X-Ray Diffraction (XRD). The total carbon content, inorganic and organic (by difference), was also determined for some of the sediments used in this study.
3.2.1 Groundwater Analyses Groundwater analyses were conducted in the field, these included hexavalent
chrome using the HACH method 8023 and ferrous fron using HACH method 8146. Total chrome and organic compounds were analyzed for using ICP-MS at off-site laboratories. In a previous EPA report (Bench-Scale Tests for Evaluation of In Situ Technologies for Chromium And Volatile Organic Compounds in Groundwater) a series of chemical
3 0 2 9 7 5

19
analysis were carried out on Puchack groundwater and this data was used to design a synthetic groundwater.
The Ferrozine (Gibs 1976) colormetric method was used to analyze for Fe(II) at X-=562 in all of the Puchack groimdwater samples receive. This method is kinetically controlled, once initially formed (10 minutes) absorbance was measured (standards and samples) within 10 minutes.
3.3 Column Experiments
3.3.1 Sediment Reduction by Dithionite Sediment reduction studies conducted in 1-D columns consisted of injecting a
dithionite solution (0.09mol/L dithionite and 0.36 mol/L K2CO3) at a steady rate into a sediment column for 120 h. The flux rate was chosen to achieve a specific residence time of the dithionite solution in the column (w5 h) relative to the reduction rate (Szecsody and Bales 1989). The dry bulk density and porosity of the column were calculated from the dry and saturated column weight and column volume. The volumetric flow rate was calculated from the effluent volume and elapsed time. The electrical conductivity of the column effluent provided a second (dynamic) measure of the porosity, and was measured using a flow-through electrode and automatic data logging (Figure 3-1). While these experiments provide data of the mass of reduced fron in the sediments, the method is more complex and less accurate than oxidizing sediments with dissolved oxygen (described below). A maximum of five automated systems were operating simultaneously to reduce the sediments
" 1
n
f l
Figure 3-1. Fraction collection of column effluent into anaerobic vials.
The process by which dithionite is manufactured (either zinc or formate process) impacts the concentration of metals in the dithionite. In general, the formate process produces more pure dithionite, and is used for field scale injection experiments. Dithionite produced with the zinc process was used for laboratory experiments, due to availability (from Fischer Scientific), as formate-process dithionite is generally only available in large quantities. A brief description of two processes for manufacturing dithionite is provided below.
There are two different processes to manufacture sodium dithionite, the zinc process and formate process. In the zinc process, one mole of powdered zinc is dissolved in water. This reacts with two moles of sulfur dioxide bubbling through the solution to produce one mole of zinc dithionite. Adding two moles of caustic will yield one mole of sodium dithionite plus one mole of zinc oxide precipitate plus one mole of water. A filter
J
J
302976

20
press is used to remove the zinc oxide. This process will yield about a 14% sodium dithionite solution. Because the powdered zinc usually contains small amounts of lead, sodium dithionite produced from the zinc process contains higher frace levels of lead and other heavy metals than the formate process.
Zn + 2SO2 -> ZnS204
ZnS204 + 2NaOH ^ Na2S204 + ZnO + H2O
In the formate process, one mole of sodium formate is reacted with one mole of 50% caustic and two moles of sulfur dioxide to produce one mole of sodium dithionite plus one mole of water and one mole of carbon dioxide.
HCOONa + NaOH + 2SO2 "^ Na2S204 + H2O CO2
Typically methanol is added to make a water/methanol solution, which increases evaporation of the solution leaving solid sodium dithionite in a powder form. This formate process produces the highest quality sodium dithionite solutions, formate produced sodium dithionite has been found to have the lowest trace metals content.
Al As Ba Cd Cr Cu
MRL (ppm) 5
0.2 1
0.02 0.1 1
Typical 6
ND ND 0.18 0.4 ND
MRL (ppm) Typical 3
ND ND ND ND ND
Fe Pb Mn Ni Ag Zn
2 0.02
1 2 1 1
The solid or powder form of dithionite is classified spontaneously combustible, but if you handle it properly, it has excellent shelf life and can be fransported safely and economically anywhere in the country. The liquid form of sodium dithionite is classified by DOT as non-hazardous. It is, however, time and temperature sensitive. It is a very powerful reducing agent, which will react with the oxygen in the afr. Therefore, a non-reactive gas (argon) is needed in the void space between the liquid surface and the top of the shipping container. The sodium dithionite solution is typically trucked at between 38°F to 40°F. If the temperature of the solution gets above 50°F, the sodium dithionite will start to decompose at a fafrly rapid rate. If the solution temperature is allowed to rise above 60°F, the decomposition rate is greatly accelerated until you loose all reactivity.
3.3.2 Sediment Oxidation with dissolved O2 Sediment oxidation studies were also conducted in 1-D columns to determine the
rate at which the dithionite-reduced sediments are oxidized and to measure the mass of reduced fron (i.e., redox capacity). These experiments consisted of injecting oxygen-saturated (8.4 mg/L) water at a steady rate (typically 2 pore volumes per hour) into a reduced sediment column and measuring the concentration of dissolved oxygen over time
302977

21
in the effluent for 300 to 800 h. The flux rate was chosen to achieve specific residence times of the dissolved oxygen in the column relative to the oxidation rate(s) of the sediment. A series of in-line micro-electrodes were used to monitor geochemical changes during oxidation and included dissolved oxygen (with 2 electrodes), pH, and electrical conductivity. Electrode measurements were continuously monitored, averaged, and data logged at 2 to 5 minute intervals using an automated fluid measurement and control system (U.S. Patent 6,438,501; J. Szecsody, M. Williams, V. Vermeul, Figure 3-2). A two-point calibration was conducted on the in-line oxygen electrodes at 4 - 8 h intervals (oxygen-free and oxygen-saturated solutions) using the automated system. The elecfrode data from the calibrations were also data logged. The mass of reduced fron that was oxidized was calculated from the oxygen breakthrough curves. The difference in the total mass of dissolved oxygen injected minus dissolved oxygen in the effluent is that consumed by ferrous fron. This oxygen breakthrough analysis assumes dynamic equilibrium, or that all of the reduced iron has been oxidized in the column. In many cases, there is a fraction of the sediment that has not been oxidized, so some error in estimating the unreduced fraction is introduced.
To establish the mobility of frace metals during sediment reduction and oxidation, aqueous effluent samples from some of the reduction and oxidation column experiments were analyzed for trace metals by ICP-MS.
3.3.3 Chromium Transport in Untreated Sediments
Sediment transport studies of chromium (III/VI) were also conducted in 1-D columns as a fimction of pH. These experiments consisted of injecting pH adjusted tap water with a mixture of chromium (III/VI) into columns made from shallow composite 36/37 sediment at a steady rate with periodic sampling for several pore volumes (6-400PV/several days to 3 weeks). The effluent samples were then analyzed for total chromium by ICP-MS and Chrome(VI) using 1,5 diphenylcarbazide, (DPC), EPA method 7196A for the low pH experiments and by DPC only for experiments where the pH>6 (no aqueous chrome(III) in solution).
Figure 3-2. Sediment column oxidation system with automated calibration of oxveen elecfrodes.
IJ
I ? "
I L.
3.3.4 Chromate Transport in Reduced sediments Chromate fransport studies of dithionite (see above) reduced shallow composite
36/37 sediment were also conducted in 1-D columns as a fimction of pH. The sediment columns were pH adjusted to the desfred pH with either Pipes or phthalate buffer. pH adjusted chromate-laden (2 jimol/L) deionized water was used as the injection solution.
3 0 2 9 7 8

22
which was injected at a steady rate for 400-450 pore volumes (^2 months). Samples were collected over 8 hours (alPV) every 24 hours and analyzed for chromate using DPC.
3.4 Batch Experiments
3.4.1 Chromate Adsorption Edge
The Chromate adsorption was investigated as a function of pH, ionic strength and time on the untreated Dl-H, 220', D2-H, 271' and deep composite 1 sediment (DC-1). The sediment was first equilibrated at the desired pH with a soil-to-water ratio (rsw) of 0.25 and 0.5 (5g sediment/10ml water) with either Puchack groundwater, synthetic Puchack groundwater or de-ionized water and then the chromate was added. Samples were taken as a fimction of time, filtered through a 0.2 jxm filter and analyzed for chromate using DPC. The potential effects of filtration were also investigated as a fimction of filter pore size.
The influence of SO4 on chromate adsorption was also investigated on the MW36 and 37 composite sediment at pH 6.3 and a rsw of 0.5. The sediment pH was allowed to equilibrate on a mechanical end-to-end mixer for several days before the addition of either sulfate or chromate. Sodium sulfate was then added at the desired concentration and allowed to equilibrate on the end-to-end mixer for 1 hour. Chromate was then added and allowed to mix for 3 hours, sampled and filtered with a 0.2 jam syringe filter then" Einalyzed for chromate using DPC. The effect of S04 on the chromate analysis using DPC was investigated as a potential interference along with the presence of chrome(in).
3.4.2 Chromate Adsorption Isotherm
The adsorption isotherm of chromate at pH 5.6 was investigated using the deep composite sediment at a rsw of 0.25. The initial pH of the sediment/chromate mixture was adjusted to 5.6 then readjusted at 2 and 4 hours. The sediment samples were then left to equilibrate for 24 hours. The pH was taken again and the samples were passed through a 0.2 |j.m syringe filter and analyzed for chromate using DPC.
3.4.3 Natural Attenuation Studies
The natural reduction ability of Puchack sediments was studied with a range of sediment and composite sediment samples under anoxic (purged with He) and oxic conditions. Chromate concentrations ranging from 1.8 to 5.5 mg/L, pH buffered to 7.5 with 0.01 M pipes buffer, with a rsw of «0.08, were used xa this study. Sampling was carried out as a function of time with the aide ofa needle tipped syringe, given that these experiments were carried out in rubber stopped septa bottles to control final O2 concentrations, and then filtered though a 0.2 |j.rri syringe tip filter. Samples were then analyzed for chromate using DPC.
3 0 2 9 7 9

23
The influence of organic carbon on chromate adsorption was also investigated on NRS-1 (Dl-272') under an anoxic environment (in a glove box). Approximately 17 g of NRS-1 sediment was added to 100 ml of 0.05 M NaNO3/0.132 M NaOH solution resulting in a suspension pH of 11.7. The suspension was then stirred while heating (85-90° C) for a period of 4 hours then left to cool overnight. A Bruker, Fourrier Transform Infra-Red Spectometer (FTIR), IFS66 was used to obtain an IR spectrum to confirm the presence of natural organic matter (NOM) in the filtrate obtained from the base treatment process. The base treated sediment was washed several times over a period of 10 days with DI water using a Sorvall RC5C centrifuge, the samples were allowed to mix on a mechanical end-to-end mixer between subsequent washes. After the final wash (supematant was colorless) the sediment was transferred to a septa top bottie (to eliminate possible Oj contamination) and weighed. Chromate (4.0688mg/L, 4.8388 mg/L for the control), pH buffered to 7.5 with 0.01 M pipes buffer, with a dry sediment r ^ of 0.37 (0.31 for the control) was then added and allowed to equilibrate on the mechanical end-to-end mixer between samples. Samples were taken as a function of time with the aide of a needle tipped syringe and filtered with a 0.22 \xm syringe tip filter then analyzed for chromate using DPC. Since the base treated sediment was wet after treatment the actual mass of sediment used was obtained upon completion of the batch experiment by determining the density of the residual soil suspension. This was obtained by determining the water content of the suspension, for both the base treated and the conttol, by oven drying at 45 °C until constant weight (=> 3 days). The intrinsic moisture of the sediment was also taken into account when calculating the mass of sediment present in the initial base treated suspension used for the chromate batch experiment. The initial chromate concenttation was also adjusted to accommodate the presence of this excess water in the base treated sediment.
3.4.4 Iron Extractions of Treated and Untreated Sediments Geochemical analysis of sediment samples was conducted to determine the
amounts of various Fe°™ phases. These included five different methods of iron extraction (Heron et al 1994) a) 0.5 M HO, b) ammonium oxalate, c) dithionite-cittate-bicarbonate (DCB), d) 5 M HO, e) IM CaOz. Ferrozine (Gibbs 1976) was used to quantify the aqueous Fe" and Fe,„^ from the extractions, where Fe,o^ (Fe" + Fe™) samples reduced aqueous Fe™ to Fe° by 0.025 M NH2OH, HO. Exfracted Fe™ was obtained from the difference between Fe^,^ minus Fe". The ion exchangeable (adsorbed) Fe(II) was defined by the IM CaOj extraction and FeCOj/FeS phases were defined by the 0.5 M HO extraction for 1 hour. Amorphous and poorly crystalline Fe™ oxides were defined by the extraction using ammonium oxalate for 24 hours and crystalline Fe™ oxides were defined by DCB exfraction for 24 hours minus the ammonium oxalate extraction. Total Fe° and Fe™ oxides were obtained by exfraction with 5 M HO for 3 weeks.
302980

24
3.5 Biotic Studies
3.5.1 Sediments The core samples used for biotic studies were from boreholes MW-36 and MW-
37 at depths ranging from 151.5 to 211 feet (Table 4.7-1). These samples were selected to represent the two hydrogeologic layers of interest, the Intermediate Sand) and Lower Aquifer (upper zone).
3.5.2. Microbial Batch Tests A modified Geobacter medium (Coates, et al, 1996) with Fe(ni)NTA (ferric
nitrilotriacetic acetate) (10 mM) as the electron acceptor, was used for culturing IRB (Appendix G). Fresh Fe(III)NTA medium has a clear amber color. The medium turns clear and colorless with whitish precipitates when Fe(III) is reduced to Fe(II) compounds, such as Fe(II) carbonate (gray, siderite) or Fe(II) orthophosphate (white/brown, vivianite). Postgate Medium B (Postgate, 1984), as modified by us, was used for growing SRB (Appendix G). Presence of SRB is identified by the blackening of the medium due to iron sulfide produced from the reaction of iron with hydrogen sulfide that is produced when sulfate is reduced by SRB.
The most probable number (MPN) method (Alexander, 1982) was employed to estimate IRB and SRB population densities using a 10-fold dilution (10" to 10" ) with 5 tubes at each dilution. The MPN technique was applied for one sediment sample in the Intermediate Sand (PNNL ID#1) and one sediment sample in the Lower Aquifer (PNNL ID#2) (Table 4.7-1). Initially, 10 g of sediments were fransferred to 95 ml of homogeiuzing solution (0.1% pyrophosphate, pH 7.0) and shaken vigorously for 10 minutes. Subsequent 10-fold dilutions were prepared using phosphate-buffered-saline (Appendix G). All eight sediment samples were assayed in dfrect enrichment treatments wdth 1 g sediment per 10 ml culturing medium for IRB and SRB and with 30 g of sediment in 30 mL of culturing medium for SRB.
Pure cultures of Geobacter metallfreducens GS-15 (ATCC 53774) and Desulfovibrio vulgaris (ATCC 29579) were used as positive confrols for IRB and SRB, respectively. Thefr densities were determined by acridine orange dfrect count technique. Three levels of cell densities for these cultures (low, medium, and high cells) were used for the positive confrols. All inoculation and fransfers were performed inside an anaerobic glove box or using standard anaerobic culturing techniques (Coates, et al, 1996). Stationary incubation was carried out at ambient temperature in the dark.
302981

25
Results
4.1 Sediment and Aqueous Sample Collection This section provides a brief description of the samples that were collected to
support these freatability studies and a summary of the sediment physical property data and groundwater chemistry data that was collected. A detailed discussion of these sampling activities is provided in a freatability study sample collection report (CDM, 2005).
4.1.1 Sediment Sample Collection Aquifer core samples were collected during the installation of four
characterization borings at the I*uchack Well Field site, two of which were completed as monitoring wells 36 (MW-36 and MW-37). The other two downgradient borings (D-1 and D-2) were not completed as monitoring wells. In total, 157 sediment cores samples were collected. The aquifer unit and collection depth interval for each core sample are provided in Tables 4.1-1 through 4.1-4 along with the date collected and the planned analysis type (i.e., microbial, physical property, and geochemical). A detailed description of sampling locations, field activities, and operational procedures is provided in CDM, 2005.
4.1.2 Sediment Physical Property Analysis Physical property analysis was conducted on 37 of the core sediment samples
obtained (Table 4.1-5), including characterization of the < 4 mm fraction, bulk density, and porosity. In addition, sediment particle size analysis was performed on 18 of the samples, three of which are shown in Figures 4.1-1 through 4.1-3. The remaining particle size analysis results are provided in Appendix A. Particle size distributions for monitoring well 37 have been used to highlight the variability in the particle size of the intermediate sand (C2AI) and the lower aquifer units (A3a). Particle size distributions were not performed on the confining units between the intermediate sand and the lower aquifer units, i.e. clay. From the figure below we can see that as we approach the aquitard the amount of clay and silt present in the intermediate sand increases (Figure 4.1-1 and 4.1-2) to approximately 20% and then tails off to about 5% for the upper portion of the lower aquitard (Figure 4.1-3). With the exception of one sample, all samples used in this study contained less than 16% silt and clay, with two of the four wells containing less than 5.5% silt and clay (D-1 & D-2). A representative sample from the sediments of all four wells contains less than 2% clay. Bulk density and porosity data are also given on Table 4.1-5, the average bulk density and porosity of all samples analyzed was 1.917 ± 0.147 cm /g and 28.6 ± 8.6 % respectively.
302982

26
0.1 grain size (mm)
Figure 4.1-1. Sieve analysis of sediment from 162.5' deptii of MW-37S-C, aquifer unit C2AI.
Most of the clay and silty clay sample designations indicated in Table 4.1-5 are from depth intervals near the contact between aquifer and aquitard units. However, in some cases (e.g., sample MW-37S-I), a clay sample was obtained from within an aquifer unit (as designated by the field geologist logging the borehole) indicating that discontinuous clay lenses may be present within the deUneated aquifer units. Detailed characterization of the spatial distribution of clay lenses within the various aquifer units was not within the scope of this study, and would likely require further characterization prior to pilot scale field testing of in situ technologies at the site.
Composite sediments were made from a range of different sediment cores in order to obtain a representative sample of the different aquifer units present at the Puchack well field superfund site. The compositions of the various composite sediments used in this study are given in Table 4.1-6. It is worth noting that the DC-1 and DC-2 sediments were used together to form composites since these wells are situated in an area that is considered uncontaminated. Sediments from MW-36 and MW-37 were combined to form composite sediment samples since both of these wells are located near the proposed site for pilot scale treatability testing of in situ technologies, which is known to be in a contaminated region of the Puchack site. Using this approach, representative samples of both uncontaminated and contaminated sediments were prepared.
1.1
0.1 grain size (mm)
Figure 4.1-2 Sieve analysis of sediment from 171.5' depth of MW-37S-F, aquifer unit C2AI.
0^1 gram size (mm) . )
Figure 4.1-3 Sieve analysis of sediment from 190.5' deptii of MW-37S-G, aquifer unit A3a.
3 0 2 9 8 3

27
Table 4.1-1. Aquifer Core Samples for Well MW-36.
Borehole
MW-36
MW-36
MW-36
MW-36
MW-36
MW-36
MW-36
MW-36
MW-36 MW-36
MW-36
MW-36
MW-36
MW-36
MW-36
MW-36
MW-36
MW-36
MW-36
MW-36
MW-36
MW-36 MW-36
MW-36
MW-36
MW-36
MW-36
MW-36
MW-36
MW-36
MW-36
MW-36
MW-36
MW-36
MW-36
MW-36
MW-36
MW-36
MW-36
MW-36
MW-36
MW-36
MW-36
Aquifer Unit
A2a
A2b
A2b
A2b C2AI
C2AI
C2AI
C2AI
C2AI
C2AI
C2AI
C2AI
C2AI
C2AI
C2AI
C2AI
C2AI
A3a
A3a
A3a
A3a
A3a A3a
A3a
A3a
A3a
A3b
A3b
A3b
A3b
A3b
A3b
A3b
A3b
A3b
A3c
A3c
A3c
A3c
A3c
A3c
A3c
A3c
Start Depth
(ft) 80.0
108.5
109.0
109.5 150.5
151.0
151.5
158.5
159.0
159.5
162.0
162.5
163.0
167.0
167.5
172.0
172.5
189.0
196.5
197.0
197.5 200.5 201.0
204.5
205.0
205.5
210.0
210.5
211.0
220.0
220.5
221.0
228.5
229.0
229.5
238.5
239.0
229.5
252.5
253.0
253.5
267.0
267.5
End Depth
(ft) 80.5
109.0
109.5
110.0 151.0
151.5
152.0
159.0
159.5
160.0
162.5
163.0
163.5
167.5
168.0
172.5
173.0
189.5
197.0
197.5
198.0
201.0 201.5
205.0
205.5
206.0
210.5
211.0
211.5
220.5
221.0
221.5
229.0
229.5
230.0
239.0
239.5
230.0
253.0
253.5
254.0
267.5
268.0
Sample No.
MW-36S-A
MW-36S-B
MW-36S-B
MW-36S-B
MW-36S-C
MW-36S-C
MW-36S-C
MW-36S-D
MW-36S-D
MW-36S-D
MW-36S-E
MW-36S-E
MW-36S-E
MW-36S-F
MW-36S-F
MW-36S-G
MW-36S-G
MW-36S-H
MW-36S-1
MW-36S-1
MW-36S-I
MW-36S-J MW-36S-J
MW-36S-K
MW-36S-K
MW-36S-K
MW-36S-L
MW-36S-L
MW-36S-L
MW-36S-M
MW-36S-M
MW-36S-M
MW-36S-N
MW-36S-N
MW-36S-N
MW-36S-0
MW-36S-0
MW-36S-6
MW-36S-P
MW-36S-P
MW-36S-P
MW-36S-Q
MW-36S-Q
Analysis (sample
type) Micro
Phys
Micro GeoChem
Phys
Micro
Phys
Micro GeoChem
Micro
Phys GeoChem
Micro
GeoChem
GeoChem
Micro
Micro
Phys
GeoChem
Micro GeoChem
Micro
GeoChem
Micro
Phys
Phys
Micro
GeoChem
GeoChem
Micro
Phys
GeoChem
Micro
Phys
GeoChem
Micro
Phys
GeoChem
Micro
Phys
GeoCChem
Micro
Date Collected
6/28/04
6/28/04
6/28/04 6/28/04
6/28/04
6/28/04
6/29/04
6/29/04
6/29/04
6/29/04
6/29/04
6/29/04
6/29/04
6/29/04
6/29/04
6/29/04
6/30/04
6/30/04
6/30/04
6/30/04 6/30/04 6/30/04
7/6/04
7/7/04
7/6/04
7/7/04
7/7/04
7/7/04
7/7/04
7/7/04
7/7/04
7/7/04
7/7/04
7/8/04
7/8/04
7/8/04
7/8/04
7/9/04
7/9/04
Notes
Half Ml
302984

28
Table 4.1-2. Borehole
MW-37
MW-37
MW-37
MW-37
MW-37
MW-37
MW-37
MW-37
• MW-37
MW-37
MW-37
MW-37
MW-37
MW-37
MW-37
MW-37
MW-37
•MW-37
MW-37
MW-37
MW-37
MW-37
MW-37
MW-37
MW-37
MW-37
MW-37
MW-37
MW-37
MW-37
MW-37
MW-37
MW-37
MW-37
MW-37
MW-37
MW-37
MW-37
MW-37
MW-37
MW-37
MW-37
MW-37
MW-37
MW-37
Aquifer Core Aquifer Unit
A2a
A2a
A2a
A2b
A2b
C2AI
C2AI
C2AI
C2AI
C2AI
C2AI
C2AI
C2AI
C2AI
A3a
A3a
A3a
A3a
A3a
A3a
A3a
A3a
A3a
A3a
A3a
A3a ,
A3a
A3a
A3a
A3a
A3a
A3b
A3b
A3b
A3b
A3c
A3c
A3c
A3c
A3c
A3c
A3c
A3c
A3c
A3c
Samples Start Depth
(ft) 80.5
81.5
81.5
118.5
119.0
153.0
154.0
161.5
162.0
167.5
168
168.5
171.0
171.5
190.0
190.5
191.0
194.0
194.5
198.0
' 199.0
198.5
204.0
204.5
205.0
210.0
210.5
211.0
216.5
217.0
217.5
224.5
225.0
231.0
231.5
238.0
238.5
239.0
247.0
247.5
257.0
257.5
266.5
267.0
267.5
for Well MW-37. End
Depth (ft) 81.0
82.0
82.0
119.0
119.5
153.5
154.5
162.0
162.5
168.0
168.5
169.0
171.5
172.0
190.5
191.0
191.5
194.5
195.0
198.5
199.5
199.0
204.5
205.0
205.5
210.5
211.0
211.5
217.0
217.5
218.0
225.0
225.5
231.5
232.0
238.5
239.0
239.5
247.5
248.0
257.5
258.0
267.0
267.5
268.0
Sample No.
MW-37S-A
MW-37S-A
MW-37S-A
MW-37S-B
MW-37S-B
MW-37S-A
MW-37S-C
MW-37S-D
MW-37S-C
MW-37S-E
MW-37S-E
MW-37S-E
MW-37S-F
MW-37S-F
MW-37S-G
MW-37S-G
MW-37aS-G
MW-37S-H
MW-37S-H
MW-37S-I
MW-37S-I
MW-37S-I
MW-37S-J
MW-37S-J
MW-37S-J
MW-37S-K
• MW-37S-K
MW-37S-K
MW-37S-L
MW-37S-L
MW-37S-L
MW-37S-M
MW-37S-M
MW-37S-N
MW-37S-N
MW-37S-0
MW-37S-0
MW-37S-0
MW-37S-P
MW-37S-P
MW-37S-Q
MW-37S-Q
MW-37S-R
MW-37S-R
MW-37S-R
Analysis (sample type)
GeoChem
Phys
Micro
Micro
GeoChem
Phys
GeoChem
GeoChem
Phys
Micro
Phys
GeoChem
Micro
GeoChem
Micro
GeoChem
Phys
Micro
GeoChem
Micro
GeoChem
Phys
GeoChem
Micro
Phys
Phys
GeoChem
Micro
GeoChem
Phys
Micro
Micro
GeoChem
Micro
GeoChem
Phys
GeoChem
Micro
GeoChem
Micro
Micro
GeoChem
Micro
Phys
GeoChem
Date Collected
6/9/04
6/9/04
6/9/04
6/10/04
6/10/04
6/14/04
6/14/04
6/15/04
6/15/04
6/15/04
6/15/04
6/15/04
6/22/04
6/22/04
6/22/04
6/22/04
6/22/04
6/22/04
6/22/04
6/22/04
6/22/04
6/22/04
6/23/04
6/23/04
6/23/04
6/23/04
6/23/04
6/23/04
6/23/04
6/23/04
6/23/04
6/23/04
6/23/04
6/24/04
6/24/04
6/24/04
6/24/04
6/24/04
6/24/04
6/24/04
6/25/04
6/25/04
6/25/04
6/24/04
6/25/04
Notes
3 0 2 9 8 5
n u n
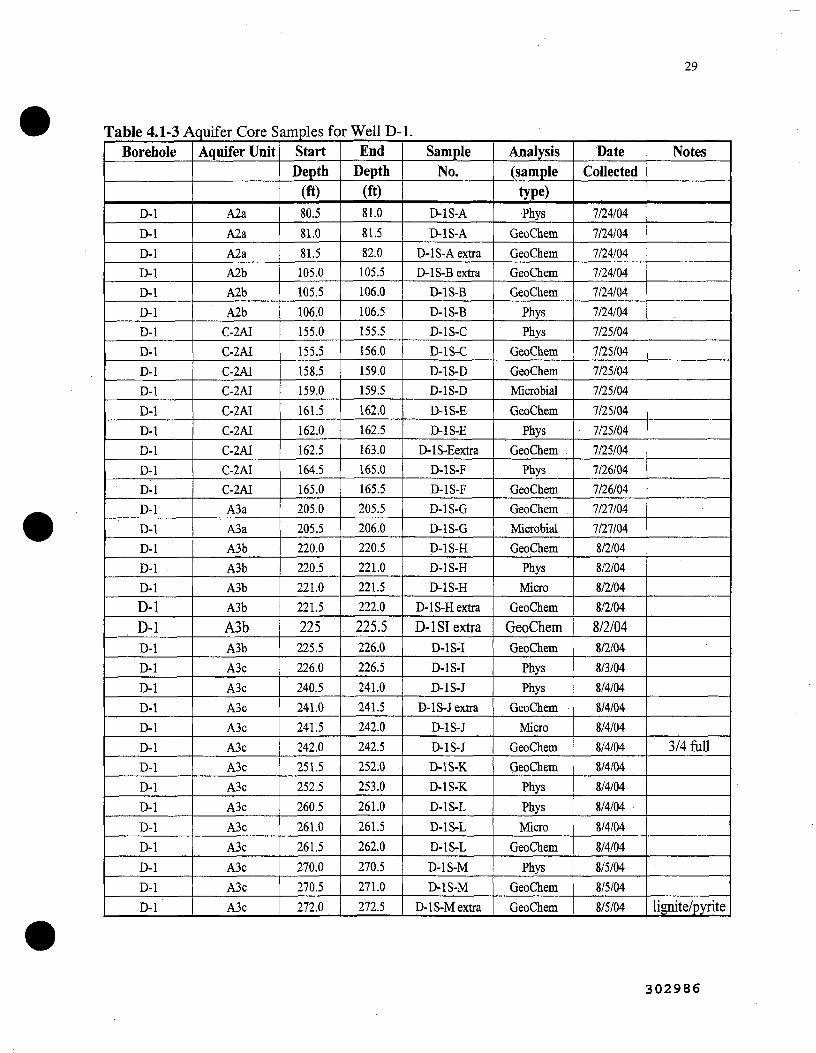
29
Table 4.1-3 Aquifer Core Samples for Well D-1. Borehole
D-1
D-1
D-1
D-1
D-1
D-1
D-1
D-1
D-1
D-1
D-1
D-1
D-1
D-1
D-1
D-1
D-1
D-1
D-1
D-1
D-1 D-1 D-1
D-1
D-1
D-1
D-1
D-1
D-1
D-1
D-1
D-1
D-1
D-1
D-1
D-1
Aquifer Unit
A2a
Ala
A2a
A2b
A2b
A2b
C-2AI
C-2AI
C-2AI
C-2AI
C-2AI
C-2AI
C-2AI
C-2AI
C-2AI
A3a
A3a
A3b
A3b
A3b
A3b
A3b A3b
A3c
A3c
A3c
A3c
A3c
A3c
A3c
A3c
A3c
A3c
A3c
A3c
A3c
Start Depth
(ft)
80.5
81.0
81.5
105.0
105.5
106.0
155.0
155.5
158.5
159.0
161.5
162.0
162.5
164.5
165.0
205.0
205.5
220.0
220.5
221.0
221.5
225 225.5
226.0
240.5
241.0
241.5
242.0
251.5
252.5
260.5
261.0
261.5
270.0
270.5
272.0
End Depth
(ft)
81.0
81.5
82.0
105.5
106.0
106.5
155.5
156.0
159.0
159.5
162.0
162.5
163.0
165.0
165.5
205.5
206.0
220.5
221.0
221.5
222.0
225.5 226.0
226.5
241.0
241.5
242.0
242.5
252.0 •
253.0
261.0
261.5
262.0
270.5
271.0
272.5
Sample No.
D-IS-A
D-IS-A
D-IS-A extra
D-IS-B extra
D-IS-B
D-IS-B
D-IS-C
D-IS-C
D-IS-D
D-IS-D
D-IS-E
D-IS-E
D-lS-Eextra
D-IS-F
D-IS-F
D-IS-G
D-IS-G
D-IS-H
D-IS-H
D-IS-H
D-IS-H extra
D-lSIexfra D-IS-I
D-IS-I
D-IS-J
D-IS-J extra
D-IS-J
D-IS-J
D-IS-K
D-IS-K
D-IS-L
D-1 S-L
D-1S-L
D-IS-M
D-IS-M
D-1 S-M extra
Analysis (sample
type) •Phys
GeoChem
GeoChem
GeoChem
GeoChem
Phys
Phys
GeoChem
GeoChem
Microbial
GeoChem
Phys
GeoChem
Phys
GeoChem
GeoChem
Microbial
GeoChem
Phys
Micro
GeoChem
GeoChem GeoChem
Phys
Phys
GeoChem
Micro
GeoChem
GeoChem
Phys
Phys
Micro
GeoChem
Phys
GeoChem
GeoChem
Date CoUected
7/24/04
7/24/04
7/24/04
7/24/04
7/24/04
7/24/04
7/25/04
7/25/04
7/25/04
7/25/04
7/25/04
7/25/04
7/25/04
7/26/04
7/26/04
7/27/04
7/27/04
8/2/04
8/2/04
8/2/04
8/2/04
8/2/04 8/2/04
8/3/04
8/4/04
8/4/04
8/4/04
8/4/04
8/4/04
8/4/04
8/4/04
8/4/04
8/4/04
8/5/04
8/5/04
8/5/04
Notes
3/4fiill
lignite/pyrite
3 0 2 9 8 6

Table 4.1-4. Aquifer Core Samples for Well D-2.
30
Borehole
D-2
D-2
D-2
D-2
D-2
D-2
D-2
D-2
D-2
D-2
D-2
D-2
D-2
D-2
D-2
D-2
D-2
D-2
D-2
D-2
D-2
D-2
D-2
D-2
D-2
D-2
D-2
D-2
D-2
D-2
D-2
D-2
D-2
Aquifer Unit
A2a
A2b
A2a
A2b
A2b
A2b
C2AI
C2AI
C2AI
C2AI
A3a
A3a
A3a
A3a
A3a
A3a
A3a
A3a
A3a
A3a
A3a
A3b
A3b
A3b
A3b
A3b
A3b
A3b
A3b
A3b
A3b
A3b
Start Depth
(ft) 92.5 .
93.0
130.0
130.5
150.0
151.0
150.5
208.5
210.5
211.0
211.5
260.0
260.5
261.0
265.0
265.5
266.0
270.0
270.5
271.0
276.0
276.5
285.5
286.0
286.5
291.0
291.5
295.0
295.5
296.0
300.5
301.0
301.5
End Depth
(ft) 93.0
93.5
130.5
131.0
150.5
151.5
151.0
209.0
211.0
211.5
212.0
260.5
261.0
261.5
265.5
266.0
266.5
270.5
271.0
271.5
276.5
277.0
286.0
286.5
287.0
291.5
292.0
295.5
296.0
296.5
301.0
301.5
302.0
Sample No.
D-2S-A
D-2S-A
D-2S-B .
D-2S-B
D-2S-C extra
D-2S-C
D-2S-C
D-2S-D
D-2S-E
D-2S-E
D-2S-E extra
D-2S-F
D-2S-F
. D-2S-F
D-2S-G
D-2S-G
D-2S-G
D-2S-H
D-2S-H
D-2S-H
D-2S-I
D-2S-I
D-2S-J
D-2S-J
D-2S-J
D-2S-K
D-2S-K
D-2S-L extra
D-2S-L
D-2S-L
D-2S-M
D-2S-M
D-2S-M extra
Analysis (sample type) Phys
GeoChem
Phys
GeoChem
Phys
GeoChem
Phys
GeoChem
GeoChem
Phys
Phys
GeoChem
Phys
GeoChem
Micro
Phys
GeoChem
Phys
Phys
GeoChem
GeoChem
Phys
Micro
GeoChem
Micro
Phys
GeoChem
GeoChem
Phys
Micro
Date Collected
7/12/04
7/12/04
7/13/04
7/13/04
7/13/04
7/13/04
7/14/04
7/14/04
7/14/04
7/14/04
7/14/04
7/20/04
7/20/04
7/20/04
7/20/04
7/20/04
7/19/04
7/20/04
7/20/04
7/20/04
7/20/04
7/20/04
7/21/04
7/21/04
7/21/04
7/21/04
7/21/04
7/21/04
7/21/04
7/21/04
7/22/04
7/27/04
7/22/04
Notes
HalffiiO
HalfM
i i
. J
302987

31
Table 4.1-5 Sediment Core General Physical Properties. Sample Bulk gram size: Porosity JNumber
MW-36S-B MW-36S-C MW-36S-D MW-36S-E MW-36S-F MW-36S-1 MW-36S-K MW-36S-L MW-36S-M MW-36S-N M\V-36S-P MW-37S-Aa MW-37S-Ab MW-37S-C MW-37S-D .MW-37S-E MW-37S-F MW-37S-G MW-37S-G MW-37S-1 M\V-37S-K .MW-37S-L M;W-37S-0 MW-37S-R D-2S-A D-2S-C D2S-E D-2S-F D-2S-H D-2S-J D-2S-M D-IS-B D-IS-F D-IS-H D-IS-J D-IS-K DIS-M
depth (ft)
109 151 156 163 168 196 206 209 221 230 254 81 153 162.5 165 168 171.5 190.5 191 198 210 217 238 267 93 151 211 261 271 286 301 106 165 220 240 253 270
grain size description, color
gravely sand, orange/brown fine sand with some sih, orange gi'avely sand with fface of sih, tan well-sorted sand with some sill and gravel, (an gravely sand with trace of silt, orange./tan well sorted saiul sandy gravel, tan clay, grey tine gravely sand with some silt, tan gravely sand, tan well sorted sand with some ^rave^grev red clay and sih interbedded clay and silt}' sand, tan medium to fine sand with trace of silt, grey coarse sand, tan well-sorted sand with some gravel, g rev sand with some silt and gravel, tan medium lo fine sand with trace of silt, tan sand with trace of gravel and silt clay, grey sand witii some clay, grey fine sand wiili trace of silt, tan gravel, tan gravel with some clay med. to coarse sand, tan sand with some silt, orange silty clay gravely sand with trace of silt, grey silty sand silty sand, grey sandy aravel coarse to med. sand, orange coarse sand, tan coarse to med. sand with some gravel, brown well sorted sand with some silt and gravel, brown sandy gravel silty clay, grey
Density (cm.Vs)
1.638 1.729
1.930
1.865 1.840 1.811 1.813 1.967 1.970 1.920 1.804 1.871 1.857 1.S79
1.787 1,787 1.964 1.993 1.684 2.157 2.096 1.951 1.987
2.073 1.718 1.989 2. HI 1.911 1.937 2.101 1.894 2.322
sieve/ hydrometer
sieve
sieve/hyd. sievc'hyd. sieve/hyd. .sieve sieve/hyd.
sieve
sieve
sieve,4iyd.
sieve sieve.'hyd. . sieve/Tiyd. sieve
sieve/hyd.
sieve/lwd.
sieve
sieve sieve/hyd.
<4mm (fraction
0.9942
0.9551 0.9864 0.8428 0.9978 0.4118
0.9745
0.9829
1.0000
0.9829 1.0000 1.0000 0.9811
1.0000
0.9612
0.3155
0.9279 0.9773
0.329 0.239
0.304
0.244 0.281 0.307 0.284 0.170 0.224 0.323 0.348 0.330 0.308 0.307
0.315 0.315 0.268 0.235 0.367 0.644 0.222 0.226 0.226
0.209 0.347 0.233 0.179 0.273 0.295 0.241 0.381 0.187
average: .917*0.147 0.286 ± 0.086
3 0 2 9 8 8

32
Table 4.1-6 List of Composite Sediments.
Deep composite 1 (DC-1)
equal parts
D-1 & D-2
Sample No. Depth (ft)
D-IS-H 220.5-221'
D-IS-J 240.5-241'
D-IS-K 252.5-253'
D-2S-F 260.5-261'
D-2S-H 270.5-271'
D-2S-J 285.5-286'
D-2S-M 300.5-301'
Deep Composite 2 (DC-2)
Eqnal parts
Aquifer units A3b-A3c
WeU Depth (ft)
Dl 220-272.5'
D2 285-302'
MW36/37 composite
Equal parts
Aquifer units A2a-A3c
Sample No.
MW36
MW36S-A
MW-36S-B
MW-36S-G
MW-36S-K
MW-36S-N
MW-36S-0
MW37
MW-37S-B
MW-37S-E
MW-37S-I
MW-37S-L
MW-37S-R
Depth (ft)
80-80.5'
108-108.5'
172-172.5'
204.5-205'
228.5-229'
238.5-239'
119-119.5'
168.5-169'
199-199.5'
217-217.5'
267.5-268'
MW36/37 shallow composite
Equal parts
M W 3 6 & M W 3 7
Sample No.
MW-36S-B
MW-36S-C
MW-36S-D
MW-37S-C
MW-37S-C
MW-37S-F
Depth (ft)
109-109.5'
151-151.5'
158.5-159'
154-154.5'
162.5-163'
171.5-172'
Composite
Name
A2a
A2b
C2AI
A3a
A3b
A3c
Equal parts
MW36
Depth (ft)
80-80.5'
108-108.5'
172-172.5'
204.5-205'
228.5-229'
238.5-239'
MW37
Depth (ft)
NA
119-119.5'
168.5-169'
199-199.5'
217-217.5'
267.5-268'
t /
NA= sample &om this aquifer was all clay, not used for the composite sediments
3 0 2 9 8 9

33
4.1.3 Groundwater Chemistry Analysis
A total of 40 aqueous samples were collected at various depths as the four boreholes were advance and are identified in Table 4.1-7. The field and laboratory analysis of these aqueous samples are tabulated in Table 4.1-8 through 4.1-10. Of partictilar interest are data from the targeted aquifer units, primarily the intermediate sands (C2AI) and the lower aquifer units (A3). There appears to have been some problems with the equipment used to obtain some of the field parameter data, in particular the dissolved oxygen (Oj saturation is 8.4 mg/L at 25 °C) and periodic malfimctioning and erroneous readings from the pH meter.
There is a considerable amount of variability in the pH range of the groundwater samples obtained ranging from 2.13 to 9.05. Monitoring well 36 appears to have the greatest variability in groundwater with the pH ranging from 2.13 to 7.36, while deep well 2 and the second monitoring well (MW-37) appear to have circumneutral to basic groundwater (6.7-9.05). Given the observed problems with the pH meter, it is unclear how reliable the values obtained are. Deep well 1 on the other hand appears to have circumneutral to acidic groundwater with a range of 2.71 to 6.79. The specific conductivity obtained for the aqueous samples is relatively imiform with an average of 0.236 ± .097 mS/cm. The average value obtained for the MW-36/37 monitoring wells was 0.248 ± 0.05, while the average value for the two downgradient wells (D-1 and D-2) was 0.228 ±0.116 mS/cm. There is a slightly more variability in the conductivity values obtained for the two downgradient wells, which showed a standard deviation twice that of the MW-36/37 monitoring wells, but over all the average value obtained was similar.
Consideration of the dissolved oxygen data in conjunction with the redox potentials provides, in some cases, corroborating evidence of the occurrence of naturally reducing conditions. For example, samples MW-37A-F, D-IA-G, D-IA-I, D-2A-D, and to a lesser extent MW-36A-A, D-IA-K, and D-2A-E show low dissolved oxygen concentrations and are well correlated with low (and sometimes negative) redox potentials. It should be noted that all of these samples also indicate high turbidity conditions during sample collection, so the reducing conditions observed may be caused in part by drilling induced effects (i.e., fresh mineral surfaces exposed during the drilling process). The amount of Fe(ll) found in most of the aqueous samples is very low, < .005 mg/L, indicating that the majority of aquifer zones investigated are not highly reduced. One exception was noted deeper in the intermediate sand and lower aquifer at borehole D-1, where higher amounts of Fe(n) were observed. It should be noted that the dissolved oxygen and redox potentials over this depth interval also indicative of more reducing conditions.
Groundwater samples were also analyzed in the field by CDM personnel using a Hach field test kit. It should be noted that no sample dilutions were performed for these analyses, resulting in a maximum concentration detection limit of 0.66 mg/L. Comparison of these data with total chromium by ICP-MS (Table 4.1-9) indicates poor agreement for many of the samples. Although total chromium values can be slightly higher than Cr(VI) values due to the potential for small amotmts of mobile Cr(in) in the
302990

34
aqueous samples (especially when not filtered), the differences observed in the collected data are not systematic and caimot be explained by this effect. Because no dilutions were performed for the Cr(VI) analysis on the higher concentration samples, a comparison of these values is not possible. Some of the low to moderate concentration samples do compare, although not very well, while others do not compare at all.
Trace metal analysis of groundwater samples collected by CDM are provided in this report for comparison with laboratory data generated in this study.
302991
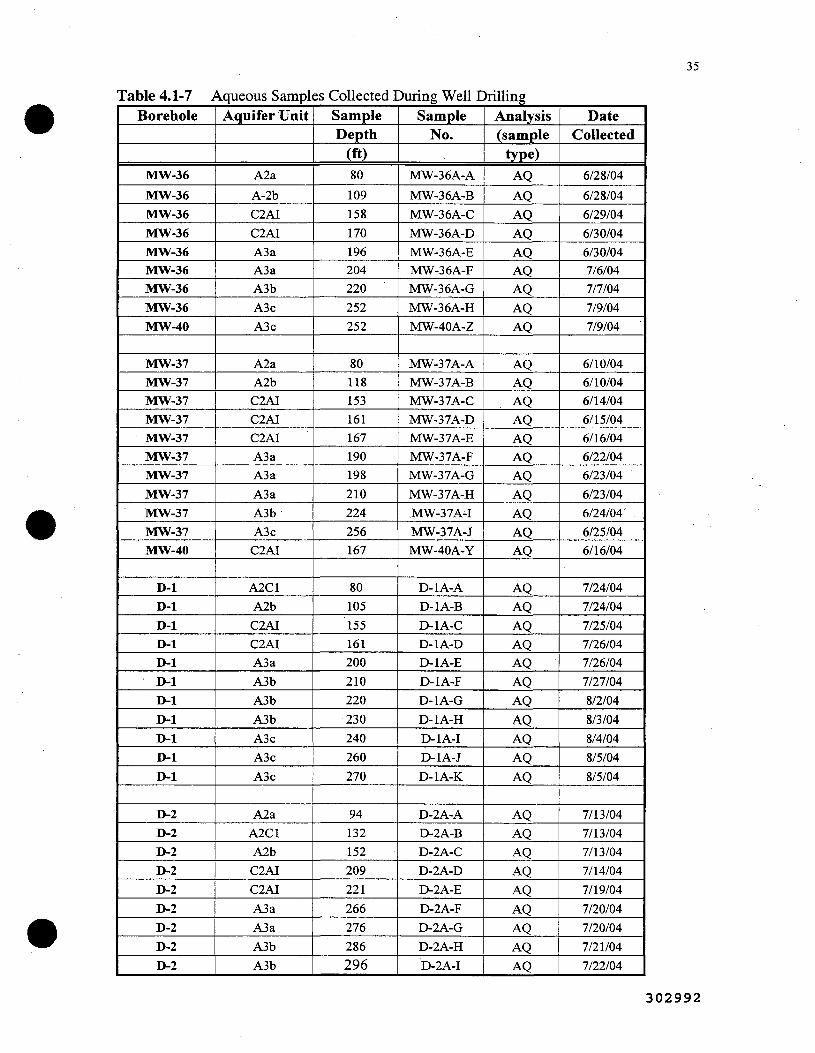
35
Table 4.1-7 Aqueous Samples Collected During Well Drilling Borehole
MW-36
MW-36
MW-36
MW-36 MW-36 MW-36 MW-36
MW-36
MW-40
MW-37 MW-37 MW-37
MW-37 MW-37
MW-37 MW-37
MW-37
MW-37
MW-37 MW-40
D-1
D-1
D-1 D-1 D-1
D-1 D-1
D-1
D-1
D-1
D-1
D-2 D-2
D-2
D-2
D-2
D-2
D-2
D-2
D-2
Aquifer Unit
A2a
A-2b
C2AI
C2AI
A3 a A3a A3b
A3c
A3c
A2a A2b C2AI
C2AI C2AI A3a A3a
A3a
A3b
A3c C2AI
A2C1
A2b
C2AI C2AI A3a
A3b
A3b
A3b A3c
A3c
A3c
A2a
A2C1
A2b C2AI
C2AI
A3a A3a
A3b
A3b
Sample Depth
(ft) 80
109
158
170
196 204 220
252
252
80 118 153 161 167
190 198
210 ^ 224
256 167
80
105
155 161 200
210
220
230
240
260
270
94
132
152
209
221
266 276
286
296
Sample No.
..
MW-36A-A
MW-36A-B
MW-36A-C
MW-36A-D
MW-36A-E MW-36A-F
MW-36A-G
MW-36A-H
MW-40A-Z
MW-37A-A MW-37A-B MW-37A-C MW-37A-D
MW-37A-E MW-37A-F MW-37A-G
MW-37A-H MW-37A-I
MW-37A-J MW-40A-Y
D-1 A-A
D-IA-B
D-IA-C D-IA-D D-IA-E
D-IA-F
D-IA-G
D-IA-H D-IA-I
D-1 A-J
D-IA-K
D-2A-A D-2A-B
D-2A-C
D-2A-D
D-2A-E
D-2A-F D-2A-G
D-2A-H
D-2A-I
Analysis (sample
type)
AQ
AQ
AQ
AQ AQ AQ AQ
AQ
AQ
AQ AQ AQ
AQ AQ AQ AQ
AQ AQ
AQ AQ
AQ
AQ
AQ AQ AQ
AQ
AQ
AQ
AQ
AQ
AQ
AQ AQ
AQ
AQ
AQ
AQ AQ
AQ AQ
Date Collected
6/28/04
6/28/04
6/29/04
6/30/04 6/30/04 7/6/04 7/7/04
7/9/04 7/9/04
6/10/04 6/10/04 6/14/04
6/15/04 6/16/04 6/22/04 6/23/04
6/23/04
6/24/04'
6/25/04 6/16/04
7/24/04 7/24/04
7/25/04 7/26/04 7/26/04
7/27/04
8/2/04
8/3/04 8/4/04
8/5/04
8/5/04
7/13/04
7/13/04
7/13/04
7/14/04
7/19/04
7/20/04
7/20/04
7/21/04
7/22/04
302992

36
Table 4.1-8 Sample
No.
MW-36A-A
1VIW-36A-B
MW-36A-C
MW-36A-D
MW-36A-E
MW-36A-F
MW-36A-G
MW-36A-H
MW-40A-Z
MW-37A-A
MW-37A-B
MW-37A'C
MW-37A-D
MW-37A-E
MW-37A-F
MW-37A-G
MW-37A-H
MW-37A-I
MW-37A-J
MW-40A-Y
D-IA-A
D-IA-B
D-IA-C
D-IA-D
D-IA-E
D-IA-F
D-IA-G
D-IA-H
D-IA-I
D-IA-J
D-IA-K
D-2A-A
D-2A-B
D-2A-C
D-2A-D
D-2A-E
D-2A-F
D-2A-G
D-2A-H
D-2A-I
Field and Laboratory Analysis of Aqueous Laboratory
Fe(II)
mg/L
<DL
<DL
<DL
<DL
<DL
<DL
<DL
0.012
0.009
0.001
0
<DL
0.047
0.002
0.161
0.002
0.002
0.002
0.003
0.002
0.060
<DL
0.028
0.067
<DL
0.107
0.048
0.062
0.278
0.102
0.120
0.014
0.201
0.041
<DL
0.006
<DL
<DL
<DL
<DL
Field
Cr<VD
mg/L
0
0.03
0.38
>0.66
0.16
>0.66
>0.66
0
0
0
0
0
0.01
0
0
0.05
0.06
0
0
0
0
0
0
0
0
0
0
0
0
0
0
0
0
0
0
0
0
0.28
0
0
Field
pH
7.36
5.75
6.86
2.13
3.51
3.63
(-8.22)
6.34
7.59
6.69
7.47
5.94
6.79
6.22
5.67
6.13
5.89
4.89
5.02
4.91
5.84
2.71
6.59
MNW
MNW
7.77
MNW
6.48
6.64
7.19
9.05
Spec.
Cond.
mS/cna3
0.238
0.239
0.22
0.196
0.286
0.287
0.148
0.301
0.308
0.222
0.289
0.187
0.213
0.177
0.154
0.18
0.131
0.216
0.184
0.149
0.31
0.065
0.231
0.218
0.156
0.57
0.159
0.377
0.434
0.236
0.222
Turbidity
off scale
500
8.9
4
50
5.1
aqSO
47.8
off scale
off scale
off scale
2.94
6;54
47
25.1
3.16
176
563
10.7
off scale
off scale
off scale
off scale
off scale
52.9
off scale
off scale
229
69.2
10.11
14.7
Samples.
Dissolved
0 2 (mg/L)
4.16
(194)
(18.58)
6.14
(11.02)
7.6
5.73
5.1
(13.21)
0.3
8.47
7.9
8.63
7.82
6.89
(12.71)
3.76
0.09
5.77
0.96
4.4
1.04
(14.5)
7.17
4.21
2.3
4.51
(9.27)
4.68
8.55
8.04
Temp
°C
22.76
23
19.96
18.18
19.47
18.59
24.24
18.83
20.76
23.84
20.87
18.6
22.92
20.52
18.67
18.5
20.19
23.63
21.87
20.75
18.93
17.25
20.84
22.4
22.49
24.18
18.3
22.22
25.01
23.9
18.83
Redox
Potential
63
366
550.5
369.1
396.9
568
596
362.9
214.6
-248
427
278
425.9
141
240.1
176.5
282.6
-346.9
192
-36 .
222.3
106.7
-57.5
443.2
148.7
16.9
130.9
482.7
566.3
481.7
252.6
Average STDEV MNW= Meter not working < DL= Less than detection limit 0
0.236 0.097 '
not included
9.38 6.92
20.98 2.22
[1 Li
3 0 2 9 9 3

37
4.2 Natural Attenuation of Chromate (Cr(VI)04 ) - Adsorption
Chromate attenuation in the natural subsurface enviroimaent associated with abiotic geochemical processes in Puchack aquifer materials has been examined. These include batch studies of a) chromate adsorption, i.e., how much Cr(Vl) mass is on surfaces relative to in solution (Section 4.2), and b) the natural reductive capacity of sediments from the targeted aquifer imits (i.e., intermediate sand and lower aquifer) to provide an estimate of its potential for natural reduction of mobile chromate to immobile Cr(in) phases (Section 4.3). In addition, adsorption of chromate by sediments in 1-D columns was evaluated to confirm batch observations imder flow conditions (4.4).
Chromate adsorption-desorption results in a lag in the migration of the chromate plume through the aquifer. This lag depends on the amoimt of adsorption which is dependent on many factors including solution pH, chromate concentration, ionic strength and sulfate concentration in the aquifer groimdwater and contact time of chromate with sediments. The influence of these factors on chromate adsorption by deep composite sediments are described in the following section. These sediments designated 'DCl' and 'DC2' are described in Section 4.1 and Table 4.1-6.
4.2.1. Influence of Time and Solution Composition on Chromate Adsorption The time required for the deep composite sediment, DCl, to reach adsorption
equilibrium, (equilibration time) was determined in both distilled water and a synthetic groundwater. Water quality data from three monitoring wells at the Puchack site (Table 4.2-la) for seven major constituents were averaged and this average determined the composition of the synthetic Puchack groimdwater used in this study (Table 4.2-lb). The ionic strength of the synthetic groundwater was 4.3 mM, which is typical of groundwater. Because adsorption of anions like CrO/" are known to depend on solution pH, the pH of sediment suspensions was typically adjusted from its natural pH to a target value in the range 4 < pH < 9 prior to the addition of chromate and the start of adsorption experiments. Once started, a stable suspension pH was approached for DCl within 10 to 15 hr in both distilled water and synthetic groundwater (Figure 4.2-1). This was also true for DC2, however up to 2 to 3 days were required for individual deep core samples NRS-1, -2 and -3 (data not shown see Section 4.3.1 for sample description) used in the natural reduction experiments discussed in Section 4.3 and 4.4. The relatively good agreement between the distilled water and synthetic groundwater cases indicates that pH equilibration times were not affected by solution composition (ionic strength) for any of the sediments examined.
The time dependence of chromate adsorption in this experiment (Figure 4.2-2) demonstrates that the initial adsorption was fast (minutes) and that within 10 to 15 hr equilibrium was approached at pHs in the neighborhood of 4 and 8 for both distilled water and groundwater. Thus, contact times of 18 to 24 hr were typically used in the adsorption experiments described below, unless otherwise noted. At equilibrium more chromate is adsorbed at both pH values from distilled water suspensions than from
302994

38
synthetic groundwater suspensions (Figure 4.2-2), indicating that solution composition and ionic strength affect chromate adsorption. This is consistent with previous studies of chromate adsorption (Zachara et al., 1987,1989) and will be examined in more detail in the sections that follow.
Table 4.2-la. Water quality data from three monitoring wells at the Puchack site sampled between September 2000 and February 2001.
parameter units MW-IS MW-IS MW-251 Depth
sampling date DO pH
Cr(VI) TotCr
Eh specific conductance
alkalinity as CaCOS Ca Mg Na K CI
804 NHS N02
N03/N02 P04 TotP TOC
Al Ba
TotFe Mn
feet
mg/L
ug/L ug/L MV
uS/cm
mg/L mg/L mg/L mg/L mg/L mg/L mg/L mg/L^ mg/L mg/L mg/L mg/L mg/L ug/L ug/L ug/L ug/L
51 -56 2/14/01
3.48 5.17 9420 8010 320.5 514
17.2 22.5
11 59.3 8.65 61.2 111 1.2
0.074 <0.1 0.12 0.26 1.2
27.1 41.4 <100 607
5/7/98 0.6 5.2
11540
570
9.3
144-154 11/1/2000
0.43 4.94 8740 6310 369 203 10.4 9.68 6.38 10.4 2.94 13.3 37.5 0.77 0.091 0.91 0.17 0.035 0.58 47.6 94.6 <100 87.4
Table 4.2-lb. Composition of synthetic groundwater used in adsorption experiments.
Composition
*CaCO 3 Ca Mg Na K CI
504 pH
Concentration mmol/L
0.14 0.42 0.35
._ .1.22 -0.13 1.31 0.66
' 4.94-5.17
* Alkalinity as CaCO
3 0 2 9 9 5

39
9
8.5
pH Variation During Cliromate Approacli to Adsorption
Equiiibration
6.5
6
5.5
5
ft ft
•t±z 10.0 15.0 20.0
Time (h)
• pH 8 Di water • pH 8 syn GW A p H 4 syn GW
• p H 4 D I water
rsw = 0.25 g/ml (CrO4}T = 0.19mM Deep Composit 1
Figure 4.2-1. Time to reach a stable pH as chromate adsorption equilibrium is approached in a suspension of the DCl sediment after the initial pH adjustment to approximately pH 8 and 4 and addition of chromate.
Change in Chromate Adsorpt ion wi th Time
2 0 -
15-
10
5 -
0 -
—.— pH 8 syn GW
- l i - pH 8 Di water
- * - p H 4 s y n G W
- « — p H 4 D i w a t o r
X ^ f ^ ^ = = = = =
raw = 0.25 g/ml (CrO.K = 0.19mM Deep Composit 1
0
*
\r 0.0 5.0 10.0 15.0 20.0
Time (h)
25.0 30.0
Figure 4.2-2. Approach to chromate adsorption equilibrium in distilled water and synthetic groundwater suspensions of deep composite 1.
4.2.2 Influence of pH on Chromate Adsorption
Chromate adsorption by deep composite sediments DCl m distilled water (Figure 4.2-3) and DC2 in actual Puchack ground water containing sulfate (a maximum of 50 mg/L) (Figure 4.2-4) was highly dependent on the pH. These pH edges are typical for anions such as Cr04^" (Zachara et al., 1987,1989) and show more adsorption at low pH (pH < 7 to 8.5) and decreasing adsorption under increasingly alkaline conditions. The adsorption 'edge' refers to the pH region over which adsorption is rapidly changing as a function of pH. Although different sediment composites were used for the distilled water
3 0 2 9 9 6

40
and the Puchack groundwater adsorption edges, these experiments do show that more chromate is adsorbed from distilled water than from the groundwater. This is apparent from the displacement of the groundwater edge to lower pHs relative of that of the distilled water edge (compare Figure 4.2-3 and 4.2-4). This is most likely due to the presence of SO4 in the groundwater (Zachara et al., 1987) which is examined below (Section 4.2.4). The difference between the 3 hr and 18 hr groundwater edges (Figure 4.2-4) is consistent with sorption equilibrium requiring 10 to 15 hr as described in the previous section.
120 1
100-
80-
60-
40-
20
Chroinate Adsorption Edge
• • • a • . ^^^ Di water rsw = 0.5 g/ml
(CrO,)T = 9.6ulvl Deep Composit 1 24 h contact time
3.00 4.00 S.OO 6.00 7.00 8.00 9.00
Finai pH
Figure 4.2-3. Dependence of chromate adsorption on pH in deionized water.
Chromate Adsorption versus pH
100-
0)
n O 60-
• o
< 401
20-
4 - - - ^ - . : ^ : : . ^ .--A^
18h 3 h
" - - A ^.
Puchack Deep Composite 2 Puchack Groundwater
" A • " • • .
"T" 6 pH
8
Figure 4.2-4. Chromate adsorption edge in Puchack groundwater for deep composite 2 using two contact times.
302997

41
4.2.3 Adsorption Isotherm - Influence of Chromate Concentration on Adsorption
Aquifer sediments have an adsorption maximum or 'loading' capacity for chromate, sulfate and other adsorbing constituents in solution. The adsorption maximum occurs when the surface sites, to which Cr04^" coordinates, have been completely occupied. This loading capacity will depend on the surface area and/or surface fimctional groups at the sediment-solution interface. This maximum loading capacity for the DC2 sediment at pH 5.6 (in the pH region where adsorption is the strongest) in synthetic Puchack groundwater (soil water ratio, rsw = 0.25 g/mL) was evaluated by varying the initial chromate concentration in separate suspensions from 0 to 0.96 mmol/L. Suspensions were equilibrated for 24 hr and the final chromate solution concentration in the 0.1 um filtrate was measured. The concentration of adsorbed chromate was determined from the difference in the initial concentration and the measured final solution concentration. A plot of the adsorbed concentration, normalized Chromate Sorption isotherm, pH 5.6,
, ^ , . 1 Puchack Deep Composite 2
to the grams of sediment, '" -• — S(umol/g), versus the final equilibrium solution concentration, C(umol/L), is referred to as an adsorption isotherm (Figure 4.2-5). For sediment DC2 chromate adsorption is linear at low concentrations, but as the solution concentration increases the incremental increase in adsorption diminishes and eventually reaches a plateau, the adsorption maximum.
•S" "5 E 10'
10-
10-
Langmuir-Freundl id S = MfK-CV
1 + (KC)' M = 6 K=1.4
^0.85 Langmuir: S = MKC M = 6 1+KC K = 3
soiVwater = 0.25 g/cm3 Puchack deep composite 2 synthetic groundwater
T" 10- 10-'
C (umol/mL) 10'
Figure 4.2^5. Chromate adsorption isotherm for deep composite 2 in synthetic Puchack groundwater after 24 hr contact time.
As the adsorption maximum is approached the percentage of the total chromate that is adsorbed decreases. Under these high loading conditions the adsorption edge is suppressed over the entire pH range and at low pH adsorption would not approach 100% as it did in Figure 4.2-3 and 4.2-4. This occurs because the loading of surface sites has reached the limit for a particular sediment. The isotherm in Figure 4.2-5 has been fit with both Langmuir and Langmuir-Freundlich equations from which the adsorption maximum, M, and an affinity constant, K, were derived. These can be used in chromate transport calculations in groundwater systems. At the Puchack site where a continuous influx of chromate from the source area may occur the adsorption maximum may eventually be reached and adsorption will no longer retard the advancement of the chromate plume.
4.2.4 Influence of Sulfate on Chromate Adsorption
The influence of SO4 ' on Cr04 ' adsorption by deep composite sediments DC2 was examined to determine if competition by another adsorbing oxyanion for available
302998

: ' ]
surface sites results in a significant reduction in chromate adsorption. Sulfate additions to separate distilled water suspensions of DC2 at pH 6.3 covered a range of 0.5 to 50 ppm (1.04 to 521 uM) which has been observed in well water from the Puchack site. After mixing with SO4 for 1 hr suspensions were spiked with chromate (9.6 uM) and then mixed for an additional 3 hr before being filtered and analyzed for chromate.
The presence of sulfate in the concentration range examined did not interfere with the DPC analysis of chromate as shown in Figure 4.2-6. Chromate adsorption was suppressed by sulfate (Figure 4.2-7), which was alluded to above and is consistent with prior observations under similar conditions for amorphous iron oxides (Zachara et al., 1987) and subsurface soils (Zachara et al., 1989). This suppression increased with increasing sulfate concenfration resulting in a 15 % drop in chromate adsorption. Thus, chromate disposal and migration in the presence of SO4 and other anions (e.g., HCOs ' and COs ') in the contaminant plume will decrease chromate adsorption relative to adsorption which would occur in their absence. However, with only a factor of 2 decrease in the K<iS derived from these experiments (Figure 4.2-8), the effect of sulfate on chromate migration in the concenfration range found at Puchack is relatively small.
4.2.5 Influence of Colloids on Chromate Adsorption
Adsorbed chromate on colloidal particles could possibly be a mode of chromium fransport in subsurface aquifers. To evaluate the possibility of
42
EffBct o f s o . on OPC CrO* A n a l y s i s
s o , cone (ppm) In lO-ppm CrO,
Figure 4.2-6. Evaluation of potential interference of SO4 with the DPC analysis of 10 ppm Cr04 in distilled water.
AttKt of Sulfata on Chroinit*
pH6.3. mv =0.5 g/ml
(CfO.}T = 9.6uM Deep Composit 2
DI waier
y = -4.242U(X) + S4.4aS
150 200 2S0 300
Figure 4.2-7. Decrease in chromate adsorption with an increase in sulfate concenfration at pH 6.3.
2S
" aa
,.. 16
'< 1 !
50 t
pH 6.3. r»w ^ . 5 g/ml
(CfO.), = 9.6 liM DeepComposil2
DI water
y = ^ .3077Ln(x) +3 .1098
R' ^ 0.9772
•
^ ^ ^ ^ ^ — _ _ _ _ _ _ ^
« D0 1 5 0 Z O 0 250 3 O Q 3 5 0 4 a ) 4 5 O S ( » Sulftta ConcantnOon (uH)
Figure 4.2-8. Reduction in the chromate distribution coefficient (Kd) on deep composite 2 with increasing sulfate concenttation corresponding to the decline in the percent adsorption shown in Figure 4.3-7.
.J
colloidal chromate present in Puchack composite sediment DCl, chromate was adsorbed
302999

43
to this sediment at pH 4.6 and 7.7 in distilled water and synthetic Puchack groundwater (Figure 4.2-2). After a 24 hr equilibration time, aqueous samples were filtered with 0.45, 0.2, 0.1 and 0.01 um membrane filters and the filtrates analyzed for Cr04 (Figure 4.2-9). If significant colloidal chromate were present chromium concenttation should decrease with successive decreases in filter pore size. No consistent variation in chromate concenttation with filter pore size was observed. Although this does not prove that inorganic colloids are totally
Potential Effect of Filter Pore Size
8.0
• 0.45 um • 0.2 um no. l um D0.01 um
(CrO.K='0.19mM Deep Composit 1
pH 8 syn GW pH 8 DI water pH 4 syn GW
Samples
Figure 4.2-9. Evaluation of chromate adsorption to colloids present in deep composite 1 sediments using a sequence of membrane filters to separate phases at the termination of a 24 hr adsorption experiment in distilled water and synthetic groundwater at pH 4 and 8.
absent, we can conclude that either there is no generation of inorganic colloids in Puchack sediments and/or the small fraction of total chromate present on these colloids is of negligible importance for chromate mobility.
4.3 Natural Attenuation of Chromate Aquifer Sediments
Reduction/Immobilization by Natural
Chromate adsorption not only results in a lag in the plume as indicated in Section 4.2, but also facilitates or catalyzes chromate reduction to Cr(IIl) by sediment surfaces containing election donors , e.g., sorbed or mineral Fe(Il) phases resulting from chemical or microbial reduction of Fe(in) oxides. Mineral surfaces facilitate the three election transfer required in chromate reduction. If there is some degree of naturally occurring reductive capacity in the sediments, some fraction of the Cr(VI) species can be reduced to Cr(III) species and form insoluble mixed Cr, Fe precipitates. It is critical to quantify this reductive capacity because, if the amount of natural reductive tteatment is significant, credit can be taken for tteatment ofa substantial mass of the chromate plume. To address this possibility untteated Puchack sediments were used in long term (2 to 9 months) batch studies to determine: a) the degree to which chromate is reduced by untteated Puchack sediments, b) the influence of oxygen on the rate of chromate reduction, c) the reactive phase(s) responsible for chromate reduction.
4.3.1 Rate of Chromate Reduction by Natural Aquifer Sediments
To address whether chromate can be reduced in the natural Puchack aquifer and at what rate, long-term chromate batch reduction studies were conducted with four sediments (Table 4.3-1). The first was a deep composite sediments (DC2) suspected of
303000

44
n having little reductive capacity. The three other sediments were not composites but were representative of the deep aquifer units that were visually judged to have some reductive capacity. These latter sediments were designated 'natural reduced sediments', NRS-1,-2 and -3. In anoxic reduction experiments the loss of chromate from solution was followed over time (Figure 4.3-1) and interpreted as chromate reduction based on the fact that adsorption equilibrium is obtained within 10 -15 h (Section 4.2). After adsorption equilibrium is reached the continued loss from solution over the remaining 1500 to 6600 hours of the experiments was due to the reduction of the adsorbed Cr(VI) to Cr(lll). As reduction occurred with time, adsorption equilibrium was reestablished with the accompanying decrease in aqueous chromate. This interpretation is supported by the fact Ll
that 0.1 % or less of the total chromate initially added to NRS-1 in three separate 1500 h experiments could be recovered by raising the suspension pH to 12, to desorb chromate, mixing the suspension for 24 h and analyzing the filtrate for chromate. This lack of recovery is consistent with reduction of the adsorbed Cr(VI) to Cr(III) which then
Table 4.3-1. sediments.
Sample Name
DC2
NRS-1
NRS-2
NRS-3
Sediments used in studies of chromate reduction by natural aquifer
Sample No.
see Table 4.1-8
D-IS-M extra
MW37S-C
MW37S-L,
Well
DI and D2
DI
MW-37
... MW-37
Depth
220 - 302.5'
272- 272.5'
154-154.5'
217-217.5'
0 0 (wt %)
nd
2.25
0.01
' 0.01
Fe(ll)
nd
P
nd
• n d
Characterization
Deep composite 2 (DC2)
dark clay
sand < 1% with blacl< dposits
sand < 1% with black dposits
nd : no data available P : Indicates that sediment possibly contains Fe(ll) and/or lignite (see text)
precipitates to form Cr(III)(0H)3 or as a mixed (Cr, Fe)(0H)3 solid, both of which are very insoluble. Thus, the continued loss of chromate from solution after 15 h was interpreted as surface catalyzed chromate reduction. The observed chromate reduction rates for these sediments varied considerably (Figure 4.3-1) from a relatively short reduction half-life of 49.5 hr for NRS-1 (a dark clay sample) to considerably longer and relatively consistent half-lives for DC2, NRS-2 and NRS-3 (aquifer sediments) of 2570, 2900 and 2900 hr,
0.0-
Cr = 5.5 mg/L rsw = 0.09g/mL
reduction half-life
DC 2 2570 h NRS1 49.5 h NRS2 2900 h NRS3 2900 h
10 100 time (h)
1000
Figure 4.3-1. Reduction of chromate by selected natural aquifer sediments.
respectively (Table 4.3-2). It is important to note however, that for all of these natural untteated sediments significant chromate reduction occurred. With NRS-1 essentially 100% reduction of the initial chromate (10.6 micromoles) occurred within 120 hr, whereas for the other sediments nearly 77% of the chromate was reduced after 6600 hr.
303001

45
(aquifer sediments) of 2570, 2900 and 2900 hr, respectively (Table 4.3-2). It is important to note however, that for all of these natural untteated sediments significant chromate reduction occurred. With NRS-1 essentially 100% reduction of the initial chromate (10.6 micromoles) occurred within 120 hr, whereas for the other sediments nearly 77% of the chromate was reduced after 6600 hr. This would indicate that chromate reduction could occur in the natural untteated sediments through which the Puchack chromate plume migrates.
Table 4.3-2. Natural attenuation rates of chromate observed in experiments. For sediment descriptions see Table 4.3-1 and 4.1-6 .
sediment depth (ft) Chromate, Oj cone.
e- acceptor ratio
(0,/Cr)
sediments from specific depths chosen for reductive properties: DC 2 NRS-2
NRS-1 NRS-1 NRS-1
NRS-3 NRS-3 NRS-3
220-302.5 154-154.5
272-272.5 272-272.5 272-272.5
217-217.5 217-217.5 217-217.5
5.5 mg/L Cr, no 02 5.5 mg/L Cr, no 02
5.5 mg/L Cr, no 02 2.8mg/L Cr, 2.2 mg/L 02 1.7mg/LCr, 2.2 mg/L 02
5.5 mg/L Cr, no 02 2.8mg/L Cr, 2.2 mg/L 02 1.7mg/LCr, 2.2mg/L02
composite sediments representative of aquifer units: A2a A2b C2Ai A3a A3b A3c MW36/37
80-110 108-120 165-172 199-204 215-230 238-267 80-267
2.0 mg/L Cr, no 02 2.0 mg/L Cr, no 02 2.0 mg/L Cr, no 02 2.0 mg/L Cr, no 02 2.0 mg/L Cr, no 02 2.0 mg/L Cr, no 02 2.0 mg/L Cr, no 02
0/1 0/1
0/1 1.7/1 2.8/1
0/1 1.7/1 2.8/1
0/1 0/1 0/1 0/1 0/1 0/1 0/1
experiment longevity
(h)
6600 6600
1500 1500 1500
6600 2400 1500
2900 2900 2900 2900 2900 2900 2900
reduction rate (1/h)
2.70E-04 2.40E-04
0.014 0.052 0.015
2.40E-04 8.70E-04 7.70E-04
6.50E-05 . none 2.50E-05 2.50E-05
none none none
reduction half-life
(h)
2570 2900
49.5 13.3 46.2
2900 797 900
10,700 -
27,700 27,700
---
Total e acceptc
(meq)
0.038 0.038
0.038 0.053 0.046
0.038 0.053 0.046
0.014 0.014 0.014 0.014 0.014 0.014 0.014
The mineral and/or organic phases within these sediments responsible for the observed chromate reduction remain the subject of investigation. The organic phase of NRS-1 has been investigated and will be considered in the next section, section 4.3.3. However, there are some clues regarding possible reactive phases in sediment NRS-1 for which rapid reduction occurred. NRS-1 the dark clay material, was the only sediment to contain significant organic carbon (2.25 wt %), which based on sediment color was thought to contain lignite (Table 4.3-1). The other sediments contained very little organic carbon (< 0.01%, Table 4.3-3). The absence of detectable inorganic carbon (Table 4.3-3) places an upper limit of 5 [j,mol FeCOj per gram of sediment that could be present assuming a detection limit of 50 [xg inorganic carbon per gram of sediment.
303002

46
Fe(n) analyses of water in well Dl as a function of depth (from which the NRS-1 sediment was taken) shows Fe(n) concentration increasing with depth from 0.05 ppm at 155' to 0.12 ppm at 253' (Table 4.1-8). This frend may have extended downward in this aquifer unit to a depth of 273' where the NRS-1 sediment was collected. If so, this would surely indicate the presence of Fe(n) or other election donor in the NRS-1 sediment. In addition, the dissolved O2 concentrations in well Dl decreased with depth (Table 4.1-8) indicating an increasingly reduced environment with depth in which Fe(n) would persist. fron characterization of the NRS-1 sediment (Table 4.3-4, Dl-M, 272.5') indicates very large reductive capacity (636 umol/g, measured by O2 consumption). The 1 hr 0.5 M HQ extraction of this sediment indicated the presence of 2.4 |j,mol Fe(n)/g, possibly present as Fe(n) adsorbed + FeC03 + FeS (Table 4.3-4). Possible reductive phases that are not ruled out include lignite and structurally reduced iron in 2:1 smectite clays, as this sediment contains considerable high plasticity clay. In addition to the measured exttactable Fe(n), the presence of clays with structural ferrous iron (not determined in iron extractions) and/or lignite in the NRS-1 sediment would provide additional suitable electton donors capable of the rapid 'natural' chromate reduction observed for this sediment. For the NRS-2 and -3 sediments no exttactions or Oj column reductive capacity
Table 4.3-3. Carbon analysis of selected sediments. organic carbon inorganic carbon total carbon
sediment (%) (%) (%) NRS-1, Dim, 272' NRS-2, MW 37c NRS-3, MW37L DC-2, composite
2.25 0.011 0.010 0.020
0.00 0.00 0.00 0.00
2.25 0.011 0.010 0.020
measurements were performed. Thus, a similar conjecture (line of evidence) for these sediments is not justified because they contained no significant organic carbon, and well waters (well MW37, Table 4.1-8) at depths in the vicinity where these sediments were obtained contained high dissolved Oj and very low aqueous Fe(II) concenttations. vThe Fe(n) concenttations at depth in well MW37 were 400 times lower than those in well Dl where sediment NRS-1 was obtained. This is consistent with the very slow reduction rates observed for these two sediments, but as already noted significant reduction did occur in NRS-2 and -3 over a period of 9 months.
An additional group of composite sediments were used in batch anoxic experiments to evaluate chromate reduction, which could occur in individual aquifer units intersecting monitoring wells MW 36 and 37. Composites were designed to approximate an average composition within each aquifer units and were given the name of that unit, namely A2a, A2b, C2A1, A3a, A3b, A3c (Table 4.2-3). The observed reduction of chromate in these composites (Figure 4.3-2) was significantiy less after 2900 h than observed for the NRS sediments that were specifically selected for their potential reductive capacity (Table 4.3-2). Four of these composites showed no reduction of chromate (A2b, A3a, A3c and MW36/37, Figure 4.3-2). Three others composites (A2a, C2A1 and A3b, Figure 4.3-2) showed only slight reduction with estimated half-lives of 10700, 27700, and 27700 h, respectively (1 to 3 years; Table 4.3-2). At tiie field scale.
303003

47
the combination of the geochemistry reported here and flow determine the amount of reduction/immobilization of the chromate plume that would occur. Shallow aquifer composites show that slow chromate reduction occurred in half of the samples, although these rates were vary slow (1 year to 3 year half-life), based on only a few samples to of the aquifer system with wide ranging properties. A deep aquifer composite showed about lOx more rapid chromate reduction (108 day half-life), and selected sediments (typically finer grain sediments from interbeded clays) showed rapid chromate reduction with a 46 hour half-life. Qearly, these results show that natural chromate reduction can occur in the Puchack aquifer system, and as will be shown in the following section, chromate reduction does not appear to be adversely effected by the presence of dissolved oxygen. Given the amount of variabiUty observed in the samples analyzed in this study, predicting the expected chromate reduction rate in a complex aquifer system, based on the 8 composite sediments and the 3 individual sediments examined, would result in a relatively high degree of uncertainty. With this additional data simulations using a reactive ttansport model could ttack the chromate plume through the aquifer system with ranges of natural reduction rates. Thus, residence times could be determined in specific aquifer units/zone in which reduction rate data had been determined.
303004

48
1.0-
0.8-
o0.6-O
" 0 . 4 :
0.2-
0.0-
• • •
sediment: composite, unitA2a
adsorption (18%) degradation rate: L = 6.5E-5/h half life 10,700 h
TTTTTT 1 1 I I M M ] T " TTTT 1—I I N Mil
0.1 1 10 100 time (h)
1—'-'-^ 1000 10"
1.0-
0.8-
o0.6-O
" 0 . 4 :
0.2-
0.0-
•^ • •
sediment: composite, unitA2b
no adsorption no degradation
in 3000 h - T — r ' T T T m r
0.1 1 10 100 time (h)
1000 10^
1.0-
0.8-
o0.6-o "o.4H
0.2-
0.0-
sediment: composite, unit C2AI
adsorption (10%)
degradation rate: L = 2.5E-5/h lialf life 27,700 h
T I r I rn 1—i i i i r r
1.0-
0.8:
o0.6^ u " 0 . 4 :
0.2-
0.0-
sediment: composite, unitA3b
adsorption (5%) degradation rate: L = 2.5E-5/h half life 27,700 h
0.1 1 10 100 time (h)
1000 10" 0.1 1 10 100 time (h)
I I I M i l 1—I I I i i i i i 1—r r 1000 IO''
0.8:
0.6^
0.4^
0.2:
0.0^
• ' ' '
sediment: composite, unit A3a
adsorption (18%)
no degradation
• • . •
"r-n-irr] 1—i i i r r r q —
- •
1.0-
0.8-
0.6^
0.4^
0.2-
0.0-
sediment: composite, unit A3c
adsorption (20%)
no degradation
0.1 10 100 time (h)
1000 10" 0.1 TTT] 1 r - T T T T T T p
1 -I—I [• I m i l 1—I I 11 Mil 1—1 I I M
10 100 time (h)
1000 10^
1.0-
0.8-
o 0.6-1 O o 0.4H
0.2
0.0-
• • sediment: composite MW36+37 A2a,A2b,A2AI, ASa; A3b, A3c
adsorption (10%)
no degradation (3000 h) 1 1 1 I I IM| TTTTTT] 1—rr i I irr[ 1—T-TTTTTT] 1—i i i i i
0.1 1 10 100 time (h)
1000 10"
n
u
• : , ;
Figure 4.3-2. Reduction of chromate under anoxic conditions by untteated sediment composites of wells MW 36 and 37. Initial conditions were 4.6 mg/L chromate and 0.00 mg/L dissolved oxygen.
3 0 3 0 0 5

49
4.3.2 Influence of Dissolved O2 on the Natural Chromate Reduction Rate
Specific Puchack sediments have been shown to be highly effective in reducing chromate under anoxic conditions. Thermodynamically, dissolved Oj should be reduced before chromate in suspensions of these sediments. Thus, chromate reduction by naturally reduced sediments should be slowed in the presence of dissolved O2, often present in groundwater. A recent study found that nitrate reduction by dithionite reduced sediments was not affected when the electton acceptors equivalents of nittate present in suspension were comparable to the equivalents of either dissolved O2 or chromate (Szecsody et al., 2005). This is conttary to the thermodynamic sequence that dissolved O2 and chromate should be reduced before nittate. The lack of any observed affect was attributed to the overwhelming excess of electton donor equivalents supplied by the reduced sediments in that study.
The influence of dissolved O2 was examined with 10 g suspensions of NRS-1 and NRS-3 with 2.2 mg/L of dissolved Oj (0.033 meq of electton acceptors) and 1.7 and 2.8 mg/L of Cr(VI) (0.0125 and 0.0194 meq)
Chromate Natural Reduction w/02 high capacity sediment NRS1
10 time(h)
Chromate Natural Reduction w/02
1000
resulting in O2 : Cr electron acceptor ratios 2.8:1 and 1.7:1, respectively (Table 4.3-2). For these sediments no exttactions for Fe(n) were performed so no estimate of elecfron donor equivalents is available, however using an average extractable Fe(n) (see next section) the electron donor capacity in these experiments may have been > 3.5 meq/g. Rather than decreasing or remaining the same in the presence of dissolved Oj the rate of chromate reduction increased by a factor of 3 in three out of four experiments relative to rates in anoxic experiments. This is shown clearly by comparing chromate loss for anoxic and oxic conditions (Figure 4.3-3a,b). The explanation for the acceleration of chromate reduction is presently unclear, but may possibly be attributed to sediment heterogeneity in sub-samples used for either the anoxic or oxic experiments. In the fourth experiment (NRS-1 with electton acceptor ratio of 2.8:1) no change in reduction rate was observed. Thus, the effect of dissolved oxygen on the rate of chromate reduction in these batch experiments is currentiy unresolved. However, the most important result derived from all of these experiments is that the amount of chromate reduced by the end
Figure 4.3-3. Comparison of chromate reduction for natural sediments with oxygen: a) NRS-1, and b) NRS-3.
303006

50
of the experiments was approximately the same with and without the presence of dissolved oxygen. Thus, oxygen at the concenttation considered did not appear to diminish the ultimate extent of chromate reduction by the NRS-1 and NRS-3 sediments.
1.00-
1 " • ' = "
3 0.50-
S 0.00-
V13-V21 Disso lved Oxygen • . . . .
•r^w^-^^* reductlva capacity : 220 pv 02 ° 74 umol Fe/g I - ' r ' '' ••• r • • ' — T r ' r ~ - r ' r •
200 300 400 S pore volumes
V13-V21 Dissolved Oxygen
conditions: 0.6 h residence time . ^ w C ^ * ^ * ' ^ ' ^ " - ^ " . ' ^ *
However, in these experiments the initial concenttation of O2 was not constantly replenished as it would be in a naturally reduced aquifer with an oxygenated Cr(VI) plume moving through it. A recent study with dithionite reduced Hanford lOOD sediments addressed this case (ref for nittate reduction study). In that study, a series of five column experiments were conducted where 250 pore volumes of O2 saturated solution (8.4 mg/L O2) containing 2 mg/L chromate and 60 mg/L of nitrate were pumped through the sediment column at a flow rate to achieve an 8 h residence time (Figure 4.3-4). Periodic measurements of N-compounds, oxygen, and chromate were made to determine reaction rate changes. During the first 125 pore volumes (hours), during which O2 was consumed by the reduced sediment (Figure 4.3-4b), the sediment's capacity to reduce Cr(VT) was not significantly affected as the effluent chromate data shows (Figure 4.3-4c). Beyond 125 pore volumes (hours) chromate reduction is diminished as a result of the consumption of the sediments electron donor capacity by the presence of dissolved O2, nittate and chromate. Note that this sediment was highly reduced and the flow rate used in this experiment was greater than in typical groundwater flow conditions. Thus, with a less reduced Puchack sediment, and slower flow the time scale for dissolved O2 to impact chromate reduction may be different. Nevertheless, this demonsttates the effect that dissolved Oj in groundwater may have on chromate reduction by natural reduced Puchack sediments. Additional colunm studies with composites of natural reduced Puchack sediments and typical groimdwater composition and flow would be required to resolve the time-distance scale over which O2 and other electron
0.50-
: 0.25-
. vc^ *^ " ' " '
- K^^f^Km.i:-^^'*
200
? 1 « -
£ 0.8-o E I 0.6-
y 0.4-
i 0.2-
100 pcra volumes
Ch roma te Reduc t ion /P rec ip i t a t i on in 100D Sed imen t
300
0.0-
13 h 17 h
chromate reduction rates (t 1/2, h)
<0.1 h 2.2 h 2.4 h . V13-21
50 100 150 po re v o l u m e s
200 250
acceptors present in Puchack groundwater impact natural chromate reduction.
Figure 4.3-4. Long term chromate reduction by a reduced sediment column in which 2 mg/L chromate, 8.4 mg/L 02, and 60 mg/L nittate was injected. Influent and effluent concentration of dissolved oxygen (a, b), and chromate (c).
303007

51
4.3.3 Influence of Natural Organic Matter on the Natural Chromate Reduction Rate As discussed in the previous section, 2.25% organic carbon and hence natural
organic matter (NOM) was found in one of the natural reducing sediments used in this study, NRS-1 (Dl, 273'). Experiments were conducted to determine if the NOM or abiotic mineral phases were reducing chromate. These experiments were conducted by comparison of the chromate reduction rate with the NOM removed (base/heat tteatment) to untteated sediment under anoxic conditions. The FTIR spectrum of the organic matter present in the filtrate resulting from the base/heat tteatment of the sediment (Figure 4.3-5) was used to identify the organic phases removed. Though it is difficult to identify discrete compounds from a complex mix such as NOM, it is possible to identify the chemical nature of some of the components present in the NOM. The spectrum obtained is consistent with organic compounds such as humic 1.4-: substances (Nardi et al., 2005) and lignites (Bums et al. 2005). The characteristic broad bands of the O-H stretching vibrations of carboxylic acid functional groups can be seen around 2810 cm"' and aromatic ring sttetching band (C=C) at 1567 cm"\ The presence of other . oxygen containing functional groups also found in NOM such as alcohols and ethers are indicated with the presence of the sttong C-0 sttetches at 1105 and 1000 cm"' with the O-H sttetch from the alcohols incorporated in the broad peak centered around 2810 cm-1 of the carboxylic acids along with any C-H sttetch bands from alkanes, alkyls and alkenes, all of which are found either to the left or right of 3000 cm"'.
If NOM is responsible for the reduction of chromate, the removal or decrease of the NOM in the sediment should result in a decrease in the rate of chromate reduction. From the results given in Figure 4.3-6 it can bee seen that the rate of chromate reduction did not change due to the removal of the organic matter
4000 3500 3000 2500 2000 1500 1000 Wavenumber (cm')
Figure 4.3-5 FTIR spectrum of the base soluble components of NRS -1.
- 10".
>
o io--'J
10"
NRS-1 first«rder f i t halMlfe = 0.20 h (L=3.4/h)
NRS-1 Base Treated ftrs^order fit halMHe = 0.17 h (L=4.ini)
0.1 100
Figure 4.3-6 Chromate reduction rate a)NRS-l RSW 0.37 witii 4.8388 mg/L chromate (triangles) and b) NRS-1 base/heat tteated. Conditions were soil/water ratio of 0.31 g/mL witia 4.0688 mg/L of chromate (diamonds) both pH 7.5 in 0.01 M PIPES.
This observed slight increase in rate could be due to an increase in surface area of the tteated sediment due to the removal of the organic matter opening up internal pore networks previously unavailable for chromate reduction. From
303008

r\
52
these results we can conclude that chromate is reduced abiotically by mineral phases present in the sediment and not by NOM. The relatively high pH of 11.7 used to exttact the NOM from the sediment would likely have killed most of the microbial population, so direct biotic chromate reduction for this sediment is highly unlikely. However, there is indirect evidence obtained for NRS-1 sediment suggests that this sediment contains bacteria that could aid either indirectly or directiy with chromate reduction. This untreated sediment is able to mineralize N-nittosodimethylamine (NDMA), which requires microbes. Unfortunately this particular sediment was not chosen for our biotic study given in section 4.7. These bacteria could indirectiy contribute to the ability of this particular sediments ability to reduce chromate by reducing iron present in the sediment, which would consequently be available to reduce chromate.
4.3.4 Redox Reactive Phases in Natural Puchack Sediments
Estimation of the total reductive capacity of natural (untteated) and/or chemically reduced sediments is central to the prediction of the longevity of these sediments as barriers capable of reducing chromate to its insoluble form, namely Cr(in) or mixed (Cr, Fe) hydroxides. Two approaches have been taken to estimate the reductive capacity of ;,' ( Puchack sediments. First, by measuring the consumption of dissolved O2 from effluent waters pumped through sediment columns (data sown in Appendix C), mass balance calculations yield O2 consumption as moles of O2 consumed per gram of sediment (Table 4.3-4). This provides a defacto measure of the net reductive capacity due to ferrous iron, organic carbon and other possible sources and is described in more detail in Section 4.5.1. For the untreated sediments (Table 4.3-4) the average reductive capacity from O2 measurements was 2.76 ± 1.02 pixnol of O2 consumed per g of sediment. This average excluded the value for borehole sediment Dl-M, which was a black clay with a reductive 1 capacity over 200 standard deviations greater than the average for the remaining five ' j sediments.
Although this O^ column approach measures the net reductive capacity, it does j not quantify the individual constituents contributing to this capacity, e.g., ferrous iron as structural or surface species, organic matter or sulfides. Thus, our second approach was ^ > to estimate the reactive/accessible Fe(n) in sediments. Ferrous iron is the primary P ] reductant (electron donor) in the majority of naturally or chemically reduced sediments. It is present structurally in primary minerals (magnetite), secondary clay-sized minerals | (smectites and illites) or adsorbed to mineral surfaces and coordinated by soil organic [ matter (Amonette, 2001). The rate of chromate reduction by ferrous iron has been extensively studied in a variety of geochemical conditions (Eary and Rai, 1988; Anderson et al., 1994; Buerge and Hug, 1997, 1999). We have examined the iron phases in ) selected sediments using well established exttaction procedures (Heron et al., 1994). These exttactions operationally estimate the distribution of ferrous and ferric fron in 1 sediments (Table 4.3-4). The most accessible and/or reactive Fe(II) phase acting as a ) reductant for mobile pollutants has typically been estimated using a short (1 to 24 hour) 0.5 M HQ exttaction of sediments (Heron et al., 1994). For selected Puchack sediments ; the quantities of Fe(n) measured in 1 hour 0.5 M HQ extractions are typically less than the operational estimate of total Fe(n) as measured in 21 day 5 M HQ exttactions
303009

53
Table 4.3-4. Natural and dithionite-reduced sediment reductive capacity and iron phases. Selective sediment exttactions were used to determine the distribution'of iron among Fe° and Fe™ phases. The ferrozine method was used to measure Fe° and Fe'"* after sample reduction by hydroxylamine hydrochloride; Fe™ was calculated by difference.
borehole, deptii treatment MW36C, 151' none MW37I. 197.5' none Dl-H, 220.S none Dl-M, 272.5' none D2-E,211 none D2-H.271' none
Oj column reductive capacity (pjnol/g)
4.10 2.56
636 1.63 2.77
Fe^COj-U'eS (imol/g)ai
8.63 2.28 2.81 2.38 3.10 1.75
other Fe°
(|jnK>l/s>Cl
1290 3.64 10.4 237 2.90 6.01
adsorbed Fe°
(HiiMUg)[8]
2.26
total Fe"
(v,moi(8)P]
631 149 16.2 8.37 30.5 9.62
amorphous crystalline Fe"" oxides Fe™ oxides (nmDUg) [4] 1 (pmol/g>[Sl {
528 168 2.17 91.7 611 196 25.0 222 0.87 99.4 3.32 96.5
total Fe"
(nmo«g) [6]
245 41.3 66.7 22.2 22.3 39.6
Fe^-i-Fe" total
(vnnoUg) tn
876 56.3 82.9 30.5 52.8 49.2
averate naniral sediments:
composite, pH 4.5 reduced composite, pH 53 reduced composite, pH 6.2 reduced composite, pH 7.0 reduced MW-36C, 151' reduced MW-36F, 167 J ' reduced MW-361,197 J reduced MW-36M. 221' reduced MW-37C, 154' reduced MW-37F, 171.5' reduced MW-37I, 199' reduced Dl-B, 106' reduced Dl-F, 164' reduced Dl-H, 220.5 reduced D2-C, 151' reduced D2-H, 271' reduced average reduced sediments:
129 ± 283 2.76 ±1.02 (no
545 62.2 106 84.8 390
23.9
80.5
52.4 547 58.5 23.9
90.1 ± 102
3.49 ±2.56 Dl-M)
1210 41.8 63.8 271 52.7
40.20 172.4
71.2
50.2 192 ± 384
3.54 0.20 0.23 0.46 0.40 0.54 2.20 0.34 0.39 1.02 0.54 1.31
0.93 ± 1.0
118±251
704 21.5 353 2.15 2.23 2.39 2.26
2.75
1.16 8.31 ± 12.0
72.8 ±85.9
535 7.47 5.29 26.7 44.3 39.5 375
143
63.2 100 ± 158
210 ±281
542 29.0 40.6 28.9 46.6 41.9 39.7
1454
64.4 109 ±166
60.2 ± 25.6 (no MW36C)
[1] From 1 h, 0.5 M HQ extraction. [2] Amoiphous Fe"" from 24 h, 0.18 M ammonium oxalate extraction at pH 3.4. [3] From 21 day, 5 M HCl extraction [4] From 24 h, 0.18 M ammonium oxalate extraction at pH 3.4. [5] From DCB extraction and subtraction of the amorphous Fe°". [6] From 21 day, 5 M HCl extraction, and hydroxylamine hydrochloride reduction of filtrate. [7]The sum of Fe° and Fe" columns. [8] From 24 h, 1 M Caa2 extraction
(compare coltmin 3 and 5 in Table 4.3-4). This is to be expected because much of the structural Fe(n) is not accessible to the short 0.5 M exttaction. The average 0.5 M HQ measure of Fe(n) was 3.49 ±- 2.56 ;<mol per gram of sediment. This estimate of the reductive capacity was in remarkably close agreement to the average obtained by the O2 column approach (Table 4.3-4), suggesting that for these sediments either estimate of reductive capacity could be used to estimate the longevity of these sediments as a natural barrier for chromate reduction.
In estimating the longevity for chromate reduction of the untteated Puchack sediments we have assumed that; the average of 3.5 umol Fe(II)/g of sediment is representative and Fe(n) is the dominant electton donor present; nittate and other major electton acceptors are absent. The average sediment bulk density (1.92 g/cm ) and porosity (0.286), measured in this study (Table 4.1-5), will be used in this calculation. It is also assume further that a range of chromate (0.005 to 2 mg/L as Cr(VI)) and O2 (0, 2 and 8.4 mg/L) concenttations could be present to derive a range in possible tteatment
303010

54
capacities. These Cr(VI) concentrations represent the range observed in monitoring wells MW36/37 and borehole D-2; concenttations in borehole D-2 were below the detection limit of approximately 5 jdg/L. The moles of Fe(n) electton donors per unit volume of pore space liquid divided by the moles of electton acceptors per unit pore volume represents the longevity in units of pore volumes (for the volume element of sediment being considered). A representative calculation is as follows for the highest Cr(VI) concentration observed in boreholes (2 mg/L) and O2 at 2 mg/L, approximately V4 saturation of 8.4 mg/L at 25''C :
electron donor: moles of electrons per cm^ liquid from the Fe(II):
(3.5 umol Fe'7g)(l e7Fe^^)(1.92 g sed./cm')(cm'/0.29 cm^ liquid) X (mol/10^ !.imol)(10' cm'/L)
= 23.2 mmol e"/L liquid
electron acceptors: moles of elections per cm^ liquid from 2 mg/L dissolved oxygen and CrO/"
(2 mg/L 02)(g/l,000 mg)(mol O2/32 g) (4 mol e7mol O2) = 2.5 X 10" mol e-/L
(2.0 mg/L Cr(VI))(g/l,000 mg)(mol Cr(VI)/52 g) (3 mol e7mol CrO/") = 1.2xl0^mole-/L
total electton acceptors = 2.5 x 10" + 1.2 x 10"* = 3.7 x 10"^mol e""/L
barrier longevity (BL): electron donors/electron acceptors (number of pore volumes barrier will last)
for 2 mg/L O2, 2.0 mg/L Cr(VT) BL = 23.2 X 10"' mol e7L / 3.7 x 10^mol e'/L BL = 63 pore volumes
Thus, 63 pore volumes of ground water containing the highest observed chromate concenttation could pass through the average untreated Puchack sediment before its reductive capacity is exhausted. The aquitard sample NRS-1 from Dl-M at 272.5' (i.e., dark clay) with a reductive capacity of 636 umol/g would last an estimated 11,000 pore volumes, although it should be noted that Uttle groundwater would pass through this clay unit (but would pass next to it, so some dissolved oxygen and chromate would be reduced).
With zero and 8.4 mg/L of O2 present in the average aquifer sediments (3.5 umol/g) longevity would vary between 193 and 20 pore volumes, respectively. If on the
303011

55
Other hand the chromate concentration was near the low end of the observed concentrations, say 0.1 mg/L, the barrier longevity for 0, 2 and 8.4 mg/L 02 would be 3866, 91 and 22 pore volumes, respectively. These calculations suggest that naturally reduced sediments can play a meaningful role in the attenuation of the chromate plume at
.-the Puchack site even at the higher chromate concentrations as long as groundwater velocities and O2 concentrations are not to high. On the other hand, looking back at the iron extraction data (Table 4.3-4) we see that the ferrous phase designated as 'other', namely the Fe(n) which was oxalate extractable from amorphous iron phases, was highly variable (spatially). For sediment Dl-M this variability showed up in the O2 column reductive capacity as an outiier (200 std. dev.), which we disregarded in deriving an average. This variability did not show up in the 0.5 M HQ extraction data. The observed spatial variability indicates that the chromate reduction rate would be expected to vary considerably from zone to zone in the subsurface.
Although these studies confirm the presence of mechanisms contributing to the natural attenuation of chromate in the Puchack subsurface environment, the field scale effect of these mechanisms must be better quantified to determine the suitability of monitored natural attenuation (MNA) (OSWER Directive 9200.4-17P), both bench and field scale data should be used when evaluating the site specific suitability of MNA as a remedy. In addition to chromate ttend monitoring at the site, numerical groundwater flow and reactive transport models could be developed that incorporate the rate and treatment capacity data resulting from these studies. These models could be used to make predictions of long-term field scale attenuation of the chromate plume and expected impact at potential receptor locations.
The Xrray diffraction analysis of selected Puchack sediments identified quartz as the dominant mineral phase in deep composite sediment DC-2 and individual sediments NRS-1,-2 and -3. The x-ray diffraction data is provided in Appendix F. However, identification of redox reactive mineral phases, possibly containing Fe(n) (e.g., magnetite, illite, smectite, hematite) did not yield any useful information because these phases were not present at high enough weight percentages ( 0.5 %) to produce identifiable diffraction patterns.
4.4 Chromate Reactive Transport in Natural Puchack Sediments
Adsorption of chromate by sediments in 1-D columns were evaluated to confirm that parameters determined in batch experiments were in general agreement with adsorption parameters determined for flow conditions approximating those found in the field. Columns were packed with the shallow composite sediment from monitoring well MW36/37 (Table 4.1-6) resulting in a dry bulk density (pb) and porosity (6) of 1.65 g/cm and 0.30, respectively. Two separate flow experiments were conducted under slightiy different conditions. In each, the unbuffered chromate solution was injected during the first portion of the experiment to follow chromate adsorption, then the chromate concentration was reduced to zero to follow the subsequent desorption of chromate. In the first experiment the influent contained 2.7 mg/L of Cr(VI) (as chromate) and had a
3
303012

56
flow velocity through the column of 10 cm/h resulting in a 1 h residence time. The average effluent pH for the adsorption and desorption portion of the experiment was 4.8 and 3.8, respectively (Figure 4.4-1). The retardation factors (Rf) (and K ,) for the adsorption and desorption phases were 37.2 (6.6) and 18.6 (3.2), respectively. The influent solution in the second experiment contained 2 mg/L Cr(Vl), as chromate, with a flow velocity of 5.75 cm/h and a residence time of 8.25 h (Figure 4.4-2). For both the adsorption and desorption portions of this experiment the average effluent pH was 7 with a Rf (Kd) of 16.5 (2.8). The retardation factors in these experiments were derived by converting the vertical axis of Figure 4.4-1 and 4.4-2 to C/C^ integrating the area in front of these breakthrough curves and normalizing the areas with the porosity of each column. The adsorption mass (K^ values) were calculated from the relation Rj = 1 + p/9 K . The flow velocities in these experiments were higher than the upper end of the typical groundwater flows seen in field situations (0.013 to 1.3 cm/h), however they were in the range of velocities typically observed near a pumping well.
In both experiments the attenuation of chromate was mainly due to adsorption with greater lag (retardation due to adsorption) at low pH (pH 4.8, K<j = 6.6 ) and less lag at high pH (pH 7, K = 2.8). This is consistent with batch experiment pH edges for the deep composite sediment DC2 (Figure 4.3-4) where adsorption is greater at low pH. The KjS calculated for pH > 6 from this adsorption edge for 3 and 18 hour batch experiments are shown in Figure 4.4-3. Below pH 6, adsorption was essentially 100% resulting in aqueous concentrations being below detection limits, which precluded the calculation of accurate K values. With adsorption equilibrium requiring between 10 to 15 hours (Section 4.2-1) the increase in K , between 3 and 18 hours represent the approach to equilibrium. The equilibrium K from the 8.25 hr resident time column experiments is shown in Figure 4.4-3 for comparison. The agreement between this batch and column Kd is remarkably, with the column K being lower. The fact that different sediment composites were used certainly contributed to this difference. A comparison between batch and the column K s at pH 4.8 is not possible because batch K s at this pH could not be calculated, as noted above. Although only a single point comparison, this would suggests that adsorption parameters (e.g., K , as a function of pH and/or sulfate concentration (Figure 4.2-8)), measured in batch experiments, which are easier to perform than column experiments, are perfectiy suitable for use in Cr(VI) reactive transport modeling.
303013

57
3.0-Chromate Transport in Puchack Sediment?, pH 4.8, 3.85
2.5^
^ 2.0 i o J 1.5 i O)
E 1.0 i
0.5-
, • - - • • - • ' - • " ^
pH 4.83 ± 0.70 Rf=37.2 Kd = 6.58
S. v = 10.0 cm/h res. time = 1 h
pH 3.85 ±0.24 ra = 18.75 Kd = 3.22
• • • • • • - • > . 0.0 ~7~i—I—I—I—I—I—r—I—I—I—I—I—I—I—I I I 1 1 1 I—r—1—1—1—I—I—I—1—!-^—r-
0 50 100 150 200 250 300 pore volumes
• t - i - » | - »
350 400
Figure 4.4-1. Evaluation of chromate adsorption at pH 4.8 and 3.85 during reactive transport in a 1-D column packed with a shallow sediment composite.
2.5 .
—« 2.0 .
- }
1* LOT
0.5-:
0.0^
Chromate Transport
Rf=16.5 Kd = 2.82
pH 6.97 ±0.39 «
' • • • • ' ' 1
in Puchack Sediments, pH 7.0
V = 5.75 cm/h res. time = 8.25 h
. •
— 1 — 1 — 1 — 1 — 1 — 1 — 1 — 1 — 1 ^ i " — 1 — 1 — 1 — 1 —
10 20 30
pore volumes 40 50
Figure 4.4-2. Evaluation of chromate adsorption at pH 7 during reactive transport in a 1-D column packed with a shallow sediment composite.
303014

58
Kd versus pH for Deep Composite 2 From Adsorption Edge Figure 4.3-4
18 h batch 3 h batch 8.2 h column Power (18 h batch) Power (3 h batch)
Kd(18h) = 6E+13x"'"'='
R' = 0.9301
Kj(3h) = 1E+07x-'''*''
R = 0.9301
Figure 4.4-3. Comparison of K , vs. pH for deep composite 2 sediment from batch experiments to the K derived from 1-D column experiments with the shallow composite sediment.
3 0 3 0 1 5

59
4.5 Chemical Reduction of Puchack Sediments
4.5.1 Barrier Capacity and Longevity
Column experiments were conducted to determine the amount of reducible iron and the oxidation rate of Puchack sediments using a dithionite/pH buffer solution (reduction) and oxygen-saturated water (oxidation). The natural reductive capacity of Puchack sediments was discussed in Section 4.2 while this section will focus on the reductive capacity of dithionite-reduced sediments. The mechanism for sediment reduction using dithionite was discussed previously in Section 2.2.1. Dithionite reduction dissolves and reduces amorphous and some of the crystalline Fe(in) oxides present in sediments. This method produces many different Fe(n) phases some of which have been identified and quantified in Table 4.5.1, for comparative purposes the natural sediment data has also been included. Reduction/oxidation experiments (11) were carried out on both the shallow composite MW36/37 sediment and sediment samples from all four wells used in this study. The reduced sediment columns were then oxidized with oxygen-saturated water to simulate what would occur naturally in the field. Oxidizing species in groundwater i.e. dissolved oxygen, contaminants like chromate, nitrate or other electron acceptors flow through sediment under natural gradient conditions which are best simulated using columns in the laboratory.
The most accurate method for determining the mass of reduced iron in sediments is considered to be the column Oj oxidation method. This is because actual electron transfer from iron oxidation reactions (Equs. 7 and 8, Section 2.2.2) are measured by the Oj consumption from the Oj saturated influent solution. This is in contrast to the 0.5 M HQ extraction method of measuring Fe(II), where all acid soluble Fe(II) phases are measured regardless of the electron transfer efficiency of the dissolved phase. During the O2 column oxidation experiments two oxygen probes continuously monitor the oxygen concentration of the effluent. The oxidation experiments were continued until most of the reduced iron was oxidized and the end point was determined by the amount of oxygen in the effluent. An ideal oxidation end point would be achieved when the measured effluent Oj approaches 95 - 100% of the influent value. Because this condition is difficult to achieve experimentally, the end point was typically when the measured effluent Oj was found to be > 80% of the influent value. This calibration data was used to calculate the oxygen-free (0) and oxygen-saturated (1) lines shown on Figure 4.5.1 (results from all experiments are provided in Appendix C). The reductive capacity in [imdl pf Fe(n)/g of sediment reported in Table 4.5.1 are average values of the two probes. The size and shape of oxygen breakthrough curves are used to calculate the mass of reduced iron and provide oxidation rate information.
303016

60
20-
•§.icH
Dissolved 0 column, Probe 1 50 100 PV 150 200 250
I
Z " ^ . ^i i ,^&(?«»BeiSs^oi^^
c o
2 1-0.53 w n
111.67PVx1.548cm''/P\/
Results from one oxidation experiment using Puchack sediment are shown in Figure 4.5.1. Although oxygen saturated water is injected into the column, the effluent is oxygen free for approximately the first 18 pore volumes due to oxygen consumption by ferrous iron. At this point in the experiment, rapid oxygen breakthrough is observed (not all O2 added is consumed) and a change in slope results from partial consumption of the added Oj. After an initial steep increase in O^ ^ ' ' ' ' S **"' ^^^ ' '^' '""' ' ' ^ ' ^ ^^ ' ^^^ concentration, the slope gentiy tails off to a saturation of approximately 0.90. These slope changes are indicative of Fe(n) phases being oxidized at different rates, hence for the oxidation reaction of the sediment shown in Figure 4.5.1, there are at least two different Fe(II) phases present. Other studies have shown that adsorbed ferrous iron (Table 4.5.1) is quickly oxidized and may represent the majority of the reduced iron in sediments, while the slowly oxidizing Fe(II) phases are thought to represent siderite (FeCOj).
f^f6t0(t^
20
x1.05umol/cnn x1/7.419g=24.47umol Fe/g
40 60 time(h) 100 120 140
20-
iicH
Dissolved 0 Column, Probe 2
50 100 PV 150 200 _ J I I l l I I \
250 I
*/y%i^vvW'^^''"^' r ^*-1 I
• 106.94PVx1.548cmVv
x1.05umol/cm x1/7.4199=23.43umol Fe/g
2
0)
0 20 40 60 time(h) 100 120 140
Figure 4.5-1 Oxidation of a reduced sediment column with dissolved oxveen in water.
The average reductive capacity of the untreated sediments in Table 4.5.1 is greater than that of the reductive capacity of the dithionite reduced sediments. Upon closer inspection of the data it is apparent that this value is skewed due to the reductive capacity from one untreated sediment (D-1 S-M) having an appreciably greater reductive capacity (two orders of magnitude) than all of the other untreated sediments tested. A similar observation can be made for sample, MW-36S-C, from the reduced sediments. Given the heterogeneous nature of natural samples it is not uncommon to have samples that behave differentiy and are not representative of more typical reductive capacities. In order to minimize the impact of non-representative samples on the overall quality of the data set, greater sample numbers are needed, within practical limitations of laboratory experiments (time constraints, cost etc). Considering the reductive capacity data, excluding the aforementioned samples, there is a decrease in the standard deviation for both the natural and treated sediments and the reduced sediments show a significant increase in reductive capacity. The average reductive capacity of the dithionite reduced sediments increased by an order of magnitude to 60.2 ± 25.6 fxmol/g from a naturally occurring reductive capacity of 2.76 ± 1.02 [imol/g. Similar results were obtained from Fe(II) extraction by 0.5 M HQ, again the higher values have been disregarded, resulting in average reductive
303017

61
capacity values of 64.9 ± 45.6 ^imol/g for the reduced sediment and 3.49 ± 2.56 [xmol/g for the untreated sediment.
In Section 4.2.3, the longevity of the naturally occurring reductive capacity of the sediments was estimated to be 63 pore volumes for 2 mg/L O2 and 2.0 mg/L Cr04'. The barrier longevity of the dithionite reduced sediment can be estimated using the same approach. Assuming the same conditions as above (2 mg/L O2, and 2 mg/L CrO/, average dry bulk density of 1.917 g/cm , porosity of 0.286 cm^ liquid/cm^ solid, and an average reductive capacity from the O^ columns and Fe(n) extraction data (60.2 + 64.9)/2 = 62.55 jxmol/g) we obtain:
electron donor: moles of electrons per cm' liquid from the Fe(n):
(62.55 ;/mol Fe^*/g)(l e-/Fe^0(1.92 g sed./cm')(cm^/0.29 cm'liquid)(mol/10* / moDdO' cra'/L) = 414.124 mmol eVL
electron acceptors: moles of electrons per cm' liquid from 2 mg/L dissolved oxygen and CrO/:
Dissolved oxygen Chromate
O2 + 4e + 4H* <- > H2O CrO/ + 3e- + 4H2O <-> Cr(0H)3 -h SOH'
(8.4 mg/L 02)(g/l ,000 mg)(mol O2/32 g)(4 mol e/mol O2) = 1.050 mmol e/L
(2 mg/L CrO/) (g/1,000 mg)(mol Cr04/52 g)(3 mol e/mol) = 0.115 mmol e/L
Total electron acceptors = 1.050 + 0.115 = 1.165 mmol e'/L
barrier longevity: electron donors/electron acceptors (number of pore volumes the acceptor can be passed through the donor region to oxidize it):
for 8.4 mg/1 O2,2.0 mg/L CrO/ 414.124/1.165 Barrier Longevity = 355.4 pore volumes
Thus, 355 pore volumes of ground water containing the highest observed chromate concentration could pass through the average fully reduced Puchack sediment at the upper O2 limit i.e., the saturation point of the natural dissolved O2 concentration (8.4 mg/L at 25 °C) before the reductive capacity of the barrier would be depleted. For a 40 ft wide barrier and an average groundwater velocity of 1 ft/d, 355 pore volumes of treatment would result in a barrier longevity of 39 years. Comparing this value to the natural reducing sediments under the same conditions we observe a significant increase in barrier longevity, 355 pv as opposed lo 20 pv. Assuming an O2 concentration on the low end of the observed range (3 mg/L), the barrier longevity would increase to 845 pore
303018

62
volumes (or a longevity of 92 years), in comparison to 193 pore volumes for the natural sediment. This suggest that the reduced sediments would be considerable more effective in the attenuation of chromate at the Puchack site for at high chromate and oxygen concentrations than the naturally reduced sediments. Reconsidering the iron exttaction data provided in Table 4.5-1, the outiier MW-36C, which was disregarded wheii deriving the average reduction capacity for both the O2 column and ferrous iron extraction data, gives an indication of the. spatial variability of iron present at the Puchack site. If this sediment were to be included in the average rediictive capacity the value increases from 68.5 to 141.1 /imol/g of sediinent and our barrier longevity range increases accordingly. Therefore, due to the spatial variability of iron present at the Puchack site, some degree of variability in the chromate reduction capacity will occur from zone to zone in the subsurface.
11
n
Table 4.5-1. Natural and Dithionite-Reduced Sediment Reductive Capacity and Iron Speciation
borehole, depth treatment MW36C, 151' none MW371,197.5 none Dl-H, 220.5' none Dl-M, 272.5' none D2-E,211 none D2-H,271' none
Oicolimm . reductive
capacity • (iimoiyg)
4.10 2.56
636 1.63 2.77
Fe°C03+FeS (imiol/g) [1]
8.63 2.28 2.81 2.38 3.10
, 1.75
Vo^ n1iaeo«
Other Fe° •
-(Mmol/g)[2] 1 1290 3.64 10.4 237 2.90 6.01
adsorbed Fe"^
Cumol/g) [8]
2.26
total
Fe° (Mniol/8)P]
631 14.9 16.2 8.37 30.5 9.62
• » - " " - . 1 . 1 1 . ^ .
amorphoos crystalline F e " oxides F e " oxides C|imol/e)[4] 1 (lauol/s) [5]
528 168 2.17 91.7 6.11 196 25.0 222 0 .87 ' 99.4 3.32 96.5
total F e "
Cmnol/S) [6]
245 41.3 66.7 22.2 22.3 39.6
Fe^+Fe"" total
^^andug) m 876 56.3 82.9 30.5 52.8 49.2
averate natural sediments: 129 ±283 3.49 ±2.56 2.76 ±1.02 (no Dl-M)
118±251
60.2 ± 25.6 (no MW36C)
72.8 ±85.9 210 ±281
composite, pH 4.5 reduced composite, pH 5.3 reduced composite, pH 6.2 reduced composite, pH 7.0 reduced MW-36C, 15i' reduced MW-36F, 167.5'. reduced MW-361,197.5' reduced MW-36M, 221' reduced MW-37C,154' reduced MW-37F, 171.5' reduced MW-371,199' reduced Dl-B, 106' reduced Dl-F, 164' reduced Dl-H, 220.5' reduced D2-C, 151' reduced D2-H, 271' reduced average reduced sediments:
54.5 62.2 106 84.8 390
, 23.9
80.5
52.4 54.7 58.5 23.9
90.1 ± 102
1210 41.8 63.8 27.1 52.7
40.20 172.4
71.2
50.2 192 ± 3 8 4
3.54 0.20 0.23 0.46 0.40 0.54 2.20 0.34 0.39 1.02 0.54 1.31
0.93 ± 1.0
7.04 21.5 35.3 2.15 2.23 2.39 2.26
2.75
1.16 8.31 ± 12.0
535 7.47 5.29 26.7 44.3 39.5 37;5
143
63.2 100 ± 168
542 29.0 40.6 28.9 46.6 41.9 39.7
145.4
64.4 109 ±166
iJ
n i...)
I" L
I]
[1] From 1 h, 0.5 M HCl extraction. [2] Amorphous Fe° from 24 h, 0.18 M ammonium oxalate extraction at pH 3.4. [3] From 21 day, 5 M HCl extraction [4] From 24 h, 0.18 M ammonium oxalate extraction at pH 3.4. [5] From DCB extraction and subtraction of the amorphous Fe™. [6] From 21 day, 5 M HCl extraction, and hydroxylamine hydrochloride reduction of filtrate. [7]The sum of Fe" and Fe"" colunms. [8] From 24 h, 1 M CaC12 extraction
3 0 3 0 1 9

63
4.5.2 Redox Reactive Phases Produced with Dithionite Reduction As discussed previously, sediment reduction with dithionite solution (dithionite
and potassium carbonate) dissolves and reduces amorphous and some crystalline Fe" oxide phases producing several different Fe° phases. From Table 4.5-1 we can see that reducing the Puchack sediments has resulted in an increase in the amount of ferrous iron phases present. The reductive capacity obtained (64.9 ± 45.6 fxmol/g) from the ferrous iron phases (Fe°(ad3,, Fe^COj, FeS) exttacted from the reduced sediments are comparable to the average reductive capacity obtained from O2 column oxidation. The iron extiaction data obtained in this study does not permit designation of particular ferrous iron phases responsible for the reduction capacity observed. Possible phases produced during reduction include; adsorbed Fe(II), siderite, FeS, and reduced structural iron in clay present within the sediments. If the predominate phase produced from the reduction of Puchack sediment was adsorbed Fe(n) chromate reduction at low pH (pH<5) would not be possible using the reduced sediments. The adsorption edge for ferrous iron typically occurs between pH 4 and 5 and is not adsorbed at low pH. Thus adsorbed Fe(n) resulting from sediment reduction would be mobiles and easily washed out of the system at low pH and unavailable as an electron donor for chromate reduction. It has been demonstrated (Section 4.6.1) that even at pH values from 4.5 to 7, appreciable amounts of chromate can be treated with reduced Puchack sediment, indirectly implying that not all the ferrous iron present is adsorbed and thus, is present as other ferrous iron phases. This is consistent with the low adsorbed Fe(II) data given on Table 4.5-1 from the 1 M CaQj extraction.
4.5.3 Trace Metal Mobilization with Dithionite Reduction The mobility of major and tiace metals during sediment reduction was measured
in effluent samples by ICP-MS during reduction for 24.7 pore volumes (Table 4.5-2) to assess the potential migration of heavy metals that could occur as the natural (oxic) sediment is reduced. Total metal concentiations were measured by ICP-MS. The data shown in Table 4.5-2 is the product of two column reduction experiments, the pore volumes associated with the first colunm experiment have been made bold for identification purposes. Slight variations in the data can be seen between the two different experiments characteristic of heterogeneous samples.
The dithionate solution injected into the sediments during reduction is comprised of Na2S204 (0.09 mol/L) and K2CO3 (0.36 mol/L) at pH 10.5 and Eh 560 mV. It only takes a few pore volumes for the effluent concentrations to reach the concentiations of the injection solution. Major and trace metals found in the chemical compounds used to make the dithionite solution and other tiace elements present (due to manufacturing processes) in the unreacted dithionite solution (Table 4.5-2) have been marked with an asterisk. The dithionite injection solution used in this study contains appreciable amounts
303020

64
of Cr, V, Se, Br, Rb, Zn and Hg (Tables 4.5-2 and 4.5-3). There are two different manufacturing process for dithionite one uses a zinc process and the other a formate process. The zinc process produces higher amounts of trace metals in the final product ; ] than the formate process. The dithionite used in all of the laboratory experiments was ) ) made by the zinc process resulting in the presence of trace amounts of zinc and the other elements mentioned above. Appendix G gives a brief outline on the manufacturing ' | process of dithionite by both processes along with the typical trace metal analysis of the ' ' formate process from the manufacturer.
Metals that were mobilized due to the reducing conditions created include Fe, Mn \ J and As, as the reduced species of these metals are more mobile under low Eh conditions. There is no effect on the concentration of Ti, Se, and Ni, which leach out at a constant ' | rate from the sediment regardless of Eh. The concentration of Pb, Co, Ni, Mo, Sb, Cs, I, - ' Ba and Sr initially increase then decrease most probably due to ion exchange and would have also leached out of the sediment regardless of Eh. Metals that decrease due to the | reducing conditions include Mg and U. All of these changes are not considered -' significant because the highly reducing conditions that mobilize these metals are only produced during the dithionite injection in the treatment zone and only occur over a : | period of 2-3 days of treatment until the dithionite degrades. It has been previously ^ ' demonstrated that the metal mobilization is not widespread and that Fe/Mn/As mobilization does not extend beyond the treatment radius (20-25 ft). j.
r!
303021

65
Table 4.5-2 Metal mobility during sediment reduction in columns. p o r e
v o l u m e s
D i t h i o n i t e
i n j . S o l n .
L i
Mg/1
<1000
Be
re/I
< 1 0 0
g/l
7.10
M g
nig/1
<2
Al
mg/I
<2
Si
nig/l
< 2 0 0
*K
g / l
>20
C a
niR/1
< 7 0 0
Sc
<IOOO
T i
Mg/1
<100
*v Mg/I
262
• C r
Mg/I
967
M n
Mg/I
< 1 0 0
F e
niR/l
<I0
C o
Mg/I
<5
Ni
Mg/I
< 3 0 0
C u
Mg/I
< 2 0 0
0.9 1.9 2.9 3.9 4.9 6.9 9.7 19.7 2 4 . 7
<I00 <I00 <I00 <I00 <100 <100 <100 <100 <I00
<I0 <I0 <I0 <10 <10 <10 <10 <10 <10
2.37 >3.5 >3.6 >3.7 >3.8 >3.5 >3.6 >3.7 >3.8
46.3 2.0 \.S 1.3 I.I 0.5 0.2
<0.2 <n.2
<0 .2 0.2
<0.2 <0.2 <0.2
<0.2 <0.2
0.3 0.3
<20 <20 <20 <20 <20 <20 <20 <20 <20
>2 >2 >2 >2 >2 >2 >2 >2 >2
107 <70 <70 <70 <70 <70 <70 <^70 <70
< 1 0 0 < 1 0 0
<ioo <100 <100 <100 <100 <I00 <I00
30.7 23.0 20.7 27.4 32.9 28.6 25.0 26.3 20.2
48.9 <10 <10 <10 <10 <10 <I0 22.8 24.3
<50 <50 <50 <50 <50 <50 <50 <50 <50
612.2 351.1 444.7 638.6 731.7 248.5 226.5 106.7 108.6
3.5 3.5 <l 4.3 15.1 <1 <1 <1 <1
110.7 18.7 5.7 5.1 3.1 15.5 7.2 4.6 3.5
268.7 326.0 182.5 300.6 277.8 194.6 197.3 204.9 268.2
<20 <20 <20 <20 <20 <20 <20 <20 <20
pore volumes
Dithionite inj. Soln.
0.9
*Zn
Mg/I
898
<S0
G n
Mg/I
<I0
1.1
G e
VS/i
21
<1
A s
Mg/I
59 33.7
*Se
Mg/I
620 38.5
* B r
nlg/l
3.6 0.7
* R b
OIR/I
2.5 0.9
S r
Mg/1
<40
1000.0
Y
Mg/I
<3 57.5
Z r
Mg/1
38
104.4
N b
Mgrt
<5 <0.5
M o
Mg/1
<100
530.4
R u
Mg^
<10
<l
P d
Mg/I
88
<1
A g
Mg/I
<200
<50
C d
Mg/1
<10 1.3
I n
Mg/1
<l <0.l
1.9 2.9 3.9 4.9 6.9 9.7 19.7 24.7
72.2 92.5 79.7 80.5 117.6 65.6 74.5 60.8
2.6 <1 <1 <l <1 <1 4.9 4.6
2.3 1.8 1.1 <l 1.2 <l <l 1.2
163.8 214.5 302.9 512.2 847.5 770.1 217.3 215.6
37.5 36.2 38.7 <20 27.7 24.9 30.6 24.1
1.9 1.9 1.9 1.9 1.8 1.9 1.8 1.8
2.3 2.3 2.3 2.2 2.2 2
185.8 129.8 125.1 119.8 95.8 77.5 45.4 45.6
187.7 3.3 89.8 141.5 1.5 3.5 42.4 38.6
96.2 92.6 26.8 28.0 77.8 53.8 107.9 109.8
<0.5 <0.5 <0.5 <0.5 <0.5 <0.5 <0.5 <0.5
150.0 79.9 63.0 82.8 96.0 67.4 17.4 11.3
<l <1 <l <l <l <l <l <l
67.4 47.6 31.5 <l
488.0 177.2 92.5 68.5
<20 <20 <20 <20 <20 <20 <20 <20
<1 <1 <1 <1 <1 <1 <l <l
<0.1 <0.l <0.l <0.l <0.1 <0.1 <0.1 <0.1
Sn
Mg/I
p o r e v o l u m e s
D i t h i o n i t e i n j . S o l n . < I 0 0
S b
Mg/1
T e
Mg/I Mg/I
Cs
Mg/I
B a
Mg/I
L a
Mg/I
C e
Mg/1
P r
Mg/1
N d
Mg/I
Sm
Mg/I
E u
Mg/I
C d
Mg/I
T b
Mg/l
Dy Mg/1
H o
Mg/1
E r
Mg/1
1.9
2.9
3.9
4 .9
6.9 9.7 19.7 24.7
<10 <10 <10 <10 <I0 <I0 <I0 <10 <10
<I0
11.1 4 5 7.8 12.6 12.4 11.9 1.7 2.1
<IOO <1000
i4i.8 198.7 138.9 109.2 <100 738.1 285.4 191.3 157.2
<1 <100
137.6 47.1 125.7 128.3 28.6 49.0 44.7 44.1
2
15.3 <0.l 9.5 13.1 <0.1 <0.1 4.2 3.4
3
ITT 57.6 0.4
36.4 53.2 0.3 0.5 16.8 13.6
1
12.4 <0.1 7.4 10.3 <0.l <0.l 3.1 2.5
3
I W 78.5 0.4 43.4 65.2 0.1 0.2 19.8 167
3
26.4 <0.l 16.3 20.7 0.1 0.3 5.9 5.2
1 T T
6.4 <0.l 3.4 5.3
<0.1 <0.1 1.5 1.2
<l <1
4.9 <0.1 2.6 3.8
<0.l <0.l 1.0 1.0
<1 <1
5.9 0.1 2.7 4 3
<0 . l <0.1 1.3 1.2
<l
"nrr 17.2 0.3 7.6 12.1 0.1 0.3 3.8 3.9
<i(r <10 <10 <I0 <I0 <I0 <I0 <I0 <10
T 3 l ^ 13.0 2.5 I.I 0.8 0.7 0.4 0.2 0.3
7:8 28.5 0.2 15.7 23.0 <0.1 0.1 6.5 5.5
25.6 0.3 13.2 21.7 0.1 0.2 65 5.6
pore volumes
Dithionite Inj. Soln.
0.5
Tm Mg/1
<1 17
Y b
Mg/I
<l 13.5
L u
Mg/1
<1
5.5
Hf
<i
5.5
T a
Mg/I
<| <0.1
w Mg/1
<20 7.8
R e
Mg/1
<l
<0.1
Os Mg/1
<2
<0.5
P t
Mg/I
< 3 0 0
<30
A n
Mg/I
65 <fl.5
H g
Mg/1
< 2 0 0
<50
T l
Mg/I
<1 <0.1
P b
Mg/I
<I0
5.4
BI
Mg/I
< 3 0 0
<30
T h
Mg/1
15 54.5
U
Mgrt
<1 157.8
1.9 2.9 3.9 4.9 6.9 9.7 19.7 24.7
2.4 <0.l 1.0 1.8
<0.1 <0.1 0.5 0.6
19.4 0.4 6.8 11.9 <0.l 0.5 4.3 4.3
3.3 <0.1 I.I 1.9
<0.l <0.l 0.6 0.7
1.6 0.8 0.3 0.5 1.2 0.6 17
<0.1 <0.1 <0.l <0.l <0.l <0.1 <0.1 <0.l
17.0 10.4 2.9 2.4 2.9 <2 2.2 <2
<0.l <0.l <0.l <0.l <0.l <0.1 <0.1 <0.1
<0.2 <0.2 <0.2 <0.2 <0.2 <0.2 <0.2 <0.2
<30 <30 <30 <30 <30 <30 <30 <30
24.1 18.2 12.3 0.3
116.0 50.0 30.0 24.4
<20 <20 <20 <20 91.4 36.8 24.9 25.1
<0.1 <0.1 <0.1 <0.l <0.l <0.l <0.l <0.l
1.1 <l <1 <1
<1 <1 <1 <1
<30 <30 <30 <30 <30 <30 <30 <30
35.1 0.2 7.6
41.0 <0.l <0.1 57.4 48.7
47.6 142 24.6 38.5 17.5 20.1 34.2 35.4
303022

66
Table 4.5-3 Dithionite Reduction
Pore Volumes
0.38 1.38 2.38 3.38 4.38
matrix Dble DI H20
Hg Mobility during
Hg ng/L
35 4235 4877
58 4129
-
19970 <12
Oxidation pH=4.5
Pore Volumes
1 3 5 7 9 18 26 44 52 150 265 415 565
matrix Dble DI H20
reduction and oxidation.
Hg ng/L
<12 18 18 48
<12 16 12 28 13
<12 <12 <12 <12
<12 <12
Oxidation pH=S.3
Pore Volumes
1 3 5 7 9 18 26 44 52 150 265 415
matrix Dble DI H20
Hg ng/L
10635 40 57
<12 17 12
<12 <12 <12 15
<12 <12
<12 <12
Oxidation pH=6.2
Pore Volumes
1 3 5 7 9 18 26 44 52 150
263.6 413 563
matrix Dble DI H20
Hg ng/L
743 <12 <12 <12 <12 <12 <12 <12 <12 <12 <12 <12 <12
<12 <12
Oxidation pH=7
Pore Volumes
2 3 5 7 9 18 26 44 52 150 265 415 565
matrix Dble DI H20
Hg ng/L
22865 154 18
<12 16
<12 <12 <12 <12 <12 <12 <12
<n
<12 <12
r-\
y
4,..J
u
J
303023

67
4.6 Chromate Immobilization and Changes in Other Metals/Solutes in Dithionite-Reduced Sediments
4.6.1 Chromate Transport and Reduction
Column experiments investigating the transport of chromate (Cr04') as a function of the pH range found in I*uchack groundwater (4.5 to 7.0) were conducted on dithionite-reduced sediments (Figures 4.6-1 through 4.6-4). As previously discussed, dithionite reduction creates a range of different ferrous iron surface phases and sufficient amounts of immobile ferrous iron are produced to immobilize chromate for a considerable length of time i.e., 100s of pore volumes or 10s of years. The significance of these experimeiits is that dithionite treatment of Puchack sediments can produce an effective barrier to immobilize chromate, even under acidic conditions. It was hypothesized that under acidic conditions: a) ferrous iron phases produced could be mobile (aqueous), and b) Cr(III) species produced could be mobile. Ferrous iron mobility is described in this section and total Cr (IE + VI) is described in the foUowing section.
Under acidic conditions adsorbed ferrous iron is mobile so the capacity of reduced sediments to inmiobilize chromate may be less at low pH than at neutial pH. Reduced structural iron in clay on the other hand is not mobilized at low pH and could be a source of immobile ferrous iron. If the only ferrous phase produced during sediment reduction was adsorbed
i.oo
0.75-1
y 0.50-
0.25-
O.OO
reductive capacity = 300 pv 170 pv, no chromate brealctiirough porosity = 0.390, pv = 4.6 mL buli( density 1.616 8.52 pv/li half life
3.9 h
half life 8.32 h
| l l l | > V I | l l l | l ' V | l l l | l l > l | l l l | I U | I M | J I I | J I I | l l l | I N | n . , , , , , , , , , .
0 50 100 150 200 250 300 350 400 450 pore volumes
Figure 4.6-1 Chromate transport in reduced sediment witii 8.4 mg/L O2 and 2 mg/L CrO^ at pH 4.5.
1.00-
0.75-
r^ 0.50-
0.25-
0.00-
reductiye capacity = ** pv ** pv, no chromate breakthrough porosity = 0.405, pv = 4.77 mL bulk density 1.735 half life 8.74 h/pv 5 5 h
l " ' l ™ | i " l " ' l " ' | i " l " ' l " ' l " ' l ' " l " ' l " ' l ' " l " ' l " ' l ' 0 50 100 150 200 250 300 350 400 450
pore vo lumes
Figure 4.6-2 Chromate transport in reduced sediment with 8.4 mg/L Oj and 2 mg/L Cr04at pH 5.3.
1.00-
0.75-o o o y 0.50^
0.25-
0.00-
reductive capacity = ** pv ** pv, no chromate breakthrough porosity = 0.34, pv = 4.06 mL bulk density 1.683 8.74 h/pv half life
3.8 h
l | I M | M I | M « | l l l | * M | I M f l l l | M < f » l | n i | O T | I M | I M | M I | I M | l l l | l
0 50 100 150 200 250 300 350 400 450 pore volumes
Figure 4.6-3 Chromate transport in reduced sediment witii 8.4 mg/L O2 and 2 mg/L Cr04" at pH 6.2.
1.00-
0.75-
y 0.50-
0.25-
0.00-
reductive capacity = ** pv ** pv, no chromate breakthrough porosity = 0.33, pv = 2.30 mL bulk density = 1.761 8.33 h/pv
half life 2.7 h
l i | i i i | « i { i i i { V > | i i i | « | M i | i « | i i i | O T | n i | « i | T T i | m | i M | i
0 50 100 150 200 250 300 350 400 450 pore volumes
Figure 4.6-4 Chromate tiansport in reduced sediment witii 8.4 mg/L O2 and 2 mg/L Cr04' at pH 7.0.
303024

68
Fe(n) rapid chromate breakthrough would occur during tiansport experiments due to the washing out of the adsorbed Fe(n). Complete removal of chromate is observed in Figures 4.6-1 through 4.6-4 for the first 160 pore volumes over the pH range 4.5-7.0. After this time, the partial chromate breakthrough is observed in the lower pH columns (Figure 4.6-1 and 4.6-2). This would suggest that there is less reductive capacity at lower pH either due to less initial reduction or some of the Fe(n) has washed out at low pH. All sediment columns were reduced with potassium carbonate under similar alkaline conditions (pH 10),
The reductive capacity of these four sediment columns was calculated from the chromate consumption in these experiments and dissolved oxygen breakthrough for an additional 200 pore volumes after the end of these chromate experiments. Results (Table 4.5-1) indicate a reductive capacity of 54.5 umol/g (pH 4.5), 62.2 umol/g (pH 5.5), 106 umol/g (pH 6.2), and 84.8 umo^g (pH 7.0). For all four columns, most of the reductive capacity (> 90%) was due to oxygen consumption. The reductive capacity (i.e., presumed to be ferrous iron in one or more surface phases) was compared with the amount of ferrous iron eluded from the columns.
25(W-
g"20(K O)
0)
Ferrous Iron Elution during Chromate Transport in Reduced Sediment, pH 4.5
total Fe(ll) in column: 54.5 umol/g x 19.0 g = 1.04 mmol Fe(ll)
Fe(ll) eluded: 0.0374 mmol Fe(ll) or3.6%oftotalFe(l l)
—1 1 r***—' 50
1 — I — [ — ^ —
100 pore volumes
r\ 150 200
80-
The column effiuent was analyzed for ferrous iron (Figure 4.6-5). The lower pH columns had a much higher initial release of Fe(n) with initial concenttations of 240 and 78 mg/L for the 4.5 and 5.3 pH columns respectively, whereas < 5 mg/L Fe(n) was eluded in the first sample at pH 6.2 or 7.0. In all cases, the ferrous iron elution was brief (typically only the first sample), so the total mass of ferrous iron removed from the column was small. The amount of ferrous iron eluded from each column was determined from integrating the area under the Fe(n) data (Figure 4.6-5), which was 0.037 mmol Fe(n) at pH 4.5, 0.016 umol Fe(n) at pH 5.3, 0.0034 namol Fe(n) at pH 6.2, and 0.0035 mmol Fe(n) at pH 7.0, or lOx more at pH 4.5 compared with pH 7.0. The total ferrous iron in each column was calculated from the reductive capacity and weight of sediment in the column
— 60^
•=•40-
.? 20-
Ferrous Iron Elution during Chromate Transport in Reduced Sediment, pH 5.3
total Fe(ll) in column: 62.2 umol/g x 20.4 g = 1.27 mmol Fe(ii)
Fe(ll) eluded: 0.0162 mmol Fe(ll) or1.3%oftotalFe(l l)
I I I I « # * I I
50 = f = l 1 W H i r -
100 pore volumes
150 200
5.0-Ferrous Iron Elution during Chromate Transport in Reduced Sediment, pH 6.2
total Fe(li) in column: 106 umol/g x 19.8 g = 2.10 mmol Fe(ll)
Fe(ll) eluded: 0.0034 mmol Fe(ll) or 0.16% of total Fe{l I)
100 pore volumes
150 200 y
5.0-
4.0^
3.0
2.0-
Ferrous Iron Elution during Chromate Transport in Reduced Sediment, pH 7.0
total Fe(ll) in column: 84.8 umol/g x11.7 g = 0.992 mmd Fe(ll)
Fe(ll) eluded: 0.0035 mmol Fe(ll) ^or 0.35% of total
100 pore volumes
200
Figure 4.6-5 Amount of ferrous iron in the effluent of the chromate ttansport experiments (8.14 mg/L O2 and 2 mg/L Cr04") using reduced sediments at pH a) 4.5, b) 5.3, c) 6.2 and d) 7.0.
303025

69
(12 to 20 g), which was 1.0 to 2.1 mmol Fe(n). Therefore, the ferrous iron eluded from the pH 4.5 column was 3.6% of the total reductive capacity, 1.3% (pH 5.3), 0.16% (pH 6.2), and 0.35% (pH 7.0). The significance of these findings is that dithionite reduction of Puchack sediments results in mainly immobile ferrous iron phases, and not significant amounts of adsorbed Fe(n), which would wash down gradient during flow in column (and field) experiments. Based on these findings, only a small percentage (< 4%) of the ferrous iron phases produced could be adsorbed Fe(n).
Experiments were carried out in an attempt to measure the surface phases of chromium present on the sediment surface. It was found that small amounts of Cr(VI) could be exttacted from the surface of the naturally reduced sediments by increasing the pH of the sediment to pH 12 for 24 hours. Permanganate exttaction and oxidation of surface Cr(in) was also carried out on the sediments with some success. The result for this investigation will be reported in the final report.
Previous studies have shown that for dithionite reduction there is a slower ferric iron reduction rate under neutial or acidic pH for. At a field injection site the sediment buffering capacity at the edges of the dithionite injection plume will lower the pH relative to that in the center of the plume (ph 10). For field scale conditions the pH will decrease radially resulting in less reduction over the cross section of the dithionite plume.
4.6.2 Trace Metal Mobility Changes During Reduced Sediment Oxidation The mobility of major and ttace metals were measured in effluent samples by
ICP-MS (total concentration) during sediment oxidation at the four different pH values (pH 4.5, 5.3, 6.2, and 7.0) in parallel experiments to those described in the previous section. In these experiments, four sediment columns were reduced with sodium dithionite/potassium carbonate for 120 h, and the metals mobility leaching during reduction was previously reported (Section 4.5.3). Oxic Puchack groundwater was then pH equilibrated to different values (pH 4.5, 5.3, 6.2, and 7.0) and used as the injection solution. This groundwater contained 11.7 ppb total Cr (as chromate, described later), along with a variety of other ttace metals. As described in the previous section, chromate injection into dithionite-reduced sediments at pH 4.5, 5.3, 6.2, and 7.0 is reduced and apparentiy immobilized (chromate analysis shown in Figure 4.6-1 to 4.6-4) and only a small fraction of ferrous iron was washed out of the sediment columns at low pH (i.e., 3.6% at pH 4.5 versus 0.35% at pH 7.0). Because only chromate (and ferrous iron) analysis was conducted in those experiments, the question remains as to whether chromate was reduced to immobile or mobile Cr(III) species. Under acidic conditions at equilibrium, there are aqueous Cr(in) species (Figure 1.2), but it should also be noted that there are significant kinetic issues associated with Cr(in) species, so nonequilibrium phases may exist (i.e., departure from equilibrimn phase diagrams).
Injection of Puchack groundwater with 11.7 ppb chromate at pH 4.5, 5.3, 6.2, and 7.0 for 580 pore volumes apparently does not result in the formation of aqueous Cr(in) species (Tables 4.6-2 through 4.6-5). Because the dithionite solution contains significant
303026

70
i ron (IKIII) Mobil ization During Oxidation, pH 4.5
Fe(ll) eluded: 0.152 mmol Fe(ll) or 9.0% of total Fe(l I)
100 200 300 400 pore volumes
500 600
Cr (967 ppb), within the first pore volume of oxidation, there is some elution of Cr. At pH 4.5 and 5.3, there were total Cr values of 0.5 to 4.1 ppb from 2 through 14 pore volumes. All other samples from 14 through 580 pore volumes at all pH values showed < 0.5 ppb total Cr. Because the injection solutions were oxic and dissolved oxygen is the main oxidant, as the reductive capacity of the sediment is consumed, the injected chromate should be eluded from the column. Based on the reductive capacities (54.5 umol/g; pH 4.5, 62.2 umol/g; pH 5.5, 106 umol/g; pH 6.2, and 84.8 umol/g; pH 7.0), the capacity to remove chromate is expected to last 310 pore volumes (pH 4.5) to 600 pore volumes (pH 7.0). The tiace metals analysis shows no total Cr breakthrough at later times (> 50 pore volumes), so at a minimum several 100 pore volumes of capacity was achieved for chromate reduction/immobilization, and it appears that the reduced Cr(ni) species produced are immobile.
Iron {]\+n\) Mobil ization During Oxidation, pH 5.3
iol/gx27.9g IFe(ll)incolumn: 62.2 = 1.73 mmol Fe(ll)
Fe(ll) eluded: 0.181 mmol Fe(ll) or 10.5% of total Fe(ll)
200 300 400 pore volumes
500 600
3-
2-
1-
0-
Iron (ll+lll) Mobil ization During Oxidation, pH 6.2 total Fe(ll) in column: 106 umol/g x30.3 c
= 3.21 mmol Fe(ll) Fe(ll) eluded: 0.0475 mmol Fe(ll)
or1.5%oftotalFe(ll)
• • >
200 300 400 pore volumes
600
Iron (ll+lll) Mobilization During Oxidation, pH 7.0 total Fe(ll) in column: 106 umol/g x 30.3 g
= 3.21 mmol Fe(ll) Fe(ll) eluded: 0.0475 mmol Fe(ll)
or 1.5% of total Fe(ll)
100 200 300 400 pore volumes
500 600
The column effluent was also analyzed for total iron (Figure 4.6-6). Both pH 4.5 and 5.3 showed increasing total iron after 100 pore volumes, and pH 6.5 data showed total iron increasing after 200-300 pore volumes (none at pH 7.0). The amount of iron eluded from each column was determined from integrating the area under the iron data and compared with the previous iron mobility versus pH data (Table 4.6-5). These results differ from the previous set (Figure 4.6-5), which showed only very large initial ferrous iron mobility. If the high values of total iron observed (4mg/L or 71 \xxaolfL) were Fe(in) these solution would be highly over saturated even at pH 4.5. Thus, it is reasonable to assume that this total iron is Fe(n). The difference may be due to particulate Fe measured by ICP-MS in Figure 4.6-6. Clearly, there is greater iron mobility at lower pH, and the amoimt may be 3.6% to 10.5% at pH 4.5, and 0.1 to 0.35% at pH 7.0. Based on these findings, only a small percentage of the ferrous iron phases produced could be adsorbed Fe(n).
• : t
Figure 4.6-6 Amount of total iron in column effluent during injection of Puchack oxic groundwater (with 11.7 ppb Cr04") into reduced sediments.
303027

Table 4.6-1. Iron mobihty during reduced sediment oxidation.
71
pH 4.5 5.3 6.2 7
reductive capacity (umol//g)
54.5 62.2 106 84.8
2i Fe(n) elnted
(mg) 0.037 0.016 0.0034 0.0035
mg/L Cr Injectio Fe(n)in
sediinent (mg) 1.04 1.27 2.10 0.994
Q *
Fe(n) elnted (%) 3.6 1.3
0.16 0.35
0.012 mg/L Cr Injection** Fe(n) elnted
(mg) 0.152 0.181
0.0475 0.0033
Fe(n)in sediment (mg)
1.69 1.73 3.21 3.26
Fe(n) elnted (%) 9.0 10.5 1.5
0.10 • experiments U120-123 **experiments U112-115
The mobility of major and ttace metals was also measured in the effluent samples during sediment oxidation. For this study the effects of metal migration during oxidation were investigated using the same pH values as those used for the chromate ttansport experiments in section 4.6.1. (4.5, 5.3, 6.2,7.0) over the range of 418- 582 pore volumes. This groundwater ("oxidation injection solution" in Tables 4.6-1 through 4.6-4) contained 11.7 ppb total Cr (as chromate), along with a variety of other tiace metals. The analysis of metal mobility during sediment oxidation shows which metals are mobile under reduced conditions and which metals are immobile under oxic conditions. Metals that were present in the dithionite solution (Na, K, V, Zn, Se, Ba, Cr, Br, Rb, As), marked with a single asterisk on Tables 4.6-2 through 4.6-5, decrease in concentration during oxidation as species are advected out of the column. Metals that were present in the oxidation solution (uncontaminated Puchack groundwater), including Mg, Ca, Si and Sr (double asterisk on Tables 4.6-1 through 4.6-4) all decrease initially in concenttation and then start to increase up to the injection concentration well before the partial breakthrough point of chromate (Section 4.6.1) for all pH values investigated. This initial decrease, followed by an increase in concentration occurs during approximately the first 20 pore volumes of oxidation and may be ascribed to an increase in ionic strength during dithionite reduction. The sediment could, therefore, be in the process of approaching ion exchange equilibrium, which could explain why the metal concentiations slowly increase back up to concentiations found in the injection solution.
The redox reactive metals Mn and Fe (as described earlier) are known to mobilize under extteme geochemical conditions and they also appear to decrease initially and then increase at lower pH values (4.5, 5.3 and 6.2). At pH 7, however, there appears to be very littie Fe mobilization and Mn also appears to be less mobile. Arsenic, on the other hand, also considered a redox reactive metal, decreases with oxidation across the pH range investigated (Figure 4.6-7). Although arsenic species were not determined, As(in) species are known to be mobile in reducing environments (i.e., such as during dithionite tieatment), but As(V) species form precipitate(s) during oxic water injection. Arsenic data (Figure 4.6-7) showed a steady decrease over 600 pore volumes, with main leaching in the first 10 pore volumes, and no change with different pH. Other metals, such as Al, K, V, Zn and U, all decrease, with oxidation. U(VI) species are mobile under oxic conditions, but U(IV) precipitates form under reducing conditions. There was no difference in U leaching with pH. The initial concenttation of mercury, observed at pH values of 5.3 and above, were high (Table 4.5-4 and Figure 4.6-7(a)) but decreased within the first few pore volumes of oxidation. This can be explained by the amount of Hg
303028

72
present in the dithionite solution (Table 4.5-4) leaching out of the sediment in the first few pore volumes. At pH 4.5 almost aU of the Hg appears to be immobilized by the reduced sediment.
10^^ Mercury Mobilization During Oxidation
pH4.5 pH5.3 pH6.2 pH7.0
unreported values < 12 ng/L
10 pore volumes
100
Arsenic Mobilization During Oxidation
pH5.3 pH4.5 pH6.2 pH7.0
10 100 pore volumes
Figure 4.6-7. Mobility of mercury (a) and arsenic (b) as a function of pore volume during sediment oxidation at different pH.
. ' . . )
303029

73
Table 4.6-2 pore Li
volumes Mg/1 dithionite <1000 oxidation inj. Soln. 12
I) <IUU
Metals Be
Mg/1 <100
<0.1
<IU
mobility during sediment oxidation *Na **Mg Al **Si *K Ca
Mg/I Mg/1 Mg/1 mg/I »<A'/7 mg/I 7,/00 <2000 <2000 <200 > 20000 <70()
J . i 1,440 <2 12.5 2.7 6.3
in columns at pH Sc
Mg/1 <iOOO
1
157
Tl
Mg/1 <100
0.7
5!)
*v Mg/1 262
2.3
4i:j
4.5 (* *Cr
Mg/1 967
11.7
<i()
= present in Mn Fe
Mg/1 Mg/1 <100 <10000
15.U <10
D5 < [ m
dith. solution, ** Co
Mg/1 <5
4.03
<l).5
Ni
Mg/1 <300
6.7
US
Cu
Mg/1 <200
2.4
<2U
= present in
Mg/1 «95
3U.5
ni
Ga
Mg/1 <10
0.01
\'l
oxidation G e
Mg/1 21
0.47
*As
Mg/1 59
1.97
177
solution) *Se *Br
Mg/1 Mg/1 620 3,630
2.4 81
Ji I'm 2 4 6 8 14 22 40 48 75 190 340 340
582.8
<1 1 I 2 3 6 14 14 14 12 13 13 12
<0.1 <0.1 <0.1 <0.1 <0.1 <0.1 <0.1 <0.1 <0.1 <0.1 <0.1 <0.1 0.5
>35 >3S 32.7 20.5 14.3 8.5 6.6 6.6 5.9 5.8 5.5 5.7 5.4
6 5 11 10 24
510 513
1,640 1,470 1,570 1,610 1,450
916 884 716 676 493 293 48 80 6 4
5 5 62
5.4 4.9 5.1 5.2 4.9 5.4 5.6 5.8 6.5 6.8 7.9 8.2 8.8
>20 -.>20 >20 >20 >20 42.3 21.0 20.9 4.2 2.3 1.9 2.0 1.8
<a.i <0.7 <0.7 <0.7 <0.7 <0.7 3.1 3.3 7.3 6.1 6.8 7.1 6.6
<1 <l <1 <I <1 <1 <1 <1 <1 <1 <1 <1 <1
0.9 0.7 0.6 5.1 4.4 3.7 0.8 1.7 0.4 0.3 0.3 0.4 0.5
0.4 <0.1 <0.1 3.6 3.2 2.7 0.4 0.5 <0.1 <0.1 <0.1 <0.1 0.2
1.8 <0.5 <0.5 0.6 <0.5 <0.5 <0.5 <0.5 <0.5 <0.5 <0.5 <0.5 <0.5
1.0 0.6 0.5 4.6 3.6 3.0 2.8 2.8 149 94.5 124 128 49.2
<10 <10 <10 218
231 213 43
41 308 2,150 3,580 3,720
1,640
0.025 0.021 0.023 0.277 0.249 0.257 0.079 0.067 0.009 0.016 0.542 0.581 24.8
4.5 1.3 0.7 0.9 0.7 0.3 <0.3 <0.3 <0.3 <0.3 0.4 0.4 186
1.4 <0.2 <0.2 0.4 0.4 0.4 1.2 0.6 0.3 <0.2 <0.2 <0.2 7.7
13.9 0.7
<0.5 2.3 2.1 1.2 1.5 1.1
<0.5 <0.J
<a5 <0.5 22.4
8.70 6.48 4.34 3.15 1.89 0.74 0.11 0.12 0.01 <0.01 0.02 0.02 0.02
0.47 0.19 0.14 0.11 0.08 0.06 0.02 0.02 0.02 0.02 0.02 0.03 0.05
39.7 12.9 8.86 6.40 4.44 2.30 0.57 0.56 0.10 0.19 0.22 0.31 0.13
1.2 <0.2 <0.2
0.3 <0.2 <0.2 <0.2 <0.2 <0.2 <0.2
0.3 <0.2 0.3
122 89 77 72 68 66 61 64 65 68 72 74 71
pore
volumes
dithionite oxidation inj. Soln.
U
*Rb
Mg/1 2,450
3.05
l,i5U
**Sr
MgA <40
85.7
'll
Y
Mg/1 <3
0.008
7«.yy
Zr
Mg/1 38
<0.U1
Nb
Mg/1 <5
<0.005
<U.5
Mo
Mg/1 <100
<0.1
iD
Ru
Mg« <10
<0.01
<i
Pd
Mg/1 88
<0.01
— <1
Ag
Mg/1 <200
<0.2
Cd
Mg^ <10
0.07
<l
In
Mg/1 <1
<0.001
Sn
Mg/1 <100
<U.l
<I0
Sb
Mg/I <10
O.OS
5
Te
Mgfl <100
<0.1
<l()
Mgfl <1000
52
Cs
Mg/1 <1
0.178
Ba
Mg/1 <100
17.5
2i
La
Mg/1 2
0.0U3
14a
Ce
Mg/1 3
0.0U2
\Lm
Pr
Mg/1 1
<0.001
Nd
Mg/I 3
0.UU5
\U
Sm
Mg/1 3
<0.001
7.4i5
Eu
Mg/1 1
0.001
i.aii) 1 4
6 8 14 22 40 48
75 190 340 340
582.8
78.4 28.8 17.3 11.9 8.50 5.44 6.76 6.54 4.96 3.34 3.81 3.92 3.53
2.55 2.34 1.54 1.97 1.55 2.08 30.7 30.9 90.8 87.6 95.6 98.8 92.2
0.26 0.06 0.03 1.73 1.17 0.78 0.11 0.12 0.01 0.02 0.03 0.03 0.44
0.43 0.02 0.01 0.62 0.44 0.38 0.10 0.08 <0.01 <0.01 <0.01 <0.01 0.01
<0.005 <0.005 <0.005 0.016 0.008 0.008 <0.005 <0.005 <0.005 <0.005 <0.005 <0.005 <0.005
2.3 1.1 0.6 0.3 0.3
<0.1 <0.1 <0.1 <0.1 <0.1 <0.1 <0.1 <0.1
<0.01 <0.01 <0.01 <0.01 <0.01 <0.01 <0.01 <0.01 <0.01 <0.01 <0.01 <0.01 <0.01
0.14 0.03 0.02
<0.01 <0.01 <0.01 <0.01 <0.01 <0.Q1 <0.01 <0.01 <0.01 <0.01
<0.2 <0.2 <0.2 <0.2 <0.2 <0.2 <0.2 <0.2 <0.2 <0.2 <0.2 <0.2 <0.2
<0.01 <0.01 <0.01 <0.01 <0.01 <0.01 <0.01 <0.01 <0.01 <0.01 <0.01 <0.01 0.73
<0.001 <0.001 <0.00l 0.002 0.001 0.001 <0.001 <0.001 <0.00I <0.001 <0.001 <0.001 <0.001
<0.1 <0.1 <0.1 <0.1 <0.1 <0.1 <0.1 <0.1 <0.1 <0.1 <0.1 <0.1 <0.1
0.13 0.08 0.08 0.03 0.02 0.01 0.03 0.02
<0.01 <0.01 <0.01 <0.0I <0.01
<0.1 <0.1 <0.1 <0.1 <0.1 <0.1 <0.1 <0.1 <0.1 <0.1 <0.1 <0.1 <0.1
59 48 44 40 50 45 38 37 52 40 40 44 40
0.008 0.003 0.001 0.003 0.003 0.003 0.001 0.002 0.001 0.005 0.011 0.010 0.079
0.3 0.2 0.1 0.8 0.5 0.4 1.1 1.1 4.3 14.4 34.2 36.2 26.1
0.02 0.01 0.01 2.19 1.63 1.12 0.14 0.15 0.01 0.02 0.02 0.02 0.28
0.13 0.04 0.03 6.17 5.11 3.25 0.49 0.36 0.01 0.02 0.03 0.03 0.73
0.009 0.003 0.003 0.842 0.620 0.397 0.056 0.041
<0.001 0.003 0.004 0.004 0.082
0.064 0.026 0.014 3.37 2.45 1.65
0.251 0.164 0.009 0.015 0.024 0.026 0.414
0.023 0.008 0.003 0.939 0.697 0.430 0.068 0.042 0.003 0.003 0.005 0.004 0.121
0.005 0.002 0.002 0.190 0.144 0.096 0.016 0.012 0.005 0.003 0.008 0.006 0.036
pore
volumes
dithionite oxidation inj. Soln.
0
Gd
Mg/1 <1
0.002
Tb
Mg/1 <1
<0.001
1.8
Dy
Mg/1 <1
<0.001
H o
Mg/1 <1
<U.001
2.6
Er
Mg/1 <1
<0.001
T m
Mg/1 <1
<0.001
Yb
Mg/1 <1
<0.001
6.9
Lu
Mg/1 <1
<0.U01
Hf
Mg/1 <1
<0.001
' " ^ . 4 8 " •
Ta
Mg/1 <1
<0.001
<0.1
w Mg/1 <20
0.08
Re
Mg/1 <1
0.001 <0.1
Os
Mg/1 <2
<0.002
<fl'.5
Pt
Mg/1 <300
<0.3
Au
Mg/1 65
<0.002
H g
Mg/1 <200
<0.2
Tl
Mg/1 <1
0.U74
1C0.1
Pb
Mg/1 <10
U.05
<1
Bi
Mg/1 <300
<0.3
' • ' • y f l
Th
Mg/1 15
<0.001
u Mg/1 <1
7.18
2 4 6 8 14 22 40 48 75
190 340 340
582.8
0.029 0.009 0.006 0.751 0.545 0.358 0.061 0.035 0.002 0.003 0.004 0.004 0.139
0.005 0.001
<0.001 0.098 0.072 0.047 0.007 0.005
<0.001 <0.001 <0.001 <0.001 0.021
0.034 0.008 0.004 0.405 0.303 0.196 0.027 0.027 0.003 0.003 0.003 0.004 0.084
0.007 0.002 0.001 0.065 0.049 0.031 0.005 0.006
<0.00l <0.001 <0.001 <0.001 0.016
0.018 0.004 0.003 0.184 0.134 0.080 0.014 0.015 0.003 0.002 0.003 0.003 0.035
0.002 <0.001 <0.001 0.021 0.016 0.010 0.002 0.002
<0.001 <0.001 <0.001 <0.001 0.004
0.014 0.003 0.004 0.141 0.104 0.071 0.011 0.012 0.006 0.003 0.003 0.003 0.018
0.002 <0.001 <0.001 0.019 0.014 0.010 0.002 0.001
<0.001 <0.001 <0.001 <0.001 0.003
0.008 0.002
<0.001 0.035 0.024 0.020 0.005 0.005
<0.001 <0.001 <0.001 <0.001 0.001
<0.001 <0.001 <0.001 <0.001 <0.001 <0.001 <0.001 <0.001 <0.001 <0.001 <0.001 <0.001 <0.00l
0.12 0.07 0.04
<0.02 <0.02 <0.02 0.07
<0.02 <0.02 <0.02 <0.02 <0.02 <0.02
<0.001 <0.001 <0.001 <0.001 <0.001 <0.00l <0.001 <0.001 0.002 0.001 0.002 0.002 0.002
<0.002 <0.002 <0.002 <0.002 <0.002 <0.002 <0.002 <0.002 <0.002 <0.002 <0.002 <0.002 <0.002
<0.3 <0.3 <0.3 <0.3 <0.3 <0.3 <0.3 <0.3 <0.3 <0.3 <0.3 <0.3 <0.3
<0.002 <0.002 <0.002 <0.002 <0.002 <0.002 <0.002 <0.002 <0.002 <0.002 <0.002 <0.002 <0.002
<0.2 <0.2 <0.2 <0.2 <0.2 <0.2 <0.2 <0.2 <0.2 <0.2 <0.2 <0.2 <0.2
0.016 0.006 0.005 0.004 0.004 0.004 0.003 0.002 0.002 0.002 0.002 0.005 0.147
<0.01 0.01 0.03 0.39 0.29 0.20 0.17 0.13 0.01
<0.01 0.15 0.17 0.11
<0.3 <0.3 <0.3 <0.3 <0.3 <0.3 <0.3 <0.3 <0.3 <0.3 <0.3 <0.3 <0.3
0.006 0.001 0.002 0.107 0.073 0.052 0.009 0.011
<0.001 <0.001 <0.001 <0.001 <0.001
0.021 0.007 0.005 0.191 0.158 0.122 0.022 0.022
<0.002 <0.002 <0.002 0.003 0.634
303030

74
Table 4.6-3 Metals mobility during sediment reduction p o r e Li B e *Na * * M g Al *'*Si *A' Ca
v o l u m e s Mg/' Mg/1 Mg/1 Mg/' Mg/' mg/I /i/s/7 nig/l
d i t h ion i t e < I 0 0 0 <100 7 / 0 0 <2 <2000 <200 > . '0000 <700
ox ida t ion Inj . soln. 12 <0.1 5.3 1,440 <2 12.5 . ' .7 6.3
in columns at pH 5.3 (* Sc Ti ' V * C r
Mg/l Mg/' Mg/1 Mg/' <1000 < I 0 0 262 967
1 0.7 2.3 11.7
= present in dith. solution, ** = M n Fc C o Nl C u
Mg/1 Mg/1 Mg/I Mg/I re/l <100 < 10000 <5 <300 <200
15.0 < I 0 4 .03 6.7 2.4
= present in oxidation solution) *Zn C a G c
Mg/l Mg/' Mg/' 898 <10 21
3 0 5 0.01 0.47
*As *Sc
Mg/I Mg/I 59 620
1.97 2.4
• B r
Mg/I 3600
81
14
22
40
48
75
190
340
490
<10
< I 0 0
<1
<1
<1
<1
2
7
15
15
14
13
13
13
<1
<10
0.2
<0.1
<0 . l
<0 . l
0.2
<0.1
<0.1
<0.1
<0 . l
<0.1
<0.1
0.1
> 3 5 0
469.0
32 .0
17.6
12.6
13.1
9.3
7.1
5.8
5.8
5.4
5.2
5.5
5.5
620
<200
16
12
9
10
20
708
698
1,690
1,400
1,390
1,370
635
632
1,050
785
609
639
521
185
53
35
9
4
3
2
<20
3.9
4.1
4.2
4.4
4.6
4.7
5.3
5.2
6.1
6.2
6.8
6.8
> 2 0 0
>2ono > 2 0
> 2 0
> 2 0
> 2 0
> 2 0
36.5
16.1
' I5.S
2.9
I.S
I.S
1.7
<7 <70 <0.7 <0.7 <n.7 <0.7 <0.7 <0.7 3.1 3.1 6.6 5.7 5.7 5.5
206 <100
1 <1 <1 <l 1
<1 <1 <1 <1 <1 <1
1
59 <I0 8.0 7.5 4.5 4.4 5.4 1.5 1.6 1.3 0.6 0.4 0.5 0.4
382 <10 8.0 4.6 3.4 3.5 10.9 1.1
<0.1 <0.1 <0.1 <0.1 <0.l <0.1
47 <50 2.0 0.9 0.7 0.5 4.1
<0.5 <0.5 <0.5 <0.5 <0.5 <0.5 <0.5
119 <10 9.6 5.5 3.8 3.9 117 1.4 7.2 7.0 168
96.2 81.6 52.1
2,450 <I000
710 324 220 232
2,320 98 29 28
397 1,800 3,360 1,380
2.36 <0.5
0.581 0.328 0.247 0248 1.28
0.135 0.034 0.033 0.015 0012 0.015
30.9
407 <30 1.8 07 0.6 0.5 3.1
<0.3 <0.3 <0.3 <0.3 <0.3 <0.3 57.8
99 <20 08 0.4 03 03 3.0 0.4 05 0.6
<0.2 <0.2 <0.2 03
47 65 3.2 2.8 2.2 2.3 3.8 0.9 0.8 1.7
<0.S <0.S 2.3 9.1
7.4 10
8.33 4.97 3.28 3.36 2.11 0.67 0.09 0.09 0.02
aoi 0.01
<0,01
1.2 <1
0.24 015 OIO 0.10 0.03 0.04 0.02 0.02 0.02 0.02 0.03 0.02
317 55
18.4 11.6 8.54 9.02 6.79 3.00 0.60 0.64 0.14 0.08 0.21 0.19
<2 <20 0.4 0.4 0.5 0.3 0.2 0.5 0.4 0.6 0.2 0.4
<0.2 0.4
>2,000 <300
80 73 69 71 67 63 61 62 61 60 64 63
pore volumes
dithionite oxidation
inj. soln.
—*Rb
Mg/' 2500
3.05
- S r " -
Mg/' <40
85.7
Mg/1 <3
0.01
Zr
Mg/1 38
<0.01
N b
Mg/1 <5
<0.005
M o
Mg/' <100
<01
R u
Mgrt <10
<0.01
• P d
Mg/' 88
<0.0I
Ag
Mg/' <200
<0.2
C d
Mgfl <10
0.07
In
Mg/' <1
<0.001
Sn
Mg/' <100
<0.1
Sb
Mg/1 <10
0.08
T c
Mgrt <100
<0.1
1
Mg/1 <1000
52
C s
Mg/l <l
0.178
Ba
< I 0 0
17.5
La
Mg« 2
0.003
Cc
Mg/l 3
0.002
• " P r
Mg/l 1
<0.001
N d
Mg/I 3
0.005
S m
Mg/l 3
<0.001
Eu
Mg/l 1
0.001
14
22
40
48
75
190
340
490
>2,000
187
17.5
10.6
7.64
7.90
5.87
4.30
5.96
5.94
4.14
3.50
3.83
3.88
59.5
<4
2.54
2.39
2.01
2.07
2.18
1.16
32.2
32.2
88.1
93.2
94.8
91.5
137.32
<0.3
2.41
1.51
0.96
1.06
1.72
0.26
0.05
0.03
0.01
0.01
0.01
0.03
479
9
0.82
0.51
0.47
0.33
0.12
0.11
0.25
0.10
<0.0I
<0.01
0.02
0.03
0.203
<0.5
0.015
0.014
0.008
0.008
<0.005
<0.005
<0.005
<0.005
<0.005
<0.005
<0.005
<0.005
67 42
23.5 197 16.9 15.6 107 5.3 1.0 0.9 0.4 1.1 0.3 4.2
0.2 <1
<0.0I <0.01 <0.01 <0.0I <0.01 <0.01 <0.0I <0.0I <0.01 <0.01
<aoi <0.01
29.1
2
<0.01
<0.01
<0.01
<0.01
<0.01
<0.01
<0.0I
<0.01
<0.01
<0.01
<0.01
<0.01
3 <20 <0.2 <0.2 <0.2 <0.2 <0.2 <0.2 <0.2 <0.2 <0.2 <0.2 <0.2 <0.2
0.4
<1
0.04
0.04
0.03
0.02
0.03
<0.01
<0 .0I
<0.01
<0.0I
<0.01
<0.01
0.12
0.02
<0.1
0.003
0.002
0.001
0.002
0.005
<0.001
<0.001
<0.001
<0.001
<0.00l '
<0.001
<0.001
2
<10
<0.l
<0.1
<0.1
<0.1
<0.1
<0.1
<0.1
<0.1
<0.1
<0.1
<0.1
<0.1
5.3
<1
0.06
<0.01
<0.01
<0.01
<0.01
0.02
0.02
0.01
<0.01
<0.01
<0.01
0.01
<1
<I0
<0.1
<0.l
<0.1
<0.1
<0.1
<0.1
<0.1
<0.1
<0.1
<0.l
<0.1
<0.1
470
<100
42
44
42
44
74
44
64
68
58
45
41
42
0.23
<0.1
0.006
0.004
0.002
0.002
0.012
0.001
0.002
<0.001
0.002
0.001
0.002
0.026
37 <10 1.3 1.1 0.7 0.7 1.3 0.3 1.6 1.6 5.1 16.5 34.0 26.9
i.SO 0.5 1.83 1.46 1.03 1.10 2.04
0.306 0.059 0.038 0.013 0.009 0.012 0.026
33.6 02
5.59 4.23 2.94 3.18 6.04
0.926 0.165 0157 0.044 0.025 0.018 0.041
5.31 <0.1
0780 0.576 0.380 0.402 0.830 0.115 0.015 0.012 0.004 0.004 0.002 0.005
32.1 0.4
3.48 2.34 1.60 1.61 3.70
0.480 0.065 0.049 0.022 0.017 0.011 0.023
11.2 <0.1 1.02
0.655 0.422 0.433 1.00
0.133 0.020 0.014 0.004 0.003
<0.001 0.003
2.95
<ai 0.250 0.161 0111 0.116 0.227 0.029 0.005 0.004 0.006 0.006 0.008 0.009
pore volumes
dlthloulte oxidation
Inj. solo.
Cd
Mg/l <1
0.002
Tb
Mg/l <1
<0.001
Dy
Mg/I <1
<0.001
Ho
Mg/I <1
<0.001
Er
Mg/I <1
<0.001
Tm
Mg/' <1
<0.001
Yb
Mg/l <1
<0.001
Lu Mg/l <1
<0.00l
Hf
Mg/l <1
<0.001
Ta
Mgfl <l
<0.001
W
Mg/l <20
0.08
Re
Mg/I <1
0.001
• Os
t«/l <2
<0.002
Pt
Mg/I <300
<0.3
A u
Mg/l 65
<0.002
H g
Mg/l <200
<0.2
Tl
Mg/l <l
0.074
P b
Mg/l <10
0.05
BI
Mg/l <300
<0.3
T h
Mg/l 15
<aooi
u Mg/l <1
7.18
0 1 4 6 8 8
14 22 40 48 75 190 340 490
15.3 <0.1
0.928 0.596 0.387 0395 0.897 0.115 0.016 0.010 0.004 0.004
<0.001 0.007
2.83 <0.1
0.125 0.077 0.049 0.053 0.120 0.016 0.002 0.001
<0.001 <0.001 <0.001 <0.002
17.8 <0.1
0.542 0.329 0.220 0.221 0.474 0.063 0.008 0.007 0.001 0.001 0.002 0.003
4.06 <0.1
0.088 0.055 0.036 0.038 0.068 0.010 0.001 0.002
<0.001 <0.001 <0.001 <0.001
12.4 <0.1
0.240 0.154 0.101 0.107 0.183 0.031 0.005 0.003 0.001 0.001 0.001 0.001
1.83 <ai
0.029 0.018 0.011 0.012 0.021 0.003
<0.001 <0.001 <0.001 <0.001 <0.001 <0.001
12.7 <0.1
0.192 0.122 0.083 0.082 0.131 0.024 0.004 0.003 0.002
<0.00l <0.00l <0.00l
2.08 <0.1
0.027 0.014 0.009 0.012 0.018 0.003
<0.001 <0.001 <0.001 <0.001 <0.001 <0.001
13.8 0.3
0.032 0.019 0.020 0.015 0.012 0.007 0.007 0.004
<0.001 0.002 0.001 0.002
0.14 <0.1
0.002 0.001
<0.001 0.001
<0.001 <0.001 <0.001 <0.001 <0.001 <0.001 <0.001 <0.00l
14.7 3
0.14 019 0.17 017 0.03 0.05 0.03 0.03 0.03
<0.02 <0.02 0.13
<0.0I <0.1
<0.001 <0.001 <0.001 <0.00l <0.001 <0.001 <0.001 <0.001 0.002 0.002 0.002 0.002
<0.02 <0.2
<0.002 <0.002 <0.002 <0.002 <0.002 <0.002 <0.002 <0.002 <0.002 <0.002 <0.002 <0.002
<3 <30 <0.3 <0.3 <0.3 <0.3 <0.3 <0.3 <0.3 <0.3 <0.3 <0.3 <0.3 <0.3
2.89 1.7
<0.002 <0.002 <0.002 <0.002 <0.002 <0.002 <0.002 <0.002 <0.002 <0.002 <0.002 <0.002
2 <20 <0.2 <0.2 <0.2 <0.2 <0.2 <0.2 <0.2 <0.2 <0.2 <0.2 <0.2 <0.2
0.01 <0.l
0.001 <0.001 <0.00l 0.004 0.011 0.002 0.005 0.004 0.001
<0.001 0.001 0.267
1.2 <1
0.66 0.39 0.21 0.23 1.08 0.09 0.08 0.11 0.01 0.01 0.02 0.06
<3 <30 <0.3 <0.3 <0.3 <0.3 <0.3 <0.3 <0.3 <0.3 <0.3 <0.3 <0.3 <0.3
250 <0.1
0,192 0.101 0.074 0.074 0.123 0.021 0.006 0.005
<0.001 <0.001 <0.001 <0.001
202 0.9
0.588 0.311 0.235 0.242 0.634 0,080 0,009 0,010 0,003
<O002 <O002 0.044
303031

75
Table 4.6-4 Metals mobility during sediment oxidation in columns at pH 6.2 (* = present in dithionite solution, ** = present in oxidation solution) p o r e
volumes
di thioni te oxidat ion in j . Soln.
0 2 4 6 8 14 22 40 40 48 75
188.6 338.6 413
p o r e
volumes
di thioni te oxidat ion in j . Soln.
U 2 4 6 8 14 22 40 40 48 75
188.6 338.6 413
p o r e
volumes
di th ioni te oxidat ion in j . Soln.
0 2 4 6 8 14 22 40 40 48 75
188.6 338.6 413
Li
Mg/l <1000
12
<ll)« <1 <1 <1 <1 <1 3 15 15 15 13 13 13 , 13
*Rb
Mg/l 2500
3.05
1,5!)U 27.3 9.31 7.24 6.26 5.47 4.26 4.82 4.90 4.80 5.80 3.32 3.87 3.73
Gd Mg/l <1
0.002 8.3
0.025 0.009 0.005 0.003 0.002
<0.001 0.004 0.004 0.003 0.002
<0.001 <0.001 <0.001
Be
Mg/l <100
<0.1
<10 <0.1 <0.1 <0.1 <0.1 <0.1 <0.1 <0.1 <0.1 <0.1 <0.1 <0.1 <0.1 0.1
**Sr Mg/l <:40
85.7
38 1.01 0.35 0.25 0.20 0.14 0.19 2.43 2.50 2.45 70.2 89.9 97.1 91.7
Tb Mg/l <1
<0.001
1.4 0.004 0.002
<0.001 <0.001 <0.001 <0.001 <0.001 <0.001 <0.001 <0.001 <0.001 <0.001 <0.001
*Na mg/l
7100
5.3
>mo >35 16.1 11.2 9.1 7.5 6.3 6.1 6.3 6.1 5.0 5.1 5.0 5.1
Y
Mg/l <3
0.008
4y.!J 0.120 0.027 0.012 0.006
<0.003 <0.003 0.008 0.004
<0.003 0.004
<0.003 <0.003 <0.003
Dy
Mg/I <1
<0.00l
a.y 0.020 0.005 0.004 0.001
<0.001 <0.001 0.001 0.002 0.003
<0.001 <0.001 <0.001 <0.001
**Mg
Mg/l <2
1,440
446 4 2
<2 <2 <2 6
61 66 64
1,510 1,480 1,490 1,390
Zr
Mg/l 38
<0.01
275 0.07
<0.01 <0.01 <0.01 <0.01 <0.01 0.02
<0.01 0.03
<0.01 <0.01 <0.01 <0.01
Ho Mg/l <1
<0.001
1.7 0.003
<0.001 <0.001 <0.001 <0.001 <0.001 <0.001 <0.001 <0.001 <0.001 <0.001 <0.001 <0.001
Al
Mg/l <2000
<2
5«5 1,790 1,370 906 635 379 167 40 42 49 10 4 3 4
Nb Mg/l <5
<0.U05
<().5 <0.005 <0.005 <0.005 <0.005 <0.005 <0.005 <0.005 <0.005 <0.005 <0.005 <0.005 <0.005 <0.005
Er Mg/I <1
<0.001
0.009 0.003
<0.001 <0.001 <0.001 <0.001 <0.001 <0.001 <0.001 <0.001 <0.001 <0.001 <0.001
**Si
mg/l
<200
12.5
<2() 6.3 6.4 5.9 5.6 4.8 4.5 4.7 4.8 4.8 5.3 5.8 6.7 7.5
Mo
Mg/l <100
<0.1
11 0.6 0.3 0.4 0.4 0.4 0.2
<0.1 <0.1 <0.1 <0.1 <0.1 <0.1 <0.1
Tm Mg/I <1
<0.001
U.i 0.001
<0.001 <0.001 <0.001 <0.001 <0.001 <0.001 <0.001 <0.001 <0.001 <0.001 <0.001 <0.001
*K mg/l
>20000
2.7
>20 >20 >20 >20 >20 38.9 24.3 25.0 24.3 3.1 2.4 1.8 2.1
Ru
Mg/I <10
<0.01
<1 <0.01 <0.01 <0.01 <0.01 <0.01 <0.01 <0.01 <0.01 <0.01 <0.01 <0.01 <0.01 <0.01
Yb Mg/l <1
<0.001
4.1 0.008 0.002 0.001
<0.001 <0.001 <0.001 <0.001 <0.001 <0.001 <0.001 <0.001 <0.001 <0.001
Ca mg/l
<700
6.3
<7« 0.8
<0.7 <0.7 <n.7 <0.7 <0.7 <0.7 <0.7 <0.7 7.5 7.0 6.8 6.1
Pd Mg/l 88
<0.1
11 0.02 0.04 0.01 0.01 <0.1 <0.1 <0.1 <0.1 <0.1 <0.1 <0.1 <0.1 <0.1
Lu Mg/l <1
<0.001
U.7 0.001
<0.001 <0.001 <0.001 <0.001 <0.001 <0.001 <0.001 <0.001 <0.001 <0.001 <0.001 <0.001
Sc
Mg/l <1000
1
<I()U <1 1
<1 <1 <1 <1 <1 <1 <1 <1 <1 1 1
Ag
Mg/l <200
<0.2
<5() <0.2 <0.2 <0.2 <0.2 <0.2 <0.2 <0.2 <0.2 <0.2 <0.2 <0.2 <0.2 <0-.2
Hf
Wji <1
<0.001
i.i 0.002
<0.001 <0.001 <0.001 <0.001 <0.001 <0.001 <0.001 <0.001 <0.001 <0.001 <0.001 <0.001
Ti
Mg/I <100
0.7 59 1.0 0.7 0.5 0.5 0.4 0.3 0.4 0.5 0.4 0.3 0.3 0.4 0.5
Cd
Mg/l <10
0.07
<1 <0.01 <0.01 <0.01 <0.01 <0.01 0.02
<0.01 <0.01 <0.01 <0.01 0.03
<0.01 0.01
Ta
Mg/l <1
<0.001
<().l 0.001
<0.001 <0.00l <0.001 <0.001 <0.001 <0.001 <0.001 <0.001 <0.001 <0.001 <0.001 <0.001
*v Mg/l 262
2.3
3U5 <0.1 <0.1 <0.1 <0.1 <0.1 <0.1 <0.1 <0.1 <0.1 <0.1 <0.1 <0.1 <0.1
In
Mg/l <1
<0.001
<0.1 0.002 0.001
<0.001 <0.001 <0.001 <0.001 <0.001 <0.001 <0.001 <0.001 <0.001 <0.001 <0.001
w Mg/I <20
0.08
0.12 0.09 0.10 0.09 0.08 0.06 0.03 0.03 0.05 0.02
<0.02 <0.02 <0.02
Cr
Mg/I 967
11.7
<5U <0.5 <0.5 <0.5 <0.5 <0.5 <0.5 <0.5 <0.5 <0.5 <0.5
• <0.5 <0.5 <0.5
Sn
Mg/I <100
<0.1
<1() <0.1 <0.1 <0.1 <0.1 <0.1 <0.1 <0.1 <0.1 <0.1 <0.1 <0.1 <0.1 <0.1
Re Mg/l
• < 1
0.001
<U.l <0.001 <0.001 <0.001 <0.001 <0.001 <0.001 <0.001 <0.001 <0.001 0.001 0.002 0.002 0.002
Mn
Mg/l <100
15.0
S5 0.8 0.3 0.2 0.1 0.2 0.1 0.8 0.9 0.9 16.3 72.9 82.5 64.2
Sb
Mg/l <10
0.08
<! 0.22 0.03 0.01 0.01 0.03 0.02 0.03 0.03 0.02 0.03 0.01
<0.01 <0.01
Os Mg/l <2
-0.002
<().2 <0.002 <0.002 <0.002 <0.002 <0.002 <0.002 <0.002 <0.002 <0.002 <0.002 <0.002 <0.002 <0.002
Fe
Mg/I <10000
<10
18 <10 27
<10 13
<10 <10 <10 <10 43 568
1,380 3,680
Te Mg/l
<100
<0.1
<1« <0.1 <0.1 <0.1 <0.1 <0.1 <0.1 <0.1 <0.1 <0.1 <0.1 <0.1 <0.1 <0.1
Pt Mg/l
<300
<0.3
<50 ' <0.3 <0.3 <0.3 <0.3 <0.3 <0.3 <0.3 <0.3 <0.3 <0.3 <0.3 <0.3 <0.3
Co
Mg/l <5
4.03
1.1) 0.030 0.030 0.025 0.018 0.013 0.037 0.020 0.022 0.027 0.010 0.015 0.019 2.10
I Mg/l
<1000
52
<!()() <1 61 47 49 45 117 44 47 43 80 69 41 43
Au
Mg/l 65
<0.002
3.5 <0.002 <0.002 <0.002 <0.002 <0.002 <0.002 <0.002 <0.002 <0.002 <0.002 <0.002 <0.002 <0.002
Ni
Mg/I <300
6.7
113 2.3 0.3
<0.3 <0.3 <0.3 <0.3 0.4 0.4 0.3
<0.3 <0.3 <0.3 <0.3
Cs
Mg/I <1
0.178
11.2 0.003
<0.001 <0.001 <0.001 <0.001 <0.001 <0.001 <0.001 <0.001 <0.001 0.001 0.003 0.011
Hg Mg/I
<200
<U.2
<2I) <0.2 0.7 0.2
<0.2 <0.2 <0.2 <0.2 <0.2 <0.2 <0.2 <0.2 <0.2 <0.2
Cu
Mg/l <200
2.4
<0.2 0.5
<0.2 <0.2 <0.2 0.3
<0.2 0.2 0.4 1.0 0.6 0.4 0.2
Ba
Mg/l <100
17.5
20 0.1 0.2 0.1
<0.1 <0.1 <0.1 0.2 0.2 0.2 2.0 7.6 10.7 39.1
Tl
Mg/l <1
0.074
<U.l 0.003 0.002 0.002 0.002 0.001 0.004 0.001 0.003 0.003
<0.001 0.002
<0.001 <0.001
*Zn
Mgfl 898
30.5
<Sb 3.1 4.9
<0.5 2.9
<0.5 2.6 0.7 1.1 2.1 2.9 1.4 2.4 0.6
La
Mg/l 2
0.003
0.035 0.016 0.012 0.006 0.005 0.004 0.015 0.021 0.012 0.003 0.005 0.002 0.002
Pb Mg/l <10
0.05
<1 0.03 0.03 0.02 0.22 -0.01 0.15 0.05 0.06 0.15 0.18 0.06 0.05 0.01
Ga
Mg/l <10
0.01
11.7 5.99 3.06 1.85 0.98 0.38 0.08 0.09 0.08 0.02
<0.01 <0.01 <0.01
Ce
l«/l 3
0.002
15.1 0.126 0.055 0.039 0.018 0.011 0.009 0.025 0.031 0.029 0.004 0.007 0.004 0.005
Bi
Mg/l <300
<0.3
<3() <0.3 <0.3 <0.3 <0.3 <0.3 <0.3 <0.3 <0.3 <0.3 <0.3 <0.3 <0.3 <0.3
Gc
Mg/l 21
0.47
1 0.30 0.17 0.11 0.08 0.05 0.04 0.02 0.02 0.03 0.02 0.02 0.02 0.03
Pr
Mg/l 1
<0.001
2.0 0.016 0.008 0.005 0.002 0.001
<0.001 0.004 0.005 0.003 0.001
<0.001 <0.001 <0.001
Th
Mg/I 15
<0.001
75.« 0.009 0.006 0.002
<0.001 <0.001 <0.001 <0.001 <0.001 <0.001 <0.001 <0.001 <0.001 <0.001
As
Mg/l 59
1.97
122 22.6 8.06 5.31 3.86 2.73 1.47 0.44 0.48 0.42 0.22 0.07 0.21 0.56
Nd Mg/l
3
0.005
0.075 0.033 0.026 0.014 0.007 0.001 0.016 0.012 0.013 0.003 0.010 0.003 0.004
u Mg/l <1
7.18
0.010 0.009 0.004 0.004 0.003
<0.002 <0.002 <0.002 <0.002 <0.002 <0.002 0.004
<0.002
*Sc
Mg/l 620
2.4 32
<0.2 0.4 0.3 0.4 0.5 0.4 0.7 0.4 0.4 0.4 0.4 0.4 0.4
Sm
Mg/I 3
<0.001 7.5
0.024 0.012 0.004
<0.001 <0.001 <0.001 0.002 0.002 0.004 0.001
<0.001 <0.00! <0.001
*Br •
Mg/l 3600
81
\,'m ' 136 113 109 110 105 101 99 103 101 99 103 85 83
Eu Mg/I
1
0.001
1.7 • 0.006 0.004 0.001
<0.001 <0.001 <0.001 0.002
<0.001 <0.001 0.001 0.002 0.002 0.006
303032

76
Table 4.6-5 Metal mobility during sediment oxidation at pore
volumes dithionite inj.soln.
oxidation inj. soln.
Li
Mg/l
<1000
12
Be *Na
Mg/I iiig/l
<100 7100
<U.l i.3
" M g mg/l
<2
1.4
1.4
Al
Mg/I
<2000
<2
mg/l
<200
12.5
mgA
>20ono
2.7
mg/l
<7fl0
6.3
pHV.C He
Mg/I
<1000
1
' { * ' -Mg/I
<100
0.7
= present m
Mg/l
262
2.3
*Cr
M8/I
967
11.7
dithionite solution. Mn h'e
Mg/I Mg/I
<100 <I000D
15.U <1U
Co
Mg/I
<5
4.03
** =
Mg/I
<300
6.7
present t u Mg/I
<200
2.4
in oxidation
Mg/l
«»« 3W.5
(;a
Mg/I
<10
U.Ol
solution) (Je
Mg/I
21
0.47
*As
Mg/I
59
1.97
*He
Mg/I
620
2.4
*Br
Mg/I
3600
81
0 2 4 6 9 14 22 40 48 75
190 190 340
582.8
<100 <100
6 8 9 10 11 11 11 12 12 13 12 12
<10 <10 <0.1 <0.1 <0.1 <0.1 <0.1 <0.1 <0.1 <0.1 <0.1 <0.1 <0.1 <0.1
>3500 733.0 25.5 17.7 15.2 13.S 12.5 11.2
i n 10.5 10.4 10.8 9.1 9.0
1.4 <0.2 0.0 0.1 0.4 0.7 1.0 1.4 1,4 1.6 1,7 1,7 1.7 1.7
309 452 146 45 30 27 13 13 10 12 19 20 7 5
<20 <20 4.8 5,0 5.2 5.1 5.4 6.2 6.1 7.4 8.4 8.7 8.7 8.9
>2000 >2000
>20 >20 >20 45.8 30.3 16.4 16.4 9.0 4.0 5.1 3.6 2.9
<1Q <70 <0.7 1.7 2.9 3.5 4.2 5.5 5.4 6.5 7.0 7.2 7.1 7.3
158 <100 <1 <1 <1 <1 <1 <1 <1 1 1 1 1 1
55 <10 0.7 0.6 0.6 0.7 0.4 0.7 0.4 0.7 0.9 0.9 0.8 0.7
443 <10 15.4 8.2 6.0 3.6 2.4 2.5 2.5 1.3 0.8 0.8 0.4 <0.1
<50 <50 <0.5 <0.5 <0.5 <0.5 <0.5 <0.5 <0.5 <0.5 <0.5 <0.5 <0.5 <0.5
201 10 2.4 3.0 2.2 2.3 3.2 4.2 4.2 11.0 27.0 28.2 36.0 38.3
<1000 <1000 47 <10 <10 33 <10 <10 <10 17
<10 <10 <10 <10
1.4 <0.5 0.176 0.091 0.059 0.069 0.063 0.094 0.085 0.175 0.575 0.615 2.31 6.67
278 36 4.9 2.2 1.7 1.5 0.9 0.6 0.5 0.7 3.1 3.2 4.7 6.2
<20 <20 3.6 0.5 0.3 0.3 <0.2 0.4 0.3 0.6 2.5 2.6 1.3 0.7
/// 123 70.6 5.8 4.2 3.6 2.3 2.7 2.6 4.8
10.4 11.3 10.7 6.3
5 4
1.19 0.59 0.40 0.29 0.21 0.19 0.20 0.11 0.05 0.05
• 0.02 <0.01
1 <1 0.08 0.05 0.04 0.04 0.03 0.02 0.03 0.04 0.06 0.06 0.08 0.07
92 15
7.83 4.28 3.06 2.09 1.30 0.75 0.73 0.44 0.31 0.29 0.22 0.13
23 <20 <0.2 <0.2 <0.2 <0.2 <0.2 <0.2 0.3 <0.2 <0.2 <0.2 <0.2 <0.2
2,070 <300 89 83 76 73-72 69 66 67 67 69 61 65
pore volumes
dithionite inj.soln.
oxidation inj. soln.
*ttb Mg/l
2500
3.05
—»*5V Mg/l
<40
85.7
5 — Mg/I
<3
0.008 Al.l
—zr— Mg/l
38
<0.01
Nb Mg/l
<5
<0.005
Mo Mg/l
<100
<0.1
— m i Mg/l
<10
<0.U1
<1
—n— Mg/l 88
<0.01 <l
" T g -Mg/1
<200
<0.2
Ci Mg/I
<10
0.07
<1
In Mgrt
<1
<0.U01
Jin Mg/l
<100
<0.1
Sb
Mg/l
<10
0.08
i
— T T -Mg/l
<100
<0.1
— I — Mg/I
<1000
52
—r;— Mg/l
<1
0.178
— B T -Mg/I
<100
17.5
—cr-Mg/l
2
0.003
Mg/I
3
0.002
PT— Mg/I
1
<0.001 6.4
Nd
Mg/l
3
0.005
Sm
Mg/I
3
<0.001
15.4
—Vi— Mg/l
1
0.001 2.5
0 2 4 6 9 14 22 40 48 75 190 190 340 582.8
2,360 294 14.4 9.99 7.65 6.39 5.48 4.41 4.35 3.84 3.73 3.85 3.61 3.42
79 6
0.74 5.19 16.5 28.7 38.2 55.5 54.4 70.4 78.9 82.7 85.8 86.5
62.5 0.3
0.036 0.027 0.015 0.015 0.011 0.006 0.006 0.009 0.009 0.009 0.005 0.006
469 12
0.39 0.13 0.07 0.05 0.04 0.02 0.03 0.01 0.01 0.02 0.03 0.03
<0.5 <0.5
<0.005 <0.005 <0.005 <0.005 <0.005 <0.005 <0.005 <0.005 <0.005 <0.005 <0.005 <0.005
19 <10 5.3 2.5 1.7 1.1 0.6 0.3 0.2 <0.1 <0.1 <0.1 <0.1 <0.1
<1 <1
<0.01 <0.01 <0.01 <0.01 <0.01 <0.01 <0.01 <0.01 <0.01 <0.01 <0.01 <0.01
<1 <1
<0.01 <0.01 <0.01 <0.01 <0.01 <0.01 <0.01 <0.01 <0.01 <0.01 <0.01 <0.01
<20 <20 <0.2 <0.2 <0.2 <0.2 <0.2 <0.2 <0.2 <0.2 <0.2 <0.2 <0.2 <0.2
<1 <1 0.10 0.04 0,02 <0.01 <0.01 <0.01 <0.01 <0.01 0.03 0.04 0.02 0.01
<0.1 <0.1 0.002 0.001 ' 0.001 <0.01 <0.01 <0.01 <0.01 <0.01 <0.01 <0.01 <0.01 <0.01
<10 <10 0.5 <0.1 <0.1 <0.1 <0.1 <0.1 <0.1 <0.1 <0.1 <0.1 <0.1 <0.1
6 <1 0.53 0.20 0.12 0.07 0.05 0.06 0.06 0.05 0.05 0.05 0.03 0.02
<10 <10 <0.1 <0.1 <0.1 <0.1 <0.1 <0.1 <0.1 <0.1 <0.1 <0.1 <0.1 <0.1
<100 <100 <1 <1 <1 <1 <1 <1 <1 <1 <1 <1 <1 <1
0.3 <0.1
0.010 0.005 0.003 0.003 0.002 0.013 0.014 0.030 0.085 0.093 0.135 0.145
52 <10 0.6 0.9 1.1 0.8 1.3 1.2 1.1 1.0 9.5 9.6 15.8 18.6
10.5 <0.1
0.033 0.012 0.010 0.016 0.003 0.003 0.002 0.004 0.007 0.008 0.010 0.005
39.5 0.3
0.093 0.030 0.020 0.031 0.005 0.004 0.003 0.006 0.010 0.010 0.011 0.006
6.7 <0.1
0.012 0.004 0.002 0.004
<0.001 <0.001 <0.001 0.001 0.001 0.002 0.002
<0.001
37.6 0.3
0.041 0.020 0.014 0.021 0.002 0.003 0.002 0.003 0.003 0.004 0.006 0.001
12.1 0.1
0.013 0.004 0.003 0.005
<0.001 <0.001 <0.001 <0.001 0.001 0.002
<0.001 <0.001
3.2 <0.1
0.002 <0.001 <0.001 <0.001 <0.001 <0.001 <0.001 <0.001 <0.001 0.002 0.002 0.003
pore volumes
dithionite inj.soln.
oxidation inj. soln.
Ci Mg/I
<1
0.0U2
— T B — Mg/l
<i
<0.001
— U y
Mg/I
<1
<0.001
ll.U
—nr-Mg/I
<i
<0.001
.1
Mg/l
<1
<0.001
Mg/I
<1
<0.001
Vb Mg/l
<1
<0.001
—nr-Mg/l
<i
<0.0U1
U.S
—m— Mg/l
<1
<U.0U1 lU.l)
— T ^ — MB/I
<1
<0.U01
W Mg/l
<20
O.OS
— R T -MB/I
<l
U.OUl <().l
—nr-Mg/I <2
<0.UO2
— F t —
Mg/l
<300
<U.3
Sr-Mg/I
65
<0.0O2
— H g Mg/'
<200
<0.2
—n— Mg/l
<1
0.074 <0.1
Pb Mg/l
<10
U.05
TI— Mg/'
<300
<0.3
— T E — Mg/l
15
<0.001
—c— Mg/l
<1
7.18
0 2 4 6 9
14 22 40 48 75 190 190 340 182.8
13.6 <0.1
0.013 0.006 0.002 0.006
<0.001 <0.001 0.001 0.001 0.001
<0.001 <0.001 <0.001
2.2 <0.1
0.002 <0.001 <0.001 <0.001 <0.001 <0.001 <0.001 <0.001 <0.001 <0.001 <0.001 <0.001
12.2 0.1
0.006 0.003 0.002 0.003
<0.001 <0.001 <0.001 <0.001 <0.00l <0.001 <0.001 <0.001
2.1 <0.1
<0.001 <0.001 <0.001 <0.001 <0.001 <o.ooi <0.001 <0.001 <0.001 <0.001 <0.001 <0.001
5.5 <0.1
0.002 <0.001 <0.001 0.002 0.001
<0.001 <0.001 <0.001 <0.001 0.001
<0.001 <0.001
0.8 <0.1
<0.001 <0.001 <0.001 <0.001 <0.001 <0.001 <0.001 <0.001 <0.001 <0.001 <0.001 <0.001
5.6 <0.1
0.002 <0.001 <0.001 0.002
<0.001 <0.001 <0.001 <0.001 <0.001 <0.001 <0.001 <0.001
0.8 <0.1
<0.001 <0.001 <0.001 <0.001 <0.001 <0.001 <0.001 <0.001 <0.001 <0.001 <0.001 <0.001
10.7 o;2
0.004 <0.001 <0.001 <0.001 <0.001 <0.001 <0.001 <0.001 <0.001
•<0.001 <0.001 <0.001
<0.1 <0.1
<0.001 <0.001 <0.001 <0.001 <0.001 <0.00l <0.001 <0.001 <0.001 <0.001 <0.001 <0.001
3 <2
0.22 0.16 0.13 0.11 0.11 0.09 0.09 0.07 0.05 0.06 0.07 0.04
<0.1 <0.1
0.002 0.002 0.002 0.001 0.002 0.001 0.002 0.002 0.002 0.001 0.002 0.001
<0.2 <0.2
<0.002 <0.002 <0.002 <0.002 <0.002 <0.002 <0.002 <0.002 <0.002 <0.002 <0.002 <0.002
<30 <30 <0.3 <0.3 <0.3 <0.3 <0.3 <0.3 <0.3 <0.3 <0.3 <0.3 <0.3 <0.3
1.3 1.0
<0.002 <0.002 <0.002 <0.002 <0.002 <0.002 <0.002 <0.002 <0.002 <0.002 <0.002 <0.002
<20 <20 <0.2 <0.2 <0.2 <0.2 <0.2 <0.2 <0.2 <0.2 <0.2 <0.2 <0.2 <0.2
<0.1 <0.1
0.005 0.004 0.003 0.003 0.004 0.006 0.004 0.004 0.045 0.047 0.073 0.062
2 <1
0.28 0.10 0.03 0.06
<0.01 0.02
<0.01 0.19 0.24 0.25 0.22 0.05
<30 <30 <0.3 <0.3 <0.3 <0.3 <0.3 <0.3 <0.3 <0.3 <0.3 <0.3 <0.3 <0.3
131 0.2
0.006 <0.001 <0.001 <0.001 <0.001 <0.001 <0.001 <0.001 <0.001 <0.001 <0.001 <0.001
97.6 0.3
0.442 0.692 0.613 0.408 0.295 0.232 0.231 0.120 0.086 0.089 0.052 0.031
r-
30303;
77
4.7 Biostimulation
The potential for creating a permeable reactive barrier in the Puchack aquifer using biotic processes is explored in this section. This assessment includes laboratory studies focused on determining the indigenous population of iron-reducing bacteria (IRB) and sulfate-reducing bacteria (SRB) in the aquifer. These bacteria can catalyze in situ formation of a permeable reactive barrier by using an amended substiate (e.g., lactate) to either directly or indirectly reduce sediment-associated iron. Barrier performance would be further enhanced by the presence of sulfide compounds with the use of sulfate-reducing bacteria. Both of these bacteria are primarily active under reducing geochemical conditions and while they are generally widely distributed in many aquifers, their populations may be low enough in some aquifers that they cannot be readily stimulated even with addition of appropriate substrates.
As the first step in assessing the viability of biotic processes for in situ formation of a permeable reactive barrier, available sediment core material was assayed to enumerate the indigenous populations of these bacteria. Eight aquifer sediment samples from boreholes MW-36 and MW-37 were chosen for this study and are given of Table 4.7-1. Enumeration and enrichment techniques were used to assess the population of viable iron-reducing and sulfate-reducing bacteria in the samples.
MPN enumeration of both IRB and SRB was performed in replicates, on two sediments (PNNL ID # 1 and 2) with incoculants encompassing lO'' to 10"' dilutions. After incubation for 6 weeks, none of the MPN tubes showed positive growth, implying that SRB and IRB were either not present, or in the best case, was present at a population of less than 20 cells per gram of sediment. All positive controls showed growth to demonstrate that the culturing media were suitable for inducing growth of IRB or SRB.
Direct enrichments could not be used to enumerate the bacterial population, but provided an indication of whether any viable bacteria are present in the sediment sample. In treatments with 1 g of sediment and 10 mL of culturing media, growth of IRB was observed in the majority of sediment samples (PNNL ID #5, 6,2,7,4,8), Table 4.7-2. No growth of SRB were detected in any of the sediments tested at this inoculum level. Table 4.7-3. In direct enrichments with 30 g sediment per 30 ml SRB medium, only one sample (PNNL ID #7) indicated potential SRB growth. Growtii of IRB and SRB was observed in positive controls for direct enrichments. These positive contiol results indicate that the sediments are not toxic or inhibitory to iron/sulfate reducing microorganisms under the experimental conditions for the direct enrichments.
Tables 4.7-2 and 4.7-3 summarized the enumeration and direct enrichment results. In conclusion, iron-reducing bacteria (IRB) are present in the Puchack sediment samples tested, but at low population densities of <20 cells per g sediment. All of the samples from the Lower Aquifer showed the presence of IRB in the direct enrichments, though with varying degrees of growth intensity. Only one sample of three showed presence of IRB in direct emichments but with a low growth intensity over the incubation period. Based on these results, stimulation of IRB through amendments to the subsurface may be
303034

78
possible but the response may be slow and the non uniform. Potentially, there are areas in the subsurface that contain higher populations of IRB than were observed in the sediment samples that would act as "seed populations" to enhance the response to amendments. Final interpretation of the IRB enumeration/enrichment results should be conducted after the geochemical information about the core samples is available.
Sulfate-reducing bacteria (SRB) were detected in only one sediment from the Lower Aquifer in direct enrichments. If SRB are present, their population is <20 cells per g of sediment. It is likely that the population of viable SRB in the aquifer is very low and may not be readily stimulated through amendments to the subsurface. However, with long subsurface incubation times SRB may become active. Assessing the viability of SRB-catalyzed processes for in situ formation of a permeable reactive barrier will need to consider whether a long incubation period is possible.
.: 1 i
i.,.J
303035
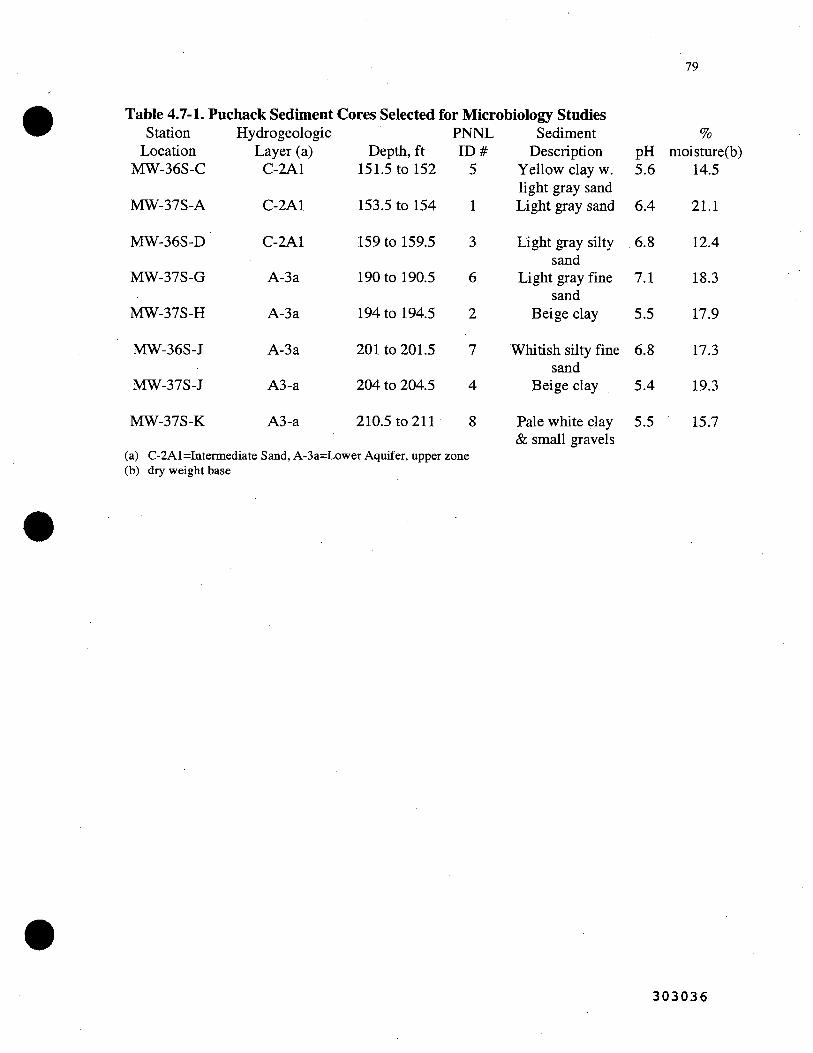
79
Table 4.7-1. Puchack Sediment Cores Selected for Microbiology Studies Station
Location MW-36S-C
MW-37S-A
MW-36S-D
MW-37S-G
MW-37S-H
MW-36S-J
MW-37S-J
MW-37S-K
Hydrogeologic Layer (a)
C-2A1
C-2A1
C-2A1
A-3a
A-3a
A-3a
A3-a
A3-a
Deptii, ft 151.5 to 152
153.5 to 154
159 to 159.5
190 to 190.5
194 to 194.5
201 to 201.5
204 to 204.5
210.5 to 211
PNNL I D #
5
1
3
6
2
7
4
8
Sediment Description
Yellow clay w. light gray sand Light gray sand
Light gray silty sand
Light gray fine sand
Beige clay
Whitish silty fine sand
Beige clay
Pale white clay
pH 5.6
6.4
6.8
7.1
5.5
6.8
5.4
5.5
% moisture(b)
14.5
21.1
12.4
18.3
17.9
17.3
19.3
15.7
(a) C-2Al=Intemiediate Sand, A-3a=Lower Aquifer, upper zone (b) dry weight base
& small gravels
303036

80
Table 4.7-2. Summary of Iron-Reducing Bacteria Enumeration and Enrichment Treatment
Sample ED
MW-36S-C C-2A1
MW-37S-A C-2A1
MW-36S-D C-2A1
MW-37S-G A-3a
MW-37S-H A-3a
MW-36S-J A-3a
MW-37S-J A-3a
MW-37S-K A-3a
Depth, ft 151.5 to
152 153.5 to
154 159 to 159.5 190 to 190.5 194 to 194.5 201 to 201.5 204 to 204.5
210.5 to 211
PNNL I D #
5
1
3
6
2
7
4
8
lg(a)
+/+
- / -
- / -
++/++
+/+
-/+
+/+
+/+
lO' " g to lOA-7 g ( )
not done
- l - I - l - I -
not done
not done
- l - I - l - I -
not done
not done
not done
Ig+low cells'^^ +/++
- / -
- / -
++/++
++/+
+/-
+/+
+/++
Ig+med. Cells ""
+/+
-/++
- / -
++/++
+/+
++/-
+/++
++/+
Ig+high cells '= +/++
- / -
- / -
+-I-/++
+/++
+/++
+-1-/++
+/+
• '
•:
' '
^ )
• (
, ,
f " 1" •*• -
n"\
Growth assessment: growth medium clear colorless: ++, pale brown/cloudy: +, clear brown: -(a) 1 g sediments per 10 ml IRB medium, 2 replicates, 4 weeks incubation (b) MPN, 5 replicates per each of 5 dilutions, 2 replicates per sediments tested, 6 weeks incubation (c) 1 g sediment plus 2E+3 cells (G.metallireducens) per 10 mllRB medium, 2 replicates,4 weeks incubation (d) 1 g sediment plus 2E+5 cells (G.metallireducens) per 10 ml IRB medium, 2 replicates, 4 weeks incubation (e) 1 g sediment plus 2E+7 cells (G.metallireducens) per 10 ml IRB medium, 2 replicates, 4 weeks incubation
303037

81
Table 4.7-3. Summary of Sulfate-Reducing Bacteria Enumeration and Enrichment Treatment
Sample ID MW-36S-C
C-2A1 MW-37S-A
C-2A1 MW-36S-D
C-2A1 MW-37S-G
A-3a MW-37S-H
A-3a MW-36S-J
A-3a MW-37S-J
A-3a MW-37S-K
A-3a
Deptii, ft 151.5 to
152 153.5 to
154 159 to 159.5 190 to 190.5 194 to 194.5 201 to 201.5 204 to 204.5
210.5 to 211
PNNL ID # 30 g "'
5
1
3
6
2
7 +
4
8
10A-' g to IgW 10A-^g(=)
-/- not done
-/- - l - I - l - I -
-/- not done
-/- not done
-/- - l - I - l - I -
-/- not done
-/- not done
-/- not done
Ig+low cells "
+/+
+/+
+/+
+/+
+/+
+/+
+/+
+/+
Ig+med. Cells '='
+/+
+/+
+/+
+/+
+/+
+/+
+/+
+/+
Ig-hhigh cells ®
+/+
+/+
+/+
+/+
+/+
+/+
+/+
+/+
Growth assessment: growth medium blackened: +, color not changed: -(a) 30 g sediments per 30 ml SRB medium, no replicates, 2 weeks incubation (b) 1 g sediments per 10 ml SRB inedium, 2 replicates, 4 weeks incubation (c) MPN, 5 replicates per each of 5 dilutions, 2 replicates per sediments tested, 6 weeks incubation (d) 1 g sediment plus 2E+3 cells (D.vulgaris) per 10 ml SRB medium, 2 replicates, 4 weeks incubation (e) 1 g sediment plus 2E+5 cells (D.vulgaris) per 10 ml SRB medium, 2 replicates, 4 weeks incubation (f) 1 g sediment plus 2E+7 cells (D.vulgaris) per 10 ml SRB medium, 2 replicates, 4 weeks incubation
303038

82
Conclusions
This report describes results from bench scale laboratory experiments documented in a test plan entitled Bench Scale Test Plan: Treatability Study of In Situ Technologies for the Remediation of Hexavalent Chromium in Groundwater. These treatability studies were conducted using sediment and groundwater samples collected from the Puchack Well Field Superfimd Site in Pennsauken Township, New Jersey. Results are reported for specific laboratory experiments that were conducted to evaluate mechanisms that could contiibute to attenuation of the chromate plume and potential technologies for the remediation of chromate contaminated groundwater. Three general categories of technologies that were evalxiated include: a) abiotic reduction of ferric oxides in sediments to create a reduced zone (In Situ Redox Manipulation or ISRM), b) biostimulation (nutrient injection) of the natural microbial population to create a reduced zone, and c) natural attenuation of the chromate plume (adsorption and reduction).
Chromate Adsorption Chromate adsorption was evaluated in order to accurately predict chromate
transport, which would lag due to the reversible chromate adsorption (confirmed in column experiments) and result in an apparent lag that could be mistakenly attributed to chromate reduction and subsequent immobilization. Chromate adsorption by deep composite sediments was highly dependent on the pH, with greater adsorption at low pH (typical anion behavior). The initial chromate adsorption was fast (minutes), but there was continued adsorption for 24 h, so there was some contact time dependence for chromate adsorption. As an anion, the amoimt of chromate adsorption was also dependent on the chromate and other anion concentiations. The adsorption maxima for a Puchack composite sediment was about 6 umol/g, and chromate adsorption was shown to decrease with increasing concentration. The concentration of sulfate (at 50 mg/L) was shown to suppress chromate adsorption by up to 50%. Thus, chromate disposal and migration in the presence of SO4 and other anions (e.g., HCOj " and COj ") in the contaminant plume will decrease chromate adsorption relative to adsorption which would occur in their absence. However, with only a factor of 2 decrease in the K s derived from these experiments (Figure 4.2-8), the effect of sulfate on chromate migration in the concentration range found at Puchack is relatively small. The influence of inorganic colloids on chromate mobility was studied with sequential filtiation of aqueous samples with 0.45, 0.2, 0.1 and 0.01 micron filters. No consistent variation in chromate concentration with filter pore size was observed. Although this does not prove that inorganic colloids are totally absent, we can conclude that either there is no generation of inorganic colloids in Puchack sediments and/or the small fraction of total chromate present on these colloids is of negligible importance for chromate mobility.
303039

83
Chromate Reduction in Natural Puchack Sediments
Chromate reduction by natural I*uchack sediments was studied for time periods ranging from hours to 11 months. Results show that natural chromate reduction can • occur in the I*uchack sediments. At the field scale a combination of the geochemical ' mechanisms evaluated in this study and hydrogeologic conditions at the site determine the amount of reduction/immobilization of the chromate plume that would occur. ! Composite sediments from specific aquifer units showed no reduction of chromate for ' four composites (A2b, A3a, A3c), and slow reduction for three composites (A2a, C2A1 and A3b; half-Uves of 1, 3, and 3 years, respectively (Table 4.3-2). A deep aquifer composite showed approximately a 10 fold increase in chromate reduction rate (2600 h or ' ' 108 day half-Ufe), and selected sediments (typically finer grain sediments from interbeded clays) showed rapid chromate reduction with a 46 hour half-life. ' Experimental results indicate that chromate reduction can remain viable in the presence of dissolved oxygen. Given the amount of variabiMty observed in the samples analyzed in this study, predicting the expected chromate reduction rate in a complex aquifer ' j system, based on the 8 composite sediments and the 3 individual sediments examined, would result in a relatively high degree of uncertainty. To better quantify the spatial ^ n variability within selected aquifer units, additional natural chromate reduction geochemical studies would be required. With this additional data reactive transport models could be used to evaluate various scenarios of groundwater flow and chromate -r > plume transport through the aquifer system. With this expanded set of rate and capacity !: j data these models could more reliably estimate the impacts of the identified mechanisms on chromate plume attenuation.
Most sediments that showed some natural reduction of chromate had very small reductive capacities (average 2.76 ± 1.02 umol/g), but one sediment had a large reductive ) capacity (636 umollg) with considerable amorphous ferrous iron and 2.25% organic j carbon. While some Puchack sediments have been shown to be redox reactive with chromate, the reactive surface phases at such low concentiations, in general, were not ;; | identified. These natural reductive capacities show that on average, 63 pore volumes of I j water containing the highest observed chromate concentration would be reduced (although the silt/clay sample with high reductive capacity would last an estimated I'] 11,000 pore volumes). 11
. I
Chromate Reactivity in Dithionite-Reduced Sediments j Chemical reduction of Puchack sediments resulted in a considerable increase in
the reductive capacity, which averaged 60.2 ± 25.6 umol/g with an additional sample | with very large capacity (390 umol/g). This average reductive capacity would result in a ' reduced sediment barrier longevity of 355 pore volumes or 39 years (assuming a 40ft wide barrier and a groundwater velocity of 1.0 ft/day), with greater longevity for slower ! flow and less longevity for faster flow such as near pumping wells. While this reductive ' capacity is sufficient to consider dithionite-reduction of sediment a viable remediation technology, it should also be noted that there was considerable variability in reductive ; capacity of sediments, so additional geochemical characterization of a specific aquifer
303040

84
zone of interest should be accomplished to determine the average reductive capacity that would result in that specific location.
In addition, of significance for applicability to the Puchack aquifer system is the influence of pH on the barrier longevity, as the I*uchack aquifer system has pH values ranging from 4.5 to 7.0. It was hypothesized that under acidic conditions: a) ferrous iron phases produced could be mobile (aqueous), and b) Cr(III) species produced could be mobile. Surprisingly, chromate reduction/immobiUzation was very effective in four long-term column studies at pH 4.5, 5.3, 6.2, and 7.0, showing that most ferrous iron phases were immobile and aqueous Cr(III) species were not produced. These results indicate that most of the ferrous iron phases produced by dithionite reduction of Puchack sediments remained immobile, so were composed of structurally reduced iron in 2:1 clays, or other iron oxides, and not adsorbed Fe(n). Under acidic conditions, adsorbed ferrous iron is mobile so the capacity of reduced sediments to immobilize chromate may be less at low pH than at neutral pH. Column studies did show the reductive capacity was a function of pH (Table 5-1), with a small amount of Fe(II) mobilization (3.6% to 9.0%) at pH 4.5 compared witii less Fe(n) mobilization (0.1% to 0.35%) at pH 7.0.
Table 5-1. Influence of pH on Chromate ImmobiUzation in Reduced Sediments.
pH
4.5 5.3 6.2 7
reductive capacity (umol//g)
54.5 62.2 106 84.8
Chromate Breakthrough rapid Cr red. total capacity capacity (pv) (pore vol.)
170 310. 170 350 280 601 340 4«0
Fed!) eluted (%)*
3.6 1.3
0.16 0.35
Cr(total) Breakthrough initial elution total capacity Fe(tot) eluted
(pore vol.) (pore vol.) (%)*
8 >583 9.0 14 > 490 10.5 1 >413 1.5 1 >583 0.10
* percent of reductive capacity (umol/g) x sediment (g)
In colimin studies, chromate was initially reduced/immobilized in reduced sediment at all pH values at a rapid rate (reduction half-life > 0.1 h). By 170 pore volumes at pH 4.5 and 5.3, partial chromate breakthrough was observed, indicating slower chromate reduction rates (half life 3 to 5 h). In confrast, partial chromate breakthrough was not observed imtil 280 pore volumes at pH 6.3 and 340 pore volumes at pH 7.0. The ultimate capacity of the sediment column to consume 2.0 mg/L chromate plus 8.4 mg/L dissolved oxygen (saturated conditions) was about 310 pore volumes at pH 4.5 and 480 pore volumes at pH 7.0.
To address the question of mobile Cr(IlI) species, total Cr analysis (ICP-MS) was conducted during separate experiments. These results showed no indications of Cr breakthrough for 413 to 582 pore volumes (Table 5-1). Trace metal analysis during sediment reduction and oxidation experiments showed some mobilization of Hg, As, and Fe(n) during reduction, and a small amount of Hg and As mobilization during the first few pore volumes (of 400) during sediment oxidation. There was some Fe(II) mobilization observed, which was greater at lower pH, but still resulted in < 5 % of the iron in the sediment column being mobilized. Therefore, aqueous ferrous iron data and total iron data both indicated a small amount of iron mobilization at pH 4.5 and 5.3, with less at pH 6.2 and 7.0.
303041
85
n
Biostimulation of Iron-Reduciag and Sulfate-Reducing Bacteria Iron-reducing bacteria (IRB) are present in the I*uchack sediment samples tested,
but at low population densities of <20 cells per g sediment. In comparison, cell densities in the Ft Lewis, Washington aquifer (60' depth) are 5 x 10 CFU/g, and Hanford, Washington lOON area shallow aquifer (30' depth) range from itf CFU/g to 10 CFU/g. All of the samples from the Lower Puchack Aquifer showed the presence of IRB in the direct enrichments, though with varying degrees of growth intensity. Only one sample of three showed presence of IRB in direct enrichments but with a low growth intensity over the incubation period. Based on these results, stimulation of IRB through amendments to the subsurface may be possible but the response may be slow and the nonuniform. Potentially, there are areas in the subsurface that contain higher populations of IRB than were observed in the sediment samples that would act as "seed populations" to enhance the response to amendments. Final interpretation of the IRB enumeration/enrichment results should be conducted after the geochemical information about the core samples is available.
Sulfate-reducing bacteria (SRB) were detected in only one sediment from the Lower Aquifer in direct enrichments. If SRB are present, their population is <20 cells per g of sediment. It is likely that the population of viable SRB in the aquifer is very low j ! and may not be readily stimulated through amendments to the subsurface. However, with long subsurface incubation times SRB may become active. Assessing the viability of SRB-catalyzed processes for in situ formation of a permeable reactive barrier will need to consider whether a long incubation period is possible.
Recommended Future Studies Field-scale implementation of any process to manipulate the subsurface (i.e.,
chemical reduction of sediment or biostimulation) would require some additional geochemical/microbial characterization in the specific field site chosen for in situ remediation to define the spatial distribution of reducible iron and/or microbial population. Similarly, the use of monitored natural attenuation (MNA) also requires additional characterization of the spatial distribution of the reduced phases that are reducing chromate. The current study has clearly shown that chromate reduction does occur for specific natural imtreated sediments or sediment composites from the Puchack aquifer system. In addition, if the observed rates of reduction for these sediments are applicable over a large volume of the aquifer, natural attenuation could make a significant contribution to chromate remediation at the Puchack site. However, because the major focus of the current study was dithionite treated sediments a limited number of natural untreated sediments were examined. Additional research focused on natural attenuation is needed to establish its role and quantify its contribution to remediation of chromate in Puchack groundwater. A follow-on study outiined below would focus on mapping the natural reductive potential of regions surrounding core samples shown to have significant reductive capacity in the current study. That is, it would establish the spatial distribution of sediments exhibiting measurable reduction rates. This would yield a quantitative
303042

86
estimate of the reductive capacity and the longevity of chromate reduction by sediments within this region. Additional information identifying the mineral and/or organic phases acting as chromate reductants will be obtained. Finally, methods used in the current study for quantifying the reductive capacity of sediments in terms of the moles electrons available for chromate reduction per gram of sediment would be refined and expanded to all relevant reductants phases. With the limited but encouraging information on natural attenuation resulting from the current study, reliable estimates of the spatial extent of natural attenuation caimot be made. However, with additional information from the follow-on study outlined below together with groundwater flow maps of the target aquifer zone and knowledge of the aqueous concentrations of other electron acceptors in Puchack ground water (e.g., Oj , TCE) reactive transport modeling could provide far more reliable estimation of the role natural chromate attenuation would play in chromate remediation at the Puchack site.
I . Determination of the spatial extent and variability of chromate reduction for sediments in those aquifer zones where natural chromate reduction has been observed. The deep aquifer regions would be of particular interest because there is significant groimdwater flow through these zones. This would include measurement of chromate reduction rates and the sediment reductive capacity in selected core samples from wells MW36, MW37, Dl and D2 at the Puchack site. These core samples are currently in cold storage in our laboratory. A map of rates and reductive capacities for the zones examined would result and is essential for prediction of the effectiveness and longevity of sediments over a significant spatial volume to act as a natural barrier within which chromate is reduced to insoluble Cr(in) or mixed (Cr, Fe) hydroxides.
n. Resolution of differences in estimating sediment reductive capacities by the two methods employed in the current study. The reductive capacity is defined as the moles electrons available for chromate reduction per gram of sediment. One measure was determined from the consumption of dissolved O2 from effluent waters pumped through sediment columns. The net reductive capacity thus determined does not quantify the individual constituents contributing to the reductive capacity, e.g., ferrous iron as structural or surface species, natural organic matter (NOM) or sulfides. The second measure targeted ferrous iron, considered to be a primary reductant (election donor) in a majority of natural reduced sediments; however, this ignores both NOM and bacterial populations as electron donors. The most accessible and/or reactive Fe(II) phases were estimated by measurement of Fe(n) extracted by a short 0.5 M HQ treatment of the sediment. For many of the natural sediments examined the average reductive capacity (moles e" / g of sediment) for both methods were in remarkably close agreement (Table 4.3-3). However, for other sediments the two methods disagreed by factors of 1.5 to 3 and for one natural sediment the methods differed by a factor of 265. The consistency of these two measures of reduction capacity and the reason(s) for the observed discrepancy should be understood before a reliable method for estimating reductive capacity can be established as a predictor of the longevity of sediments to act as natural barriers to chromate migration.
303043

87
III. Elucidation of the identity of reactive constituents in the natural sediments responsible for chromate reduction. Identification of the Fe(n) mineral phases and/or NOM acting as electron donors, and understanding the role native bacteria play in chromate reduction either directly (respiration) or indirectiy as iron reducers is critical to defining the mechanisms of chromate reduction in natural sediments. Knowledge of the reactive phases is important because identification of the presence of these phases in 'other' sediments can be used to predict potential effectiveness of the 'other' sediments as a natural chromate reduction barrier without extensive characterization or the ' other' sediments. Selective chemical extraction methods combined with spectroscopic techniques, including ^Fe Mossbauer spectroscopy and election microscopy, will be used to identify reactive mineral phases. Reactive NOM phases will be examined with appropriate chemical extraction and spectroscopic techniques. The role bacteria may be playing will be examined primarily by including sterilized controls or controls containing bactericides.
1 . I rv. Simulation of chromate tiansport in the aquifer system with natural reduction. Given
a reasonably accurate description of flow in the Puchack aquifer system and measurements of natural chromate reduction in the different aquifer units (i.e., including I j clay lenses), the extent of chromate transport and reduction could be quantified. ' ^ Although the current study clearly demonstrated that natural sediments could reduce chromate, the extent of chromate reduction that would occur in the field depends on the •• flow hydrodynamics as well as the reduction processes. For example, most aquifer units " exhibited slow to no chromate reduction, but a clay lens exhibited a very rapid chromate reduction rate. Although little water flows through the clay lens, there may be sufficient surface contact of aquifer fluids to cause significant chromate reduction, if the clay lens is laterally continuous.
It /
U
303044

88
References Amonette, I.E.. 2002. Iron redox chemistry of clays and oxides: environmental
applications, in CMS Workshop Lectures, Vol 10, Electrochemical Properties of Qays, ed. A. Fitch, Qay and Qay Mineral Society, Aurora, Colorado, p .
Amonette, J. E., J. E. Szecsody, H. T. Schaef, J. C. Templeton, Y. A. Gorby, and J. S. Fruchter. 1994. "Abiotic Reduction of Aquifer Materials by Dithionite: A Promising In-Situ Remediation Technology." p. 851-881. In-Situ Remediation: Scientific Basis for Current and Future Technologies, G. W. Gee and N. R. Wing (eds.), Battelle Press, Coltmibus, Ohio.
Anderson, L.D., D.B. Kent, and J.A. Davis, Batch Experiments Characterizing the Reduction of Cr(VI) Using Suboxic Material from a Mildly Reducing Sand and Gravel Aquife, Environmental Science and Technology, 28 (1), 178-185, 1994.
Arnold, R.G., T.J. DiChristuia, and M.R. Hoffman. 1988. Reductive dissolution of Fe(in) oxides by Pseudomonas sp 200. Biotechnol. Bioeng. 32:1081-1096.
Bidoglio, G., P.N. Gibson, M. O'Gorman, and K.J. Roberts. 1993. X-ray absorption spectroscopy investigation of surface redox transformations of thallium and chromium on colloidal mineral oxides. Geochemica et Cosmochimica Acta. 57:2389-2394.
Bopp, L.H. and H.L. Ehrlich. 1988. Chromate resistance and reduction in Pseudomonas fluorescens sXxdL\x\LB2>00. Arch. Microbiol. 150:426-431.
Boursiquot, S., M. Mullet, and J Ehhrhardt. 2002. XPS sttidy of tiie reaction of chromium (VI) with mackinawite (FeS). Surface and Interface Analysis. 34:293-297.
Buerge, I.J., and S.J. Hug, Kinetics and pH Dependence of Chromium (VI) Reduction by Iron (HI), Environmental Science and Technology, 31, 1426-1432, 1997.
Buerge, I., and S. Hug, Influence of mineral surfaces on cliromium(VI) reduction by iron (n). Environmental Science and Technology, 33 (23), 4285-4291, 1999.
Bums, C.A., Boily J.-F., Crawford, R.J and Harding, I.H., 2005, Cd(n) sorption onto chemically modified Australian Coals. Fuel. 84,1653-1660.
Caccavo, F. Jr., Blakemore, R.P., Lovley, D.R. 1992. A Hydrogen Oxidizing, Fe(in)-Re;ducing Microorganism from the Great Bay Estuary, New Hampshire. Appl. Environ. Microbiol. 58:3211-3216.
303045

•••\
89
Camp, Dresser, and McGee (CDM) 2005. Operable Unit 1, Treatability Study Sample Collection Report, I*uchack Well Field Superfund Site, Remedial Investigation/Feasibility Study (RI/FS), Pennsauken Township, New Jersey. Work assignment No.: 102-RICO-02JL. \ i
Chao, T.T. and Zhou, L., 1983. Extiaction techniques for selective dissolution of ) amorphous iron oxides from soils and sediments. Soil Science Society of America, i Journal, 47: 225-232.
i Coleman, M.L., D.B. Hedrick, D.R. Lovley, D.C. White, and K. Pye. 1993. Reduction 1
of Fe(in) in sediments by sulphate-reducing bacteria. Nature. 361:436-438.
:' I Delavarenne, S., and H. Viehe. 1969. Chemistry of Acetylenes, Marcel Dekker, New '
York, p 651-750. 7
Deng, B. and A.T. Stone. 1996. Surface-catalyzed chromium(VI) reduction: Reactivity ' comparisons of different organic reductants and different oxide surfaces. Environ. Sci. Technol. 30:2484-2494. \ j
DiChristina, T.J. 1994. Bioextraction )reductive dissolution( of iron from low grade iron ^
ores. Ann. NY Acad Sci. 721:440 449. |
Eary, L.E., and D. Rai, Chromate removal from aqueous wastes by reduction with ferrous ion. Environmental Science and Technology, 22 (8), 972-977, 1988.
Fredrickson, J.K. and Y.A. Gorby. 1996. Environmental processes mediated by iron- ) reducing bacteria. Current Opinion in Biotechnol. 7:287-294. J
Fruchter, J., C. Cole, Williams, M., V. Vermeul,, J. Amonette, J. Szecsody, J. Istok and f j M. Humphrey, Creation of a Subsurface Permeable Treatment Barrier Using In Situ w J Redox Manipulation, 2000, Ground Water Monitoring Review, 1:66-77.
n Fude, L.,B. Harris, M.M. Urrita, and T.J. Beveridge. 1994. Reduction of Cr(VI) by a - ->
consortium of Sulfate Reducing Bacteria (SRB IE). Appl. Environ. Microbiol., 60(5)pl525-1531. 1
Gan, H., J.W. Stucki, and G.W. Bailey. 1992. Reduction of structural iron in ferruginous smectite by free radicals. Clays and Qay Minerals. 40(6):659-665. i
Genin, J., G. Bourrie, F. Trolard, M. Amdelmoula, A. Jaffrezic, P. Refait, V. Maitie, B. Humbert, and A. Herbillon. 1998. Thermodynamic Equilibria in Aqueous Suspensions of Synthetic and Natural Fe°-Fe™ Green Rusts: Occurrences of the Mineral in Hydromorphic Soils, Environ. Sci. Technol. 32:1058-1068.
Gibbs, C.R., 1976. Characterization and application of Ferrozine iron reagent as a ferrous iron indicator. Analytical Chemistry, 48(8): 1197-1200.
3 0 3 0 4 6

90
Heron, G., Crouzet, C, Bourg, A.C. and Christensen, T.H., 1994. Speciation of Fe(Il) and Fe(in) in contaminated aquifer sediments using chemical extraction techniques. Environmental Science and Technology, 28: 1698-1705.
Horitsu, H., S. Futo, Y. Miyazawa, S. Ogai, and K. Kawai. 1987. Enzymatic reduction of hexavalent chromium by hexavalent chromium tolerant Pseudomonas ambigua G-1. Agric. Biol. Chem. 51:2417-2420.
Ishibashi, Y., C. Cervantes, and S. SUver. 1990. Chromium reduction in Pseudomonas putida. Appl. Environ. Microbiol. 56:2268-2270.
Jardine, P.M., S.E. Fendorf, M.A. Mayes, LL. Larsen, S.C. Brooks, and W.B. Bailey, Fate and Transport of Hexavalent Chromium in Undisturbed Heterogeneous Soil, Environmental Science and Technology, 33 (17), 2939-2944, 1999.
Johnson, T., W. Fish, Y. Gorby, and P. Tratiiyek. 1998. Degradation of Carbon Tetrachloride: Complexation Effects on the Oxide Surface, J. Cont. Hyd. 29:379-398.
Kanachuk, O.V. 1995. Influence of hexavalent chromium on hydrogen sulfide formation by sulfate-reducing bacteria. Mikrobiologiya, 64(3), p315-319.
Kim, C, Q, Z, B, Deng, E. Thomton, and H, Xu. 2001. Chromium (VI) reduction by hydrogen sulfide in aqueous media: Stoichiometry and kinetics. Environ. Sci. Technol. 35:2219-2225.
Kostka, J.E. and K.H. Nealson. 1995. Dissolution and reduction of magnetite by bacteria. Environ. Sci. Technol. 29:2535-2540.
Lovley, D.R. 1991. Dissmiilatory Fe(III) and Mn(rV) reduction. Microbiol. Rev. 55:259-287.
Lovley, D.R. and E.J.P. Phillips. 1992. Reduction of uranium by Desulfovibrio desulfuricans. Appl. Environ. Microbiol. 58:850-856.
Lovley, D.R. 1994. Microbial reduction of iron, manganese, and other metals. In: Advances in Agronomy, Volume 54 (D.L. Sparks ed.). Academic Press, Inc. NY. pp. 175-231.
Lovley, D.R. and E.J.P. Phillips. 1987. Competitive mechanisms for inhibition of sulfate reduction and methane reduction in the zone of ferric iron reduction in sediments. Appl. Environ. Microbiol. 53:2636-2641.
Lovley, D.R. and E.J.P. Phillips. 1994. Reduction of chromate by Desulfovibrio vulgaris (Hildenborough) and its Cj cytochrome. Appl. Environ. Microbiol. 60:726-728.
303047

91
Loyaux-Lawniczak, S., P. Lecomte, and J. Ehrhardt, Behavior of Hexavalent Chromium in a Polluted Groundwater: Redox Processes and immobilization in Soils, Environmental Science and Technology, 35 (7), 1350-1357, 2001
Loyaux-Lawniczak, S., P. Refait, J.J. Ehrhardt, P. Lacomte, and J.R. Genin, Trapping of Cr by formation of ferrihydrite during the reduction of chromate ions by Fe(IO-Fe(in) hydroxysalt green msts. Environmental Science and Technology, 34 (3), 438-443, 2000.
Matsimaga, T., G. Karametaxas, H.R. von Gtmten, and P.C. Lichtner. 1993. Redox chemistry of iron and manganese minerals in river-recharged aquifers: A model interpretation of a column experiment. Geochemica et Cosmochimica Acta. 57:1691-1704.
Murphy, E., J. Schramke, J. Fredrickson, H. B.edsoe, A, Francis, D. Sklarew, J. Linehan, 1992, Infuence of microbial activity and sedimentary organic carbon on the isotope geochemistry of the Middendorf Aquifer, Water Resour. Res., 28(3), 723-740.
Nardi,S., Tosoni, M., Pizzeghello, D., Provenzano, M.R., Cilenti, A., SturaroA-, Rella, A., and Vianello, A. 2005, Chemical characteristics and biological activity of organic substances extracted from soils by root exudates. Soil Sci. Soc. Am. J. 69, 2012-2019.
Orth, W., and R. Gillham. 1996. Dechlorination of Trichloroethene in Aqueous Solution Using Fe°, Environ. Sci. Technol. 30(1):66-71.
Patterson, R.R. and S. Fendorf. 1997. Reduction of hexavalent chromium by amorphous iron sulfide. Environ. Sci. Technol. 31-2039-2044.
Roberts, A., L. Totten, W. Amold, D. Burris, and T. Campbell. 1996. Reductive Elimination of Chlorinated Ethylenes by Zero-Valent Metals, Environ. Sci. Technol. 30(8):2654-2659.
Roden, E.E. and J.M. Zachara. 1996. Microbial reduction of crystalline Fe(in) oxides: influence of oxide surface area and potential for cell growth. Environ. Sci. Technol. 30:1618-1628.
Sass, B.M., and D. Rai, Solubility of amorphous C3iromium(III)-Iron(in) hydroxide solid solutions. Inorganic Chemistry, 26 (14), 2228-2232, 1986.
Seaman, J.C, P.M. Bertsch, and L. Schwallie, In Situ Cr(VI) Reduction within Coarse-Textured, Oxide-Coated Soil and Aquifer Systems Using Fe(n) Solutions, Environmental Science and Technology, 33 (6), 938-944, 1999.
i.
I !i
303048

92
Scherer, M., B. Balko, and P. Tratiiyek. 1999. The Role of Oxides in Reduction Reactions at the Metal-Water Interface, in Kinetics and Mechanisms of Reactions at the Mineral/Water Interface, eds D. Sparks and T. Grundl, ACS Symposium Series #715, American Chemical Society, Atianta, Georgia, p 301-322.
Sivavec, T., and D. Homey. 1995. Reductive Dechlorination of Chlorinated Ethenes by Iron Metal and Iron Sulfide Minerals, in Emerging Technologies in Hazardous Waste Management VII, p. 42-45. American Chemical Society, Atianta, Georgia.
Sivavec, T., P. Mackenzie, D. Homey, and S. Baghel. 1996. Redox-Active Media for Permeable Reactive Barriers, research report. General Electric Research and Development Center, Schenectady, New York, p. 753-759.
Stumm, W., and J. Morgan, 1996, AqueousChemistry, third edition, J. Wiley and Sons, New York.
Szecsody, J. , Williams, M., J. Fmchter, V Vermeul, D. Sklarew, In Situ Reduction of Aquifer Sediments for Remediation: 1. Iron Reduction Mechanism, submitted to Environmental Science and Technology, July 2003
Szecsody, J., Fmchter, J. Vermeul, V.R., Williams, M., Devary, B., 2003 In Situ Reduction of Aquifer Sediments to Create a Permeable Reactive Barrier to Remediate Chromate: Bench-Scale Tests to Detennine Barrier Longevity, book chapter, J. Jacobs, ed.. Groundwater Remediation of Chromate. CRC Press, subrnitted, in review.
Thomton, E., J. Szecsody, K. Cantiell, C. Thompson, J. Evans, J. Fmchter, and A. Mitroshkov. 1998. Reductive Dechlorination of TCE by dithionite, in Physical, Chemical, and Thermal Technologies for Remediation of Chlorinated and Recalcitrant Compounds, ed. G. Wickromanayake and R. Hinchee, p. 335-340.
U.S. EPA, 1995, Determination of hexavalent chromium by ion chromatography. EPA 821/R/95/029; U.S. EPA Office of Water Engineering and Analysis Division, Washington, DC.
Wehrli, B. 1992. Redox Reactions of Metal Ions at Mineral Surfaces, in Aquatic Chemical Kinetics, ed. W. Stumm, Wiley Interscience, New York.
Vermeul, V.R., M. D. WilHams, J. E. Szecsody, J. S. Fmchter, C. R. Cole, J. E. Amonette, 2002, Creation of a Subsurfac in Groundwater Remediation of Trace Metals, Radionuclides, and Nutrients, with Permeable Reactive Barriers, Academic Press.
Viamajala, S., B.M. Peyton, W.A. Apel, and J.N. Petersen. 2002. Chromate reduction in Shewanella oneidensis MR-1 is an inducible process associated with anaerobic growtii. Biotechnol. Prog. 18:290-295.
3 0 3 0 4 9

93
Vitale, R., G. Mussoline, K. Rinehimer, K. Moeser, J. Petura, 2000, An evaluation of a technical holding tome for the preparation and analysis of hexavalent chromium in ] soils/sediments. Soils and Sediment Contamination, 9(3): 247-259. ; J
Walter, A.L., E.O. Frind, D.W. Blowes, C.J. Racek, and J.W. Molson. 1994. Modeling ;> of multicomponent reactive transport in groundwater 2. Metal mobihty in aquifers ' impacted by acid mine drainage. Wat. Resour. Res. 30(11), p3149-3158.
M Widdel, F. 1988. Microbiology and ecology of sulfate- and sidfur-reducing bacteria. In: • '
Biology of Anaerobic Microorganisms (A.J.B. Zehnder ed.). John Wiley and Sons, Inc., NY. pp. 469-586. ' }
Zachara, J., Girvin, D., Schmidt, R., Resch, C, 1987, Chromate adsorption on amorphous iron oxyhydroxide in the presence of major groundwater ions. Environ. Sci Technol., 21, 589-594. • '
Zachara, J., Ainsworth,C.., Cowan,C., Resch, C, 1989, Adsorption of chromate by f subsurface soil horizons. Soil Science Society of America, Journal, 53: 418-428.
J]
....]
303050

94
Appendix A. Physical Characterization of Puchack Sediments
0.001
Grain Size Distribution, Puchacic Sed. Core MW-36S-B 109' bgs, Sieve
silt , sand , gravel
0.1 grain size (mm)
Grain Size Distribution, Puchacic Sed. Core l\/IW-36S-D 156' bgs, Sieve+Hydrometer
silt sand , gravel
0.1 gram size (mm)
3 0 3 0 5 1

95
0.001
Grain Size Distribution, Puchacl( Sed. Core [\/IW-36S-E 163' bgs, Sieve+Hydrometer
silt sand , gravel
0.1 grain size (mm)
Grain Size Distribution, Puchack Sed. Core IVIW-36S-F 168' bgs, Sieve+Hydrometer
•i n n
n an u.ou
o> c Jo HI n R n (IS a c o 'S n Ar\-\ O U.4U n
n on
O.C
clay
01
-«*4 —r-TT
Silt
0.01
1 ->
0..1 .
^ /
san
. ^ '
d
/
/
1
/
;
/
/
{
i
1
!
i
gravel
/ * •
10
j
"
~
"
-
i:.l
0
grain sizie (mm)
3 0 3 0 5 2

96
• « M ra a .c
u ra
Grain Size Distribution, Puchack Sed. Core IVIW-36S-[ 196' bgs. Sieve
1 n n J
n on
M n en
2. c o 'S n Ar\
5
n 9n
n nn O.C
clay
101
1
1
, , i ^ ' ' *
0.01
JL 0..1 .
1
1 i
1
san
1 1 d ,
V fl
•l
^ ' H gravel
10
"
-
-
-
.
grain size (mm)
Grain Size Distribution, Puchack Sed. Core l\/IW-36S-K 206' bgs, Sieve+Hydrometer
clay silt sand gravel
0.1 grain size (mm)
303053

97
0.001
O) _c 'm (0 re a. c .2 's u ra
Grain Size Distribution, Puchack Sed. Core IVIW-36S-IVI 221'bgs. Sieve
silt sand , gravel
0.001
0.1 grain size (mm)
Grain Size Distribution, Puchack Sed. Core i\/IW-36S-P 254' bgs, Sieve
clay silt sand gravel
0.01 0.1 gram sizie (mm)
303054

98
1.00
0.80
I 0 ra a c o n
60-
40
0.20-
0.00-
clay
0.001
Grain Size Distribution, Puchack Sed. Core IVIW-37S-C 162.5' bgs, Sieve+Hydrometer
«•!•
silt
0.01 0.1 gram size (mm)
n gravel •*—*r
10
Grain Size Distribution, Puchack Sed. Core 1VIW-37S-E 168' bgs. Sieve
1 n n -
n sn
S) c m n Rn 2 U.OU ra Q. C O <M n A H
ra
n on
n nn O.C
clay
1
j
1
1 1
01
silt
0.01
/
V 0..1
/
f
sar
j O
f Id
P U-
i
!
j
1
'
^
i
1
i 1
j
gravel
10
i
-
-
;
-
•
grain size (mm)
303055

99
clay
0.001
Grain Size Distribution, Puchack Sed. Core l\/IW-37S-F 171.5' bgs, Sieve+Hydrometer
silt sand , gravel
0.001
0.1 grain size (mm)
Grain Size Distribution, Puchack Sed. Core IVIW-37S-G 190.5' bgs, Sieve+Hydrometer
silt sand , gravel
0.01 0.1 gram size (mm) 10
•
u
303056

100
1.00-
0.80-
(0 0 ra a c o •^ n ra
.60-
40
0.20-
0.00-
clay
Grain Size Distribution, Puchack Sed. Core IVIW-37S-G 191' bgs. Sieve
1 n n J
n Bn
"35 in n Rn w u.ou
s. J c o 'S n yin O U.4U ra i :
n on
n nn_j U.UUq
O.C
clay
01
i
silt
0.01 J ' 1 0..1 .
/
/
/
/
san
^ <
d
' • ^
-
- ..-< •-H"
i
1
i
gravel
10
u
-
:
-
"
0.001
grain size (mm)
Grain Size Distribution, Puchack Sed. Core MW-37S-L 217' bgs, Sieve+Hydrometer
silt sand
«»< I i •
0.01 0.1 gram size (mm)
gravel
10
303057

101
0.001
Grain Size Distribution, Puchack Sed. Core D1S-H 220'bgs, Sieve
silt sand , gravel
0.1 grain size (mm)
Grain Size Distribution, Puchack Sed. Core D1S-J 240" bgs, Sieve+Hydrometer
-1 n n
n ar\ U.oU
TO
»2 n Rr\ m u.bU
c o i *J n An •g U.4U-1
2 j n o n U.^U^
0.00-o.c
clay
i
1—1
01 1—1
1 ' I
- 4 ^ '—j—rr
silt
•rfj ^ D.01
^ 1—1
1— "Ml i l l k^
0..1 .
/
A 1
san
" \
I \ 1 1
d
1/ 1
• |
r ^ ^ 1 ' '
\ i 1
i
1 ^ 1 i
i ! i
i
1—H-T
gravel
10 r ""
\
1—1
_
"
•
-
-
i]
•
l..j
grain size (mm)
303058
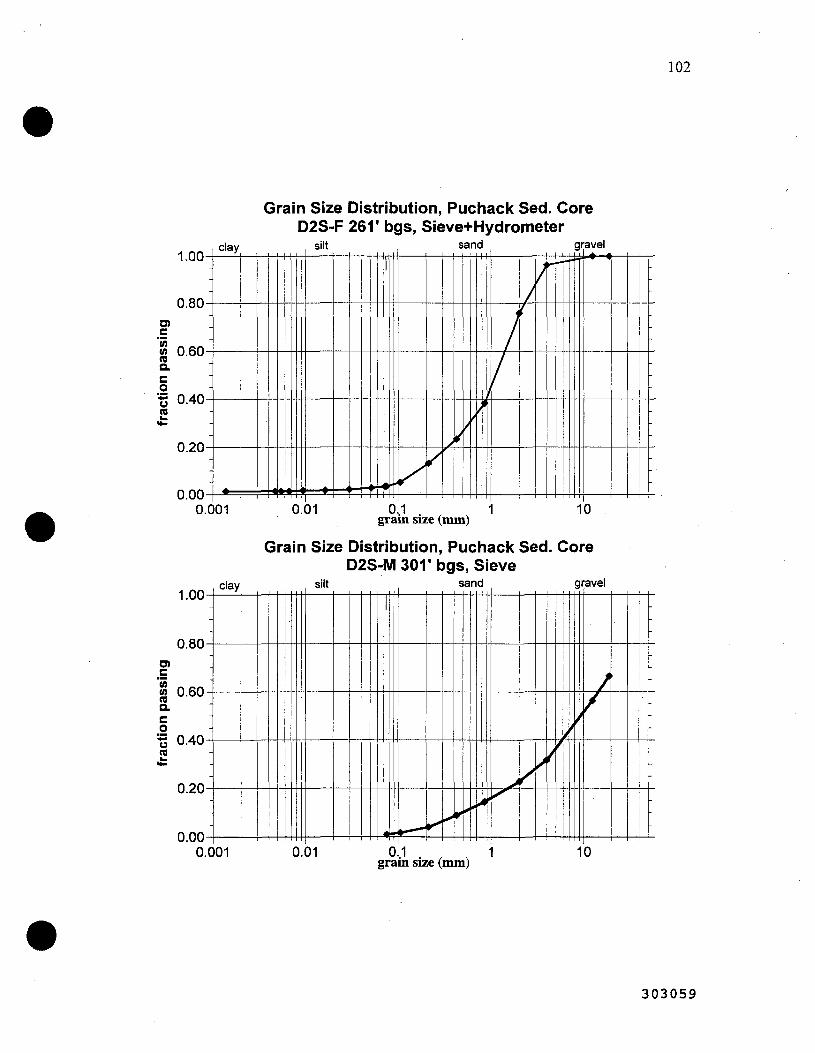
102
Grain Size Distribution, Puchack Sed. Core D2S-F 261' bgs, Sieve+Hydrometer
1 nn-1
n a n U.OU
TO
M n e n (0 U.oU ra J Q. c o -\ '*S n An O U-4U ra
•»-
n o n U.^U
0.00^ O.C
clay
01
-4#^
silt
• i - > • • •
0.01
—4 - H - i 0..1 .
/
>
san d
/ /
1
/ ^ (
/
1
gravel
- • — — 1
10
:
-
-
-
•
grain size (mm)
Grain Size Distribution, Puchack Sed. Core D2S-IVI301'bgs. Sieve
clay silt sand gravel
0.1 grain size (mm)
303059

Appendix B: Chromate Adsorption to Natural Sediments
103
10'
lO'H
10"
Chromate Sorption Isotherm, pH 5.6, Puchack Deep Composite
Langmuir-FreundUch
S= M(KC)
M = 6 K = L4 n = 0.85
Langmuir: S = M = 6 1+KC K = 3
soil/water = 0.25 g/cm3 Puchack deep composite 2
MKC
- I — I — I I 1 1 1 - 1 — I I 1 1 1 1 1 I I I I I 1 — I — I I 1 1 1 1
10" 10" 10-' C (umol/mL)
10" 10'
303060

104
120
100
€ 2 60 •n
*° 40
20-
0
Chromate Adsorption Edge
aa. » - . • - • m-.—• • _»
" • ' •
Dl water rsw = 0.5 g/ml
(CrOJi = 9.6 uM Deep Composit 1 24 h contact lime
J 4 5 6 7 8 9
Final pH
100^
% A
dso
rbed
.1
o>
oo
o
o o
20^
0-
Chromate Adsorption versus pH
4------^--:^;::---A*
18 h 3 h
' A " • • • - .
Puchack Deep Composite ' ^ ^
— 1 — 1 — 1 — 1 — 1 — 1 — 1 — 1 — 1 — 1 — 1 — 1 — 1 — 1 — 1 — 1 — 1 — 1 — 1 — 1 — 1 — 1 — 1 — 1 —
pH
303061

105
11.0 T
10.0
E 9.0 a _a
ci i 8.0
7.0
6.0
5.0
E 2 t
^ 1 . 6 a
O 1.4
Effect of S04 on Cr(VI) analysis
• ...„--.„„.....„...,..„..,. — „ „ „ „., ,.,,,„„.„,.„„„ ,. ,.....„ ,. — „ ,
0.1 0.5 1 5 10 S04 cone (ppm) in lO-ppm-Cr(VI) samples
25 50
inf luence of Sulfate on Adsorpt ion Kd
pH 6.3, rsw =0.5 g/ml
(CrO,), = 9.6 uM
Deep Composit 2 Dl water
y = -0.3G77Ln(x) +3.1098
R' = 0.9772
200 250 300 Sulfate Concentration (uM)
/IT'T
303062

106
Affect of Sulfate on Chromate Adsorpt ion
o 50
= 45
pH 6.3. rsw =0.5 g/ml
(C(0,)- = 9.6 uM Deep Composit 2
Dl water
y = -4.242Ln(x) + 64.488
R= = 0.9434
200 250 300 Sulfate Concentration (uM)
Change in Chromate Adsorpt ion wi th Time
OK
20
n XI
<
% C
hro
mate
in
o
0
c.
1 — pHSsynGW |--s--pH8DI water i -A pH4synGW i - e - p H 4 D I water
/ .^^"*--.<'''^'*'' < a . . . A ' -•-•»
4 ^
0.0 5.0 10.0 15.0 20.0
Time (h)
rsw = 0.25 g/ml (CrO.K = 0.19 mM Deep Composit 1
O
.. ..- a — - A
• • • •
25.0 30.0
3 0 3 0 6 3

107
10.0
9
8.5
8
7.5
7
1.6.5
6
5.5
5
4.5
Potential Effect of Filter Pore Size
fsw-=-ft25-g^nt~
pH 8 syn GW pH 8 Dl water pH 4 syn GW pH 4 01 water Samples
pH Variat ion Dur ing Chromate App roach to Adso rp t i on Equ i l ib ra t ion
li ft
o
0.0 5.0 10.0 15.0 20.0 Time (h)
•
25.0
• pH8 Dl water D pH 8 syn GW ApH 4 syn GW OpH4 DI water
rsw = 0.25 g/ml (CrO4)T = 0.19mM Deep Composit 1
30.0
303064

108
Appendix C. Chromate Reduction by Natural Attenuation
Chromate Natural Reduction with No 02 (U30) 6.0-
t4.0H
^3.0H ra
E , 2 2.0: " l . ( ^
sediment: j deep composite 2
0.0-
rate: L = 0.00027/ii half life 2567 h
-1—I I I I n i l 1—I I l l l l l l 1—I I I I n i l 1—I I l l l l l l 1—I I I I I I I
0.1 10 100 1000 10' time (h)
Chromate Natural Reduction with No 02 (U31)
-^5.0-
^ 3 . 0 ^ ra s
0 2.0^
" l . ( ^ 0.0-
sediment: nrs1, well D2, 271.5', dark clay
rate: L = 0.014/h half life 49.5 h
I 111111|
0.1 1 "T 1 I I 1111 1 I I r n 111
10 100 time (h)
1000
303065

109
Chromate Natural Reduction with No 0 2 (U32) 6.0-
sedlment: nrs2
^ 5 . 0 -_ j
| 4 . & ^
ro
§ 2 0^ rate: L = 0.00024/h •c = half life 2900 h
1.0:
0.0 T—I I 11 i i i | 1—I I I I n i j 1—I I l l l l l l 1—I I I I i i i | 1—I I I I I I I
0.1 1 10 100 1000 10' time (h)
Chromate Natural Reduction with No 02 (U33) 6.0n
^ 5 . 0 -- j
| 4 . o :
| 3 . 0 ^ ra E
0 2.0:
" l .o :
0.0.
sediment: nrs 3
rate: L = 0.00024/h half life 2900 h
T—I M I I III 1—FT T r m | 1—I I l l l l l l 1—rT-rmTi 1—i i i i
0.1 1 10 100 1000 10 time (h)
303066

110
Chromate Natural Reduction w/02 (U34)
1*2.0-]
ra E P I.OH
sediment: nrsi, well D2, 271.5', dark clay
J rate: L = 0.052/h half life 13.3 h
— 1 — I — 1 1 1 1 i i |
0.1 1 I i l l l l l l " " " r ' I I
10 time (h)
T—I I I I I 11 ^
1000
Chromate Natural Reduction w/02 (U35)
0)
ra E P I .
O.a
sediment nrs 3
rate: L = 0.00087/h half life 797 h
1—I I I I n i j 1—I I I I n i l 1—I I I I i i i | 1—I I I I n i l V i i i i Ml
0.1 1 10 100 1000 10' time (h)
3 0 3 0 6 7

I l l
Chromate Natural Reduction w/02 (U36) 2.0-
ro E o •gO.5-
0.0
sediment: nrsi, well D2, 271.5', dark clay
rate: L = 0.015/h half life 46.2 h - 1 — I 1 1 1 1 i i | — I — I 1 1 1 1 1 I j — I — I I I
0.1 1 10 100 time (h)
I T M i l l
1000
Chromate Natural Reduction w/02 (U37) 2.0
o
ts 1.0-ra E o
0.5-
O.O
sediment: nrs 3
rate: L = 0.00077/h half life 900 h
I I I n i l 1—I I l l l l l l 1—I I l l l l l l
10 100 time (h)
u
.. J
3 0 3 0 6 8

112
Chromate Natural Reduction with No O
O.4.0-
a> <-> re E o 2.0-
0.0
Cr = 5.5 mg/L rsw = 0.09g/mL
- e — D C 2, 2570 h - • — N R S 1,49.5 h . ^ — N R S 2, 2900 h ^G>—NRS3, 2900h
0.8-*^ re E o
U • o
N re 0 .4 -
0.6-
re E o c 0 .2 -
0.0-0.1
- | 1 I I I M l j 1 1 I I I l l l | 1 1 I I I I l l | T 1 I I | W | | > > I I I I I I I
0.1 1 10 100 1000 10 t ime (h)
Chromate Natural Reduction w/02 high reductive capacity sed. NRS3
exp. U31,34,36
r =0 .09 g/mL SW
• 0 / C r = 1.7:1 2
• 0 / C r = 2.8:1 2
n I M i l I I n M|
10 time (h)
100 1000
303069

Chromate Natural Reduction w/O
113
i.o-O-
0) re E o
u •o 0)
"re E I -o c
0.5-
low reductive capacity sed. NRS3
exp. U33,35,37
r = 0.09 g/mL SW
-A-
0.0-0.1
0 /Cr= 1.7:1 2
— < ^ 0 / C r = 2.8:1 2
-1 1—I I 1 I M| 1 1—I I I I l l j 1 1 I I I I I I j 1 1—I I M 111
1 10 100 1000 time (h)
0
303070

114
Puchack Sed., Nat. Red. Cap, 1-D flow, MW-36C151' bgs
U50: Dissolved Oxygen Column, Probe 1
20-
1 , 0 -a> >. K O
8.99PVx34.16cm •'/PVx1.05umol/cm
Q= 6.28 h/PV
' )f1/78.6g=4.10uiTiol Fg/g[^ ^ ^ i
-\ 1 1 1 1 r
5
Q= 16.67 h/PV —I 1 1 1 1 1 1 1 r 10 PV 15
- 0 . 5 S ni 10 c Ol X o
20
30-
U50: Dissolved Oxygen Standards, Probe 2 9.47PV x34.16cm ^/PV x1.05umol/cm ^ x1/78.6g=4.32umol Fe/g
- 0 . 5 =
O) >. X o
U50: Dissolved Oxygen Standards, Probe 1
20-
| , 0 H a t >. X
-e—e-
o o
o o
M = 1/[sat-free] = 00417 b=-[free*M] = 00242
o o
o oo^ oonnuUooOUoou"o° " " ' ^
- 0 5
O O j -Q—9—e—e—e—o ooooooooooooo" t^oooooog-Q
- | — I — I — I — I — I — I — I —
5 10 PV - | — I — I — I — I — | -
15 20
c o
c
X o
30-U50: Dissolved Oxygen Standards, Probe 2
-.^20-> E
1 0 - "
0-
o o
o o o
-0—°—o O o U U o ° ° ° " ° ° o a ° ° ° ° ° ° ' ^
.o ° o-
M = 1/(sat-free] = 00399 b=-(free*M] =-0.0212
,uooooooo°o"^°Qom3o uoooo
T 1 1 r "1—'—'—'—'—r ~ 1 p
-0.5 2 ra V) c a> O) >< X o
10 PV 15 20
303071

115
Puchack Sed., Nat. Red. Cap., 1-D flow, MW-371199' bgs
U51: Dissolved Oxygen Column, Probe 1
30-
- . 2 0 -> E
at >« X o
10-
10.75PV x24.6cm ^/PV x1.05umol/cm ^ x1/108.60g=2.56umol Fe/g
Q= 0.49 h/PV .Q=10,4.h/.PV.
30-
— I I I I I ] I - - ] I I
0 10 20 30 PV 40 50
U51: Dissolved Oxygen Column, Probe 2
60
>r20-
c
gioH X o
12.82PV x24.6cm ' /PV x1.05umol/cm ' x1/108.60ci=3.05umol Fe/g
30-
_ 2 0 -> E
a> Dl >» X o
30-
5r20-
c
«10-X o
.Q= 0.49 h/PV Q= 104 h/PV
T T —r 50
0 10 20 30 PV 40
U51: Dissolved Oxygen Standards, Probe 1
" T " 60
-0.5 5 ra CO c a> o> >< X o
70
- 0 . 5 ra to c at X o
70
ancJP
M = 1/[sat-free] = 00418 b=-[free*M] = -0.0065
o
•0.5 3
Qtonrga 3ggP
ra U) c 0> a t > • X o
T T ~i ' r 30 PV 40
—r 50
0 10 20 30 PV 40 50 60
U51: Dissolved Oxygen Standards, Probe 2
70
« 8 ^
M = 1/[sat-free] = 00406 b=-{free*M] =-0.0512
•0.5
10
%nmrmmTrm"rnm-
a> at
o
20 30 PV 40 "1 ' r 50 60 70
303072

116
Puchack Sed., Nat. Red. Cap., 1-D flow, D-2E 211' bgs U53: Dissolved Oxygen Column, Probe 1
5 PV 10 15
100 time(h) 150
U53: Dissolved Oxygen Column, Probe 2 0 5 PV 10 15
J I I I I L
1 ' r 100 time(h) 150
30-
U53: Dissolved Oxygen Standards, Probe 1 0 5 PV 10 15
I I I 1 I I I I I I I I I I I
-..>20-> E
10-
o . o o o
o o o o
o o o ° ° ° - S - Q o o o o Q ° o o O o ° °
o o o o
O O O O CI e -e-&-
M = 1/[sat-free] = 0.0438 c|?=-[free*M] = -0.0232
° n o 0-2 o
re
•0.5 3 re in c 0) en X
o 50
~ l ' T " 100 tlme(h) 150
U53: Dissolved Oxygen Standards, Probe 2 0 5 PV 10
20-
> •
g 10-O) >< X
o
I I I I
-9-e-o n O -tr O O P
I 200
15 O L) O 'OI
° o o o o ° o
O o .2 ra
- 0 . 5 5 M = 1/[sat-free] = 0.0458 b=-[ free*M] = -0.0604
" r ' r"' r— o e o o ° o o o o o o o o o o o
50 T
100 tlme(h) 150
ra en c 0) D> >« X
o 200
303073
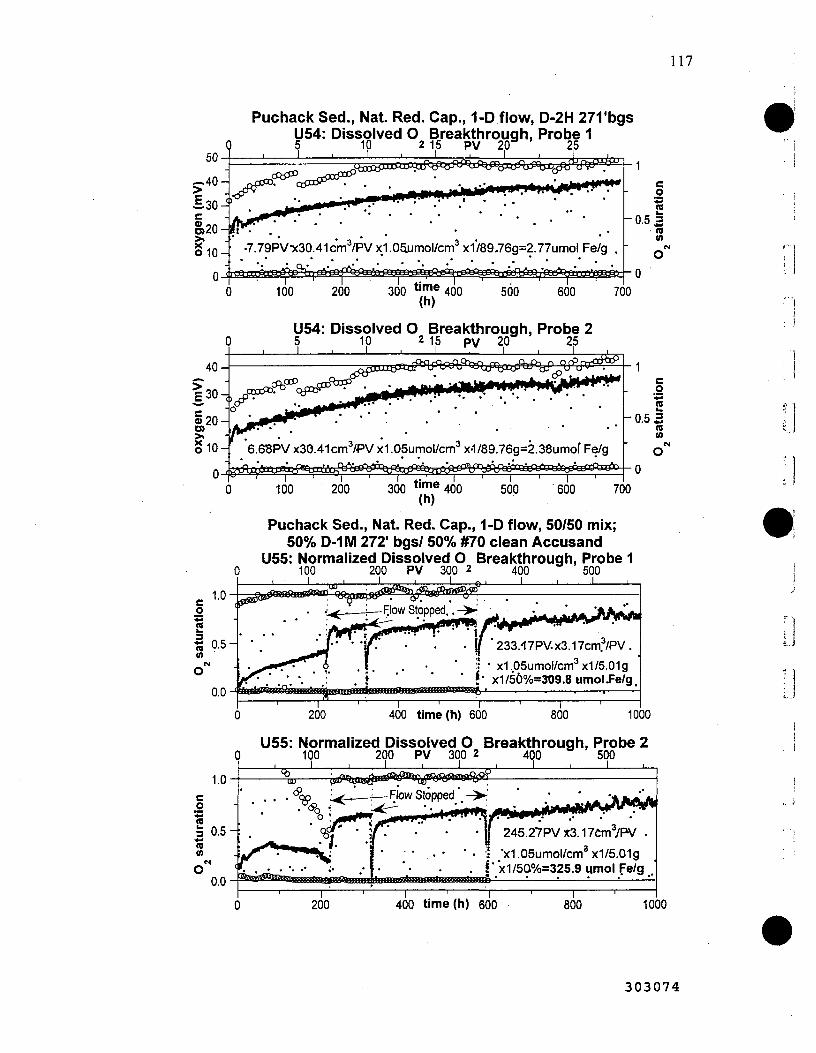
117
50-
|20H
o 10
0-f^ 0
Puchack Sed., Nat. Red. Cap., 1-D flow, D-2H 271'bgs U54: Dissolved O Breakthrough, Probe 1 5 10 2 15 PV 2 0 " 25 J I I I I I . J ,
^4BCCtPUIlP^U?JJ^^^f^^
•7.79PV-x30.41cm^/PVx1.05umol/cnn^x1/89-76g=2.77umol Fe/g .
oa^aa i ( \D^
1
o5'cQfl"Uftn5arfxrf tXBgigft iCTc^^ - Q
100 200 300 *''"®400 500 600 700 (h)
U54: Dissolved O Breakthrough, Probe 2 5 10 2 15 PV 20 25
_ l I I I \ I I I i _
6.68PV x30.41cm^/PV x1 .Opumol/cm^ x-1/89.76g=2.38umof Fe/g
100 200 300 *''"® 400 (h)
c o
ra -0.5 5
re 10
500 600 700
Puchack Sed., Nat. Red. Cap., 1-D flow, 50/50 mix; 50% D-1M 272' bgs/ 50% #70 clean Accusand
U55: Normalized Dissolved O Breakthrough, Probe 1 0 100 200 PV 300 2 400 500
i _ I , „ . I , I - B ^ I _J e-J \ I I L_ 1 0 - cf^fjsmsaassmia q s ^ a p i B 0 j 5 0 « ' ^ ^ ^ ^ $ < ^ ^
f;low Stopped.,
fSsmMttitmi^mgigiifnMkftMttniatmmmwimWtinmnrfj
233.-17PV.x3.17cmf/PV.
x1.05umol/cm^ x1/5.01g *• x1/50%=309.8umolPe/g.
200 400 time(h) 600 800 1000
U55: Normalized Dissolved O Breakthrough, Probe 2 0 100 200 PV 300 2 400 500
I 1 I I I , I I I i
245.27PVx3.17Cm7PV .
•x1.05umol/cm' x1/5.01g •x1/5a%=325.9 umol Fe/g .
400 t ime(h) 600 800 1000
3 0 3 0 7 4

118
Fe Extraction on Untreated Puchack Sed.
DCB(U38) Amm. Oxalate (U39) 5.0M HCl (U40) 0.5MHCI(U41)
Sediment Core
MW-36C MW-371 D1-H D1-M D2-E D2-H
FE(II) (|imol/g) 696.24 93.90
202.17 246.90 100.29 99.83
FE(III) (|unol/g) 1069.86 -16.25 -2.13 73.18 -16.43 -11.16
FE(II) (|imol/g) 1288.24
3.64 10.35
237.08 2.90 6.01
FE{III) (|unol/g) 528.94 2.17 6.11
25.00 0.87 3.32
FE(II) (|imol/g) 631.04 14.92 16.15 8.37
30.54 9.62
FE(III) (umol/g) 244.92 41.34 66.71 22.15 22.30 39.57
FE(ll) (|imol/g)
1.20 5.65
20.04 3.64 4.79 0.65
Fe Extractions on Red. Puchack Sed.
S.OM HCl (U40) 0.5MHCI(U41)
Sediment Core
MW-36C MW^36F MW-361 MW-36M MW-37C MW37F MW-371 Dl-H D2-H
FE(II) (^mol/g)
7.04 21.53 35.32 2.15 2.23 2.39 2.26 2.75 1.16
FE(III) ()tmol/g) 535.06
7.47 5.29
26.72 44.32 39.51 37.48 142.65 63.21
FE(II) (|imol/g) 1209.40 41.84 63.82 27.08 52.68 40.20 172.39 71.23 50.23
3 0 3 0 7 5

119
30-
^ 2.0-
Ul 1 6 Chromate Transport in Puchack Sediments, pH 4.8, 3.85
o - J "3) E 1.0-
oo-p
n n ° • "nnx n
a inject 2.7 mg/L for 155 pv
D
pH 4.83 ± 0.70
Kd = 6.58
D
^ -D
D
pH 3.85 ± 0.24 Rf = 18.75 Kd = 3.22
° g D D D n D n -^ 1 ' 1 ' r
50 100 150 200 250 300
Pore Volumes 350
2.0-
O -J
I* i.oi
Ul 17 Chromate Transport in Puchack Sediment, pH 5.7 I \ I I 1 I I I i _
inject 2.0 mg/L for 19.6 pv
pH = 5.86 + 0.67
Rf>20
o . Q i p a D i a a q D a a D D n
10
• • n a p a n , n a ^ n a 20 30 Pore Volumes
40
400
50
f l
iJ
303076

120
Ul 18 Chromate Transport in Puchack Sediments, pH 7.0 , \ I I t i I I i _
2.0-
>
5» 1.0-
inject 2.0 mg/L for 20 pv
Rf = 16.5 Kd = 2.82 D
D n n
D
n 00 [p D D i D D—|-
0 10
D pH 6.97 ± 0.39
D D
D n • •
-B r D D
20 30 Pore Volumes
40 50
U119 Chromate Transport in Puchack Sediments, pH 6.4 I I I I I . I . I .
^ 2.0 i >
O _ l
"I 1.0 i
inject 2.0 mg/L for 2.3 pv pH = 6.43 ±0.36
Rf>3
0.0-p C J D D i D D i D D p D a D q D D i D — p a mnii q 1
Pore Volumes
303077

121
Chromate Natural Reduction with No 02 1.0-
0.8-
o 5^0.5^ o
0.3^
0.0-
sediment: composite, unit A2a
adsorption (18%) degradation rate: L = 6.5E-5/h half life 10,700 h - I — I I l l l l l l — I — I I l l l l l l — I — I 1 1 1 i i i | - I — I I l l l l l l — I — I 1 1 1 1 I I
0.1 1 10 100 1000 10" time (h)
Chromate Natural Reduction with No 02 1.0-
0.8-1
o ^0 .5^ O
0.3-]
O.O
# • •
sediment: composite, unit A2b
no adsorption no degradation
in 3000 h
0.1 - I 1 I I I l l l | 1 1 I I I l l l | 1 1 I I I l l l j 1 1 I M l l l | 1 1 I I I I I I
1 10 100 1000 10^ time (h)
303078

122
Chromate Natural Reduction with No 02 1.0-
0.8H
o ^ 0 . 5 ^ o
0.3-
O.Q
sediment: composite, unit C2AI
adsorption (10%)
degradation rate: L = 2.5E-5/h half life 27,700 h
- 1 — I 111 i i i |
0.1 1 T T T T T T ] I I I I I I I I I I I r n M'TI I I I I I I I I
10 100 1000 10^ time (h)
Chromate Natural Reduction with No 02 1.0-
0.8-
o Sao.5-O
0.3-
O.O
sediment: composite, unit A3b
adsorption (5%) degradation rate: L = 2.5E-5/h half life 27,700 h - I 1 I I I M l j 1 1 I I I M l | 1 1 I I I l l l | 1 1 I I I l l l | 1 1 I I I I I I
0.1 1 10 100 1000 10^ time (h)
303079

123
Chromate Natural Reduction with No 02 1.0-
0.8-
o J^O.5-O
0.3-
0.0
sediment: composite, unit A3a
adsorption (18%)
no degradation
T 1 I I I l l l j 1 1 I 11 l l l j 1 1 I I I l l l j 1 1 11 I l l l j 1 I I I I
0.1 1 10 100 1000 10 time (h)
Chromate Natural Reduction with No 02 i.o
0.8-
o yo.5H o
0.3-
sediment: composite, unit A3c
adsorption (20%)
no degradation
0 . 0 — I — I — I 111 l l l j — I — I I 11 l l l j — I — I 111 l l l j — I — I 111 l l l j — I — I 111 III
0.1 1 10 100 1000 10" time (h)
.J
i.j
303080

124
Chromate Natural Reduction with No 02 i.o
o ^ 0 . 5 O
- sediment: ^'^~] composite
MW36+37 A2a,A2b,A2AI, A3a, A3b, A3c
0.3-
O.O
adsorption (10%)
no degradation (3000 h)
-1 1 I l l l l l l 1 1 I I I l l l | 1 1 I I I I I I ! 1 I I I l l l l j 1 1 I I I I I I
0.1 1 10 100 1000 10" t ime (h)
Kd vs pH for Deep Composite 2 From Ads Edge Fig 4.3-4
pr(tot) = 0.5 mg/L (9.6 uM) rsw = 0.5 (5 g sed,10 ml)
• 18 h batch j • 3 h batch 1 O 8.2 h column f
Power (18 h batch) \ — - Power (3 h batch) j
Kd(18h) = 6E+13x-'="^'|
R^= 0.9301
K (3h) = 1E+07x' ' ^ i
R' = 0.9301 pH
303081

125
1.4-
0) o c .a k.
o (0
<
Base Soluble Component of NRS-1
1000
4000 3500 3000 2500 2000., 1500 Wavenumber (cm )
1000
Chromate Removal with Puchack Sediment NRS-1
- 10«-
O 10-
10 -3
NRS-1 first-order fit: half-life = 0.20 h (L=3.4/h)
NRS-1 Base Treated first-order fit: half-life = 0.17 h{L=4.1/h)
-1 1 1 1 I M
0.1 100 t(h)
303082

126
Appendix D. Sediment Reductive Capacity
Puchack Sed.; Lab Reduced, MW-36C 151' bgs U1: Dissolved O Column, Probe 1
20-
500 _L
PV 1000 _ J I I I
1500 L
1122.4PVx2.141cm7PV v^ / ^ -I x1.05umol/cm x'>/6.718g=375.6utnol Fe/g
£.10-
_o re
1-0.5 3 +.» m (fl
0
0
200 400 t ime(h) 600
20-1
£.10-
_i I I i_
U l : Dissolved O Column. Probe 2 500 2 PV 10(30
800
1500
1207.4PVx2.141cm7PV
x1.05umor/cm\l/6.718g=404.0umol Fe/g
. •• • ,w\
0 - - ^
•v/ V - 0 . 5 !
•1 c o
re (0
200 400 t ime(h) 600 800
20-
0 - i
0
0
20-
I IOH
Puchack Sed.; Lab Reduced, D-1H 220.5' bgs U16: Dissolved O Column, Probe 1 200 400 2pv 600 800 1000
_j I I \ L I I I I I •
361.62PVx1.241cm7PV
x1.05umol/cm x1/Q.057g=58:49umol Fe/g
100 t ime(h) 200 300
U16: Dissolved O Standards, Probe 1 200 400 2 PV6C0 800
I I , 1 . I ' oonoooO»nnoouo"u°^o ' ^ "eOoOo O O Q ' ^ O O " ' ' " " ' " " ' ' ' " -o"~"o
•1 c o
re •0.5 =
re (0
1000
M = 1/[sat-free] = 0.0422 b=-[free*M] = 0.011
0-(DOOOOOOOOOOOOO^OOOOOOOQOOOOOOOOOOOOOOOOO O"
—1 ' f— 100 t ime(h) 200
c o
re - 0 . 5 =
re m
300
303083

127
Puchack Sed.; Lab Reduced, MW-361197.5' bgs U4: Dissolved O Column, Probe 1
0 100 PV2 200 300 30-
97.57PV*1.612cm^/PV*1.05umol/cm^*1/7.399g=22.32umol Fe/g
V5?«fly»ft«f*e**'>W' •1 . 2
re
3
•0.5S o
I ' I ' I ' I '
60 time(h) 100 120 140
n
U4: Dissolved O Column, Probe 2 100 PV 2 200 300
J I I I I L
60 time(h) 100
re 3
-0.5«
• J
Fl
U4: Dissolved O Standards, Probe 1 100 PV 2 200 300
30
> 2 ^ E,
o IOH
o o
o o
- D © O --«—o—0—g-
M = 1/[sat-free] = 0.0495 b=-(free*M]o=-0.156 O ° o °
0
0
20 40 60 time(h) 100
•1 . 2 re
3
^0.5S o
120 140
30-
5:2aH
o 10H
U4: Dissolved O Standards, Probe 2 100 PV 2 200 300
I I 1 I I L.
o o o o o o o o O
M = 1/[sat-free] = 0.0503 b=-[free*M] = -0.207
_0 Q_ - e — o — & - _o Q_ - o — s -
20 40 60 1 ' T"
time(h) 100
•1 . 2 * re 3
-0 .5« (0
120 140
I . : )
303084

128
20-
^10-1
Puchack Sed.; Lab Reduced, MW-37C 154' bgs U8: Dissolved O Column, Probe 1
300 400 2 pyj 500 600 _J < I I L I I > \
. (54.04Py + 255.2PV)x1.737cm7PV
x1.05umol/cm^ x1/7.061g=79.88umoi Fe/g
' c o
• • s
• 0 . 5 |
^ n — ' 1 — ' — I — ' — I ' — 1 ' — 1 ' — I — ' — I 120 140 160 180 time(h) 220 240 260
300
20-
-§.iaH
•fru " o o ° ° ° 20-
§-10-1
0-"^
U8: D isso lved O C o l u m n , Probe 2 400 PV 500 600
.(59.15PV + 255.2PV) x1.737cm7PV
x1.05umol/cm^ x1/7!061g=81.20umon=e/g
c o
re ho.5|
(0
1 I 1 I I j I I 1 I 1 I 1
120 140 160 180 time(h) 220 240 260
U8: D isso lved O S tanda rds , Probe 1 300 400 2 PV 500 600
" 5 — O 55—O-
M = 1/[sat-free] = 0.0514 b=-[free*M] = 4).162
o o - 2 Q Q_
120 140 160 — I I I I I
180 time(h) 220
•1 c .2 re
ho.sl (A
- 0
240 260
20-
•§•10-1
US: Dissolved O Standards, Probe 2 300 400 2 PV 500 600 _J > I , L \ , L_ .jQ Q Q-
M = 1/Isat-free] = 0.0500 b=-[free*l\/!] =-0.145 .
- e — e - - 0 Q Q_
—' 1 ' !— 120 140 160
c o
n
(0
180 time(h) 220 240 260
303085

129
Puchack Sed . ; Lab Reduced , D-1B 106' b g s U13: D i sso lved O C o l u m n , P robe 1
0 200 PV 2 400 600
20-
201.99PVx1.29cm^/PV
x1.05umol/cm^ x1/7.719g=35.44umol Fe/g
~ \ — ' — r 20 40
- 1 ' 1 ' 1 1 \ 1 \ 1 1 —
60 time(h) 100 120 140 160
re 3 re
-0.5 «
U13: D i sso lved O C o l u m n , P robe 2 200 pv 2 400 600
J < I I I I . I . I
395.80PVx1.29cm7PV
x1.05umol/cm x1/7.719g=69.45umol Fe/g —I < 1 . 1 1 1 , 1 1 1 1 1 1 1 —
20 40 60 time(h) 100 120 140 160
c _o re
(0
o
20^ >
£icH
0^;^
U13: Dissolved O Standards, Probe 1 200 PV 2 400 600
I I I I I _L _L
O Standards datalogging failed,
standards recorded and averaged at experiment end
M = 1/Isat-free] = 0.0515 b=-[free*IVI] = -0.002
<^1
\ ' I ' \ ' I ' I ' \ I I ' I 0 20 40 60 time(h) 100 120 140 160
c .0 '.a re 3
• J
.5(0
^ 0
20^ >
§10-1
U13: D i sso lved O S tandards , P robe 2 200 PV 2 400 600
I i , I ^ ' ^ i I I \ I I I
l\/l = 1/[sat-free] = 0.0652 b=-[free*IVI] = -0.299
i y ^
— I — I — I — I — I — I — I — I — I — \ — I — I — , — I — I — I —
0 20 40 60 time(h) 100 120 140 160
c o
- 0 5 -^re
<5-0
3 0 3 0 8 6
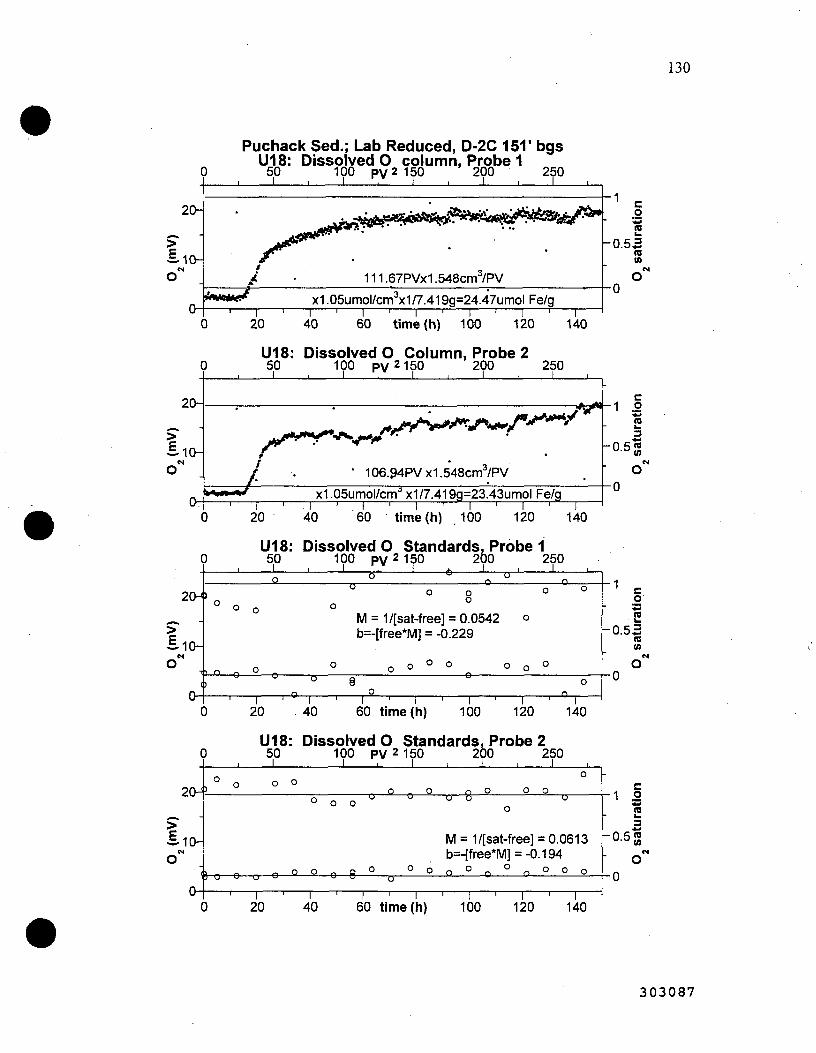
130
20-
•§-10-1
Puchack Sed.; Lab Reduced, D-2C 151' bgs U18: Dissolved O column. Probe 1
50 100 p v 2 150 200 250
t^fCi^^f!^
111.67PVx1.548cm7PV
x1.05umol/cm x1/7.419g=24.47umol Fe/g "I ' — I — ' — I ' r
20 40 60 t lme(h) 100 120 140
c .2 '.ss re
•0.55 re to
20-
> §10-1
U18: Dissolved O Column, Probe 2 50 100 p v 2 150 200 250
I I I L I I . I > L _
* , ^ i f ^ ^ J ^ ' ^ / * ' ^ ^ ^ ^ - 1 o
' . • 106.94PVx1.548cm^/PV
x1 •05umol/cm x1/7.419g=23.43umol Fe/g "I ' r
20 40 60 t ime(h) .100 120 140
re
-O.5I
20-<>
§.10H
U18: Dissolved O Standards, Probe 1 50 100 P V 2 150 200 250 I I I L I I * I _ j L_
M = 1/Isat-free] = 0.0542 b=-[free*M] = -0.229
o O
0
0
1 ^ 20 40
~ i ' — r -60 t ime(h) 100 120 140
20-il
§ 1 0 H
U18: Dissolved O Standards, Probe 2 50 100 PV 2 150 200 250
I ^ I I I X I ^ L_ o o
_o o o o
SH3—e- Q ° o 8
M = 1/Isat-free] = 0.0613 b=-[free*M] =-0.194
° O n ° ^ ° n O O o
- | ^ \ ^ 1 ^ 1 1 1 20 40 60 t ime{h) 100 120 140
c 0
"re
-0 .53 re (0
1 .2 (0
h 0 . 5 |
3 0 3 0 8 7

Appendix E. Chromate Transport and Reduction
131
U123 Chromate Transport in Reduced Sediment at pH 7.0 1.00-
o o o
0.75-
0.50^
0.25-
0.00-
reductive capacity = ** pv ** pv, no chromate breakthrough porosity = 0.33, pv = 2.30 mL bulk density 8.33 h/pv
r I I 1 11 r 1 I P T ~ r T T T T l l B r I ' l l ] '
half life 2.7 h
I M j I I I 1 I IT"
0 50 100 150 200 250 300 350 400 450 pore volumes
U122 Chromate Transport in Reduced Sediment at pH 6.2 1.00-
o O o
0.75-
0.50-
0.25-
0.00-
reductive capacity = ** pv ** pv, no chromate breakthrough porosity = 0.405, pv = 4.77 mL bulk density 1.735 8.74 h/pv half life
3.8 h
^ • T T T I I l l l l l l 1 ^ I I I 1^1 I [ I I ' • ! I r p T T T ^ P l I I I I I H i ^ T T l 1 I I ! I I I I I I I I I ] I M 1 I 1 TT
0 50 100 150 200 250 300 350 400 450 pore volumes
..)
303088

132
U121 Chromate Transport in Reduced Sediment at pH 5.3 1.00-
0.75^ o 5 0.50-
o 0.25-
0.00-
reductive capacity = ** pv ** pv, no chromate breakthrough porosity = 0.405, pv = 4.77 mL bulk density 1.735 half life 8.74 h/pv 5.5 h
50 100 150 200 250 300 350 400 450 pore volumes
U120 Chromate Transport in Reduced Sediment at pH 4.5 1.00-
0.75^ o ^ 0.50-o
0.25-
0.00-
reductive capacity = 300 pv 170 pv, no chromate breakthrough porosity = 0.390, pv = 4.6 mL half life bulk density 1.616 8.32 h 8.52 pv/h half life
half life ^'^ ^ 2.2 h
- W\ i"]~iTi I @^ 11 11 I 1 ^ 11 1111 'w I 11 11 1111111 111 11 I 11 11 11111 11 11 11 11 I 111111 IT
0 50 100 150 200 250 300 350 400 450 pore volumes
303089

133
250:
J200-3 "3)
E^15(>^
= 100^
"- 50^ 4 * ^ 0
80-
- . 6 0 -O)
^ 4 o :
£20-
0- -mh
0
5.0-
3 4.0-
| 3 . 0 ^
^ 2.0-
Ferrous Iron Elution during Chromate Transport in Reduced Sediment, pH 4.5
total Fe(ll) in column: 54.5 umol/g x 19.0 g = 1.04 mmol Fe(ll)
Fe(ll) eluded: 0.0374 mmol Fe(ll) or3.6%oftotalFe(ll)
-1 \ •-•••l^ ^ ' 1 < • « I 1 1 >M< I
5.0
J 4.0^1 "5) E 3.0-
50 100 pore volumes
150 200
Ferrous Iron Elution during Chromate Transport in Reduced Sediment, pH 5.3
total Fe(ll) in column: 62.2 umol/g x 20.4 g = 1.27 mmol Fe(ll)
Fe(ll) eluded: 0.0162 mmol Fe(ll) or1.3%oftotalFe(ll)
• I I I—<!••», 1 r- -«M*-50 100
pore volumes 150
" 1
200
Ferrous Iron Elution during Chromate Transport in Reduced Sediment, pH 6.2
total Fe(ll) in column: 106 umol/g x 19.8 g = 2.10 mmol Fe(ll)
Fe(ll) eluded: 0.0034 mmol Fe(ll) _or0.16%oftotalFe(ll)
r » - r
100 pore volumes
150 200 L.)
Ferrous Iron Elution during Chromate Transport in Reduced Sediment, pH 7.0
total Fe(ll) in column: 84.8 umol/g x 11.7 g = 0.992 mmol Fe(ll)
Fe(ll) eluded: 0.0035 mmol Fe(ll) or 0.35% of total
100 pore volumes
. I
. J
200
303090

134
25000^
_2000(H
3 0)15000^
'roiooooy 5000-
- • — pH 4.5 V — pH 5.3 TAT— pH 6.2
-A— pH 7.0
4 ^ I I I I I I I y I I I I I I I I I I I I I I I I I I I I I I I I I I I I I I I I I I I
0 100 200 300 400 500 600 pore volumes
Mercury Mobilization During Oxidation
- • pH 4.5 ^ 7 — pH 5.3 -A— pH 6.2 -C"— pH 7.0
unreported values < 12 ng/L
-r—I—I—r-z : ^
10 pore v o l u m e s
100
350
10 100 pore volumes
4 — pH 4.5 pH5.3 pH6.2
I I I I I I I I I I J K I I I I I ' ' ' I IAI I I I A ^ 200 300 400 500 600
pore volumes
303091

135
5
"5) 3-E ^ 2-u.
U
Iron (ll+lll) Mobilization During Oxidation, pH 7.0 total Fe(ll) in column: 106 umol/g x 30.3 g
= 3.21 mmol Fe(ll) Fe(ll) eluded: 0.0475 mmol Fe(ll)
or1.5%oftotalFe(ll)
H r f l I 1 I I T ^ l I I I ~ 1 [ 1 " I I I I T "
100 200 300 400 pore volumes
500 600
"3) 3-E
LL
1-
Iron (ll+lll) Mobilization During Oxidation, pH 6.2 total Fe(ll) in column: 106 umol/g x 30.3
= 3.21 mmol Fe(ll) Fe(ll) eluded: 0.0475 mmol Fe(ll)
or 1.5% of total Fe(lI)
- t»» I i < r
0 , ' ' ' I ' ' ' ' I ' ' ' ' I '
100 200 300 400 pore volumes
500
. )
600
g 0)
CD
Iron (ll+lll) Mobilization During Oxidation, pH 5.3
ol/g X 27.9 g
Fe(ll) eluded: 0.181 mmol Fe(ll) or 10.5% of total Fe(ll)
200 300 400 pore volumes
500
n Li
600
200 300 400 pore volumes
600
303092
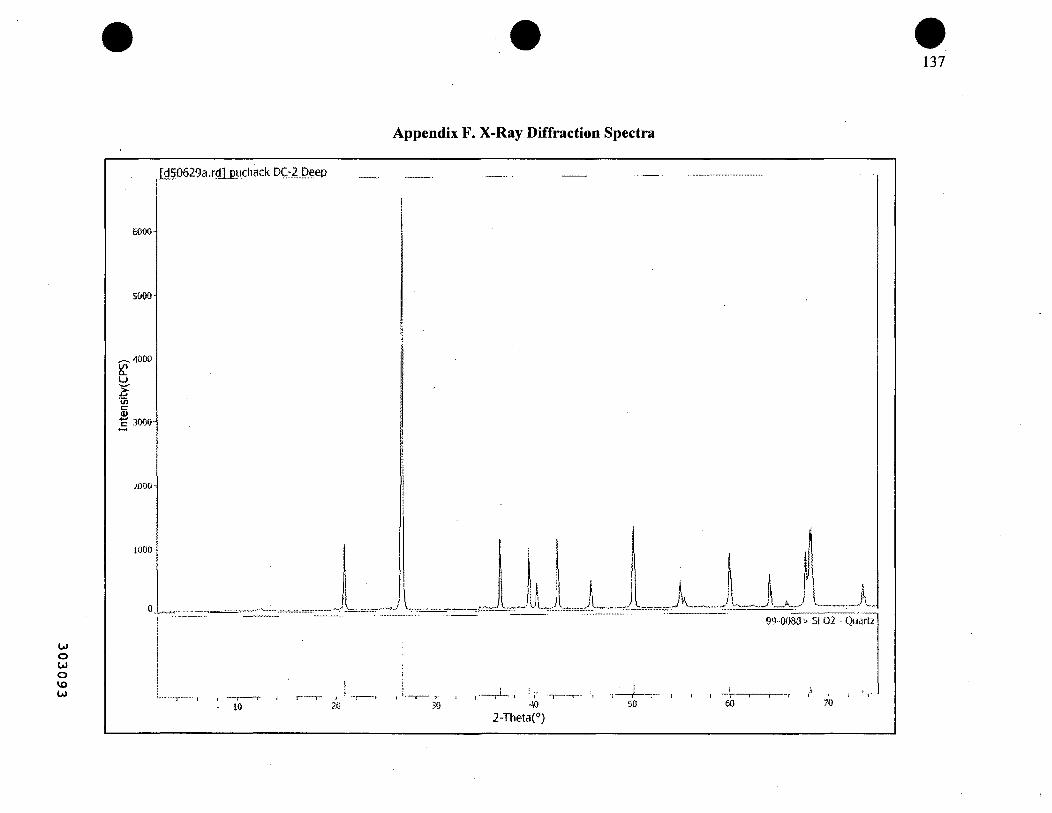
Appendix F. X-Ray Diffraction Spectra
137
o o VO CJ
6000-
5000-
u
, 4000
j . (>r .m-
1000
j;d50629a,rdljpuchack DC:2..Deep
u ..-..7 i_
- T . - I I 1 - I
._i L.i. Jl..,.. ...../ ..A... 1 JI 99 0083 > SI 02 (Jiuirtz
10 2fJ 30 'iO
l-ThetaC)
_ j . _ . j —1 [ r t
60 70

138
[Cl50720}.rd] NRS-1 DIM 272 3S^
40«)-
3500
3000
2500
IO
^ 12000
77-1060:- Si02 - Silicon oxide - $-alph<i
.l.!;Ofi-
1000
. 00
-1 1 1 I — ) 1
10
A.A 40
•r I . f < — •\ t r
50 60
LJ •s..
70
2-Theta(«)

# 139
OJ o OJ o Ul
10.0
8.0
t/l a.
I
4.0
2.0
xlO"
[cl5p714n.rcl] Bio Pachack NRS-2 MW
.J.. I ! " • • " • " I • " • • ; ' I r • I
X ^.A..,i|l ._.. 10 20 30
— 1 r — • • : •
2-Theta('')
. j \ \ . . . . . J l . 50
<:)90088> Si 02. •• Quailz
• A ...l....^ A.,..,.(....,-'i I - „ , . A . . ^ J 1 — ^ I ^ ,.jl J 1 ..
60 70
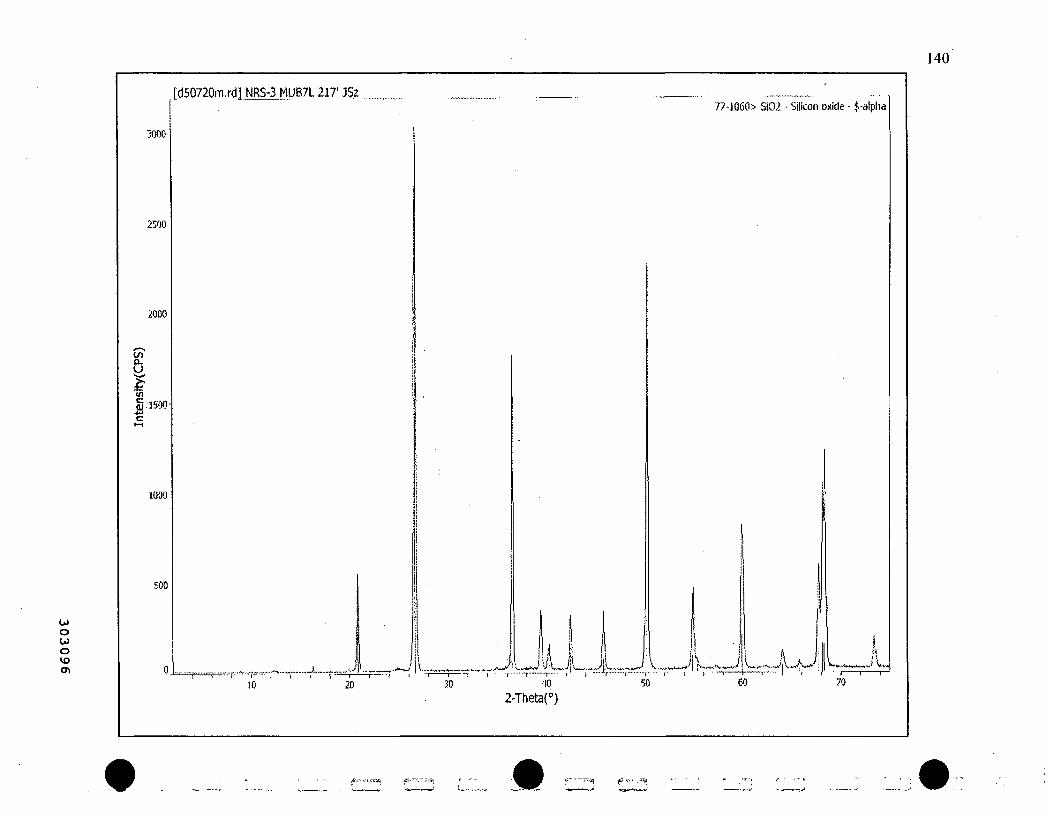
140
OJ o OJ o
3000
fcl50720m.rdl NRS-3 MUB7L 217' JSz 77-1060> SI02 - Silicon oxide - $-alpha
2S00
2000
u
(ft
S isoo
1000
.500
>..-.. . , L i ~ - ^ ,jy: „.„....„K.-.w.. J j V»- ' - -J
i
10 20 30 40
2-Theta(<') 60 70

141
Appendix G. Growth Media for Biotic Studies
Iron Reducing Medium with 10 mM Fe(III)NTA: per liter NaHCOs KCl NH4CI NaH2P04 Yeast extract * Wolfe's vitamin solution **Wolfe's mineral solution Sodium lactate Sodium pyruvate Sodium acetate
2.5 g 0.1 g 1.5 g 0.6 g 1.0 g 10 ml 10 ml lOmM 10 mM 10 mM
Equilibrate medium under mixture gas of N2/CO2 (80:20 v/v), dispense 10 ml per Balsch tube under same gas phase, stopper with butyl rubber closures, crimp seal, and autoclave. Introduce ***Fe(Iir)NTA solution to autoclaved medium using anaerobic technique.
*Wolfe's vitamin solution: ] Biotin Folic acid Pyridoxine HCl Thiamine HC Riboflavin Nicotinic acid Calcium D-(-H)pantothenate Vitamin B12 P-aminobenzoic acid Thioctic acid
**Wolfe's mineral solution: Nitrilotriacetic acid MgS04.7H20 MnS04. H2O NaCl FeS04.7H20 C0CI2.6H2O CaCl2 ZnS04.7H20 CUSO4.5H2O A1K(S04)2.12H20 H3BO3 Na2Mo04.2H20
per liter 2.0 mg 2.0 mg 10.0 mg 5.0 mg 5.0 mg 5.0 mg 5.0 mg 0.1 mg 5.0 mg 5.0 mg
: per liter 1.5 g 3.0 g 0.5 g 1.0 g 0.1 g 0.1 g 0.1 g 0.1 g 0.01 g 0.01 g 0.01 g 0.01 g
***Fe(III)NTA solution: for 100 mM Fe(in)NTA, dissolve 1.64 g of NaHCOs in -80 ml water. Add 2.56 g trisodiumnitrilotriacetic acid. Add 2.7 g FeCl3.6H20. Bring the solution up to 100 ml, sparge the solution with N2, and filter sterilize.
303097

142
.Sulfate Reducing Medium: per liter KH2P04 NH4C1 CaS04 MgS04.7H2O Yeast extract Ascorbic acid Thioglycolic acid feS04 .7H2O *Vitamin solution Ethanol Sodium acetate Sodium lactate
0.5 g 1.0 g 1.0 g 2.0 g 1.0 g 0.1 g 0.1 g 0.5 g 1.0 ml lOmM lOmM 10 mM
pH to between 7 and 7.5
* Vitamin solution: per 100 ml Biotin Folicin B6 (HCl) Riboflavin Thiamine (HCl) Pantothenic acid Nicotinamide B12 PABA Lipoic acid
0.002 g 0.002 g 0.01 g 0.01 g 0.01 g 0.005 g 0.005 g 0.01 g 0.005 g 0.006 g
i J
303098

143
Phosphate-Buffered-Saline: per liter Na2HP04 .7H2O 2.22 g NaH2P04 .H2O 0.223 g NaCl 8.5 g pH to 7.0
Table 4.7-1 Puchack Sediment Cores Selected f( Station
Location MW-36S-C
MW-37S-A
MW-36S-D
MW-37S-G
MW-37S-H
MW-36S-J
MW-37S-J
MW-37S-K
Hydrogeologic Layer (a)
C-2A1
C-2A1
C-2A1
A-3a
A-3a
A-3a
A-3a
A-3a
Depth, ft 151.5 to 152
153.5 to 154
159 to 159.5
190 to 190.5
194 to 194.5
201 to 201.5
204 to 204.5
210.5 to 211
)r Micro PNNL ID #
5
1
3
6
2
7
4
8
>iology Studies (sorted 1 Sediment
Description Yellow clay w. Ught gray sand Light gray sand
Light gray silty sand
Light gray fine sand
. Beige clay
Whitish silty fine sand
Beige clay
Pale white clay & small gravels
pH 5.6
6.4
6.8
7.1
5.5
6.8
5.4
5.5
jy depth) %
moisture(b) 14.5
21.1
12.4
18.3
17.9
17.3
19.3
15.7
(a) C-2Al=Intennediate Sand, A-3a=Lower Aqixifer, upper zone (b) dry weight base
3 0 3 0 9 9

144
Table 4.7-2. Summary of ERB Enumeration and Enrichment Results (sorted by depth)
Sample ID MW-36S-C
C-2A1 MW-37S-A
C-2A1 MW-36S-D
C-2A1 MW-37S-G
A-3a MW-37S-H
A-3a MW-36S-J
A-3a MW-37S-J
A-3a MW-37S-K
A-3a
Depth, ft 151.5 to
152 153.5 to
154 159 to 159.5 190 to 190.5 194 to 194.5 201 to 201.5 204 to 204.5
210.5 to 211
PNNL ID #
5
1
3
6
2
7
4
8
Treatment
lg(a)
+/+
- / -
- / -
-l-f-/-H-
+/+
-/+
+1+
+1+
10^-^gto lOA-7 g (b)
not done
- /- /- /- / -
not done
not done
- / - / - / - / -
not done
not done
not done
Positive Control: Ig-Hlow cells = +/++
+/+
+/+
-i~l-/-l~l-
++/+
+/-
+1+ -
+I++
Positive Control: lg-1-med. Cells ^'>
+1+
- /++
+/+
++I++
+1+
++I-
+I++
++I+
Positive Control: Ig-fhigh ceUs " +/++
+/+
+1+
++I++
+I++
+I++
++I++
+/+
Growth assessment: high growth: -i~l-, medium growth: •+, no growth: -(a) 1 g sediments per 10 ml IRB medium, 2 repUcates, 4 weeks incubation (b) MPN, 5 replicates per each of 5 dilutions, 2 replicates per sediments tested, 6 weeks incubation (c) 1 g sediment plus 2E-I-3 cells (G.metallireducens) per 10 ml IRB medium, 2 repUcates, 4 weeks incubation (d) 1 g sediment plus 2E+5 cells (G.metallireducens) per 10 ml IRB medium, 2 repUcates, 4 weeks incubation (e) 1 g sediment plus 2E-I-7 cells (G.metallireducens) per 10 ml IRB medium, 2 repUcates, 4 weeks incubation
3 0 3 1 0 0
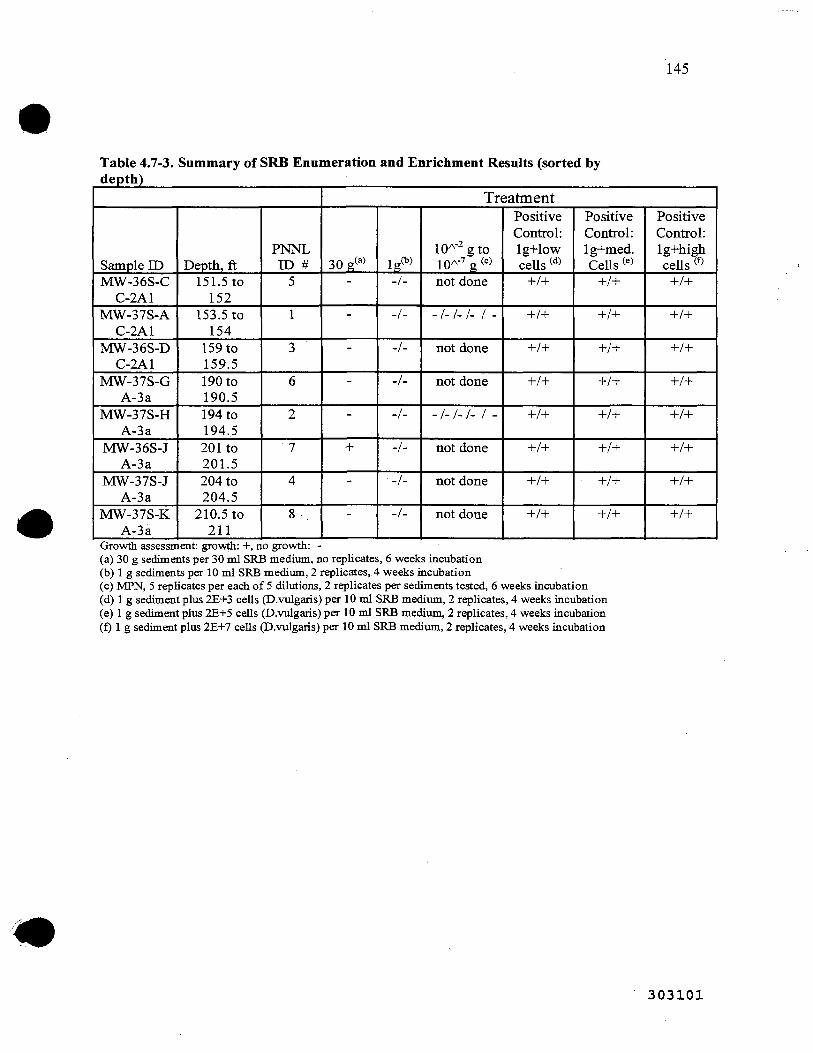
145
Table 4.7-3. depth)
Summary of SRB Enumeration and Enrichment Results (sorted by
Sample ID MW-36S-C
C-2A1 MW-37S-A
C-2A1 MW-36S-D
C-2A1 MW-37S-G
A-3a MW-37S-H
A-3a MW-36S-J
A-3a MW-37S-J
A-3a MW-37S-K
A-3a
Depth, ft 151.5 to
152 153.5 to
154 159 to 159.5 190 to 190.5 194 to 194.5 201 to 201.5 204 to 204.5
210.5 to 211
PNNL ID #
5
1
3
6
2
7
4
8
Treatment
30 e^ -
-
-
-
-
+
-
-
ipw -/-
-/-
-/-
-/-
-/-
-/-
• - / -
-/-
lO^-^gto lOA-7 g (c)
not done
- / - / - / - / -
not done
not done
- / - / - / - / -
not done
not done
not done
Positive Control: Ig-i-low cells "
+1+
+/+
+1+
+1+
-H/+
+/+
+1+
+/+
Positive Control: Ig-i-med. CeUs '
+1+
+/+
+/+
+1+
+/+
+/+
+/+
+/+
Positive Control: Ig-f-high ceUs ® +/+
+1+
+1+
+1+
+1+
+/+
-H/-h
-H/+
Growth assessment: growth: -I-, no growth: -(a) 30 g sediments per 30 ml SRB medium, no repUcates, 6 weeks incubation (b) 1 g sediments per 10 ml SRB medium, 2 replicates, 4 weeks incubation (c) MPN, 5 repUcates per each of 5 dilutions, 2 replicates per sediments tested, 6 weeks incubation (d) 1 g sediment plus 2E+3 ceUs (D.vulgaris) per 10 ml SRB medium, 2 replicates, 4 weeks incubation (e) 1 g sediment plus 2E-i-5 cells (D.vulgaris) per 10 ml SRB medium, 2 replicates, 4 weeks incubation (f) 1 g sediment plus 2E^-7 cells (D.vulgaris) per 10 ml SRB medium, 2 replicates, 4 weeks incubation
3 0 3 1 0 1