final fianl phase iii soil vapor extraction treatability study
TRANSCRIPT

November 2006
Phase III Soil Vapor ExtractionTreatability Study Report
Parcel B
Fianl
Hunters Point Naval ShipyardSan Francisco, California
Contract No. N68711-02-D-8203Delivery Order CT003Project No. 02-307.01
November 2006
Prepared for:
2730 Shadelands Drive, Suite 100Walnut Creek, California 94598
Phase III Soil Vapor ExtractionTreatability Study Report
Parcel B
Final
Hunters Point Naval ShipyardSan Francisco, California
Contract No. N68711-02-D-8303Delivery Order CT003Project No. 02-307.01
Prepared by:
Final Parcel B Phase III Soil Vapor Extraction Treatability Study R
eport
November2006
November2006
November2006
Final Parcel B Phase III Soil Vapor Extraction Treatability Study R
eport
Final Parcel B Phase III Soil Vapor Extraction Treatability Study R
eport
Base Realignment and ClosureProgram Management Office West1455 Frazee Road, Suite 900San Diego, California 92108

FINAL PHASE III SOIL VAPOR EXTRACTION TREATABILITY STUDY REPORT Building 123, IR-10, Parcel B Hunters Point Shipyard San Francisco, California Prepared For: Department of the Navy Base Realignment and Closure Program Management Office West 1455 Frazee Road, Suite 900 San Diego, California 92108 Prepared Under: Naval Facilities Engineering Command Southwest Contract Number N68711-02-D-8303 Contract Task Order CTO-003 Prepared By: Innovative Technical Solutions, Inc. 2730 Shadelands Drive, Suite 100 Walnut Creek, California 94598 November 2006 ITSI Project No. 02-307.01

Final Phase III Soil Vapor Extraction Treatability Study Report Building 123, Parcel B
Hunters Point Shipyard, San Francisco, California
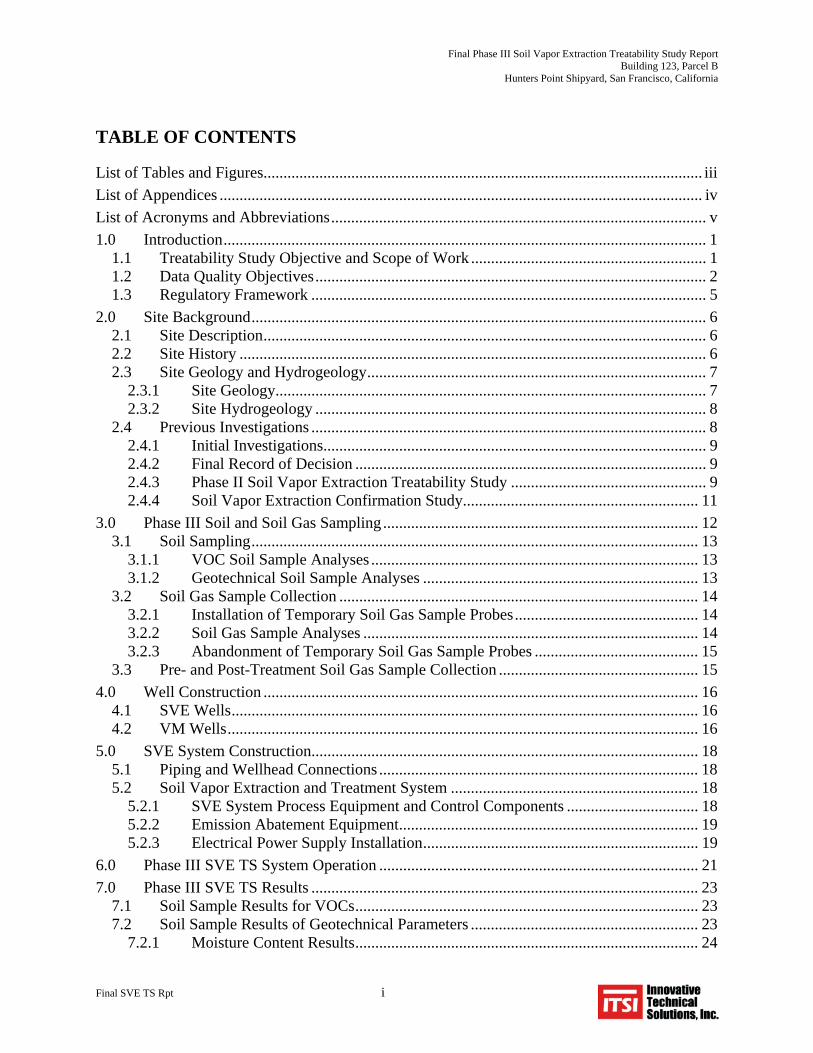
TABLE OF CONTENTS
List of Tables and Figures.............................................................................................................. iii List of Appendices ......................................................................................................................... iv List of Acronyms and Abbreviations.............................................................................................. v 1.0 Introduction......................................................................................................................... 1
1.1 Treatability Study Objective and Scope of Work ........................................................... 1 1.2 Data Quality Objectives.................................................................................................. 2 1.3 Regulatory Framework ................................................................................................... 5
2.0 Site Background.................................................................................................................. 6 2.1 Site Description............................................................................................................... 6 2.2 Site History ..................................................................................................................... 6 2.3 Site Geology and Hydrogeology..................................................................................... 7
2.3.1 Site Geology............................................................................................................ 7 2.3.2 Site Hydrogeology .................................................................................................. 8
2.4 Previous Investigations ................................................................................................... 8 2.4.1 Initial Investigations................................................................................................ 9 2.4.2 Final Record of Decision ........................................................................................ 9 2.4.3 Phase II Soil Vapor Extraction Treatability Study ................................................. 9 2.4.4 Soil Vapor Extraction Confirmation Study........................................................... 11
3.0 Phase III Soil and Soil Gas Sampling ............................................................................... 12 3.1 Soil Sampling................................................................................................................ 13
3.1.1 VOC Soil Sample Analyses .................................................................................. 13 3.1.2 Geotechnical Soil Sample Analyses ..................................................................... 13
3.2 Soil Gas Sample Collection .......................................................................................... 14 3.2.1 Installation of Temporary Soil Gas Sample Probes.............................................. 14 3.2.2 Soil Gas Sample Analyses .................................................................................... 14 3.2.3 Abandonment of Temporary Soil Gas Sample Probes ......................................... 15
3.3 Pre- and Post-Treatment Soil Gas Sample Collection .................................................. 15 4.0 Well Construction ............................................................................................................. 16
4.1 SVE Wells..................................................................................................................... 16 4.2 VM Wells...................................................................................................................... 16
5.0 SVE System Construction................................................................................................. 18 5.1 Piping and Wellhead Connections ................................................................................ 18 5.2 Soil Vapor Extraction and Treatment System .............................................................. 18
5.2.1 SVE System Process Equipment and Control Components ................................. 18 5.2.2 Emission Abatement Equipment........................................................................... 19 5.2.3 Electrical Power Supply Installation..................................................................... 19
6.0 Phase III SVE TS System Operation ................................................................................ 21 7.0 Phase III SVE TS Results ................................................................................................. 23
7.1 Soil Sample Results for VOCs...................................................................................... 23 7.2 Soil Sample Results of Geotechnical Parameters ......................................................... 23
7.2.1 Moisture Content Results...................................................................................... 24
Final SVE TS Rpt i

Final Phase III Soil Vapor Extraction Treatability Study Report Building 123, Parcel B
Hunters Point Shipyard, San Francisco, California
7.2.2 Total Organic Carbon Soil Sample Results .......................................................... 24 7.2.3 Bulk Density Results............................................................................................. 24 7.2.4 Specific Gravity Results ....................................................................................... 24 7.2.5 Hydraulic Conductivity Results............................................................................ 24
7.3 Soil Gas Sample Results ............................................................................................... 25 7.3.1 Temporary Soil Gas Sample Probes ..................................................................... 25 7.3.2 PID Monitoring of SVE System ........................................................................... 25 7.3.3 PID Monitoring at SVE Wells .............................................................................. 26 7.3.4 Laboratory Results of SVE System Performance Monitoring.............................. 26 7.3.5 Pre- and Post-Treatment Soil Gas Sampling Results............................................ 27
8.0 Phase III SVE TS Data Evaluation ................................................................................... 28 8.1 SVE System Yield ........................................................................................................ 28
8.1.1 System Yield Based on Individual Extraction Well Monitoring with PID .......... 28 8.1.2 System Yield Based on PID Monitoring .............................................................. 29 8.1.3 System Yield Based on Laboratory Sample Analyses.......................................... 29
8.2 Extracted Soil Vapor Treatment ................................................................................... 30 8.3 Reduction of VOC Concentrations ............................................................................... 30
8.3.1 VOC Reduction During Phase III SVE TS........................................................... 30 8.3.2 Overall VOC Reduction........................................................................................ 31
8.4 Distribution of Post-Treatment TCE Concentrations in Soil Gas................................. 31 8.4.1 Collection of PID Measurements and Laboratory Samples for Comparison ....... 32 8.4.2 Ratio of Laboratory Results to PID Measurements .............................................. 32 8.4.3 Correlation of Laboratory to PID Results............................................................. 33 8.4.4 Estimation of TCE Concentrations from PID Measurements............................... 33
9.0 Management of Investigation Derived Waste................................................................... 34 9.1 Solid Waste ................................................................................................................... 34 9.2 Liquid Waste................................................................................................................. 34 9.3 Waste Characterization ................................................................................................. 35 9.4 Transportation and Disposal ......................................................................................... 35 9.5 Asbestos Containing Materials ..................................................................................... 36
10.0 Quality Control Summary Report..................................................................................... 37 11.0 Conclusions....................................................................................................................... 38 12.0 Recommendations............................................................................................................. 39 13.0 References......................................................................................................................... 40
Final SVE TS Rpt ii

Final Phase III Soil Vapor Extraction Treatability Study Report Building 123, Parcel B
Hunters Point Shipyard, San Francisco, California
LIST OF TABLES AND FIGURES
LIST OF TABLES
Table No. Title
1 Chronology of Building 123 SVE Activities 2 Summary of SVE Wells, VM Wells, and Temporary Soil Gas Probes
Construction 3 Summary System Yield at Individual Wells Based on PID Monitoring 4 Summary of Soil Analytical Results for VOCs 5 Summary of Soil Analytical Results for Geotechnical Parameters 6 Summary of Soil Gas Analytical Results for VOCs 7 Summary of System Yield at GAC Vessels Based on PID Monitoring 8 Summary of System Yield at GAC Vessels Based on Laboratory Results 9 Percent Reduction of VOC Concentrations 10 Ratio of TCE Concentrations from Laboratory Results to VOCs from PID
Measurements 11 Estimation of TCE Concentrations from PID Measurements
LIST OF FIGURES
Figure No. Title
1 Site Location Map 2 Site Layout Showing Subsurface Utilities 3 Phase III SVE Treatability Study System Layout 4 Typical Temporary Soil Gas Sampling Probe Construction 5 Typical SVE Well Construction 6 Typical Clustered VM Well Construction 7 Pre-Treatment TCE Concentrations in Soil 8 Pre-Treatment TCE Concentrations in Soil Gas 9 Coefficient of Determination (R2) for Laboratory Data and PID Measurements 10 Distribution of Post-Treatment Estimated TCE Concentrations in Soil Gas
Final SVE TS Rpt iii

Final Phase III Soil Vapor Extraction Treatability Study Report Building 123, Parcel B
Hunters Point Shipyard, San Francisco, California
LIST OF APPENDICES
Appendix Title
A Photographic Log B Boring Logs B-1 Temporary Soil Gas Sample Locations B-2 Phase III Soil Vapor Extraction Wells B-3 Phase III Vapor Monitoring Wells C Laboratory Analytical Reports C-1 Soil Sampling Chain of Custody Forms/Laboratory Reports C-2 Soil Gas Sampling Chain of Custody Forms/Laboratory Reports C-3 Vapor Abatement Sampling Chain of Custody Forms/Laboratory Reports C-4 Waste Characterization (Soil, Carbon, and Water) D System Monitoring Field Forms E Waste Disposal Documentation E-1 Soil Waste Profile and Soil Waste Manifest Forms/Bills of Lading E-2 Waste Water Profile and Waste Water Manifest/Bill of Lading E-3 Carbon Waste Profile and Carbon Waste Manifest/Bill of Lading F Asbestos Abatement G Quality Control Summary Report
Final SVE TS Rpt iv

Final Phase III Soil Vapor Extraction Treatability Study Report Building 123, Parcel B
Hunters Point Shipyard, San Francisco, California
LIST OF ACRONYMS AND ABBREVIATIONS
ACM asbestos containing material ASTM American Society of Testing and Materials BAAQMD Bay Area Air Quality Management District bgs below ground surface cm/s centimeters per second CE2 CE2-Kleinfelder CS Confirmation Study DTSC Department of Toxic Substances Control EPA United States Environmental Protection Agency ESL Environmental Screening Level ft3 cubic feet GAC granular activated carbon HPS Hunters Point Shipyard IDW investigation derived waste IR-10 Installation Restoration Site 10 IT IT Corporation ITSI Innovative Technical Solutions, Inc. Lbs/ft3 pounds per cubic feet mg/kg milligrams per kilogram msl mean sea level µft3 micro cubic feet µg/L micrograms per liter µg/kg micrograms per kilogram Navy U.S. Department of the Navy % percent PCE tetrachloroethene PID photoionization detector PPE personal protective equipment ppmv parts per million by volume PRC PRC Environmental Management, Inc. PVC polyvinyl chloride QCSR Quality Control Summary Report R Correlation Coefficient R2 Coefficient of Determination ROD Record of Decision SAP Sampling and Analysis Plan scfm standard cubic feet per minute SFRWQCB San Francisco Region Water Quality Control Board SVE soil vapor extraction TCE trichloroethene TOC total organic carbon TS treatability study TtEMI Tetra Tech EM, Inc. UN United Nations U.S. United States USC United States Code VM vapor monitoring VOC volatile organic compound
Final SVE TS Rpt v

Final Phase III Soil Vapor Extraction Treatability Study Report Building 123, Parcel B
Hunters Point Shipyard, San Francisco, California
1.0 INTRODUCTION
Innovative Technical Solutions, Inc. (ITSI) implemented a Phase III Soil Vapor Extraction
(SVE) Treatability Study (TS) at Building 123 located in Installation Restoration Site 10 (IR-10)
at Parcel B, Hunters Point Shipyard (HPS) in San Francisco, California. This work was
performed on behalf of the United States (U.S.) Department of the Navy (Navy), Base
Realignment and Closure Program Management Office West, San Diego, California. This Phase
III SVE TS was conducted under the Northern California Environmental Multiple Awards
Contract Number N68711-02-D-8303, Contract Task Order CT003 in accordance with the Final
Work Plan Phase III Soil Vapor Extraction Treatability Study Parcel B Hunters Point Naval
Shipyard, San Francisco, California (ITSI, 2004). The location of HPS, Parcel B, and Building
123 are shown in Figure 1. Figure 2 shows the site layout in the vicinity of Building 123.
Appendices A through H present documentation generated during field activities and evaluation
of data generated during this TS.
1.1 TREATABILITY STUDY OBJECTIVE AND SCOPE OF WORK This Phase III SVE TS is a follow-on study to the previously completed technology
demonstration described in the Phase II Soil Vapor Extraction Treatability Study Report (IT
Corporation [IT], 2002) and evaluated in the Internal Final Soil Vapor Extraction Confirmation
Study (CS) (TetraTech EM, Incorporated [TtEMI], 2003). The objective of this Phase III SVE
TS was to evaluate whether enhancements to the SVE system increased the effectiveness of SVE
technology in reducing residual trichloroethene (TCE) concentrations in soil beneath Building
123. The objective has been accomplished by completing the following scope of work:
• Further evaluating the extent of TCE in soil by collecting soil samples from 24 temporary soil gas sample probe locations and during installation of new SVE and vapor monitoring (VM) wells.
• Further evaluating the extent of TCE in soil gas by collecting soil gas samples from 24 temporary soil gas sample probe locations.
• Expanding the previous Phase II SVE TS well layout by drilling nine additional SVE wells and six additional pairs of clustered VM wells based on the results of the soil and soil gas sampling.
• Installing and operating an SVE blower system with treatment of extracted vapor using granular activated carbon (GAC).
Final SVE TS Rpt 1

Final Phase III Soil Vapor Extraction Treatability Study Report Building 123, Parcel B
Hunters Point Shipyard, San Francisco, California
• Monitoring SVE system performance by measuring TCE concentrations at the combined system influent and effluent and at the individual SVE and VM wells with a photoionization detector (PID), and by collecting samples for laboratory analyses.
• Enhancing TCE removal by changing SVE system well configurations by converting different groups of SVE wells to passive injection wells, and altering system operations for continuous or pulsed extraction.
• Evaluating effectiveness of SVE technology in reducing TCE concentrations by comparing pre-treatment TCE concentrations to post-treatment TCE concentrations.
In addition to the above-mentioned scope of work, soil samples were collected from the SVE and
VM well locations for analysis of geotechnical parameters. This data will be used in future
decision making for the final remedy for the site. Table 1 provides a chronology of SVE
activities conducted at Building 123. Figure 3 illustrates the locations of the Phase III SVE TS
SVE wells, VM wells, and temporary soil gas probe locations. Appendix A contains
photographs of site activities.
This report presents the enhancements to the SVE system and the data and interpretations as
relevant to the project Data Quality Objectives (DQO), presented below. This report is intended
to provide support for SVE technology as a remedial alternative for the final remedy as part of an
upcoming amendment to the Final Record of Decision (ROD).
1.2 DATA QUALITY OBJECTIVES The DQOs for the Phase III SVE TS were developed in accordance with the seven-step process
presented in the U.S. Environmental Protection Agency (EPA) guidance (EPA, 2000). The DQO
process describes the problem and the spatial, temporal, and resource boundaries; defines the
decisions to be made during the TS; and identifies data and other inputs required for decision
making. These objectives have, in turn, prescribed the sampling and analytical methods and
quality assurance procedures that were followed during the TS. The process followed to
establish DQOs for the Phase III SVE TS is as follows:
Step 1. State the Problem: Based on previous sampling results, an analysis of future site uses, and the results of a Human Health Risk Assessment, soils beneath Building 123 in Parcel B exhibited concentrations of volatile organic compounds (VOCs) that exceeded site-specific risk-based criteria. In particular, volatilization of TCE from the soil beneath Building 123 to indoor air inside the building poses a potential risk to human health from inhalation exposure.
Final SVE TS Rpt 2

Final Phase III Soil Vapor Extraction Treatability Study Report Building 123, Parcel B
Hunters Point Shipyard, San Francisco, California
Concentrations of TCE exceeding the site-specific risk-based criteria also have been detected outside the zone of influence of the previous Phase II SVE system wellfield (TtEMI, 2003). A CS conducted at Building 123 (TtEMI, 2003) concluded that SVE technology was effective in reducing the concentration of TCE in soil. The CS recommended that the wellfield be expanded to increase the system’s zone of influence and that other system enhancements can be implemented to maximize its effectiveness in reducing TCE concentrations in soil beneath Building 123.
Step 2. Decisions: Did the recommended Phase III SVE TS system improvements increase the effectiveness of the SVE system in continuing to reduce the TCE levels remaining in soil beneath Building 123?
Step 3. Inputs: Inputs include information from previous investigations and studies, as well as data to be gathered and analyzed during the recommended activities. These inputs are listed below:
1. Extent of TCE contamination detected in soil samples during the previous remedial investigation.
2. Concentrations of TCE detected in soil and soil gas samples before, during, and after the Phase II SVE TS.
3. Calculated zone of influence of the Phase II SVE TS system wellfield.
4. Concentrations of TCE detected in soil and soil gas samples during the confirmation study sampling.
5. Survey data and maps showing the spatial distribution of detected TCE contamination in soil and the locations of existing and proposed SVE and VM wells.
6. Field-measured vapor monitoring data.
7. Concentrations of TCE detected in soil and soil gas samples before, during, and after the proposed Phase III SVE TS.
8. Calculated mass removal estimates.
Step 4. Boundaries: The lateral boundary of the TS area was the zone of influence of the expanded SVE system. The vertical boundary extended from the ground surface at Building 123 to the shallow upper aquifer water table, or about 10 feet below ground surface (bgs). The temporal boundary for the Phase III SVE TS was from November 2004 to January 2006.
Step 5. Decision Rules:
1. If, during operation of the expanded SVE system, a monthly review of system performance data suggests that the enhancements recommended in the CS (TtEMI, 2003) are improving system effectiveness, then those enhancements would continue to be implemented. If the system performance data suggests that
Final SVE TS Rpt 3

Final Phase III Soil Vapor Extraction Treatability Study Report Building 123, Parcel B
Hunters Point Shipyard, San Francisco, California
the proposed enhancements are not improving the effectiveness of the expanded SVE system, system optimization and/or repair and maintenance activities would be conducted. Possible optimization activities considered included:
• adjusting the pressure and/or airflow to the wells;
• performing maintenance or repairs on damaged pipes or system components, as necessary;
• performing maintenance or repairs on process equipment (belts, engine oil, etc.);
• evaluating the performance of and/or re-calibrating monitoring devices, as necessary.
2. If, at the conclusion of the study, comparison of the soil and soil-gas sample results to pre-treatment results indicates that the expanded SVE system has effectively reduced the concentrations of VOC contamination in soil underlying the site, then continued operation of the system would be recommended. If reductions in VOC concentrations in soil were not achieved, alternative process improvements to increase system effectiveness would be proposed. Improvements include, but are not limited to:
• increasing the number of wells and/or the size of the wellfield;
• injecting air into the system at selected well locations to enhance extraction of soil vapors at nearby well locations;
• increasing the length of time of system operation beyond 6 months in combination with other improvements.
Step 6. Specify Tolerable Limits on Decision Errors: The precision, accuracy, and sensitivity requirements for the data generated during this TS were in accordance with the requirements listed for each analytical method in Section 1.3.2 of the Sampling and Analysis Plan (SAP) provided as Appendix B of the Work Plan (ITSI, 2004). Decision errors were considered tolerable when data meet the stated goals for precision, accuracy, representativeness, completeness, and comparability. Data associated with precision and accuracy results outside acceptance criteria were evaluated for usability. If insufficient data were available because of rejected data, or if completeness goals were not met, collection of additional data might be required to provide a thorough evaluation of the expanded SVE system.
Step 7. Optimize Sampling Design: The sampling design presented in the Work Plan (ITSI, 2004) was developed based on information and sampling data obtained from previous investigations and studies, historical data, and regulatory agency guidance.
Several types of data were collected to complete this study. Field monitoring of soil vapor at SVE and VM wells was conducted using a field meter equipped with a PID. Soil and soil vapor samples were collected and submitted to analytical laboratories for analysis of VOCs and total organic carbon (TOC). Representative soil samples were also analyzed for geotechnical parameters to provide measurements of bulk density, moisture
Final SVE TS Rpt 4

Final Phase III Soil Vapor Extraction Treatability Study Report Building 123, Parcel B
Hunters Point Shipyard, San Francisco, California
content, specific gravity, and hydraulic conductivity. PID monitoring results were used to select wells for soil gas sampling (the wells with the highest readings were selected) and to determine the intervals for soil sample analysis during installation of temporary soil gas probes and SVE and VM wells (the depths with the highest-readings were selected). Ongoing monitoring was conducted using a PID during SVE system operation.
1.3 REGULATORY FRAMEWORK This TS was conducted under the Comprehensive Environmental Response, Compensation, and
Liability Act, 42 U.S. Code Section 9604, 10 U.S. Code Section 2705, and Federal Executive
Order 12850, and consistent with Chapter 6.8 of the California Health and Safety Code. The
Navy is the lead agency responsible for cleanup effort and is the principal decision maker. The
EPA, the California Department of Toxic Substances Control (DTSC), and the San Francisco
Region Water Quality Control Board (SFRWQCB) provide regulatory oversight.
Final SVE TS Rpt 5

Final Phase III Soil Vapor Extraction Treatability Study Report Building 123, Parcel B
Hunters Point Shipyard, San Francisco, California
2.0 SITE BACKGROUND
This section provides a summary of the site description, history, geology, and previous
investigations used to develop and support this TS.
2.1 SITE DESCRIPTION HPS is located in the City and County of San Francisco, California, situated on a long
promontory extending eastward into San Francisco Bay (Figure 1). The Phase III SVE TS area
is located in the northeast corner of Building 123 at Site IR-10 in Parcel B (Figure 2 and Figure
3). Parcel B was used primarily for office buildings, warehouses, and industrial activities, such
as storage and distribution of fuel, sandblasting and painting, machining, acid mixing, and metal
fabrication. Building 123, the former Battery and Electroplating Shop is a 77,128 square foot,
one-story wood-framed building. Dip tanks, formerly containing solvents and plating solutions,
were located in the northern corner of Building 123. Nine large sumps, formerly containing
high-voltage transformers, were located in the southeastern corner of the building (Figure 2).
The floor of Building 123 is constructed of approximately 8 to 12 inches of concrete. The area
surrounding Building 123 is covered primarily with asphalt pavement.
Various utilities are present at Building 123, including sanitary sewer lines, an acid drain line,
steam lines, and building service utility lines (Figure 2). Sanitary sewer lines are present at the
southeast, southwest and northeast sides of Building 123. One of the lines drains out of the
building’s northwest side is within the Phase III SVE TS area. Building roof and floor drains
were connected to storm drains outside the building which discharge to San Francisco Bay.
There are no other utilities within the TS area (Figure 2).
2.2 SITE HISTORY From 1944 to 1974, the Navy used Building 123 as a battery and electroplating shop for
submarine battery maintenance, battery storage, and electroplating operations. From 1976 to
1986, the Navy leased all of Parcel B, including Building 123, to Triple A. The last tenant at IR-
10 was Naval Facilities Engineering Command, Engineering Facilities Activities West, which
used Building 123 as an electrical substation. The building is currently vacant.
In 1987, TCE and other solvents, polychlorinated biphenyls, pesticides, petroleum hydrocarbons,
and metals including lead were confirmed at a number of locations at HPS. These findings
Final SVE TS Rpt 6

Final Phase III Soil Vapor Extraction Treatability Study Report Building 123, Parcel B
Hunters Point Shipyard, San Francisco, California
resulted in the EPA placing HPS on the National Priorities List in 1989. In 1991, the
Department of Defense listed the shipyard for closure.
2.3 SITE GEOLOGY AND HYDROGEOLOGY The following sections briefly summarize the geology and hydrogeology at Building 123.
2.3.1 Site Geology HPS is located within the Coast Ranges geomorphic province on a peninsula that projects southeast into San Francisco Bay. Much of the basement of the California Coast Ranges, including Hunters Point, is made up of the Jurassic-Cretaceous-age Franciscan Complex, an assemblage of variably deformed and metamorphosed rock units. Regionally, Franciscan Complex rocks consist predominantly of sandstones (arkoses and greywackes), shales, and their metamorphosed equivalents, with lesser volumes of serpentinite, cherts, and basalts (Wahrhaftig and Sloan, 1989). Six geologic units underlie HPS; all but the Jurassic-Cretaceous-age Franciscan Complex bedrock are of Quaternary age. In general, the stratigraphic sequence of these geologic units, from youngest (shallowest) to oldest (deepest), is as follows: Artificial Fill; Slope Debris and Ravine Fill (also known as Colluvium and Alluvium); Undifferentiated Upper Sand Deposits; Bay Mud Deposits; Undifferentiated Sedimentary Deposits; and Franciscan Complex Bedrock.
Available historical geologic information indicates the presence of artificial fill to a depth of approximately 40 to 50 feet bgs along the northeast edge of Building 123 in the vicinity of the Phase III SVE TS location (Dames and Moore, 1943a and 1943b). The artificial fill has been described as “serpentine and red rock, partially disintegrated, with gray clay and brownish-gray sandy clay loam (rocky fill)”. A twenty- to thirty-foot sequence of sedimentary deposits occurs below the artificial fill. These deposited materials include soft bay mud and firmer alluvial deposits, which consist of sands, sandy clay loams, and clay loams. Decomposed (weathered) serpentine bedrock occurs below the sedimentary deposits at a depth of approximately 60 to 70 feet bgs near the SVE treatment location. Contours based on the depth to bedrock data indicate that the surface of the decomposed serpentine bedrock is dipping 5 to 6 degrees to the north-northeast; the upper surface of overlying alluvial deposits (i.e, firm soils) is inferred to be dipping 4 to 5 degrees in the same direction.
The soil permeability to airflow and the extraction well radius of influence were determined in the soils in the TS area during pilot tests conducted as part of the Phase II SVE TS (IT, 2002). The soil permeability ranged from 0.6 darcys to 0.9 darcys. The average SVE radius of influence in the soils of the TS area was 25 feet and ranged from 9 feet to 32 feet.
Final SVE TS Rpt 7

Final Phase III Soil Vapor Extraction Treatability Study Report Building 123, Parcel B
Hunters Point Shipyard, San Francisco, California
The soils encountered during Phase III SVE TS drilling activities consisted of artificial fill to the total depth drilled (12 feet). The fill material is horizontally and vertically heterogeneous. The fill material consisted of fine-grained fill (clay and silt) with varying amounts of gravel, clay, sand, and/or silt. The soils observed during the Phase III SVE TS are consistent with the soils described during the previous Phase II SVE TS and the CS (IT, 2002, and TtEMI, 2003, respectively).
2.3.2 Site Hydrogeology Three hydrogeologic zones have been described at Parcel B (PRC Environmental Management, Inc. [PRC], 1996). These hydrogeologic units are identified as the unconfined A aquifer, a deeper semi-confined B aquifer, and the bedrock water-bearing zone. The A and B aquifers are extremely heterogeneous and variable in permeability and thickness. The A aquifer is composed primarily of the Artificial Fill geologic unit, but in places also includes the upper portion of the Undifferentiated Upper Sand Deposits geologic unit. A discontinuous aquitard of finer-grained material lies between the A and B aquifers. This aquitard is often referred to as the Bay Mud unit. The Bay Mud is a marine sedimentary unit typically containing shell fragments and composed predominantly of dark-colored plastic clays, but the unit can grade locally to clayey sands, sands, and gravels.
Based on the Draft Parcel B Quarterly Groundwater Monitoring Report (October-December 2005) and Annual Report (2005) prepared by CE2-Kleinfelder (CE2, 2006), groundwater elevations in the vicinity of the SVE system, specifically measured in monitoring wells IR10MW33A and IR10MW59A on the northwest side of the building were 3.09 feet mean sea level (msl) and 3.46 feet msl, respectively, or approximately 7 feet bgs (outside Building 123) and 10 feet bgs (inside Building 123). Building 123 was built on fill material at a higher elevation than the general surrounding topography, and therefore, depth to groundwater measured in wells inside Building 123 is greater than depth to groundwater measured in wells outside of Building 123.
In general, the groundwater flow direction within the A-aquifer in the vicinity of Building 123 is to the northeast and east (from the interior upland area toward San Francisco Bay). However, the heterogeneous and horizontally discontinuous nature of the fill material, local variations in depth to bedrock, and the presence of storm and sanitary sewer lines may cause localized complex flow patterns within the A aquifer (CE2, 2006).
2.4 PREVIOUS INVESTIGATIONS The following subsections present a summary of previous investigations at Building 123.
Final SVE TS Rpt 8

Final Phase III Soil Vapor Extraction Treatability Study Report Building 123, Parcel B
Hunters Point Shipyard, San Francisco, California
2.4.1 Initial Investigations IR-10 was one of the 12 sites identified at HPS in the Initial Assessment Study conducted by the Navy in 1984 as part of the Navy Assessment and Control of Installation Pollutants. The site was originally designated as Initial Assessment Study Site 11 and was re-designated IR-10 in 1988, when HPS was incorporated into the Navy’s Installation Restoration Program.
In 1986 and 1987, the Navy inspected Building 123 because of the potential release of hazardous substances to the building’s floor, sumps, and drains and the potential effect of these hazardous substances on the surrounding environment. Potential sources of hazardous substances included tanks and sumps that were used to store solvents, plating solutions, and polychlorinated biphenyls. During the initial investigation, the Navy collected floor scrape, soil, and groundwater samples to evaluate the presence of hazardous substances. Based on the initial sampling results (which showed elevated concentrations of mercury, arsenic, and lead) Building 123 was recommended for a Remedial Investigation in 1988 (PRC, 1996).
In December 1988, the Navy began Remedial Investigation activities at Building 123, including installation of 15 soil borings and installation of 11 groundwater monitoring wells within the A-aquifer. In April 1995, six Hydropunch® borings were drilled within Building 123. Elevated concentrations of TCE and metals were detected beneath the northeastern portion of Building 123, and low levels of semi-volatile organic compounds, total petroleum hydrocarbons, and vinyl chloride were detected beneath the north-central portion of Building 123. The likely sources of these analytes are waste acid and plating solution releases to the floor drains inside the building and leaks from acid drain lines (PRC, 1996). The concentrations of total petroleum hydrocarbons were below the cleanup goals developed for Parcel B (TtEMI, 2001).
2.4.2 Final Record of Decision In October 1997, the Navy issued the ROD for Parcel B (Navy, 1997). The ROD presented the final remedies for contaminated soil and groundwater at Parcel B, and presented the cleanup goals for soil and groundwater. The ROD also described the various remedial alternatives for contaminated soil and groundwater that were evaluated for the final remedy at Parcel B. Although soil excavation with off-site disposal was selected as the final remedy for contaminated soil at Parcel B, SVE was presented as one of the alternatives for soil remediation.
2.4.3 Phase II Soil Vapor Extraction Treatability Study Based on elevated TCE results in soil and groundwater samples collected during Remedial Investigation activities, a large remedial excavation area was outlined. Excavation of the entire area would have required partial demolition and stabilization of Building 123. In June 2000, the
Final SVE TS Rpt 9

Final Phase III Soil Vapor Extraction Treatability Study Report Building 123, Parcel B
Hunters Point Shipyard, San Francisco, California
Navy initiated the Phase II SVE TS within the northeastern corner of Building 123 to evaluate the effectiveness of SVE at removing VOCs from soil underlying the site (to prevent the need for demolition of Building 123). Starting in December 2000, the Navy implemented Phase II SVE TS field activities which included:
• An initial soil-gas survey to verify pre-selected well locations within the affected area, obtain initial screening-level soil-gas concentrations, and estimate VOC mass in soil gas;
• Collection of baseline wellhead vapor readings to establish initial wellhead vapor conditions before operation of the SVE system;
• Pilot-scale system testing to assess the engineering requirements of the SVE system; and
• Wellhead rebound monitoring to assess the long-term effectiveness of SVE treatment and to evaluate potential sources of VOC rebound, if any (IT, 2002).
The Navy installed 14 SVE wells and 18 VM wells (nine clustered pairs) as part of the Phase II SVE TS. Soil samples collected during soil boring activities indicated the presence of TCE in the vadose zone within and potentially beyond the Phase II SVE TS area. Based on the pre-treatment soil sampling results, the estimated mass of TCE in soil within the study area was approximately 75 pounds (IT, 2002).
The Phase II SVE TS system was operated from December 2000 to June 2001. While significant amounts of VOCs were removed by system operation (approximately 74 pounds of TCE), VOC concentrations rebounded at the site shortly after the SVE system was shut down. The Navy monitored VOC rebound using a PID at all SVE and VM wells for approximately two months after shutdown of the system. Monitoring results indicated that some rebound of VOCs occurred at all well locations. To evaluate the rebound concentrations, the Navy collected three vapor samples to quantify the wellhead VOC concentrations. TCE was detected in the vapor samples, with the highest concentrations at VM well locations. Equilibrium partitioning calculations performed on the vapor samples indicated that the rebound was most likely from vadose zone soil rather than from groundwater. However, the calculation results indicated a gradient of VOC mass transport from soil to groundwater within the treatment area.
The Phase II SVE TS concluded that SVE was effective in removing VOCs from the vadose zone beneath Building 123 and that minor modifications to the SVE system and the well networks would allow for full-scale implementation of an SVE system. The Draft Phase II Soil Vapor Extraction Treatability Study Report (IT, 2002), summarizing these findings, was provided as Appendix A of the ITSI Phase III SVE TS Work Plan (ITSI, 2004).
Final SVE TS Rpt 10

Final Phase III Soil Vapor Extraction Treatability Study Report Building 123, Parcel B
Hunters Point Shipyard, San Francisco, California
2.4.4 Soil Vapor Extraction Confirmation Study In September 2002, the Navy conducted an SVE CS to evaluate continued VOC concentration rebound in soil beneath Building 123 within the radius of influence of the Phase II SVE TS System and to estimate whether most of the TCE mass had been removed from the soil underlying the site. During the CS the Navy conducted the following field activities:
• Drilled 22 soil borings;
• Collected 44 soil samples for laboratory analyses;
• Collected a total of 32 vapor samples from the Phase II TS SVE wells (14) and VM wells (18) for laboratory analyses; and
• Collected vapor monitoring data using a PID after vapor sample collection from the Phase II TS SVE and VM wells.
The Navy evaluated the pre- and post-treatment VOC concentrations in vapor, soil, and groundwater to estimate the amount of VOC mass remaining in each matrix. Based on equilibrium partitioning calculations, the SVE CS estimated the remaining mass of TCE to be 9 kilograms (19.8 lbs) sorbed in soil, 1 kilogram (2.2 lbs) dissolved in groundwater, and 0.1 kilogram (0.22 lbs) in soil vapor (TtEMI, 2003). The results of the SVE CS indicated that concentrations of TCE beneath Building 123 exceeded ROD Soil Cleanup Goals and that SVE is an effective technology for removing TCE and other VOCs from soil underneath Building 123. The SVE CS recommended the following:
• Expand the SVE system 20 to 40 feet to the northwest and southwest to target remaining TCE “hot spots.”
• Adjust valve settings to increase vacuum pressure and air flow at wells nearest TCE “hot spots.”
• Evaluate the effectiveness of the expanded system in reducing TCE concentrations to below risk-based soil volatilization to indoor air screening criteria after six months of operation.
• Continue operating the expanded SVE system until TCE concentrations are less than risk-based soil volatilization to indoor air action levels, if system monitoring evaluation indicates the expanded SVE system continues to effectively remove VOCs.
• If removal of TCE reaches an asymptotic level, the Navy should consider adjustment of vacuum pressures at the individual wells. If vacuum pressure adjustment does not reduce TCE concentrations, additional treatment options such as active injection at selected wells combined with extraction at the remaining wells may be considered.
Final SVE TS Rpt 11

Final Phase III Soil Vapor Extraction Treatability Study Report Building 123, Parcel B
Hunters Point Shipyard, San Francisco, California
3.0 PHASE III SOIL AND SOIL GAS SAMPLING
Soil and soil gas samples were collected from temporary soil gas sample probes and during construction of the Phase III SVE TS SVE and VM wells. Additional soil gas samples were collected from the SVE system during operation. PID readings were also collected from the SVE and VM well heads during all phases of the Phase III SVE TS. The following summarizes the number and locations of soil and soil gas samples collected during the Phase III SVE TS:
Pre-Phase III SVE TS Sampling
• 18 soil samples were collected from 18 soil gas probes installed on January 13 and 14, 2005.
• 18 soil gas samples were collected from the 18 soil gas probes on January 17, 2005.
• 6 soil samples were collected from 6 additional soil gas probes installed on March 23, 2005.
• 6 soil gas samples were collected from the 6 additional soil gas probes on March 24, 2005.
• 18 soil samples were collected during the installation of the 9 SVE and 12 (6 pairs) VM wells from May 18 through 23, 2005.
• Pre-treatment soil gas samples were collected from the 5 SVE and VM locations with the highest PID field screening measurements on January 19, 2005.
Phase III SVE TS Sampling
• Samples of the extracted soil gas were collected from the SVE system on a monthly basis during system operation to evaluate vapor abatement efficiency from June 15, 2005, to January 3, 2006.
Post-Phase III SVE TS Sampling
• Post-treatment soil gas samples were collected from the 5 SVE and VM well locations with the highest PID field screening measurements on January 3, 2006.
A total of 24 temporary soil gas sample probes, 9 SVE wells and 12 (6 pairs) VM wells were installed at the site during the Phase III SVE TS. The Phase III SVE TS system consists of 23 SVE wells and 30 (15 pairs) VM wells. Figure 3 shows the location of the soil and soil gas sampling locations. Table 1 provides a chronology of sampling activities. Table 2 summarizes the construction details of the temporary soil gas sample probes and the SVE and VM wells. Boring logs of the temporary soil gas sample probes and the SVE and VM wells are contained in Appendix B. Results of the soil and soil gas sampling and evaluation of the data collected are presented in Sections 7.0 and 8.0, respectively. Appendix C contains the laboratory data sheets and chain of custody documentation.
Final SVE TS Rpt 12

Final Phase III Soil Vapor Extraction Treatability Study Report Building 123, Parcel B
Hunters Point Shipyard, San Francisco, California
3.1 SOIL SAMPLING Soil samples were collected using direct push soil sampling technology. Soil samples selected for VOC analyses were collected from the depth with the highest VOC concentration measured in the field with a PID, or from approximately 6 to 12 inches above groundwater if no VOCs were detected with the PID screening. Soil samples selected for VOC analysis were collected from the end of each selected butyrate sample sleeve using EnCore® samplers. The soil remaining in the butyrate sleeves was sealed with Teflon liners and plastic end caps, appropriately labeled, and submitted for moisture content analysis.
The soil samples selected for geophysical parameters were collected in the butyrate sleeves sealed with Teflon liners and plastic end caps, appropriately labeled, and submitted for laboratory analyses. All soil samples were stored in ice-filled coolers under chain of custody protocol before being transferred to the laboratory for analysis. The following sections describe the number of samples that were collected for each analytical method.
3.1.1 VOC Soil Sample Analyses A total of 42 soil samples were selected from the temporary soil gas sampling probes, SVE, and VM wells for laboratory analysis for VOCs by EPA Method 8260B/5035. One soil sample was collected from each of the 24 temporary soil gas sampling probes (total of 24 samples); one to two samples were collected from each of the 9 SVE wells (total of 11 samples); and one to two samples were collected from the deeper well at each of the 6 pairs of clustered VM wells (total of 7 samples). Appendix C contains the laboratory data sheets and chain of custody documentation.
3.1.2 Geotechnical Soil Sample Analyses The following lists the number of soil samples collected during installation of the SVE and VM wells that were submitted for each geotechnical analytical suite:
• 18 soil samples were analyzed for total organic carbon by EPA Method 9060/415.2.
• 42 soil samples were analyzed for moisture content by American Society of Testing and Materials (ASTM) Method D2216. These include moisture content results from samples collected for VOC analyses.
• 18 soil samples were analyzed for bulk density by ASTM Method D2937.
• 17 soil samples were analyzed for specific gravity by ASTM Method D854.
• 17 soil samples were analyzed for hydraulic conductivity by ASTM Method D5084.
Final SVE TS Rpt 13

Final Phase III Soil Vapor Extraction Treatability Study Report Building 123, Parcel B
Hunters Point Shipyard, San Francisco, California
3.2 SOIL GAS SAMPLE COLLECTION Soil gas samples were collected from 22 temporary soil gas sampling probes. Eighteen probes (IR10SG048 through IR10SG065) were installed on January 13 and 14, 2005. Six additional temporary soil gas sampling probes were constructed as step-out locations on March 23, 2005. The following subsections describe the installation of the temporary soil gas sampling probes and collection of the soil gas samples.
3.2.1 Installation of Temporary Soil Gas Sample Probes The temporary soil gas sample probes were installed using direct push drilling technology. The probes were installed at the depth with the highest PID reading, or approximately one foot above groundwater. The depths of the temporary soil gas probes outside Building 123 ranged from 5 to 5.5 feet bgs. The depths of probes inside Building 123 ranged from 8.5 to 9 feet bgs. Table 2 provides the sample depths of the temporary soil gas probes. The temporary soil gas sampling probes were constructed using a one-inch long high density polyethylene filter screen attached to ¼-inch Teflon tubing that extended from the filter screen to above the ground surface. Sand (No. 2/12 sand) was constructed around the filter screen to six inches above the screen. The borehole annulus was filled with approximately 2.5 to 3.5 feet of hydrated granular bentonite transition seal above the sand. The remaining borehole annulus was filled with a cement/bentonite grout seal to just below the surface pavement (asphalt or concrete).
Active soil gas samples were collected a minimum of 24 hours after installation of the temporary probes. Before sampling, a minimum of three volumes of borehole air were purged with an air pump. Samples were collected in SUMMA canisters after purging. Each sample was collected over an approximately 30 minute interval using a calibrated inlet filter. Soil gas samples were stored in the SUMMA canisters under chain of custody protocol before being transferred to the laboratory. Figure 3 shows the locations of the temporary soil gas sampling probes. Figure 4 shows the typical temporary soil gas sampling probe construction. Boring logs of the temporary soil gas sample probes are contained in Appendix B.
3.2.2 Soil Gas Sample Analyses A total of 22 soil gas samples collected from the temporary soil gas sample locations were submitted to Air Toxics Laboratory in Chico, California for analysis for VOCs, by EPA Method TO-14A. Samples could not be collected from 2 of the 24 sample locations (IR10SG064 and IR10SG065) because of blockages in these sample probes. Section 7.0 presents the results of the analyses. Appendix C contains the laboratory data sheets and chain of custody documentation.
Final SVE TS Rpt 14

Final Phase III Soil Vapor Extraction Treatability Study Report Building 123, Parcel B
Hunters Point Shipyard, San Francisco, California
3.2.3 Abandonment of Temporary Soil Gas Sample Probes All the temporary soil gas sample probes were removed, and the boreholes were abandoned with cement grout to ground surface on March 15, 2006.
3.3 PRE- AND POST-TREATMENT SOIL GAS SAMPLE COLLECTION On January 18, 2005, before Phase III SVE TS system construction, the concentration of VOCs was measured at all the SVE and VM wells at the site with a PID. Soil gas samples (pre-treatment) were then collected on January 19, 2005, for laboratory analyses from the five well locations with the highest PID concentrations. A second round of soil gas samples were collected three months after system shutdown. On December 30, 2005, PID measurements were collected from all the SVE and VM wells. Soil gas samples for laboratory analysis (post-treatment) were collected on January 3, 2006, from the five wells with the highest PID concentrations. The samples selected for laboratory analyses were collected in six liter SUMMA canisters and submitted, under chain-of-custody documentation, to Air Toxics Laboratory in Chico, California for analyses for VOCs by EPA Method TO-14A.
Final SVE TS Rpt 15

Final Phase III Soil Vapor Extraction Treatability Study Report Building 123, Parcel B
Hunters Point Shipyard, San Francisco, California
4.0 WELL CONSTRUCTION
The following subsections describe the design for the construction of the SVE wells and VM
wells installed during the Phase III SVE TS. The Phase III SVE TS was expanded by adding
nine SVE wells and six pairs of clustered VM wells to the previous Phase II SVE TS well layout.
Placement of the additional SVE and VM wells was determined based on soil and soil gas
sample results from the January/March 2005 sampling events and the soil and soil gas results for
samples collected during the CS (TtEMI, 2003). The previous (Phase II SVE TS) well layout
consisted of 14 SVE wells and 9 pairs of VM wells. The complete Phase III SVE TS well layout
comprised a total of 23 SVE wells and 15 pairs of VM wells. Figure 3 shows the Phase III SVE
TS well layout. Table 2 summarizes well construction details. Boring logs with well
construction details are provided in Appendix B.
4.1 SVE WELLS Nine SVE wells were installed from May 18 through 20, 2005. The Phase III TS SVE wells
were constructed consistent with the design of the previous Phase II TS SVE wells. Each of the
SVE wells was drilled to approximately 10 feet bgs. SVE wells were constructed of 4-inch
diameter Schedule 40 flush-threaded polyvinyl chloride (PVC) casing and approximately 8 feet
of flush-threaded PVC well screen with 0.020 inch slots. The screened intervals of the SVE
wells were from approximately 2 to 10 feet bgs. The borehole annulus was backfilled with #3
Monterey filter pack sand from the bottom of the borehole to approximately six inches above the
top of the screened interval. A transition seal consisting of hydrated bentonite chips was placed
above the filter sand. Neat cement/bentonite grout was placed above the transition seal to ground
surface. Figure 5 illustrates SVE well construction details.
4.2 VM WELLS Six pairs of VM wells were drilled and constructed from May 18 through 23, 2005. The VM
wells were drilled in clustered pairs consisting of one shallow well and one deep well. The
Phase III TS VM wells were constructed differently than the previous Phase II TS VM wells.
The Phase III VM wells were constructed with six-inch screened intervals in accordance with
DTSC and California Regional Water Quality Control Board – Los Angeles Region, “Advisory –
Active Soil Gas Investigations, (DTSC, 2003).” VM wells were constructed of 2-inch diameter
Schedule 40 flush-threaded PVC casing and PVC well screen with 0.020 inch slots. The shallow
Final SVE TS Rpt 16

Final Phase III Soil Vapor Extraction Treatability Study Report Building 123, Parcel B
Hunters Point Shipyard, San Francisco, California
VM wells were drilled to approximately 4 feet bgs, and the deep VM wells were drilled to
approximately 6 feet bgs. The screened intervals of the shallow VM wells were constructed at
approximately 3.5 to 4 feet bgs, and the deep VM wells were constructed at approximately 5.5 to
6 feet bgs.
The borehole annulus was backfilled with #3 Monterey filter pack sand from the bottom of the
borehole to approximately 6 inches above the top of each screened interval (3 or 5 feet bgs,
respectively). Approximately 1 (shallow VM wells) to 3 feet (deep VM wells) of hydrated
bentonite chips or pellets were used to fill the remaining annulus of each VM well to
approximately 1 foot bgs. Neat cement/bentonite grout was placed above the bentonite transition
seal to ground surface. Figure 6 illustrates VM well construction details.
Final SVE TS Rpt 17

Final Phase III Soil Vapor Extraction Treatability Study Report Building 123, Parcel B
Hunters Point Shipyard, San Francisco, California
5.0 SVE SYSTEM CONSTRUCTION
The principle of SVE technology operation is to extract VOCs in vapor form from contaminated
soil by applying negative pressure (i.e, a vacuum) to the subsurface. An SVE system extracts
VOC vapors from the subsurface using a blower to apply the vacuum through a system of
extraction wells that are screened in the vadose zone. The pressure gradient generated by the
system induces airflow toward the extraction wells through the pore spaces in the vadose zone.
The airflow also enhances the volatilization of contaminants that are adsorbed onto soil particles
into the pore spaces of the vadose zone. The extracted contaminated vapors are subsequently
treated to remove VOCs before the treated air is released to the atmosphere. For this Phase III
TS, the extracted vapors were treated by adsorption onto GAC. The following subsections
describe the construction of the Phase III SVE TS system components.
5.1 PIPING AND WELLHEAD CONNECTIONS The wellheads and piping of the previous Phase II SVE TS system were present and in good
condition at the site. The nine additional Phase III SVE TS SVE wells were connected to the
previous piping system by inserting tee fittings into the existing piping layout. The extraction
piping and wellheads were constructed of four-inch diameter Schedule 80 PVC. The wellheads
were connected to the piping with clear, flexible PVC vacuum-rated hose and quick-connect,
camlock fittings. Piping from the wellheads to the process equipment was installed above
ground. In addition, a pressure gauge, sample cock valve, and an air velocity measurement port
were installed at each wellhead. Figure 3 shows the layout of the existing piping and expanded
piping for the additional SVE wells. Figure 5 shows the typical wellhead construction and
piping connections.
5.2 SOIL VAPOR EXTRACTION AND TREATMENT SYSTEM The following subsections describe the construction of the SVE process equipment and the vapor
treatment equipment.
5.2.1 SVE System Process Equipment and Control Components The SVE process equipment selection was based on the number of full-scale system wells (23
SVE wells) and estimated maximum extraction flow rates (up to 10 standard cubic feet [ft3] per
minute [scfm] per well) from the results of the Phase II SVE TS (IT, 2002). The process
Final SVE TS Rpt 18

Final Phase III Soil Vapor Extraction Treatability Study Report Building 123, Parcel B
Hunters Point Shipyard, San Francisco, California
equipment was constructed on a trailer and sized to be versatile for use at future sites. The major
process equipment for the Phase III SVE TS included:
• Positive-displacement belt-driven air blower with inlet filter and discharge silencer;
• Explosion-proof three-phase, 240-volt electric motor and explosion-proof motor controls;
• Liquid/vapor separator with automatic liquid transfer pump;
• Electric and safety shut-off controls;
• Pressure and temperature gauges, control valves, and airflow and liquid flow meters to monitor and regulate system operation; and
• 1,000 gallon polyethylene storage tank;
Figure 3 shows the location of the process equipment. The process equipment was connected to
the well field piping using 6-inch diameter Schedule 80 PVC and galvanized steel fittings. The
process equipment was connected to the emission abatement equipment with 4-inch diameter
flexible vacuum-rated hoses and quick-connect fittings.
5.2.2 Emission Abatement Equipment Based on anticipated low VOC concentrations and the total system airflow rate from the results
of the Phase II SVE TS report, and the mass of TCE remaining at Building 123 estimated in the
CS (TtEMI, 2003), two GAC adsorption vessels were used for abatement of VOCs in the
extracted vapor. The two carbon adsorption vessels were operated in series and placed in the
process stream before the SVE blower unit. Each GAC vessel contained approximately 1,000
pounds of regenerated GAC. Each vessel was constructed of carbon steel and designed for
vacuum and pressure applications. Treated off-gas leaving the GAC was discharged through an
approximately 15-foot high, 4-inch diameter Schedule 80 PVC stack to the atmosphere.
5.2.3 Electrical Power Supply Installation An electrical subcontractor installed a 100-ampere, 230-volt, 3-phase service in Building 123 for
supplying power to the Phase III SVE TS system. Power supply components included a
distribution circuit breaker panel, one 120-volt receptacle, rigid conduit, and associated 230-volt
wiring to the SVE blower. Electrical power was supplied by Pacific Gas and Electric.
Final SVE TS Rpt 19

Final Phase III Soil Vapor Extraction Treatability Study Report Building 123, Parcel B
Hunters Point Shipyard, San Francisco, California
After completion of the Phase III SVE TS, electrical service to the Phase III SVE TS system was
discontinued on March 12, 2006. The SVE system was disconnected from the circuit breaker
panel, but the wiring, meter, and circuit breaker panel were not removed at the request of the
HPS Caretaker Site Office.
Final SVE TS Rpt 20

Final Phase III Soil Vapor Extraction Treatability Study Report Building 123, Parcel B
Hunters Point Shipyard, San Francisco, California
6.0 PHASE III SVE TS SYSTEM OPERATION
During the Phase III SVE TS, the SVE blower unit was operated for a total of 1,470 hours
between June 15, 2005, and January 11, 2006. The SVE blower unit and ancillary equipment
operated 100% of the time without any unscheduled system down time. Appendix D contains
SVE system operations and monitoring logs.
The SVE system began extracting from all 23 SVE wells on June 15, 2005. At system startup,
VOCs were detected in all 23 SVE wells using a PID. After five days of operation, the
combined system influent VOC concentration decreased below the detection level of the PID
(0.1 parts per million by volume [ppmv]). In addition, concentrations measured at the individual
wells steadily decreased within the first two weeks of operation until only 10 of the 23 extraction
wells showed VOC concentrations detectable with a PID on June 27, 2005. At this time groups
of extraction wells were disconnected from the extraction system and opened to ambient air for
use as passive injection wells. Table 3 presents a summary of system monitoring at individual
extraction wells, and also presents the operational configurations of the SVE wells during the TS.
Operating groups of SVE wells as passive injection wells has two benefits: 1) encourages air
movement in areas of little to no airflow, and 2) allows for more air to be removed from wells
being operated as extraction wells. Areas of no airflow develop midway between two extraction
wells as both extraction wells pull with equal strength on a given area. The pressure gradient
developed at each well cancels the other out and as a result air will not flow to either extraction
well. Converting some SVE wells into passive injection wells allows the difference in air
pressure of the ambient air at the passive injection well and the relative negative pressure at the
extraction well to generate a pressure gradient, and as a result, air flows between the wells and
enhances removal of TCE. Changing the number and locations of SVE wells that are converted
to passive injection wells allows different areas of little to no airflow between different pairs of
extraction wells to be targeted.
The second benefit of converting SVE wells into passive injection wells is that more air is
extracted from the remaining SVE wells operated as extraction wells. Typically, the SVE wells
selected to be converted to passive injection wells are the wells with the lowest detectable
Final SVE TS Rpt 21

Final Phase III Soil Vapor Extraction Treatability Study Report Building 123, Parcel B
Hunters Point Shipyard, San Francisco, California
concentrations of VOCs. Therefore, the resulting configuration focuses more extraction airflow
from the SVE wells with higher concentrations of VOCs.
From June 27 to September 13, 2005, the SVE system was operated with different numbers of
SVE wells operating as extraction wells or passive injection wells. For each system
configuration, there were more SVE wells being operated as extraction wells than as passive
injection wells. The number of SVE wells operating as passive injection wells during this time
ranged from 0 to 11, and correspondingly, the number of SVE wells operating as extraction wells
ranged from 23 to 12. Table 3 shows the operational mode (extraction or passive injection) of
each well during the Phase III SVE TS.
On September 13, 2005, the SVE system was turned off for rebound monitoring. At the time the
system was shut down, PID monitoring indicated that only one extraction well, IR10VW-23A,
had a measurable VOC concentration. The system remained off until December 30, 2005, and
periodic monitoring of VOC concentrations at the individual SVE wells was conducted using a
PID, to monitor VOC concentration rebound (Table 3).
On December 30, 2005, PID monitoring indicated that VOC concentrations had rebounded to
levels detectable with a PID in 14 of 23 SVE wells. On January 3, 2006, the system was turned
back on and operated with all SVE wells configured as extraction wells to reduce rebounded
concentrations. On January 11, 2006, SVE system operations were concluded.
Final SVE TS Rpt 22

Final Phase III Soil Vapor Extraction Treatability Study Report Building 123, Parcel B
Hunters Point Shipyard, San Francisco, California
7.0 PHASE III SVE TS RESULTS
This section presents the analytical and field measurement results of the Phase III SVE TS.
Evaluation of the data is presented in Section 8.0. The following subsections discuss:
• Analytical results of soil samples,
• Analytical results of soil gas samples,
• Pre- and post-treatment soil gas monitoring results,
• PID monitoring results of SVE system performance,
7.1 SOIL SAMPLE RESULTS FOR VOCS A total of 42 soil samples collected from temporary soil gas probes and SVE and VM wells were submitted for laboratory analyses for VOCs. The laboratory results indicate TCE was detected above the laboratory reporting limit in 23 of the 42 soil samples. The concentration of TCE ranged from below the laboratory detection limit to 36,000 micrograms per kilogram (µg/kg). The highest concentration (36,000 µg/kg) was detected at sample location IR10SG074 at 4 to 5 feet bgs. Table 4 presents a summary of VOC results in soil. Figure 7 shows the pre-treatment distribution of TCE in soil based on these results and the soil results from the CS (TtEMI, 2003).
Other VOCs detected in soil samples collected during the Phase III SVE TS included
tetrachloroethene (PCE), naphthalene, and carbon disulfide. PCE was detected above the
laboratory reporting limit in one sample, IR10VW22A at 3 to 4 feet bgs, at a concentration of
350 µg/kg, exceeding the ROD Soil Cleanup Goal of 161 µg/kg for PCE. Naphthalene was
detected above the laboratory reporting limit in one sample, IR10SG062 at 5 to 6 feet bgs, at a
concentration of 21 µg/kg. Carbon disulfide was detected above the laboratory-reporting limit in
two soil samples, IR10SG073 (duplicate) at 4 to 5 feet bgs, and IR10SG077 at 5 to 6 feet bgs at
concentrations of 9.9 µg/kg and 17 µg/kg, respectively. The concentrations of naphthalene and
carbon disulfide were below their respective ROD Soil Cleanup Goals of 68,800 µg/kg and
12,700 µg/kg.
7.2 SOIL SAMPLE RESULTS OF GEOTECHNICAL PARAMETERS The following subsections describe the soil geotechnical results. Table 5 summarizes the analytical results of the geotechnical analyses for the soil samples collected during the Phase III SVE TS. Appendix C contains the laboratory data sheets and chain of custody documentation.
Final SVE TS Rpt 23

Final Phase III Soil Vapor Extraction Treatability Study Report Building 123, Parcel B
Hunters Point Shipyard, San Francisco, California
7.2.1 Moisture Content Results A total of 42 soil samples were selected during the Phase III SVE TS for analysis for moisture content. The average moisture content of the soil samples collected from the Phase III SVE TS was 13.1 percent (%). The moisture content of the samples ranged from 2% to 22%. The average moisture content of the Phase III SVE TS soil samples was less than the average moisture content of the soil samples collected during the Phase II TS (16.9%).
7.2.2 Total Organic Carbon Soil Sample Results A total of 18 soil samples were selected during Phase III SVE TS for analysis for TOC. The
average TOC content of the soil samples collected from the Phase III SVE TS was 0.12%. The
TOC content ranged from 0.02% to 0.31%. The average TOC of the Phase III SVE TS soil
samples was less than the average of the amount of TOC in the soil samples collected during the
Phase II TS (0.18%) and the CS (0.23%).
7.2.3 Bulk Density Results A total of 18 soil samples were selected during Phase III SVE TS for analysis for bulk density.
The average bulk density of the soil samples collected from the Phase III SVE TS was 113.9
pounds per cubic feet (lbs/ft3). The bulk density ranged from 94.3 lbs/ft3 to 127.4 lbs/ft3. The
average bulk density of the Phase III SVE TS soil samples was slightly greater than the average
bulk density of the soil samples collected during the Phase II SVE TS (105.2 lbs/ft3) and the CS
(105.0 lbs/ft3).
7.2.4 Specific Gravity Results A total of 17 soil samples were selected during Phase III SVE TS for analysis for specific
gravity. The average specific gravity of the soil samples collected from the Phase III SVE TS
was 2.69. The specific gravity ranged from 2.57 to 2.96. The average specific gravity of the
Phase III SVE TS soil samples was the same as the average specific gravity of the previous soil
samples collected during the Phase II SVE TS (2.69).
7.2.5 Hydraulic Conductivity Results A total of 17 soil samples were selected during Phase III SVE TS for analysis for hydraulic
conductivity. The average hydraulic conductivity of the soil samples collected from the Phase
III SVE TS was 1.99E-04 centimeters per second (cm/s). Hydraulic conductivity ranged from
1.55E-03 cm/s to 2.25E-07 cm/s. The average hydraulic conductivity of the Phase III SVE TS
Final SVE TS Rpt 24

Final Phase III Soil Vapor Extraction Treatability Study Report Building 123, Parcel B
Hunters Point Shipyard, San Francisco, California
soil samples was similar in magnitude to the average hydraulic conductivity of the previous soil
samples collected during the Phase II SVE TS (1.30E-04 cm/s). However, the wide range of
values for hydraulic conductivity is indicative of the heterogeneous soils at the site.
7.3 SOIL GAS SAMPLE RESULTS The following subsections provide the results of the soil gas sampling conducted during the Phase III SVE TS. These include soil gas results from the following data sets:
• The temporary soil gas sampling probes;
• PID monitoring results collected from the SVE system during SVE system operation;
• PID monitoring results collected from the SVE wells before, during, and after SVE system operation;
• Soil gas samples collected from the SVE system during operation; and
• Pre- and post-treatment soil gas samples collected from the five wells with the highest PID readings.
7.3.1 Temporary Soil Gas Sample Probes TCE was detected in 21 of the 22 soil gas samples collected from the temporary soil gas sampling probes. The concentration of TCE ranged from below the laboratory-reporting limit (IR10SG-066 at 8 feet) to 110 µg/L (IR10SG-052 at 8.5 feet). The analytical results indicated TCE concentrations at 12 of the 22 soil gas sample locations were below the SFRWQCB Shallow Soil Gas Residential ESL. Two sample locations exceeded Residential ESLs but were below the Commercial/Industrial Shallow Soil Gas ESL. The remaining six locations exceeded the Commercial/Industrial Shallow Soil Gas ESL (SFRWQCB, 2004). Table 6 provides the results for the soil gas samples collected from the temporary soil gas sampling probes. Figure 8 shows the distribution of TCE in soil gas at the site before operation of the Phase III SVE TS.
7.3.2 PID Monitoring of SVE System Concentrations of VOCs were monitored using a PID at the SVE system influent to the first
GAC vessel on a monthly basis during the Phase III SVE TS. Initial VOC concentrations
measured at the influent at the startup of the SVE system on June 15, 2005, was 3.5 ppmv.
Within seven days of SVE system operation (by June 22, 2005), the VOC concentrations had
been reduced to below the detection level of the PID (0.1 ppmv). VOC concentrations at the
system influent remained below the detection level of the PID for the remainder of the Phase III
SVE TS. VOC concentrations measured at the effluent of the first GAC vessel were all below
Final SVE TS Rpt 25

Final Phase III Soil Vapor Extraction Treatability Study Report Building 123, Parcel B
Hunters Point Shipyard, San Francisco, California
the detection level of the PID. Table 7 presents the PID monitoring results of the SVE system.
PID monitoring data of the SVE system were used to evaluate system yield as described in
Section 8.0.
7.3.3 PID Monitoring at SVE Wells Concentrations of VOCs were monitored using a PID at the SVE wells at SVE system startup
and approximately every two weeks during and after operation of the Phase III SVE TS system
from June 15, 2005 to February 1, 2006. At SVE system startup on June 15, 2005, all 23 SVE
wells had concentrations of VOC which ranged from 0.7 ppmv to 31 ppmv. By June 27, 2005,
only 10 of 23 SVE had concentrations of VOCs which ranged from 0.3 ppmv to 2.7 ppmv. From
June 27 to September 13, 2005, groups of SVE wells were converted to passive injection wells.
By September 13, 2005, only SVE well, IR10VW-23 had VOC concentrations (0.9 ppmv). On
September 13, 2005, the SVE system was shut down for rebound testing. VOC concentration
rebound was monitored every two weeks until December 30, 2005. At this time VOC
concentrations had rebounded in 14 of 23 SVE wells with concentrations ranging from 0.1 ppmv
to 8.7 ppmv. Table 3 presents the results of the PID monitoring at the individual extraction wells
during SVE system operation. PID monitoring data were used to evaluate system yield,
reduction of TCE concentrations, and distribution of post-treatment TCE concentrations as
described in Section 8.0.
7.3.4 Laboratory Results of SVE System Performance Monitoring Vapor samples were collected for laboratory analysis from the SVE system influent to the first
GAC vessel on a monthly basis during the Phase III SVE TS. TCE concentrations ranged from
1.2 µg/L to 17 µg/L at the system influent. TCE concentrations were greatest (17 µg/L) at
system startup. During operations with all SVE wells configured as extraction wells,
concentrations decreased to 1.2 µg/L. On July 8, 2005, SVE system operation was changed by
converting groups of extraction wells to passive injection wells. TCE concentrations in the
extracted air increased from 1.2 µg/L to 7.4 µg/L to 8.4 µg/L, as different groupings of SVE
wells were converted to passive injection wells. Table 8 presents the laboratory results of the
samples collected from the combined system influent. Laboratory data were used to evaluate
system yield at the combined SVE system influent.
Final SVE TS Rpt 26

Final Phase III Soil Vapor Extraction Treatability Study Report Building 123, Parcel B
Hunters Point Shipyard, San Francisco, California
7.3.5 Pre- and Post-Treatment Soil Gas Sampling Results The concentrations of VOCs at the SVE wells and VM wells were measured using a PID before Phase III SVE TS system startup and approximately three months after system shutdown. In addition, soil gas samples were collected during each monitoring event from the five well locations with the highest PID concentrations.
Pre-treatment PID VOC measurements ranged from 0.0 to 210 ppmv. All 23 SVE wells had
VOC concentrations detectable with a PID, and 26 of 30 VM wells had detectable VOC
concentrations. Pre-treatment laboratory results for samples from the five wells with the highest
PID measurements ranged from 6.9 to 28 ppmv TCE. The five wells with the highest PID
measurements were IR10VW008A, IR10VW012A, IR10SG041-10, IR10SG045-10, and
IR10SG047-5.
Post-treatment PID measurements at the time of SVE system shutdown (September 13, 2005)
ranged from 0.0 to 18 ppmv VOCs. One SVE well (IR10VW023A) had VOC concentrations
detectable with a PID (0.9 ppmv). Two VM wells (IR10SG074-4 and IR10SG074-6) had
detectable VOC concentrations (18 and 0.7 ppmv, respectively). Laboratory samples were not
collected during this monitoring event. VOCs were not detectable in the remaining 22 SVE
wells and 28 VM wells.
Post-treatment PID measurements collected after rebound monitoring (December 30, 2005)
ranged from 0.0 to 117.9 ppmv VOCs. Fourteen of 23 SVE wells had VOC concentrations
detectable with a PID, and 15 of 28 VM wells had detectable VOC concentrations. Post-
treatment laboratory results for samples from the five wells with the highest PID measurements
ranged from 2 to 97 ppmv TCE. The five wells with the highest PID measurements were
IR10VW012A, IR10VW021A, IR10SG041-5, IR10SG045-10, and IR10SG074-4. The results
of the pre- and post-treatment PID monitoring are included in Table 9. The laboratory results are
presented in Table 10.
Final SVE TS Rpt 27

Final Phase III Soil Vapor Extraction Treatability Study Report Building 123, Parcel B
Hunters Point Shipyard, San Francisco, California
8.0 PHASE III SVE TS DATA EVALUATION
This section discusses the evaluation conducted on the data collected during the Phase III SVE
TS:
• Section 8.1 discusses SVE system yield of TCE mass calculated from the results of PID monitoring and laboratory analyses;
• Section 8.2 presents the calculation of extracted vapor abatement efficiency based on PID monitoring and laboratory analyses at the GAC vessels;
• Section 8.3 discusses the Reduction of TCE concentrations based on pre- and post-treatment data;
• Section 8.4 discusses the distribution of post-treatment TCE concentrations in soil gas based on PID monitoring.
8.1 SVE SYSTEM YIELD The amount of TCE removed by the Phase III SVE TS system was calculated based on three different data sets: (1) monitoring concentrations of the combined system influent with a PID, (2) collecting samples of the combined system influent for laboratory analyses, and (3) monitoring concentrations at individual SVE wells with a PID. The VOC concentrations of extracted soil vapor were monitored periodically using a PID at the combined SVE system influent and at the individual extraction wells. Samples of the combined system influent were also collected for laboratory analyses on a monthly basis. The system yield based on PID measurements at the individual SVE wells is most relevant. The system yield based on PID measurements at the combined system influent is low because VOC concentrations dropped below the detection level of the PID after five days of operation. The system yield based on laboratory results is also low because of dilution by extracted air from several wells with no measurable TCE concentrations. The yield at the combined system influent is included to evaluate extracted vapor treatment through the GAC units. The following subsections describe the yield calculations for each of the data sets.
8.1.1 System Yield Based on Individual Extraction Well Monitoring with PID During the Phase III SVE TS, the yield at the 23 individual SVE wells was monitored using a
PID. The SVE System yield based on PID monitoring was calculated using the following
equation:
Final SVE TS Rpt 28

Final Phase III Soil Vapor Extraction Treatability Study Report Building 123, Parcel B
Hunters Point Shipyard, San Francisco, California
[ ] dayMinutes
ftmolelbQMWft
ftPIDYield 144000259.010 33
36 ∗⎟
⎠⎞
⎜⎝⎛ −∗∗∗∗= −
µWhere:
Yield = System yield (in lbs/day) [PID] = VOC concentration measured by PID (in ppmv or µft3/ft3) MW = Molecular weight (131.5 lb TCE/lb-mole) Q = Flow (in scfm) ft3/lb-mole = cubic feet per pound mole (conversion)
The PID monitoring results at individual SVE wells indicate the combined yield rate of the SVE
system ranged from 0.0013 to 0.068 lbs/day. The cumulative yield of the SVE system based on
the total of the yield calculations for all individual wells was 9.7 pounds (calculated as TCE).
The greatest calculated individual well yield was observed at SVE well IR10VW-23A. Table 3
presents the summary of yield calculations at individual wells based on PID monitoring. System
monitoring logs are contained in Appendix D.
8.1.2 System Yield Based on PID Monitoring The total SVE System yield based on PID monitoring was calculated using the equation presented in Section 8.1.1. The PID monitoring results indicate the initial (maximum) yield rate of the SVE system was 0.50 pounds per day (lbs/day). After five days of operation, the combined system influent VOC concentrations decreased below the detection level of the PID. The cumulative yield of the Phase III SVE TS system calculated using PID concentrations was 0.55 pounds (calculated as TCE). Table 7 presents the results of PID system monitoring and yield calculations. System monitoring logs are contained in Appendix D.
8.1.3 System Yield Based on Laboratory Sample Analyses The total system yield based on laboratory results was calculated using the following equation:
[ ] dayMinutes
ftL
glbQg
gTCEYield 14403.280022.010 36 ∗∗∗∗∗= −
µ
Where:
Yield = System yield (in lbs/day) [TCE] = TCE concentration from laboratory analysis (in µg/L) Q = Flow (in scfm)
The laboratory results of samples of the combined system influent indicate the initial (maximum)
TCE yield rate of the SVE system was 0.44 lbs/day. During SVE system operation the TCE
yield rate ranged from 0.033 to 0.44 lbs/day. The cumulative TCE yield of the SVE system
Final SVE TS Rpt 29

Final Phase III Soil Vapor Extraction Treatability Study Report Building 123, Parcel B
Hunters Point Shipyard, San Francisco, California
based on combined system influent sample results was 22.8 pounds. Table 8 presents the results
of system monitoring and yield calculations based on laboratory results of combined system
influent sampling. System monitoring logs are contained in Appendix D.
8.2 EXTRACTED SOIL VAPOR TREATMENT
Extracted soil vapor was treated with GAC. During SVE system operations, extracted vapor
treatment efficiency of the GAC vessels was monitored weekly with a PID. In addition,
laboratory samples were collected on a monthly basis. Based on PID monitoring, vapor
abatement efficiency of the GAC vessels was 100%. The laboratory results indicated vapor
abatement efficiency ranged from 87% to 100%. Although the abatement efficiency was less
than 90% for two of six sampling events, the vapor abatement efficiency of the GAC vessels met
the requirements of Bay Area Air Quality Management District (BAAQMD) Regulation 8 Rule
47 because the emission rate was less than one pound per day as provided in Regulation 8 Rule
47-113 (BAAQMD, 2005). The calculated emission rate of the extracted vapor ranged from 0
lbs/day to 0.5 lbs/day as measured with a PID, or 0.033 lbs/day to 0.44 lbs/day based on
laboratory results. Table 7 presents the vapor abatement efficiency and emission rates based on
PID monitoring. Table 8 presents the vapor abatement efficiency and emission rates based on
samples submitted for laboratory analyses.
8.3 REDUCTION OF VOC CONCENTRATIONS The concentrations of VOCs at the SVE wells and VM wells were measured using a PID before Phase III SVE TS system startup, after SVE system shutdown, and approximately three months after system shutdown (Table 9). The following subsections describe the reduction of TCE concentrations measured at the site.
8.3.1 VOC Reduction During Phase III SVE TS The results of PID monitoring indicated an average reduction of VOC concentrations of 99.7%
during the Phase III SVE TS from June 15 to September 13, 2005. The percent reduction in
individual wells ranged from 91.4% to 100%. VOC concentrations were reduced below the
detection level of the PID in 22 of 23 SVE wells and 13 of 15 VM wells at the time of the Phase
III SVE TS system shutdown on September 13, 2005.
The VOC concentrations were allowed to rebound from September 13 to December 30, 2005.
Rebound of VOC concentrations was observed in 14 of 23 SVE wells and 13 of 26 VM wells
Final SVE TS Rpt 30

Final Phase III Soil Vapor Extraction Treatability Study Report Building 123, Parcel B
Hunters Point Shipyard, San Francisco, California
that had initial detectable concentrations of VOCs. In three SVE wells, IR10VW009A,
IR10VW010A, and IR10VW12A, and four VM wells, IR10SG42-10, IR10SG45-10, IR10SG75-
4, IR10SG75-6, VOC concentrations rebounded above initial Phase III SVE TS VOC
concentrations. The rebound of VOC concentrations measured at the site after shutdown of the
TS system is likely from VOCs diffusing from less permeable soils located within the TS
treatment area. Rebound is also likely, to a lesser extent, from contaminated soil and soil gas
located outside the TS treatment area of influence, most notably near IR10SG-074-4 and
IR10SG-074-6.
VOCs rebounded on average to 68% of their initial concentrations. When the wells that
rebounded above their initial concentrations are excluded, the average rebound was only 23% of
initial Phase III SVE TS concentrations. When compared to the initial Phase III SVE TS
concentrations, the rebound concentrations showed an average reduction of 33% compared to
initial concentrations. When the seven wells that rebounded above their initial concentrations are
excluded, the average reduction of post rebound concentrations was 77%. Table 9, “Percent
Reduction of VOC Concentrations,” presents the comparison of pre- and post-Phase III SVE TS
VOC concentrations.
8.3.2 Overall VOC Reduction The final PID monitoring results of the Phase III SVE TS (after rebound) were compared to the
VOC concentrations measured with a PID before the start of the Phase II SVE TS to calculate
overall VOC reduction at the site. The average percent reduction of VOC concentrations was
99.0%. The percent reduction at the individual wells ranged from 90.0% to 100%. This
calculation does not include the 9 additional SVE wells and 6 pairs of VM wells, because they
had not been installed at the time of the Phase II SVE TS. Table 9 presents the calculation of
overall percent reduction of VOCs.
8.4 DISTRIBUTION OF POST-TREATMENT TCE CONCENTRATIONS IN SOIL GAS
The following subsections describe the calculations used to estimate TCE concentrations (in
µg/L) in soil gas using VOC concentrations from PID measurements expressed in ppmv. The
first calculation was to determine an average ratio between TCE concentrations (in µg/L) from
laboratory results and PID measurements in ppmv collected at the same sample location. The
Final SVE TS Rpt 31

Final Phase III Soil Vapor Extraction Treatability Study Report Building 123, Parcel B
Hunters Point Shipyard, San Francisco, California
ratio is applied to PID measurements from sample locations where no laboratory analysis was
conducted to estimate the concentration of TCE in µg/L in soil gas.
8.4.1 Collection of PID Measurements and Laboratory Samples for Comparison On January 18, 2005, before Phase III SVE TS system operation, the concentration of VOCs was
measured at all the wells at the site with a PID. On January 19, 2005, laboratory samples (pre-
treatment) were then collected from the five wells with the highest PID concentrations. Samples
were collected again after system shutdown. On December 30, 2005, PID measurements were
collected from all the wells. Laboratory samples (post-treatment) were collected on January 3,
2006, from the five wells with the highest PID concentrations. The laboratory samples were
collected in six liter SUMMA canisters and submitted, under chain-of-custody documentation, to
Air Toxics Laboratory in Chico, California for analyses for VOCs by EPA Method TO-14A.
The results of the PID monitoring and the corresponding laboratory results are presented in Table
11.
8.4.2 Ratio of Laboratory Results to PID Measurements The PID used during the Phase III SVE TS detects all VOCs with an ionization potential less than 11.2 electron-Volts, and therefore cannot identify the concentrations of individual compounds, such as TCE. However, for the Phase III SVE TS, the soil and soil gas laboratory results indicate that TCE is the most prevalent VOC present at the site. Based on evaluation of this data, it can be expected that the majority of what the PID measurements were detecting at this site was TCE. The concentrations of TCE detected in laboratory samples (in µg/L) were compared to the corresponding concentrations of VOCs detected with a PID (in ppmv) at a given sample point. The laboratory results were divided by their corresponding PID concentrations to determine the ratio at a given sample location. Ratios were calculated from laboratory results and PID measurements from three data sets:
• Laboratory samples and PID measurements taken from 14 SVE wells and 9 pairs of VM wells during the Confirmation Study (TtEMI, 2003);
• Laboratory samples collected from five wells based on PID measurements before construction of the Phase III TS system;
• Laboratory samples collected from five wells based on PID measurements after shutdown of the Phase III TS system.
For all data pairs, the TCE concentrations, in µg/L, detected in samples submitted for laboratory analyses were, on average, 6.0 times the concentration of VOCs detected with a PID. The
Final SVE TS Rpt 32

Final Phase III Soil Vapor Extraction Treatability Study Report Building 123, Parcel B
Hunters Point Shipyard, San Francisco, California
average laboratory to PID ratio was fairly consistent between the three data groups which ranged from 5.1 to 7.3. The overall range of laboratory to PID ratios from all three data sets was 0.3 to 39.3. The average ratio between laboratory results and PID measurements was only slightly greater than the average correlation factor between TCE laboratory results reported in µg/L and TCE laboratory results reported in ppmv (6.0 lab:PID vs 5.4 lab:lab). Table 10 presents the calculation of the individual and average correlation factors.
8.4.3 Correlation of Laboratory to PID Results The laboratory results were plotted against PID measurements. A best-fit regression line and a coefficient of determination (R2) were generated using Excel. The regression line was linear with a positive slope, which indicated a direct and linear relationship between the laboratory and PID data. R2 for the data set was 0.70, on a scale of 0 to 1.0, which indicates that although there is some scatter, the data tended to match the best-fit line. Figure 9 presents the plot of laboratory data and PID monitoring data as well as the regression line and the value of R2.
8.4.4 Estimation of TCE Concentrations from PID Measurements Using the average ratio described above, the concentrations of TCE in µg/L were estimated from
the results of the final full round of PID monitoring conducted on December 30, 2005. The
estimated TCE concentrations were calculated by multiplying PID monitoring results by the
average ratio of laboratory results to PID measurements.
The estimated TCE concentrations from the final PID monitoring event were compared to the
SFRWQCB Residential and Commercial/Industrial Shallow Soil Gas ESLs. The estimated TCE
concentrations indicated that TCE concentrations in 15 of 28 VM wells and 13 of 23 SVE wells
were below the detection level of the PID. Estimated TCE concentrations exceeded SFRWQCB
Residential and Commercial/Industrial Shallow Soil Gas ESLs in 13 of 28 VM wells and 10 of
23 SVE wells. Table 11 presents the estimated TCE concentrations from PID measurements
from the end of the Phase III SVE TS. Figure 10 shows the distribution of estimated residual
TCE concentrations in soil gas.
Final SVE TS Rpt 33

Final Phase III Soil Vapor Extraction Treatability Study Report Building 123, Parcel B
Hunters Point Shipyard, San Francisco, California
9.0 MANAGEMENT OF INVESTIGATION DERIVED WASTE
Investigation-derived waste (IDW) generated during Phase III SVE TS consisted of solid wastes
and liquid waste. Investigation-derived waste was segregated at the site according to matrix
(solid or liquid). Each container holding potentially contaminated materials was labeled with site
identification and other pertinent information to aid in the appropriate handling of the materials.
In addition, asbestos containing material (ACM) was identified in the ceiling materials inside
Building 123 and was removed to mitigate potential site worker exposure to ACM from falling
ceiling materials. The following subsections outline the handling and disposition of the IDW
and ACM waste. Waste disposal documentation is presented in Appendix E.
9.1 SOLID WASTE Solid waste generated from Phase III SVE TS activities included:
• Soil cuttings from drilling and well installation activities;
• Granular activated carbon;
• Miscellaneous trash, discarded personal protective equipment (PPE), and disposable sampling equipment (e.g, tubing).
Soil cuttings from drilling activities were collected and transferred into United Nations (UN)
approved 55-gallon drums. A total of 15 drums of waste soil were generated from drilling
activities. The drums were temporarily stored inside Building 123. The GAC used to treat the
soil gas extracted by the SVE TS system was contained in two process vessels that held 1,000
pounds of GAC each. Miscellaneous trash, used disposable PPE (such as gloves and wipes) and
disposable sampling equipment generated during the project were not considered hazardous
waste. This material was bagged and disposed of as non-hazardous municipal waste in
dumpsters at HPS.
9.2 LIQUID WASTE Liquid waste (water) generated during Phase III SVE TS system operation activities were
contained in a 1,000 gallon polyethylene tank inside Building 123. Approximately 75 gallons of
water was extracted by the SVE system. This water was transferred to two UN-approved 55-
gallon drums for transportation and disposal.
Final SVE TS Rpt 34

Final Phase III Soil Vapor Extraction Treatability Study Report Building 123, Parcel B
Hunters Point Shipyard, San Francisco, California
9.3 WASTE CHARACTERIZATION Samples were collected from each of the waste streams (waste soil, liquid waste, and waste
GAC) for characterization for proper transportation and disposal. Two composite soil samples
were collected from the drums of waste soil; one sample of the waste liquid was collected from
the polyethylene tank; and one sample of the waste GAC was collected from the primary GAC
vessel. All waste characterization samples were collected in laboratory-supplied containers and
placed on ice in coolers and maintained at approximately 4 degrees Celsius (°C) until transferred
to the laboratory courier under chain-of-custody protocol. The waste soil and liquid
characterization samples were submitted to Curtis & Tompkins Laboratory in Berkeley,
California, for the following analytical suites by the following methods:
• VOCs by U.S. EPA Method 8260B;
• California Title 22 Metals (antimony, arsenic, barium, beryllium, cadmium, chromium, cobalt, copper, lead, mercury, molybdenum, nickel, selenium, silver, thallium, vanadium, and zinc [CAM 17 metals]), by U.S. EPA Methods 6010B and 7471A.
The waste GAC characterization sample was submitted to Calgon Carbon Corporation
Laboratory for carbon acceptance analysis. The laboratory results for all the waste
characterization analyses are provided in Appendix C.
9.4 TRANSPORTATION AND DISPOSAL Onyx Environmental Services was retained to remove the waste soil and waste liquid from the
site and transport it to an appropriate disposal and/or treatment facility. Based on the waste
characterization analyses, the waste soil was classified as hazardous. The waste liquid was
classified as non-hazardous liquid.
A total of 15 drums of solid waste (soil) were removed from the site on November 10, 2005, by
Onyx Environmental Services and transported under manifest to Onyx Environmental Services,
LLC, in Azusa, California, for disposal. Two drums of liquid waste were removed from the site
on May 25, 2006, by Onyx Environmental Services and transported under manifest to Onyx
Environmental Services, LLC, in Azusa, California, for treatment and disposal. Copies of the
waste profiles and the transportation manifests are provided in Appendix F.
Final SVE TS Rpt 35

Final Phase III Soil Vapor Extraction Treatability Study Report Building 123, Parcel B
Hunters Point Shipyard, San Francisco, California
Calgon Carbon Corporation was retained to remove the waste GAC from the site and transport it
to an appropriate recycling facility. Based on the waste characterization analyses, the waste
GAC was classified as non-hazardous. The two GAC vessels were removed from the site under
manifest on April 11, 2006, by Calgon Carbon Corporation and the 2,000 pounds of GAC was
reactivated (recycled) by incineration. The vessels will be cleaned and reused. A copy of the
waste manifest for GAC reactivation is included in Appendix F.
9.5 ASBESTOS CONTAINING MATERIALS ACM was identified in the ceiling materials inside Building 123. Rain water and animals
(pigeons) nesting in the insulation above the ceiling were causing portions of the ACM ceiling to
fall at various times during the Phase III SVE TS. From October 25, 2004, to October 26, 2004,
Sterling Environmental, a certified asbestos abatement contractor, removed a portion of the
ceiling located in the northeast portion of Building 123 to mitigate potential site worker exposure
to ACM from falling ceiling materials. Acumen Industrial Hygiene was retained to conduct the
independent asbestos clearance inspection on October 26, 2004. The results of the personnel and
air clearance monitoring and the independent inspection indicated the ACM ceiling was
successfully abated. On October 26, 2004, approximately one cubic yard of ACM waste was
transported under manifest by Sterling Environmental to NWS Hay Road Landfill in Vacaville,
California, for disposal. Appendix F contains a photographic log of the abatement activities,
documentation of testing and field activities, and independent inspection reports.
Final SVE TS Rpt 36

Final Phase III Soil Vapor Extraction Treatability Study Report Building 123, Parcel B
Hunters Point Shipyard, San Francisco, California
10.0 QUALITY CONTROL SUMMARY REPORT
ITSI prepared a Quality Control Summary Report (QCSR) that reviews and summarizes the data
collection activities during implementation of the Phase III SVE TS. The QCSR summarizes the
findings of individual data validation efforts for samples collected in conformity with the
activities described in the Work Plan (ITSI, 2004). For Phase III SVE TS, the QCSR determined
that the overall data quality is acceptable and meets the data quality objectives for this project.
Based on this review, the data collected are usable for their intended purposes. The QCSR in
included as Appendix G.
Final SVE TS Rpt 37
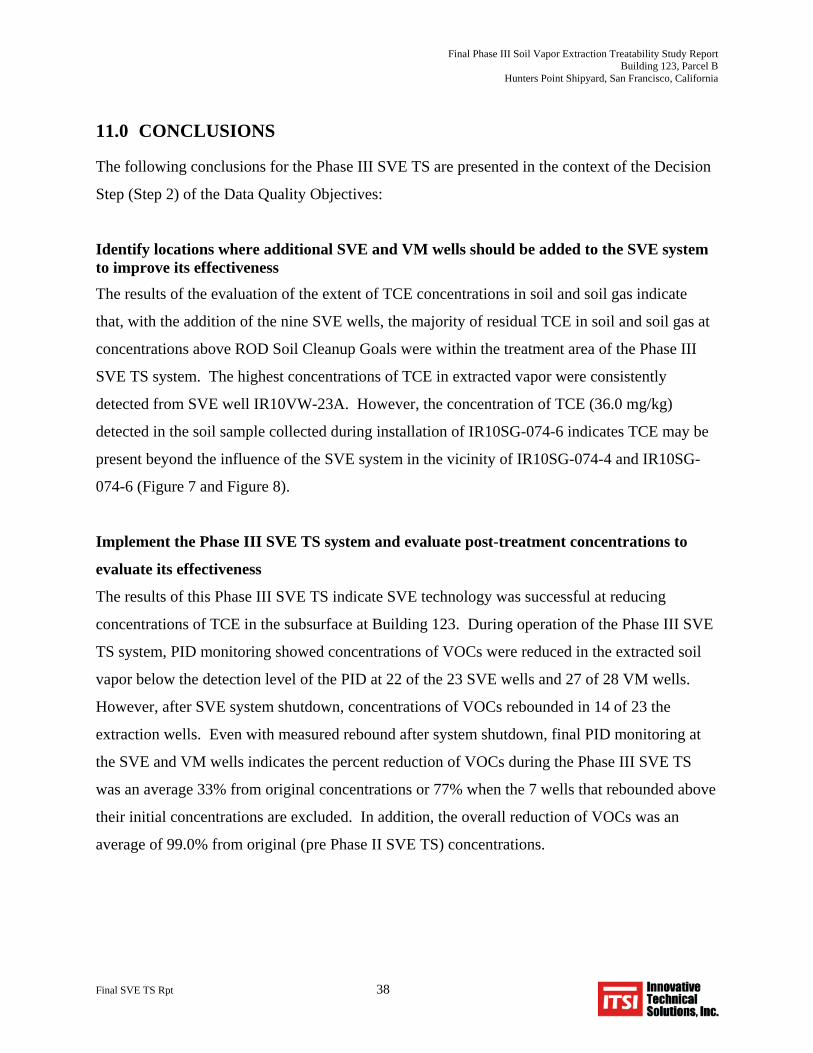
Final Phase III Soil Vapor Extraction Treatability Study Report Building 123, Parcel B
Hunters Point Shipyard, San Francisco, California
11.0 CONCLUSIONS
The following conclusions for the Phase III SVE TS are presented in the context of the Decision
Step (Step 2) of the Data Quality Objectives:
Identify locations where additional SVE and VM wells should be added to the SVE system to improve its effectiveness The results of the evaluation of the extent of TCE concentrations in soil and soil gas indicate
that, with the addition of the nine SVE wells, the majority of residual TCE in soil and soil gas at
concentrations above ROD Soil Cleanup Goals were within the treatment area of the Phase III
SVE TS system. The highest concentrations of TCE in extracted vapor were consistently
detected from SVE well IR10VW-23A. However, the concentration of TCE (36.0 mg/kg)
detected in the soil sample collected during installation of IR10SG-074-6 indicates TCE may be
present beyond the influence of the SVE system in the vicinity of IR10SG-074-4 and IR10SG-
074-6 (Figure 7 and Figure 8).
Implement the Phase III SVE TS system and evaluate post-treatment concentrations to
evaluate its effectiveness
The results of this Phase III SVE TS indicate SVE technology was successful at reducing
concentrations of TCE in the subsurface at Building 123. During operation of the Phase III SVE
TS system, PID monitoring showed concentrations of VOCs were reduced in the extracted soil
vapor below the detection level of the PID at 22 of the 23 SVE wells and 27 of 28 VM wells.
However, after SVE system shutdown, concentrations of VOCs rebounded in 14 of 23 the
extraction wells. Even with measured rebound after system shutdown, final PID monitoring at
the SVE and VM wells indicates the percent reduction of VOCs during the Phase III SVE TS
was an average 33% from original concentrations or 77% when the 7 wells that rebounded above
their initial concentrations are excluded. In addition, the overall reduction of VOCs was an
average of 99.0% from original (pre Phase II SVE TS) concentrations.
Final SVE TS Rpt 38

Final Phase III Soil Vapor Extraction Treatability Study Report Building 123, Parcel B
Hunters Point Shipyard, San Francisco, California
12.0 RECOMMENDATIONS
Based on the results of the Phase III SVE TS and previous investigations conducted at Building
123, IR-10, Parcel B, Hunters Point Shipyard, the following are the recommendations for the
site:
1) SVE technology is recommended for inclusion as a remedial alternative for consideration as a final remedy for the site in the Technical Memorandum in Support of the ROD Amendment (SulTech, 2006), which is currently in the draft phase.
2) Soil gas samples should be collected to verify TCE concentrations in soil and estimate mass of TCE remaining beneath Building 123 before future operation of the SVE unit.
3) Additional extraction wells are recommended to reduce TCE concentrations near IR10SG-074 and IR10VW-23A as indicated by the TCE concentrations detected in soil and soil gas samples collected from these locations.
4) During future operation, extraction should be focused in areas with the highest residual TCE concentrations. Groups of SVE wells should be converted to passive injection wells to facilitate airflow in areas of little to no airflow that occur between extraction wells. An alternating pattern (e.g, extraction-passive injection-extraction) is optimal. In addition, different operational configurations of wells should be implemented over time (e.g, extraction-injection to injection-extraction) to target different areas of little to no airflow. As previously recommended in the CS (TtEMI, 2003), active injection of ambient air at selected SVE wells is also recommended at the site. Active injection creates a greater pressure gradient between an injection well and extraction well as compared to the pressure gradient developed around a passive injection well. The greater pressure gradient facilitates more airflow through less permeable (diffusion limited) soils.
5) Future operation of the SVE system should be in a pulsed mode. The system should be operated for short periods of time (one to two weeks), and then turned off for periods of time (two to four weeks or more) to allow TCE concentrations to rebound from the less permeable (diffusion limited) soils. This will maximize contaminant removal while minimizing costs to operate equipment.
6) For future SVE operations, laboratory analyses of soil gas samples rather than PID monitoring is recommended to evaluate SVE effectiveness at reducing TCE concentrations. A PID can be used initially to monitor continued SVE effectiveness; however, residual TCE concentrations are likely to drop below the detection level of the PID (0.1 to 1.0 ppmv).
7) Once soil gas sampling indicates concentrations of TCE in soil gas reach an asymptotic concentration, soil samples should be collected to confirm TCE concentrations in soil have been reduced to below ROD Soil Cleanup Goals.
Final SVE TS Rpt 39

Final Phase III Soil Vapor Extraction Treatability Study Report Building 123, Parcel B
Hunters Point Shipyard, San Francisco, California
13.0 REFERENCES
Bay Area Air Quality Management District, 2005, Regulation 8, Rule 47, Air Stripping and Soil Vapor Extraction Operations, June 15.
Dames and Moore,1943a. “Report of Foundation Investigation, Submarine Repair Base, Naval Dry Docks, Hunters Point, California.” Prepared for United States Naval Dry Docks, Contract NOy-5377.
Dames and Moore,1943b. “Report of Subsidence and Foundation Investigation, Battery Overhaul Building, Submarine Repair Base, Naval Dry Docks, Hunters Point, California.” Prepared for United States Naval Dry Docks, Contract NOy-5125.
Department of Toxic Substances Control and California Regional Water Quality Control Board – Los Angeles Region, 2003. “Advisory – Active Soil Gas Investigations.” January 28.
IT Corporation (IT), 2002. “Phase II Soil Vapor Extraction Treatability Study Report, Building 123, IR-10, Parcel B, Hunters Point Shipyard, San Francisco, California,” February 14.
Innovative Technical Solutions, Inc., 2004. “Work Plan Phase III Soil Vapor Extraction Treatability Study, Parcel B, Hunters Point Naval Shipyard, San Francisco, California.” April.
PRC Environmental Management, Inc., 1996. “Draft Final Parcel B Remedial Investigation Report, Hunters Point Shipyard, San Francisco, California.” June 3.
San Francisco Regional Water Quality Control Board, 2004. “Screening For Environmental Concerns at Sites With Contaminated Soil and Groundwater (Interim Final – July 2003, updated February 2004).” February.
Sultech, 2006. “Draft Technical Memorandum in Support of a Record of Decision Amendment, Hunters Point Naval Shipyard, San Francisco, California.” March 28.
Tetra Tech EM, Incorporated, (TtEMI) 2001. “Final Parcel B Petroleum Hydrocarbons Corrective Action Plan, Hunters Point Shipyard, San Francisco, California.” January 10.
TtEMI, 2003. “Internal Final Soil Vapor Extraction Confirmation Study, Building 123, Installation Restoration Site 10, Parcel B, Hunters Point Shipyard, San Francisco, California.” April 10.
United States Department of the Navy, Engineering Field Activity West, Naval Facilities Engineering Command (U.S. Navy) 1997. “Hunters Point Shipyard, Parcel B Final Record of Decision,” October 7.
U.S. Department of Navy, Naval Facilities Engineering Command, Southwest Division (Navy), 1998. “Procedural Guidance for Statistically Analyzing Environmental Background Data.” San Diego, California.
Navy, 1999. “Handbook for Statistical Analysis of Environmental Background Data.” San Diego, California. July
United States Environmental Protection Agency (U.S. EPA) 1994. “Statistical Methods for Evaluating the Attainment of Cleanup Standards, Volume 3: Reference-Based Standards
Final SVE TS Rpt 40

Final Phase III Soil Vapor Extraction Treatability Study Report Building 123, Parcel B
Hunters Point Shipyard, San Francisco, California
for Soils and Solid Media.” Office of Environmental Information. Washington D.C. EPA/230/R-94/004. 1994.
U.S. EPA 2000. “Data Quality Objectives Process for Hazardous Waste Site Investigations, (EPA QA/G-4HW).” Office of Environmental Information. Washington D.C. EPA/600/R-00/007. January.
Wahrhaftig, C., and Sloan, D. 1989. “Geology of San Francisco and Vicinity: International Geologic Congress, 28th.” Field Trip Guidebook T105. Washington, DC. July 1-7.
Final SVE TS Rpt 41

TABLES

Table 1: Chronology of Building 123 SVE ActivitiesPhase III SVE Treatability StudyBuilding 123, Parcel B, Hunters Point ShipyardSan Francisco, California
Date Activity Number Analysis Wells Sampled/Operated
September 26, 2000 through
October 3, 2000
Initial soil gas survey at 14 SVE and 9 VM well locations
(samples at 5 depths per location)115 VOCs by mobile
laboratoryIR10VW01A through IR10VW14A; and IR10SG039 through IR10SG047
September 26, 2000 through
October 3, 2000Soil sampling of SVE and VM wells 44 VOCs
IR10VW01A through IR10VW14A; and IR10SG039 (5 and 10 feet) through IR10SG047 (5 and 10 feet)
September 26, 2000 through
October 3, 2000Soil sampling of SVE and VM wells 39 geotechnical
parameters
IR10VW01A through IR10VW14A; and IR10SG039 (5 and 10 feet) through IR10SG047 (5 and 10 feet)
September 27, 2000 through
October 4, 2000Installation of 14 SVE wells 14 N/A IR10VW01A through IR10VW14A
September 27, 2000 through
October 4, 2000
Installation of 9 clustered pairs of VM wells (18 total VM wells) 18 N/A IR10SG039 (5 and 10 feet) through
IR10SG047 (5 and 10 feet)
November 20, 2000 Baseline PID measurements of SVE wells 32 PIDIR10VW01A through IR10VW14A; and IR10SG039 (5 and 10 feet) through IR10SG047 (5 and 10 feet)
December 6, 2000 PID measurements at SVE wells during system startup 32 PID
IR10VW01A through IR10VW14A; and IR10SG039 (5 and 10 feet) through IR10SG047 (5 and 10 feet)
June 1, 2001 PID measurements at Phase II SVE TS system shutdown 32 PID
IR10VW01A through IR10VW14A; and IR10SG039 (5 and 10 feet) through IR10SG047 (5 and 10 feet)
August 13, 2001 PID measurements after 2 months of rebound monitoring 32 PID
IR10VW01A through IR10VW14A; and IR10SG039 (5 and 10 feet) through IR10SG047 (5 and 10 feet)
August 13, 2001 Soil gas sampling from 3 locations with the highest PID measurements 3 VOCs IR10SG042-10ft, IR10SG043-10ft, and IR10VW012A
September 10 through September 13, 2002 Installation of 22 soil borings 22 N/A IR10GB001 through IR10GB022
September 10 through September 13, 2002
Soil sampling (two samples from each soil boring) 44 VOCs IR10GB001 through IR10GB022
September 13, 2002 PID measurements of 14 Phase II SVE wells and 18 Phase II VM wells 32 PID
IR10VW01A through IR10VW14A; and IR10SG039 (5 and 10 feet) through IR10SG047 (5 and 10 feet)
September 11 through September 16, 2002
Soil gas sampling of 14 Phase II SVE wells and 18 Phase II VM wells 32 VOCs
IR10VW01A through IR10VW14A; and IR10SG039 (5 and 10 feet) through IR10SG047 (5 and 10 feet)
January 13 and January 14, 2005
Installation of 18 temporary soil gas sampling probes 18 N/A IR10SG048 through IR10SG065
January 13 and January 14, 2005
Soil sampling of temporary soil gas sampling probes 18 VOCs IR10SG048 through IR10SG065
January 17, 2005 Soil gas sampling of temporary soil sampling probes 18 VOCs IR10SG048 through IR10SG065
January 19, 2005 PID measurements of Phase II TS SVE wells and VM wells 32 PID 14 SVE wells and 18 VM wells
January 19, 2005 Soil gas sampling from 5 locations with the highest PID measurements 5 VOCs IR10SG041-10ft, IR10SG045-10ft, IR10SG047-5ft,
IR10VW008A, and IR10VW012A
March 23, 2005 Installation of 6 additional temporary soil gas sampling probes. 6 N/A IR10SG066 through IR10SG071
March 23, 2005 Soil sampling of additional temporary soil gas sampling probes 6 VOCs IR10SG066 thorugh IR10SG071.
March 24, 2005 Soil gas sampling of additional temporary soil sampling probes 6 VOCs IR10SG066 thorugh IR10SG071.
May 18 through May 20, 2005 Installation of 9 SVE wells 9 N/A IR10VW15A through IR10VW23A
May 18 through May 23, 2005
Installation of 6 clustered pairs of VM wells (12 total VM wells) 12 N/A IR10SG072 through IR10SG077
(two depths at each location)
May 18 through May 23, 2005 Soil sampling of SVE and VM wells 18 VOCs SVE Wells: IR10VW15A through IR10VW23A
VM Wells: IR10SG072 through IR10SG077
May 18 through May 23, 2005 Soil sampling of SVE and VM wells 36 geotechnical
parameters SVE Wells: IR10VW15A through IR10VW23A VM Wells: IR10SG072 through IR10SG077
May 23 through June 14, 2005
Pha
se II
I SV
E T
reat
abilit
y S
tudy
Phase III SVE system construction
Pha
se II
SV
E T
S S
tudy
(IT,
200
2)S
VE
Con
firm
atio
n S
tudy
(TtE
MI,
2003
)Fu
rther
eva
luat
ion
of th
e ex
tent
of T
CE
in s
oil a
nd s
oil g
asP
hase
III S
VE
TS
Sys
tem
Con
stru
ctio
n
Table 1 Chronology Page 1 of 2
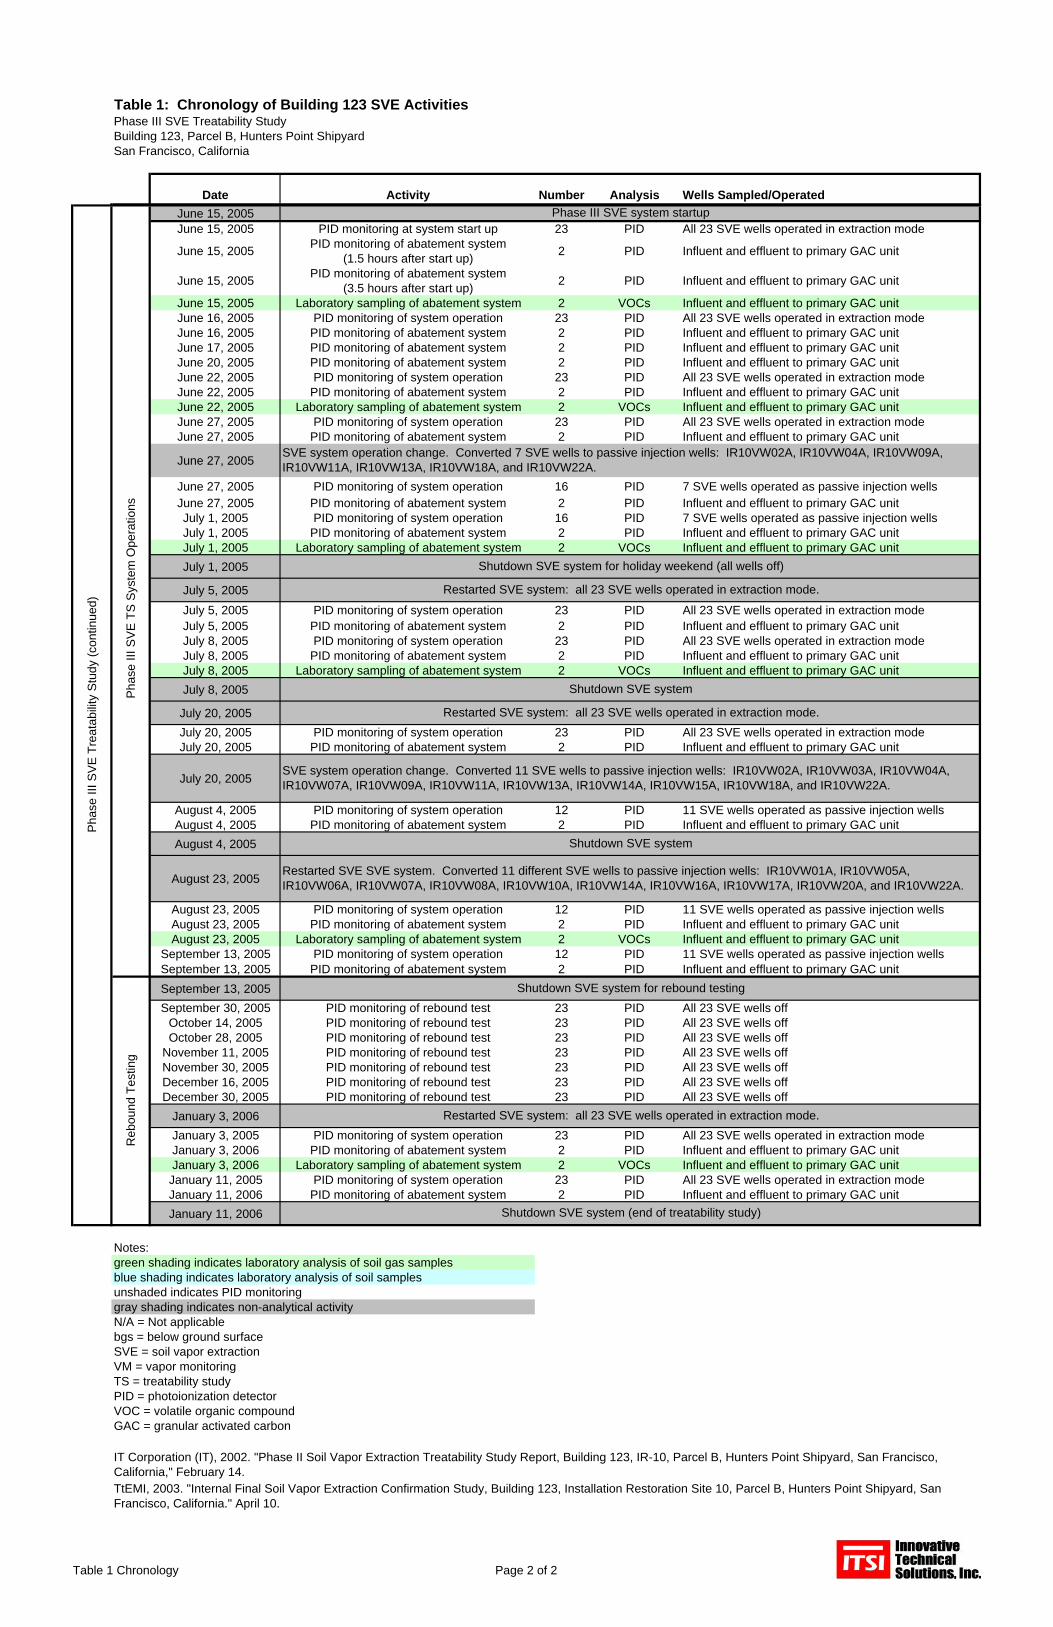
Table 1: Chronology of Building 123 SVE ActivitiesPhase III SVE Treatability StudyBuilding 123, Parcel B, Hunters Point ShipyardSan Francisco, California
Date Activity Number Analysis Wells Sampled/OperatedJune 15, 2005June 15, 2005 PID monitoring at system start up 23 PID All 23 SVE wells operated in extraction mode
June 15, 2005 PID monitoring of abatement system (1.5 hours after start up) 2 PID Influent and effluent to primary GAC unit
June 15, 2005 PID monitoring of abatement system (3.5 hours after start up) 2 PID Influent and effluent to primary GAC unit
June 15, 2005 Laboratory sampling of abatement system 2 VOCs Influent and effluent to primary GAC unitJune 16, 2005 PID monitoring of system operation 23 PID All 23 SVE wells operated in extraction modeJune 16, 2005 PID monitoring of abatement system 2 PID Influent and effluent to primary GAC unitJune 17, 2005 PID monitoring of abatement system 2 PID Influent and effluent to primary GAC unitJune 20, 2005 PID monitoring of abatement system 2 PID Influent and effluent to primary GAC unitJune 22, 2005 PID monitoring of system operation 23 PID All 23 SVE wells operated in extraction modeJune 22, 2005 PID monitoring of abatement system 2 PID Influent and effluent to primary GAC unitJune 22, 2005 Laboratory sampling of abatement system 2 VOCs Influent and effluent to primary GAC unitJune 27, 2005 PID monitoring of system operation 23 PID All 23 SVE wells operated in extraction modeJune 27, 2005 PID monitoring of abatement system 2 PID Influent and effluent to primary GAC unit
June 27, 2005
June 27, 2005 PID monitoring of system operation 16 PID 7 SVE wells operated as passive injection wellsJune 27, 2005 PID monitoring of abatement system 2 PID Influent and effluent to primary GAC unitJuly 1, 2005 PID monitoring of system operation 16 PID 7 SVE wells operated as passive injection wellsJuly 1, 2005 PID monitoring of abatement system 2 PID Influent and effluent to primary GAC unitJuly 1, 2005 Laboratory sampling of abatement system 2 VOCs Influent and effluent to primary GAC unitJuly 1, 2005
July 5, 2005July 5, 2005 PID monitoring of system operation 23 PID All 23 SVE wells operated in extraction modeJuly 5, 2005 PID monitoring of abatement system 2 PID Influent and effluent to primary GAC unitJuly 8, 2005 PID monitoring of system operation 23 PID All 23 SVE wells operated in extraction modeJuly 8, 2005 PID monitoring of abatement system 2 PID Influent and effluent to primary GAC unitJuly 8, 2005 Laboratory sampling of abatement system 2 VOCs Influent and effluent to primary GAC unitJuly 8, 2005
July 20, 2005July 20, 2005 PID monitoring of system operation 23 PID All 23 SVE wells operated in extraction modeJuly 20, 2005 PID monitoring of abatement system 2 PID Influent and effluent to primary GAC unit
July 20, 2005
August 4, 2005 PID monitoring of system operation 12 PID 11 SVE wells operated as passive injection wellsAugust 4, 2005 PID monitoring of abatement system 2 PID Influent and effluent to primary GAC unitAugust 4, 2005
August 23, 2005
August 23, 2005 PID monitoring of system operation 12 PID 11 SVE wells operated as passive injection wellsAugust 23, 2005 PID monitoring of abatement system 2 PID Influent and effluent to primary GAC unitAugust 23, 2005 Laboratory sampling of abatement system 2 VOCs Influent and effluent to primary GAC unit
September 13, 2005 PID monitoring of system operation 12 PID 11 SVE wells operated as passive injection wellsSeptember 13, 2005 PID monitoring of abatement system 2 PID Influent and effluent to primary GAC unitSeptember 13, 2005September 30, 2005 PID monitoring of rebound test 23 PID All 23 SVE wells off
October 14, 2005 PID monitoring of rebound test 23 PID All 23 SVE wells offOctober 28, 2005 PID monitoring of rebound test 23 PID All 23 SVE wells off
November 11, 2005 PID monitoring of rebound test 23 PID All 23 SVE wells offNovember 30, 2005 PID monitoring of rebound test 23 PID All 23 SVE wells offDecember 16, 2005 PID monitoring of rebound test 23 PID All 23 SVE wells offDecember 30, 2005 PID monitoring of rebound test 23 PID All 23 SVE wells off
January 3, 2006January 3, 2005 PID monitoring of system operation 23 PID All 23 SVE wells operated in extraction modeJanuary 3, 2006 PID monitoring of abatement system 2 PID Influent and effluent to primary GAC unitJanuary 3, 2006 Laboratory sampling of abatement system 2 VOCs Influent and effluent to primary GAC unitJanuary 11, 2005 PID monitoring of system operation 23 PID All 23 SVE wells operated in extraction modeJanuary 11, 2006 PID monitoring of abatement system 2 PID Influent and effluent to primary GAC unitJanuary 11, 2006
Notes:green shading indicates laboratory analysis of soil gas samplesblue shading indicates laboratory analysis of soil samplesunshaded indicates PID monitoringgray shading indicates non-analytical activityN/A = Not applicablebgs = below ground surfaceSVE = soil vapor extractionVM = vapor monitoringTS = treatability studyPID = photoionization detectorVOC = volatile organic compoundGAC = granular activated carbon
Pha
se II
I SV
E T
reat
abilit
y St
udy
(con
tinue
d)
SVE system operation change. Converted 7 SVE wells to passive injection wells: IR10VW02A, IR10VW04A, IR10VW09A, IR10VW11A, IR10VW13A, IR10VW18A, and IR10VW22A.
Shutdown SVE system for holiday weekend (all wells off)
Restarted SVE system: all 23 SVE wells operated in extraction mode.
Shutdown SVE system
Restarted SVE system: all 23 SVE wells operated in extraction mode.
Shutdown SVE system for rebound testing
Restarted SVE system: all 23 SVE wells operated in extraction mode.
Shutdown SVE system (end of treatability study)
Phase III SVE system startup
TtEMI, 2003. "Internal Final Soil Vapor Extraction Confirmation Study, Building 123, Installation Restoration Site 10, Parcel B, Hunters Point Shipyard, San Francisco, California." April 10.
IT Corporation (IT), 2002. "Phase II Soil Vapor Extraction Treatability Study Report, Building 123, IR-10, Parcel B, Hunters Point Shipyard, San Francisco, California," February 14.
Pha
se II
I SV
E T
S S
yste
m O
pera
tions
SVE system operation change. Converted 11 SVE wells to passive injection wells: IR10VW02A, IR10VW03A, IR10VW04A, IR10VW07A, IR10VW09A, IR10VW11A, IR10VW13A, IR10VW14A, IR10VW15A, IR10VW18A, and IR10VW22A.
Shutdown SVE system
Reb
ound
Tes
ting
Restarted SVE SVE system. Converted 11 different SVE wells to passive injection wells: IR10VW01A, IR10VW05A, IR10VW06A, IR10VW07A, IR10VW08A, IR10VW10A, IR10VW14A, IR10VW16A, IR10VW17A, IR10VW20A, and IR10VW22A.
Table 1 Chronology Page 2 of 2

TABLE 2: Summary of Well and Temporary Soil Gas Probe ConstructionPhase III SVE Treatability StudyBuilding 123, Parcel B, Hunters Point ShipyardSan Francisco, California
Northing EastingTop of Casing
Ground Surface
IR10VW-01A 9/27/2000 Phase II SVE TS 10 10 2.0-10 1.5-10 1.0-1.5 0-1.0 4 8 453425.45 1460824.68 NA 14.25IR10VW-02A 9/26/2000 Phase II SVE TS 10 10 2.0-10 1.5-10 1.0-1.5 0-1.0 4 8 453428.67 1460841.32 NA 14.24IR10VW-03A 9/26/2000 Phase II SVE TS 10 10 2.0-10 1.5-10 1.0-1.5 0-1.0 4 8 453405.71 1460807.72 NA 14.32IR10VW-04A 9/26/2000 Phase II SVE TS 10 10 2.0-10 1.5-10 1.0-1.5 0-1.0 4 8 453413.02 1460827.29 NA 14.20IR10VW-05A 9/26/2000 Phase II SVE TS 10 10 2.0-10 1.5-10 1.0-1.5 0-1.0 4 8 453412.51 1460838.39 NA 14.18IR10VW-06A 9/28/2000 Phase II SVE TS 10 10 2.0-10 1.5-10 1.0-1.5 0-1.0 4 8 453417.80 1460859.21 NA 14.35IR10VW-07A 9/26/2000 Phase II SVE TS 11 10 2.0-10 1.5-10 1.0-1.5 0-1.0 4 8 453393.68 1460824.78 NA 14.30IR10VW-08A 9/27/2000 Phase II SVE TS 10 10 2.0-10 1.5-10 1.0-1.5 0-1.0 4 8 453400.73 1460846.65 NA 14.35IR10VW-09A 9/28/2000 Phase II SVE TS 10 10 2.0-10 1.5-10 1.0-1.5 0-1.0 4 8 453406.80 1460856.33 NA 14.41IR10VW-10A 9/28/2000 Phase II SVE TS 10 10 2.0-10 1.5-10 1.0-1.5 0-1.0 4 8 453402.64 1460874.68 NA 14.48IR10VW-11A 9/26/2000 Phase II SVE TS 10 10 2.0-10 1.5-10 1.0-1.5 0-1.0 4 8 453383.00 1460840.64 NA 14.30IR10VW-12A 9/28/2000 Phase II SVE TS 10 10 2.0-10 1.5-10 1.0-1.5 0-1.0 4 8 453388.22 1460861.66 NA 14.41IR10VW-13A 10/2/2000 Phase II SVE TS 10 10 2.0-10 1.5-10 1.0-1.5 0-1.0 4 8 453390.02 1460877.25 NA 14.48IR10VW-14A 9/28/2000 Phase II SVE TS 10 10 2.0-10 1.5-10 1.0-1.5 0-1.0 4 8 453368.64 1460858.30 NA 14.32IR10VW-15A 5/20/2005 Phase III SVE TS 10 10 2.0-10 1.5-10 1.0-1.5 0-1.0 4 12 453374.63 1460891.57 NA 14.37IR10VW-16A 5/20/2005 Phase III SVE TS 10 10 2.0-10 1.5-10 1.0-1.5 0-1.0 4 12 453361.70 1460892.56 NA 14.34IR10VW-17A 5/20/2005 Phase III SVE TS 10 10 2.0-10 1.5-10 1.0-1.5 0-1.0 4 12 453374.84 1460878.31 NA 14.29IR10VW-18A 5/18/2005 Phase III SVE TS 10 10 2.0-10 1.5-10 1.0-1.5 0-1.0 4 12 453349.47 1460875.97 NA 14.19IR10VW-19A 5/18/2005 Phase III SVE TS 10 10 2.0-10 1.5-10 1.0-1.5 0-1.0 4 12 453350.85 1460845.38 NA 14.15IR10VW-20A 5/18/2005 Phase III SVE TS 10 10 2.0-10 1.5-10 1.0-1.5 0-1.0 4 12 453374.19 1460823.84 NA 14.10IR10VW-21A 5/20/2005 Phase III SVE TS 10 10 2.0-10 1.5-10 1.0-1.5 0-1.0 4 12 453440.20 1460808.12 NA 14.07IR10VW-22A 5/19/2005 Phase III SVE TS 10 10 2.0-10 1.5-10 1.0-1.5 0-1.0 4 12 453413.64 1460784.16 NA 14.11IR10VW-23A 5/19/2005 Phase III SVE TS 10 10 2.0-10 1.5-10 1.0-1.5 0-1.0 4 12 453416.88 1460768.43 NA 14.15
Elevation (feet msl)2Bentonite Seal
(feet bgs)
Borehole Diameter(inches)
Casing Diameter(inches)
Boring Depth
(feet bgs)Vapor Extraction Wells
Concrete Surface Seal
(feet bgs)Well Number
Filter Pack Interval(feet bgs)
Location (feet)1
Date Drilled Investigation
Screened Interval(feet bgs)
Bottom of Well
(feet bgs)
Table 2 Well Construction_revRTC Page 1 of 3

TABLE 2: Summary of Well and Temporary Soil Gas Probe ConstructionPhase III SVE Treatability StudyBuilding 123, Parcel B, Hunters Point ShipyardSan Francisco, California
Northing EastingTop of Casing
Ground Surface
Elevation (feet msl)2Bentonite Seal
(feet bgs)
Borehole Diameter(inches)
Casing Diameter(inches)
Boring Depth
(feet bgs)
Concrete Surface Seal
(feet bgs)Well Number
Filter Pack Interval(feet bgs)
Location (feet)1
Date Drilled Investigation
Screened Interval(feet bgs)
Bottom of Well
(feet bgs)
IR10SG-039-5 9/27/2000 Phase II SVE TS 5 5 3.0-5.0 2.0-5.0 1.0-2.0 0-1.0 2 8 453449.27 1460822.98 NA 14.22IR10SG-039-10 9/27/2000 Phase II SVE TS 10 10 6.0-10 5.5-10 3.5-5.5 0-3.5 2 8 453447.31 1460821.83 NA 14.24IR10SG-040-5 9/27/2000 Phase II SVE TS 5 5 3.0-5.0 2.0-5.0 1.0-2.0 0-1.0 2 8 453442.19 1460825.84 NA 14.24
IR10SG-040-10 9/27/2000 Phase II SVE TS 10 10 6.0-10 5.5-10 3.5-5.5 0-3.5 2 8 453440.54 1460824.34 NA 14.25IR10SG-041-5 9/27/2000 Phase II SVE TS 5 5 3.0-5.0 2.0-5.0 1.0-2.0 0-1.0 2 8 453431.01 1460827.94 NA 14.25
IR10SG-041-10 9/27/2000 Phase II SVE TS 10 10 6.0-10 5.5-10 3.5-5.5 0-3.5 2 8 453432.80 1460826.60 NA 14.26IR10SG-042-5 9/26/2000 Phase II SVE TS 5 5 3.0-5.0 2.0-5.0 1.0-2.0 0-1.0 2 8 453423.08 453421.99 NA 14.25
IR10SG-042-10 9/26/2000 Phase II SVE TS 10 10 6.0-10 5.5-10 3.5-5.5 0-3.5 2 8 453421.99 1460834.73 NA 14.25IR10SG-043-5 9/28/2000 Phase II SVE TS 5 5 3.0-5.0 2.0-5.0 1.0-2.0 0-1.0 2 8 453403.74 1460852.45 NA 14.41IR10SG-43-10 9/28/2000 Phase II SVE TS 10 10 6.0-10 5.5-10 3.5-5.5 0-3.5 2 8 453404.90 1460851.06 NA 14.39IR10SG-044-5 10/3/2000 Phase II SVE TS 5 5 3.0-5.0 2.0-5.0 1.0-2.0 0-1.0 2 8 453389.26 1460842.27 NA 14.25
IR10SG-044-10 10/3/2000 Phase II SVE TS 10 10 6.0-10 5.5-10 3.5-5.5 0-3.5 2 8 453388.20 1460843.47 NA 14.24IR10SG-045-5 10/2/2000 Phase II SVE TS 5 5 3.0-5.0 2.0-5.0 1.0-2.0 0-1.0 2 8 453383.85 1460833.72 NA 14.29
IR10SG-045-10 10/2/2000 Phase II SVE TS 10 10 6.0-10 5.5-10 3.5-5.5 0-3.5 2 8 453382.65 1460835.41 NA 14.30IR10SG-046-5 10/3/2000 Phase II SVE TS 5 5 3.0-5.0 2.0-5.0 1.0-2.0 0-1.0 2 8 453374.37 1460830.15 NA 14.32
IR10SG-046-10 10/3/2000 Phase II SVE TS 10 10 6.0-10 5.5-10 3.5-5.5 0-3.5 2 8 453375.86 1460828.99 NA 14.30IR10SG-047-5 9/28/2000 Phase II SVE TS 5 5 3.0-5.0 2.0-5.0 1.0-2.0 0-1.0 2 8 453387.40 1460882.00 NA 14.46
IR10SG-047-10 9/28/2000 Phase II SVE TS 10 10 6.0-10 5.5-10 3.5-5.5 0-3.5 2 8 453385.17 1460883.16 NA 14.50IR10SG-072-4 5/23/2005 Phase III SVE TS 4 4 3.5-4.0 2.5-4.0 2.0-2.5 0-2.0 2 10 453445.62 1460804.52 NA 14.04IR10SG-072-6 5/23/2005 Phase III SVE TS 6 6 5.5-6.0 4.5-6.0 2.0-4.5 0-2.0 2 10 453446.21 1460805.59 NA 14.06IR10SG-073-4 5/23/2005 Phase III SVE TS 4 4 3.5-4.0 2.5-4.0 2.0-2.5 0-2.0 2 10 453430.38 1460800.30 NA 14.07IR10SG-073-6 5/23/2005 Phase III SVE TS 6 6 5.5-6.0 4.5-6.0 2.0-4.5 0-2.0 2 10 453428.60 1460800.74 NA 14.06IR10SG-074-4 5/23/2005 Phase III SVE TS 4 4 3.5-4.0 2.5-4.0 2.0-2.5 0-2.0 2 10 453409.97 1460756.88 NA 14.39IR10SG-074-6 5/23/2005 Phase III SVE TS 6 6 5.5-6.0 4.5-6.0 2.0-4.5 0-2.0 2 10 453411.09 1460754.78 NA 14.42IR10SG-075-4 5/19/2005 Phase III SVE TS 4 4 3.5-4.0 2.5-4.0 2.0-2.5 0-2.0 2 10 453394.63 1460800.64 NA 14.16IR10SG-075-6 5/19/2005 Phase III SVE TS 6 6 5.5-6.0 4.5-6.0 2.0-4.5 0-2.0 2 10 453395.59 1460798.45 NA 14.14IR10SG-076-2 5/23/2005 Phase III SVE TS 4 4 3.5-4.0 2.5-4.0 2.0-2.5 0-2.0 2 10 453411.10 1460899.04 NA 10.61IR10SG-076-4 5/23/2005 Phase III SVE TS 6 6 5.5-6.0 4.5-6.0 2.0-4.5 0-2.0 2 10 453411.31 1460900.74 NA 10.48IR10SG-077-4 5/18/2005 Phase III SVE TS 4 4 3.5-4.0 2.5-4.0 2.0-2.5 0-2.0 2 10 453334.06 1460868.83 NA 14.20IR10SG-077-6 5/18/2005 Phase III SVE TS 6 6 5.5-6.0 4.5-6.0 2.0-4.5 0-2.0 2 10 453334.15 1460871.05 NA 14.15
Vapor Monitoring Wells
Table 2 Well Construction_revRTC Page 2 of 3

TABLE 2: Summary of Well and Temporary Soil Gas Probe ConstructionPhase III SVE Treatability StudyBuilding 123, Parcel B, Hunters Point ShipyardSan Francisco, California
Northing EastingTop of Casing
Ground Surface
Elevation (feet msl)2Bentonite Seal
(feet bgs)
Borehole Diameter(inches)
Casing Diameter(inches)
Boring Depth
(feet bgs)
Concrete Surface Seal
(feet bgs)Well Number
Filter Pack Interval(feet bgs)
Location (feet)1
Date Drilled Investigation
Screened Interval(feet bgs)
Bottom of Well
(feet bgs)
IR10SG-048 1/13/2005 Phase III SVE TS 12 8.5 8.5-8.5 8.0-8.5 4.0-8.0 2.0-4.0 0.25 2 453351.30 1460841.0 NA 14.13IR10SG-049 1/13/2005 Phase III SVE TS 12 8.5 8.5-8.5 8.0-8.5 4.0-8.0 2.0-4.0 0.25 2 453348.00 1460879.0 NA 14.20IR10SG-050 1/13/2005 Phase III SVE TS 12 8.5 8.5-8.5 8.0-8.5 4.0-8.0 2.0-4.0 0.25 2 453363.10 1460890.0 NA 14.48IR10SG-051 1/13/2005 Phase III SVE TS 12 8.5 8.5-8.5 8.0-8.5 4.0-8.0 2.0-4.0 0.25 2 453358.90 1460808.0 NA 14.17IR10SG-052 1/13/2005 Phase III SVE TS 12 8.5 8.5-8.5 8.0-8.5 4.0-8.0 2.0-4.0 0.25 2 453376.70 1460827.0 NA 14.08IR10SG-053 1/13/2005 Phase III SVE TS 12 8.5 8.5-8.5 8.0-8.5 4.0-8.0 2.0-4.0 0.25 2 453386.50 1460858.0 NA 14.37IR10SG-054 1/13/2005 Phase III SVE TS 12 9 9.0-9.0 8.5-9.0 4.0-8.5 2.0-4.0 0.25 2 453397.50 1460787.0 NA 14.16IR10SG-055 1/13/2005 Phase III SVE TS 12 9 9.0-9.0 8.5-9.0 4.0-8.5 2.0-4.0 0.25 2 453420.30 1460831.0 NA 14.04IR10SG-056 1/13/2005 Phase III SVE TS 12 9 9.0-9.0 8.5-9.0 4.0-8.5 2.0-4.0 0.25 2 453414.00 1460785.0 NA 14.13IR10SG-057 1/13/2005 Phase III SVE TS 12 9 9.0-9.0 8.5-9.0 4.0-8.5 2.0-4.0 0.25 2 453445.30 1460804.0 NA 14.06IR10SG-058 1/14/2005 Phase III SVE TS 12 5.5 5.5-5.5 5.0-5.5 3.0-5.0 1.0-3.0 0.25 2 453405.20 1460905.0 NA 10.46IR10SG-059 1/14/2005 Phase III SVE TS 8 5.5 5.5-5.5 5.0-5.5 3.0-5.0 1.0-3.0 0.25 2 453414.10 1460923.0 NA 10.35IR10SG-060 1/14/2005 Phase III SVE TS 8 5.5 5.5-5.5 5.0-5.5 3.0-5.0 1.0-3.0 0.25 2 453434.60 1460865.0 NA 10.25IR10SG-061 1/14/2005 Phase III SVE TS 8 5.5 5.5-5.5 5.0-5.5 3.0-5.0 1.0-3.0 0.25 2 453440.10 1460886.0 NA 9.80IR10SG-062 1/14/2005 Phase III SVE TS 8 5.5 5.5-5.5 5.0-5.5 3.0-5.0 1.0-3.0 0.25 2 453441.60 1460919.0 NA 10.26IR10SG-063 1/14/2005 Phase III SVE TS 8 5.5 5.5-5.5 5.0-5.5 3.0-5.0 1.0-3.0 0.25 2 453451.80 1460841.0 NA 10.34IR10SG-064 1/14/2005 Phase III SVE TS 8 5.5 5.5-5.5 5.0-5.5 3.0-5.0 1.0-3.0 0.25 2 453457.40 1460877.0 NA 10.04IR10SG-065 1/14/2005 Phase III SVE TS 8 5.5 5.5-5.5 5.0-5.5 3.0-5.0 1.0-3.0 0.25 2 453465.00 1460929.0 NA 10.15IR10SG-066 3/23/2005 Phase III SVE TS 12 8 8.0-8.0 7.5-8.0 4.0-7.5 1.0-3.0 0.25 2 453307.30 1460865.0 NA 14.21IR10SG-067 3/23/2005 Phase III SVE TS 12 8 8.0-8.0 7.5-8.0 4.0-7.5 1.0-3.0 0.25 2 453316.50 1460911.0 NA 14.13IR10SG-068 3/23/2005 Phase III SVE TS 12 8 8.0-8.0 7.5-8.0 4.0-7.5 1.0-3.0 0.25 2 453347.10 1460927.0 NA 14.45IR10SG-069 3/23/2005 Phase III SVE TS 12 8 8.0-8.0 7.5-8.0 4.0-7.5 1.0-3.0 0.25 2 453425.60 1460757.0 NA 14.33IR10SG-070 3/23/2005 Phase III SVE TS 12 8 8.0-8.0 7.5-8.0 4.0-7.5 1.0-3.0 0.25 2 453451.10 1460772.0 NA 14.02IR10SG-071 3/23/2005 Phase III SVE TS 8 5 5.0-5.0 4.5-5.0 2.0-4.5 0.5-2.0 0.25 2 453461.40 1460901.0 NA 10.10
Notes:1 = Referanced to California State Plane Coordinate System Zone 6 (NAD 27). 2 = Referenced to the California State Plane Coordinate System (NAVD 88) relative to mean sea levelmsl = mean sea levelNA = Not availablebgs = below ground surfaceSVE = soil vapor extractionVM = vapor monitoringTS = treatability study
Temporary Soil Gas Sample Probes
Table 2 Well Construction_revRTC Page 3 of 3

TABLE 3: Summary of System Yield at Individual Wells Based on PID MonitoringPhase III SVE Treatability StudyBuilding 123, Parcel B, Hunters Point ShipyardSan Francisco, California
PID Air Velocity Pressure Temp. Flow Flow Yield RateOperation
IntervalYield
(interval)Cumulative
YieldLocation Time (ppmv) (ft/min) (in-Hg) (F) (acfm) (scfm) (lbs/day) (days) (lbs) (lbs) Notes
IR10VW-01 6/15/05 10:31 8.3 550 2.5 66.5 47.0 42.6 0.1734 0.0 0.0 0.0000IR10VW-02 6/15/05 10:24 0.7 450 1.25 68.1 38.5 36.3 0.0125 0.0 0.0 0.0000IR10VW-03 6/15/05 10:40 2.3 820 1.0 64.3 70.1 67.2 0.0759 0.0 0.0 0.0000IR10VW-04 6/15/05 10:29 2.7 510 2.5 67.8 43.6 39.4 0.0522 0.0 0.0 0.0000IR10VW-05 6/15/05 10:27 3.9 260 2.5 67.0 22.2 20.1 0.0385 0.0 0.0 0.0000IR10VW-06 6/15/05 10:18 1.1 290 2.7 70.1 24.8 22.1 0.0119 0.0 0.0 0.0000IR10VW-07 6/15/05 10:44 1.1 380 2.25 65.8 32.5 29.7 0.0160 0.0 0.0 0.0000IR10VW-08 6/15/05 10:21 14.3 280 2.25 67.0 23.9 21.9 0.1533 0.0 0.0 0.0000IR10VW-09 6/15/05 10:20 3.1 490 1.8 66.5 41.9 38.9 0.0592 0.0 0.0 0.0000IR10VW-10 6/15/05 10:14 0.7 450 3.0 66.9 38.5 34.2 0.0117 0.0 0.0 0.0000IR10VW-11 6/15/05 10:47 1.1 450 2.5 66.1 38.5 34.9 0.0188 0.0 0.0 0.0000IR10VW-12 6/15/05 10:15 3.5 670 2.25 67.2 57.3 52.3 0.0898 0.0 0.0 0.0000IR10VW-13 6/15/05 10:12 1.9 610 2.25 66.1 52.2 47.7 0.0445 0.0 0.0 0.0000IR10VW-14 6/15/05 10:51 2.3 630 2.25 64.2 53.9 49.4 0.0558 0.0 0.0 0.0000 Replaced faulty P gauge. Gauge was replaced on
6/16/05 and the P from 6/16/05 was used for this IR10VW-15 6/15/05 10:07 4.3 330 2.4 66.5 28.2 25.6 0.0541 0.0 0.0 0.0000IR10VW-16 6/15/05 10:05 3.9 205 2.0 64.0 17.5 16.2 0.0311 0.0 0.0 0.0000IR10VW-17 6/15/05 10:10 8.3 250 2.25 68.5 21.4 19.5 0.0792 0.0 0.0 0.0000IR10VW-18 6/15/05 10:52 0.7 570 1.75 67.8 48.8 45.2 0.0155 0.0 0.0 0.0000IR10VW-19 6/15/05 10:49 6.3 280 2.25 66.0 23.9 21.9 0.0677 0.0 0.0 0.0000IR10VW-20 6/15/05 10:45 9.9 310 2.25 68.8 26.5 24.1 0.1171 0.0 0.0 0.0000IR10VW-21 6/15/05 10:33 9.9 215 2.0 68.8 18.4 16.9 0.0820 0.0 0.0 0.0000IR10VW-22 6/15/05 10:39 1.9 290 2.25 66.1 24.8 22.7 0.0211 0.0 0.0 0.0000IR10VW-23 6/15/05 10:37 31.0 230 2.0 67.0 19.7 18.1 0.2755 0.0 0.0 0.0000
Total Flow 747.0 0.0677 Avg. Yield Rate Total Yield 0.0000
SYSTEM ON (ALL WELLS)
Table 3 Summary of Monitoring at Individual Wells Page 1 of 23

TABLE 3: Summary of System Yield at Individual Wells Based on PID MonitoringPhase III SVE Treatability StudyBuilding 123, Parcel B, Hunters Point ShipyardSan Francisco, California
SYSTEM ON (ALL WELLS)
PID Air Velocity Pressure Temp. Flow Flow Yield RateOperation
IntervalYield
(interval)Cumulative
YieldLocation Time (ppmv) (ft/min) (in-Hg) (F) (acfm) (scfm) (lbs/day) (days) (lbs) (lbs) Notes
IR10VW-01 6/16/05 9:24 9.9 170 2.6 61.8 14.5 13.2 0.0643 0.95 0.1133 0.1133IR10VW-02 6/16/05 9:27 0.0 280 1.2 64.0 23.9 22.8 0.0000 0.96 0.0060 0.0060IR10VW-03 6/16/05 10:05 0.3 600 2.25 63.5 51.3 47.2 0.0069 0.98 0.0404 0.0404IR10VW-04 6/16/05 9:26 3.2 160 2.7 62.7 13.7 12.4 0.0194 0.96 0.0342 0.0342IR10VW-05 6/16/05 9:29 1.5 140 2.8 64.0 12.0 10.8 0.0079 0.96 0.0223 0.0223IR10VW-06 6/16/05 9:32 0.7 130 2.5 65.4 11.1 10.1 0.0035 0.97 0.0075 0.0075IR10VW-07 6/16/05 10:03 0.0 110 2.25 64.9 9.4 8.6 0.0000 0.97 0.0078 0.0078IR10VW-08 6/16/05 9:37 7.1 150 2.0 65.1 12.8 11.9 0.0413 0.97 0.0943 0.0943IR10VW-09 6/16/05 9:35 1.1 110 2.0 65.1 9.4 8.7 0.0047 0.97 0.0309 0.0309IR10VW-10 6/16/05 9:39 0.3 300 3.0 64.3 25.7 22.9 0.0034 0.98 0.0074 0.0074IR10VW-11 6/16/05 10:01 0.0 310 2.5 63.4 26.5 24.1 0.0000 0.97 0.0091 0.0091IR10VW-12 6/16/05 9:40 1.5 620 2.25 64.0 53.0 48.7 0.0358 0.98 0.0613 0.0613IR10VW-13 6/16/05 9:41 0.3 300 2.1 64.0 25.7 23.7 0.0035 0.98 0.0235 0.0235IR10VW-14 6/16/05 9:56 0.3 570 2.25 64.0 48.8 44.8 0.0066 0.96 0.0300 0.0300IR10VW-15 6/16/05 9:44 0.7 120 2.5 64.2 10.3 9.3 0.0032 0.98 0.0282 0.0282IR10VW-16 6/16/05 9:46 0.7 110 2.0 64.0 9.4 8.7 0.0030 0.99 0.0168 0.0168IR10VW-17 6/16/05 9:42 2.3 105 2.25 64.3 9.0 8.2 0.0093 0.98 0.0434 0.0434IR10VW-18 6/16/05 9:52 0.0 480 1.8 64.0 41.1 38.4 0.0000 0.96 0.0074 0.0074IR10VW-19 6/16/05 9:54 0.7 205 2.25 62.5 17.5 16.1 0.0055 0.96 0.0352 0.0352IR10VW-20 6/16/05 9:58 2.3 120 2.0 64.5 10.3 9.5 0.0107 0.97 0.0618 0.0618IR10VW-21 6/16/05 9:20 9.1 210 2.0 62.0 18.0 16.7 0.0746 0.95 0.0743 0.0743IR10VW-22 6/16/05 10:07 0.0 120 2.25 63.4 10.3 9.4 0.0000 0.98 0.0103 0.0103IR10VW-23 6/16/05 10:08 20.0 210 1.8 64.0 18.0 16.8 0.1644 0.98 0.2155 0.2155
Total Flow 443.0 0.0203 Avg. Yield Rate Total Yield 0.9810
SYSTEM ON (ALL WELLS)
Table 3 Summary of Monitoring at Individual Wells Page 2 of 23

TABLE 3: Summary of System Yield at Individual Wells Based on PID MonitoringPhase III SVE Treatability StudyBuilding 123, Parcel B, Hunters Point ShipyardSan Francisco, California
SYSTEM ON (ALL WELLS)
PID Air Velocity Pressure Temp. Flow Flow Yield RateOperation
IntervalYield
(interval)Cumulative
YieldLocation Time (ppmv) (ft/min) (in-Hg) (F) (acfm) (scfm) (lbs/day) (days) (lbs) (lbs) Notes
IR10VW-01 6/22/05 8:13 3.5 110 2.5 66.0 9.4 8.5 0.0146 5.95 0.2348 0.3481IR10VW-02 6/22/05 8:06 0.0 180 1.0 63.7 15.4 14.8 0.0000 5.94 0.0000 0.0060IR10VW-03 6/22/05 8:23 1.1 660 2.5 65.0 56.4 51.3 0.0277 5.93 0.1026 0.1430IR10VW-04 6/22/05 8:11 0.3 200 2.6 65.4 17.1 15.5 0.0023 5.95 0.0646 0.0989IR10VW-05 6/22/05 8:09 0 110 2.5 64.3 9.4 8.6 0.0000 5.94 0.0236 0.0458IR10VW-06 6/22/05 8:03 0 90 2.25 67.8 7.7 7.0 0.0000 5.94 0.0103 0.0177IR10VW-07 6/22/05 8:27 0.3 150 2.25 66.0 12.8 11.7 0.0017 5.93 0.0051 0.0129IR10VW-08 6/22/05 7:58 1.5 170 2.25 66.0 14.5 13.3 0.0098 5.93 0.1515 0.2458IR10VW-09 6/22/05 8:01 0.3 120 2.0 66.3 10.3 9.5 0.0014 5.93 0.0181 0.0490IR10VW-10 6/22/05 7:54 0 110 3.0 66.0 9.4 8.4 0.0000 5.93 0.0100 0.0174IR10VW-11 6/22/05 8:30 0.0 260 2.25 66.1 22.2 20.3 0.0000 5.94 0.0000 0.0091IR10VW-12 6/22/05 7:52 0 580 2.25 65.6 49.6 45.4 0.0000 5.92 0.1061 0.1674IR10VW-13 6/22/05 7:49 0 230 2.0 68.3 19.7 18.1 0.0000 5.92 0.0103 0.0338IR10VW-14 6/22/05 8:32 0 460 2.25 64.3 39.3 36.1 0.0000 5.94 0.0196 0.0496IR10VW-15 6/22/05 7:44 0 105 2.5 66.5 9.0 8.1 0.0000 5.92 0.0095 0.0377IR10VW-16 6/22/05 7:37 0 160 2.0 66.5 13.7 12.6 0.0000 5.91 0.0088 0.0256IR10VW-17 6/22/05 7:46 0.3 200 2.25 68.3 17.1 15.6 0.0023 5.92 0.0343 0.0777IR10VW-18 6/22/05 8:38 0.0 200 1.75 65.2 17.1 15.9 0.0000 5.95 0.0000 0.0074IR10VW-19 6/22/05 8:35 0 215 2.0 67.2 18.4 16.9 0.0000 5.95 0.0165 0.0517IR10VW-20 6/22/05 8:27 0.3 100 2.0 66.0 8.6 7.9 0.0012 5.94 0.0353 0.0971IR10VW-21 6/22/05 8:16 3.9 100 2.0 67.9 8.6 7.9 0.0150 5.96 0.2668 0.3411IR10VW-22 6/22/05 8:21 3.5 95 2.25 64.2 8.1 7.5 0.0128 5.93 0.0379 0.0483IR10VW-23 6/22/05 8:18 9.9 210 1.9 65.0 18.0 16.7 0.0809 5.92 0.7266 0.9421
Total Flow 377.4 0.0074 Avg. Yield Rate Total Yield 2.873
SYSTEM ON (ALL WELLS)
Table 3 Summary of Monitoring at Individual Wells Page 3 of 23

TABLE 3: Summary of System Yield at Individual Wells Based on PID MonitoringPhase III SVE Treatability StudyBuilding 123, Parcel B, Hunters Point ShipyardSan Francisco, California
SYSTEM ON (ALL WELLS)
PID Air Velocity Pressure Temp. Flow Flow Yield RateOperation
IntervalYield
(interval)Cumulative
YieldLocation Time (ppmv) (ft/min) (in-Hg) (F) (acfm) (scfm) (lbs/day) (days) (lbs) (lbs) Notes
IR10VW-01 6/27/05 11:08 2.7 95 2.25 67.9 8.1 7.4 0.0098 5.12 0.0626 0.4107IR10VW-02 6/27/05 10:59 0.0 160 1.0 66.9 13.7 13.1 0.0000 5.12 0.0000 0.0060IR10VW-03 6/27/05 11:25 0.7 730 2.25 66.7 62.4 57.0 0.0196 5.13 0.1211 0.2640IR10VW-04 6/27/05 11:06 0.3 105 2.5 65.6 9.0 8.1 0.0012 5.12 0.0089 0.1078IR10VW-05 6/27/05 11:03 0.0 90 2.5 66.3 7.7 7.0 0.0000 5.12 0.0000 0.0458IR10VW-06 6/27/05 10:57 0.0 90 2.2 68.8 7.7 7.0 0.0000 5.12 0.0000 0.0177IR10VW-07 6/27/05 11:27 0.3 190 2.25 66.3 16.3 14.9 0.0022 5.13 0.0100 0.0229IR10VW-08 6/27/05 10:53 1.9 120 2.0 67.0 10.3 9.5 0.0088 5.12 0.0476 0.2935IR10VW-09 6/27/05 10:55 0.0 90 1.8 69 7.7 7.1 0.0000 5.12 0.0036 0.0526IR10VW-10 6/27/05 10:50 0.0 150 2.75 68.8 12.8 11.5 0.0000 5.12 0.0000 0.0174IR10VW-11 6/27/05 11:35 0.0 350 2.25 68.5 29.9 27.2 0.0000 5.13 0.0000 0.0091IR10VW-12 6/27/05 10:48 0.0 520 2.25 67.2 44.5 40.6 0.0000 5.12 0.0000 0.1674IR10VW-13 6/27/05 10:45 0.0 320 2.0 67.2 27.4 25.2 0.0000 5.12 0.0000 0.0338IR10VW-14 6/27/05 11:42 0.0 550 2.0 65.7 47.0 43.4 0.0000 5.13 0.0000 0.0496IR10VW-15 6/27/05 10:41 0.0 110 2.25 67.8 9.4 8.6 0.0000 5.12 0.0000 0.0377IR10VW-16 6/27/05 10:39 0.0 140 1.8 68.5 12.0 11.1 0.0000 5.13 0.0000 0.0256IR10VW-17 6/27/05 10:43 0.3 135 2.2 67.2 11.5 10.6 0.0016 5.12 0.0098 0.0876IR10VW-18 6/27/05 11:46 0.3 460 1.5 67.3 39.3 36.9 0.0054 5.13 0.0139 0.0214IR10VW-19 6/27/05 11:39 0.0 120 2.0 66.1 10.3 9.5 0.0000 5.13 0.0000 0.0517IR10VW-20 6/27/05 11:32 0.0 95 2.0 66.9 8.1 7.5 0.0000 5.13 0.0030 0.1001IR10VW-21 6/27/05 11:10 1.5 90 2.0 67.6 7.7 7.1 0.0052 5.12 0.0519 0.3929IR10VW-22 6/27/05 11:22 1.1 100 2.25 68.1 8.6 7.8 0.0042 5.13 0.0436 0.0918IR10VW-23 6/27/05 11:17 1.9 95 1.8 67.8 8.1 7.5 0.0070 5.12 0.2253 1.1674
Total Flow 385.3 0.0028 Avg. Yield Rate Total Yield 3.474
SYSTEM ON (PARTIAL) 6/27/05 13:30
Table 3 Summary of Monitoring at Individual Wells Page 4 of 23

TABLE 3: Summary of System Yield at Individual Wells Based on PID MonitoringPhase III SVE Treatability StudyBuilding 123, Parcel B, Hunters Point ShipyardSan Francisco, California
SYSTEM ON (PARTIAL)
PID Air Velocity Pressure Temp. Flow Flow Yield RateOperation
IntervalYield
(interval)Cumulative
YieldLocation Time (ppmv) (ft/min) (in-Hg) (F) (acfm) (scfm) (lbs/day) (days) (lbs) (lbs) Notes
IR10VW-01 6/27/05 15:04 3.1 110 3.75 68.3 9.4 8.1 0.0123 0.16 0.0018 0.4125IR10VW-02 0.0000 0.0060 Passive InjectionIR10VW-03 6/27/05 14:56 0.0 1150 3.5 67.1 98.4 85.7 0.0000 0.15 0.0014 0.2655IR10VW-04 0.0000 0.1078 Passive InjectionIR10VW-05 6/27/05 14:32 0.0 170 3.8 70.3 14.5 12.5 0.0000 0.15 0.0000 0.0458IR10VW-06 6/27/05 14:26 0.0 265 3.3 69.2 22.7 19.8 0.0000 0.15 0.0000 0.0177IR10VW-07 6/27/05 14:54 0.0 350 3.25 68.1 29.9 26.3 0.0000 0.14 0.0002 0.0231IR10VW-08 6/27/05 14:29 2.3 130 3.5 68.5 11.1 9.7 0.0109 0.15 0.0015 0.2949IR10VW-09 0.0000 0.0526 Passive InjectionIR10VW-10 6/27/05 14:21 0.0 260 3.75 70.1 22.2 19.1 0.0000 0.15 0.0000 0.0174IR10VW-11 0.0000 0.0091 Passive InjectionIR10VW-12 6/27/05 14:19 0.0 810 3.1 67.0 69.3 61.3 0.0000 0.15 0.0000 0.1674IR10VW-13 0.0000 0.0338 Passive InjectionIR10VW-14 6/27/05 14:44 0.0 960 3.25 65.1 82.1 72.5 0.0000 0.13 0.0000 0.0496IR10VW-15 6/27/05 14:12 0.0 190 3.5 69.7 16.3 14.1 0.0000 0.15 0.0000 0.0377IR10VW-16 6/27/05 14:06 0.0 330 3.0 69.7 28.2 24.9 0.0000 0.14 0.0000 0.0256IR10VW-17 6/27/05 14:14 0.0 235 3.50 70.1 20.1 17.4 0.0000 0.15 0.0001 0.0877IR10VW-18 0.0000 0.0214 Passive InjectionIR10VW-19 6/27/05 14:49 0.0 150 3.25 66.7 12.8 11.3 0.0000 0.13 0.0000 0.0517IR10VW-20 6/27/05 14:52 0.0 120 3.5 68.8 10.3 8.9 0.0000 0.14 0.0000 0.1001IR10VW-21 6/27/05 14:35 3.5 130 3.25 71.0 11.1 9.7 0.0167 0.14 0.0016 0.3945IR10VW-22 0.0000 0.0918 Passive InjectionIR10VW-23 6/27/05 15:01 9.1 140 3.1 69.4 12.0 10.5 0.0471 0.16 0.0042 1.1716
Total Flow 411.9 0.0054 Avg. Yield Rate Total Yield 3.485
SYSTEM ON (PARTIAL)
Table 3 Summary of Monitoring at Individual Wells Page 5 of 23

TABLE 3: Summary of System Yield at Individual Wells Based on PID MonitoringPhase III SVE Treatability StudyBuilding 123, Parcel B, Hunters Point ShipyardSan Francisco, California
SYSTEM ON (PARTIAL)
PID Air Velocity Pressure Temp. Flow Flow Yield RateOperation
IntervalYield
(interval)Cumulative
YieldLocation Time (ppmv) (ft/min) (in-Hg) (F) (acfm) (scfm) (lbs/day) (days) (lbs) (lbs) Notes
IR10VW-01 7/1/05 9:48 0.3 130 3.70 65.8 11.1 9.6 0.0014 3.78 0.0260 0.4385IR10VW-02 0.0000 0.0060 Passive InjectionIR10VW-03 7/1/05 10:06 0.0 350 3.5 58.6 29.9 26.5 0.0000 3.80 0.0000 0.2655IR10VW-04 0.0000 0.1078 Passive InjectionIR10VW-05 7/1/05 9:46 0.0 130 3.7 65.2 11.1 9.7 0.0000 3.80 0.0000 0.0458IR10VW-06 7/1/05 9:26 0.0 95 3.7 64.7 8.1 7.1 0.0000 3.79 0.0000 0.0177IR10VW-07 7/1/05 10:04 0.0 320 3.2 60.2 27.4 24.4 0.0000 3.80 0.0000 0.0231IR10VW-08 7/1/05 9:33 0.3 250 3.50 64.9 21.4 18.7 0.0028 3.79 0.0259 0.3209IR10VW-09 0.0000 0.0526 Passive InjectionIR10VW-10 7/1/05 9:23 2.7 320 4.00 65.1 27.4 23.5 0.0311 3.79 0.0590 0.0764IR10VW-11 0.0000 0.0091 Passive InjectionIR10VW-12 7/1/05 9:21 0.0 600 3.5 65.4 51.3 44.9 0.0000 3.79 0.0000 0.1674IR10VW-13 0.0000 0.0338 Passive InjectionIR10VW-14 7/1/05 9:57 0.0 880 3.20 63.3 75.3 66.8 0.0000 3.80 0.0000 0.0496IR10VW-15 7/1/05 9:16 0.0 150 3.5 64.7 12.8 11.2 0.0000 3.79 0.0000 0.0377IR10VW-16 7/1/05 9:13 0.0 110 3.1 65.4 9.4 8.3 0.0000 3.80 0.0000 0.0256IR10VW-17 7/1/05 9:18 0.0 105 3.40 66 9.0 7.9 0.0000 3.79 0.0000 0.0877IR10VW-18 0.0000 0.0214 Passive InjectionIR10VW-19 7/1/05 10:00 0.0 150 3.20 65.4 12.8 11.3 0.0000 3.80 0.0000 0.0517IR10VW-20 7/1/05 10:02 0.0 115 3.4 61.5 9.8 8.7 0.0000 3.80 0.0000 0.1001IR10VW-21 7/1/05 9:50 0.7 90 3.20 66.0 7.7 6.8 0.0023 3.80 0.0361 0.4306IR10VW-22 0.0000 0.0918 Passive InjectionIR10VW-23 7/1/05 10:10 2.3 120 3.1 66.7 10.3 9.1 0.0103 3.80 0.1089 1.2805
Total Flow 294.6 0.0030 Avg. Yield Rate Total Yield 3.741
SYSTEM OFF (ALL WELLS) 7/1/05 10:23
Table 3 Summary of Monitoring at Individual Wells Page 6 of 23

TABLE 3: Summary of System Yield at Individual Wells Based on PID MonitoringPhase III SVE Treatability StudyBuilding 123, Parcel B, Hunters Point ShipyardSan Francisco, California
SYSTEM ON (ALL WELLS) 7/5/05 8:50
PID Air Velocity Pressure Temp. Flow Flow Yield RateOperation
IntervalYield
(interval)Cumulative
YieldLocation Time (ppmv) (ft/min) (in-Hg) (F) (acfm) (scfm) (lbs/day) (days) (lbs) (lbs) Notes
IR10VW-01 7/5/05 9:29 1.7 60 2.25 67.6 5.1 4.7 0.0039 0.03 0.0001 0.4386IR10VW-02 7/5/05 9:25 0.0 90 1.0 64.5 7.7 7.4 0.0000 0.02 0.0000 0.0060IR10VW-03 7/5/05 9:45 0.0 580 2.0 63.8 49.6 46.0 0.0000 0.04 0.0000 0.2655IR10VW-04 7/5/05 9:28 0.0 55 2.0 65.6 4.7 4.3 0.0000 0.03 0.0000 0.1078IR10VW-05 7/5/05 9:21 0.0 90 2.25 63.0 7.7 7.1 0.0000 0.02 0.0000 0.0458IR10VW-06 7/5/05 9:10 0.0 290 2.0 64.0 24.8 23.0 0.0000 0.01 0.0000 0.0177IR10VW-07 7/5/05 9:44 0.0 240 1.75 69.2 20.5 19.0 0.0000 0.04 0.0000 0.0231IR10VW-08 7/5/05 9:17 0.0 125 1.75 64.2 10.7 10.0 0.0000 0.02 0.0000 0.3209IR10VW-09 7/5/05 9:13 0.0 108 1.5 63.3 9.2 8.7 0.0000 0.02 0.0000 0.0526IR10VW-10 7/5/05 9:05 0.0 55 2.5 64.3 4.7 4.3 0.0000 0.01 0.0002 0.0765IR10VW-11 7/5/05 9:41 0.0 320 2.0 66.5 27.4 25.2 0.0000 0.04 0.0000 0.0091IR10VW-12 7/5/05 9:07 0.0 370 1.75 64.0 31.6 29.6 0.0000 0.01 0.0000 0.1674IR10VW-13 7/5/05 9:04 0.0 380 1.75 64.0 32.5 30.4 0.0000 0.01 0.0000 0.0338IR10VW-14 7/5/05 9:37 0.0 420 2.0 64.0 35.9 33.3 0.0000 0.03 0.0000 0.0496IR10VW-15 7/5/05 8:59 0.0 80 2.0 62.7 6.8 6.4 0.0000 0.01 0.0000 0.0377IR10VW-16 7/5/05 8:57 0.0 70 1.5 62.0 6.0 5.7 0.0000 0.00 0.0000 0.0256IR10VW-17 7/5/05 9:01 0.0 105 1.75 63.3 9.0 8.4 0.0000 0.01 0.0000 0.0877IR10VW-18 7/5/05 9:34 0.0 360 1.25 64.0 30.8 29.3 0.0000 0.03 0.0000 0.0214IR10VW-19 7/5/05 9:39 0.0 100 2.0 67.0 8.6 7.9 0.0000 0.03 0.0000 0.0517IR10VW-20 7/5/05 9:42 0.0 90 1.75 66.3 7.7 7.2 0.0000 0.04 0.0000 0.1001IR10VW-21 7/5/05 9:31 1.3 100 1.75 66.3 8.6 8.0 0.0051 0.03 0.0001 0.4307IR10VW-22 7/5/05 9:48 0.0 230 2.0 64.0 19.7 18.2 0.0000 0.04 0.0000 0.0918IR10VW-23 7/5/05 9:49 5.9 95 1.75 66.3 8.1 7.6 0.0219 0.04 0.0007 1.2812
Total Flow 351.3 0.0013 Avg. Yield Rate Total Yield 3.742
SYSTEM ON (ALL WELLS)
Table 3 Summary of Monitoring at Individual Wells Page 7 of 23

TABLE 3: Summary of System Yield at Individual Wells Based on PID MonitoringPhase III SVE Treatability StudyBuilding 123, Parcel B, Hunters Point ShipyardSan Francisco, California
SYSTEM ON (ALL WELLS)
PID Air Velocity Pressure Temp. Flow Flow Yield RateOperation
IntervalYield
(interval)Cumulative
YieldLocation Time (ppmv) (ft/min) (in-Hg) (F) (acfm) (scfm) (lbs/day) (days) (lbs) (lbs) Notes
IR10VW-01 7/8/05 11:15 0.8 90 2.25 67.8 7.7 7.0 0.0028 3.07 0.0102 0.4488IR10VW-02 7/8/05 11:08 0.0 110 1.0 67.8 9.4 9.0 0.0000 3.07 0.0000 0.0060IR10VW-03 7/8/05 11:41 0.0 580 2.0 66.0 49.6 45.8 0.0000 3.08 0.0000 0.2655IR10VW-04 7/8/05 11:12 0.0 75 2.0 66.5 6.4 5.9 0.0000 3.07 0.0000 0.1078IR10VW-05 7/8/05 11:10 0.0 90 2.25 68.3 7.7 7.0 0.0000 3.08 0.0000 0.0458IR10VW-06 7/8/05 11:00 0.0 75 2.0 68.5 6.4 5.9 0.0000 3.08 0.0000 0.0177IR10VW-07 7/8/05 11:38 0.0 195 2.0 65.1 16.7 15.4 0.0000 3.08 0.0000 0.0231IR10VW-08 7/8/05 11:04 0.0 100 1.75 68.1 8.6 7.9 0.0000 3.07 0.0000 0.3209IR10VW-09 7/8/05 11:02 0.0 70 1.5 67.8 6.0 5.6 0.0000 3.08 0.0000 0.0526IR10VW-10 7/8/05 10:55 0.0 70 2.5 68.2 6.0 5.4 0.0000 3.08 0.0000 0.0765IR10VW-11 7/8/05 11:33 0.0 350 2.0 64.5 29.9 27.7 0.0000 3.08 0.0000 0.0091IR10VW-12 7/8/05 10:53 0.0 510 1.75 66.0 43.6 40.6 0.0000 3.07 0.0000 0.1674IR10VW-13 7/8/05 10:50 0.0 320 1.75 67.2 27.4 25.4 0.0000 3.07 0.0000 0.0338IR10VW-14 7/8/05 11:28 0.0 450 2.0 65.1 38.5 35.6 0.0000 3.08 0.0000 0.0496IR10VW-15 7/8/05 10:42 0.0 80 2.0 66.5 6.8 6.3 0.0000 3.07 0.0000 0.0377IR10VW-16 7/8/05 10:39 0.0 120 1.75 66.3 10.3 9.5 0.0000 3.07 0.0000 0.0256IR10VW-17 7/8/05 10:46 0.0 90 2.0 66.7 7.7 7.1 0.0000 3.07 0.0000 0.0877IR10VW-18 7/8/05 11:25 0.0 360 1.5 65.1 30.8 29.0 0.0000 3.08 0.0000 0.0214IR10VW-19 7/8/05 11:30 0.0 90 2.0 64.9 7.7 7.1 0.0000 3.08 0.0000 0.0517IR10VW-20 7/8/05 11:35 0.0 75 1.75 65.1 6.4 6.0 0.0000 3.08 0.0000 0.1001IR10VW-21 7/8/05 11:18 0.3 120 1.75 68.1 10.3 9.5 0.0014 3.07 0.0100 0.4407IR10VW-22 7/8/05 11:47 0.0 120 2.0 67.2 10.3 9.4 0.0000 3.08 0.0000 0.0918IR10VW-23 7/8/05 11:49 5.1 90 1.5 67.8 7.7 7.2 0.0180 3.08 0.0615 1.3427
Total Flow 335.4 0.0010 Avg. Yield Rate Total Yield 3.824
SYSTEM OFF (ALL WELLS) 7/8/05 11:11
Table 3 Summary of Monitoring at Individual Wells Page 8 of 23

TABLE 3: Summary of System Yield at Individual Wells Based on PID MonitoringPhase III SVE Treatability StudyBuilding 123, Parcel B, Hunters Point ShipyardSan Francisco, California
SYSTEM ON (ALL WELLS) 7/20/05 8:37
PID Air Velocity Pressure Temp. Flow Flow Yield RateOperation
IntervalYield
(interval)Cumulative
YieldLocation Time (ppmv) (ft/min) (in-Hg) (F) (acfm) (scfm) (lbs/day) (days) (lbs) (lbs) Notes
IR10VW-01 7/20/05 9:17 2.2 370 1.75 69.6 31.6 29.3 0.0316 0.03 0.0005 0.4493IR10VW-02 7/20/05 9:10 0.0 570 1.0 68.5 48.8 46.4 0.0000 0.02 0.0000 0.0060IR10VW-03 7/20/05 9:41 0.0 880 2.0 67.8 75.3 69.2 0.0000 0.04 0.0000 0.2655IR10VW-04 7/20/05 9:14 0.0 380 2.0 69.4 32.5 29.8 0.0000 0.03 0.0000 0.1078IR10VW-05 7/20/05 9:12 0.0 380 1.75 68.8 32.5 30.1 0.0000 0.02 0.0000 0.0458IR10VW-06 7/20/05 9:00 0.0 460 2.0 69.4 39.3 36.1 0.0000 0.02 0.0000 0.0177IR10VW-07 7/20/05 9:38 0.0 620 1.5 67.8 53.0 49.6 0.0000 0.04 0.0000 0.0231IR10VW-08 7/20/05 9:04 0.3 380 1.5 68.8 32.5 30.4 0.0045 0.02 0.0000 0.3209IR10VW-09 7/20/05 9:02 0.0 300 1.0 68.5 25.7 24.4 0.0000 0.02 0.0000 0.0526IR10VW-10 7/20/05 8:57 0.0 380 2.25 68.8 32.5 29.6 0.0000 0.01 0.0000 0.0765IR10VW-11 7/20/05 9:34 0.0 700 1.75 68.1 59.9 55.5 0.0000 0.04 0.0000 0.0091IR10VW-12 7/20/05 8:54 0.0 370 1.75 68.7 31.6 29.3 0.0000 0.01 0.0000 0.1674IR10VW-13 7/20/05 8:52 0.0 570 1.5 69.2 48.8 45.5 0.0000 0.01 0.0000 0.0338IR10VW-14 7/20/05 9:30 0.0 280 1.75 68.3 23.9 22.2 0.0000 0.04 0.0000 0.0496IR10VW-15 7/20/05 8:46 0.0 420 2.0 69.4 35.9 32.9 0.0000 0.01 0.0000 0.0377IR10VW-16 7/20/05 8:43 0.0 400 1.5 70.3 34.2 31.9 0.0000 0.00 0.0000 0.0256IR10VW-17 7/20/05 8:50 0.3 410 1.75 69.4 35.1 32.4 0.0048 0.01 0.0000 0.0877IR10VW-18 7/20/05 9:28 0.0 690 1.0 68.8 59.0 56.1 0.0000 0.04 0.0000 0.0214IR10VW-19 7/20/05 9:40 0.0 350 2.0 68.3 29.9 27.5 0.0000 0.04 0.0000 0.0517IR10VW-20 7/20/05 9:36 0.0 350 1.75 68.3 29.9 27.7 0.0000 0.04 0.0000 0.1001IR10VW-21 7/20/05 9:19 1.3 350 1.75 70.4 29.9 27.6 0.0176 0.03 0.0003 0.4410IR10VW-22 7/20/05 9:45 0.0 450 2.0 68.8 38.5 35.3 0.0000 0.05 0.0000 0.0918IR10VW-23 7/20/05 9:48 6.0 350 1.5 70.3 29.9 27.9 0.0821 0.05 0.0025 1.3451
Total Flow 826.7 0.0061 Avg. Yield Rate Total Yield 3.827
SYSTEM ON (PARTIAL) 7/20/05 10:30
Table 3 Summary of Monitoring at Individual Wells Page 9 of 23

TABLE 3: Summary of System Yield at Individual Wells Based on PID MonitoringPhase III SVE Treatability StudyBuilding 123, Parcel B, Hunters Point ShipyardSan Francisco, California
SYSTEM ON (PARTIAL)
PID Air Velocity Pressure Temp. Flow Flow Yield RateOperation
IntervalYield
(interval)Cumulative
YieldLocation Time (ppmv) (ft/min) (in-Hg) (F) (acfm) (scfm) (lbs/day) (days) (lbs) (lbs) Notes
IR10VW-01 8/4/05 9:43 0.0 330 5.2 66.5 28.2 23.0 0.0000 15.02 0.2371 0.6864IR10VW-02 0.0060 Passive InjectionIR10VW-03 0.2655 Passive InjectionIR10VW-04 0.1078 Passive InjectionIR10VW-05 8/4/05 9:39 0.0 450 5.5 66.7 38.5 31.0 0.0000 15.02 0.0000 0.0458IR10VW-06 8/4/05 9:28 0.0 370 5.2 65.6 31.6 25.9 0.0000 15.02 0.0000 0.0177IR10VW-07 0.0231 Passive InjectionIR10VW-08 8/4/05 9:31 0.0 390 5.0 65.8 33.4 27.5 0.0000 15.02 0.0336 0.3545IR10VW-09 0.0526 Passive InjectionIR10VW-10 8/4/05 9:24 0.0 490 5.5 64.0 41.9 34.0 0.0000 15.02 0.0000 0.0765IR10VW-11 0.0091 Passive InjectionIR10VW-12 8/4/05 9:22 0.0 770 5.0 62.6 65.9 54.6 0.0000 15.02 0.0000 0.1674IR10VW-13 0.0338 Passive InjectionIR10VW-14 0.0496 Passive InjectionIR10VW-15 0.0377 Passive InjectionIR10VW-16 8/4/05 9:16 0.0 430 5.0 66.7 36.8 30.3 0.0000 15.02 0.0000 0.0256IR10VW-17 8/4/05 9:19 0.0 390 5.0 67.0 33.4 27.4 0.0000 15.02 0.0358 0.1235IR10VW-18 0.0214 Passive InjectionIR10VW-19 8/4/05 9:58 0.0 370 5.0 66.5 31.6 26.0 0.0000 15.01 0.0000 0.0517IR10VW-20 8/4/05 10:00 0.0 350 5.0 67.8 29.9 24.6 0.0000 15.02 0.0000 0.1001IR10VW-21 8/4/05 9:46 0.0 450 5.0 66.9 38.5 31.7 0.0000 15.02 0.1324 0.5733IR10VW-22 0.0918 Passive InjectionIR10VW-23 8/4/05 10:05 1.7 490 5.0 68.1 41.9 34.4 0.0287 15.01 0.8314 2.1765
Total Flow 370.4 0.0024 Avg. Yield Rate Total Yield 5.097
SYSTEM OFF (ALL WELLS) 8/4/05 10:27
Table 3 Summary of Monitoring at Individual Wells Page 10 of 23

TABLE 3: Summary of System Yield at Individual Wells Based on PID MonitoringPhase III SVE Treatability StudyBuilding 123, Parcel B, Hunters Point ShipyardSan Francisco, California
SYSTEM ON (PARTIAL) 8/23/05 9:18
PID Air Velocity Pressure Temp. Flow Flow Yield RateOperation
IntervalYield
(interval)Cumulative
YieldLocation Time (ppmv) (ft/min) (in-Hg) (F) (acfm) (scfm) (lbs/day) (days) (lbs) (lbs) Notes
IR10VW-01 0.6864 Passive InjectionIR10VW-02 8/23/05 9:46 0.0 190 1.5 64.0 16.3 15.3 0.0000 0.02 0.0000 0.0060IR10VW-03 8/23/05 10:06 0.0 490 2.5 64.9 41.9 38.1 0.0000 0.03 0.0000 0.2655IR10VW-04 8/23/05 9:48 0.0 170 3.0 65.4 14.5 13.0 0.0000 0.02 0.0000 0.1078IR10VW-05 0.0458 Passive InjectionIR10VW-06 0.0177 Passive InjectionIR10VW-07 0.0231 Passive InjectionIR10VW-08 0.3545 Passive InjectionIR10VW-09 8/23/05 9:40 0.0 140 2.0 64.0 12.0 11.1 0.0000 0.02 0.0000 0.0526IR10VW-10 0.0765 Passive InjectionIR10VW-11 8/23/05 10:04 0.0 370 3.0 65.8 31.6 28.2 0.0000 0.03 0.0000 0.0091IR10VW-12 8/23/05 9:38 0.0 570 2.5 67.3 48.8 44.1 0.0000 0.01 0.0000 0.1674IR10VW-13 8/23/05 9:36 0.0 680 2.5 66.0 58.2 52.7 0.0000 0.01 0.0000 0.0338IR10VW-14 0.0496 Passive InjectionIR10VW-15 8/23/05 9:32 0.0 140 3.0 63.6 12.0 10.7 0.0000 0.01 0.0000 0.0377IR10VW-16 0.0256 Passive InjectionIR10VW-17 0.1235 Passive InjectionIR10VW-18 8/23/05 9:57 0.0 550 2.0 66.3 47.0 43.4 0.0000 0.03 0.0000 0.0214IR10VW-19 8/23/05 10:00 0.0 160 2.5 65.1 13.7 12.4 0.0000 0.03 0.0000 0.0517IR10VW-20 0.1001 Passive InjectionIR10VW-21 8/23/05 9:51 0.0 180 2.5 67.2 15.4 13.9 0.0000 0.02 0.0000 0.5733IR10VW-22 0.0918 Passive InjectionIR10VW-23 8/23/05 10:09 2.7 180 2.5 67.0 15.4 13.9 0.0184 0.04 0.0008 2.1773
Total Flow 296.7 0.0015 Avg. Yield Rate Total Yield 5.098
SYSTEM ON (PARTIAL)
Table 3 Summary of Monitoring at Individual Wells Page 11 of 23

TABLE 3: Summary of System Yield at Individual Wells Based on PID MonitoringPhase III SVE Treatability StudyBuilding 123, Parcel B, Hunters Point ShipyardSan Francisco, California
SYSTEM ON (PARTIAL) 9/13/05 8:28
PID Air Velocity Pressure Temp. Flow Flow Yield RateOperation
IntervalYield
(interval)Cumulative
YieldLocation Time (ppmv) (ft/min) (in-Hg) (F) (acfm) (scfm) (lbs/day) (days) (lbs) (lbs) Notes
IR10VW-01 0.6864 Passive InjectionIR10VW-02 9/13/05 9:08 0.0 220 1.5 64.5 18.8 17.7 0.0000 20.99 0.0000 0.0060IR10VW-03 9/13/05 9:26 0.0 440 2.5 65.2 37.6 34.2 0.0000 21.01 0.0000 0.2655IR10VW-04 9/13/05 9:10 0.0 190 3.0 65.9 16.3 14.5 0.0000 20.99 0.0000 0.1078IR10VW-05 0.0458 Passive InjectionIR10VW-06 0.0177 Passive InjectionIR10VW-07 0.0231 Passive InjectionIR10VW-08 0.3545 Passive InjectionIR10VW-09 9/13/05 9:04 0.0 320 2.0 64.4 27.4 25.3 0.0000 20.99 0.0000 0.0526IR10VW-10 0.0765 Passive InjectionIR10VW-11 9/13/05 9:24 0.0 220 3.0 66.1 18.8 16.7 0.0000 21.00 0.0000 0.0091IR10VW-12 9/13/05 9:02 0.0 400 2.5 66.6 34.2 31.0 0.0000 20.99 0.0000 0.1674IR10VW-13 9/13/05 8:59 0.0 520 2.5 65.3 44.5 40.4 0.0000 20.99 0.0000 0.0338IR10VW-14 0.0496 Passive InjectionIR10VW-15 9/13/05 8:56 0.0 220 3.0 64.2 18.8 16.8 0.0000 20.98 0.0000 0.0377IR10VW-16 0.0256 Passive InjectionIR10VW-17 0.1235 Passive InjectionIR10VW-18 9/13/05 9:17 0.0 490 2.0 65.3 41.9 38.7 0.0000 21.00 0.0000 0.0214IR10VW-19 9/13/05 9:20 0.0 240 2.5 64.2 20.5 18.7 0.0000 21.00 0.0000 0.0517IR10VW-20 0.1001 Passive InjectionIR10VW-21 9/13/05 9:13 0.0 225 2.5 66.8 19.2 17.4 0.0000 21.00 0.0000 0.5733IR10VW-22 0.0918 Passive InjectionIR10VW-23 9/13/05 9:30 0.9 300 2.5 65.9 25.7 23.3 0.0103 21.01 0.3016 2.4789
Total Flow 294.6 0.0009 Avg. Yield Rate Total Yield 5.400
SYSTEM OFF (ALL WELLS) 9/13/05 10:44 1229.9 hour meter
Table 3 Summary of Monitoring at Individual Wells Page 12 of 23

TABLE 3: Summary of System Yield at Individual Wells Based on PID MonitoringPhase III SVE Treatability StudyBuilding 123, Parcel B, Hunters Point ShipyardSan Francisco, California
SYSTEM OFF (ALL WELLS) 9/30/05 1229.9 hour meter
PID Air Velocity Pressure Temp. Flow Flow Yield RateOperation
IntervalYield
(interval)Cumulative
YieldLocation Time (ppmv) (ft/min) (in-Hg) (F) (acfm) (scfm) (lbs/day) (days) (lbs) (lbs) Notes
IR10VW-01 9/30/05 7:38 1.4 0.0 0.0 0.0000 0.00 0.0000 0.6864IR10VW-02 9/30/05 7:41 0.0 0.0 0.0 0.0000 0.00 0.0000 0.0060IR10VW-03 9/30/05 8:03 0.0 0.0 0.0 0.0000 0.00 0.0000 0.2655IR10VW-04 9/30/05 8:05 0.1 0.0 0.0 0.0000 0.00 0.0000 0.1078IR10VW-05 9/30/05 8:16 0.0 0.0 0.0 0.0000 0.00 0.0000 0.0458IR10VW-06 9/30/05 8:18 0.0 0.0 0.0 0.0000 0.00 0.0000 0.0177IR10VW-07 9/30/05 7:46 0.0 0.0 0.0 0.0000 0.00 0.0000 0.0231IR10VW-08 9/30/05 7:50 0.3 0.0 0.0 0.0000 0.00 0.0000 0.3545IR10VW-09 9/30/05 7:52 0.3 0.0 0.0 0.0000 0.00 0.0000 0.0526IR10VW-10 9/30/05 7:59 0.0 0.0 0.0 0.0000 0.00 0.0000 0.0765IR10VW-11 9/30/05 7:55 0.0 0.0 0.0 0.0000 0.00 0.0000 0.0091IR10VW-12 9/30/05 8:13 0.3 0.0 0.0 0.0000 0.00 0.0000 0.1674IR10VW-13 9/30/05 8:07 0.0 0.0 0.0 0.0000 0.00 0.0000 0.0338IR10VW-14 9/30/05 8:09 0.0 0.0 0.0 0.0000 0.00 0.0000 0.0496IR10VW-15 9/30/05 8:22 0.3 0.0 0.0 0.0000 0.00 0.0000 0.0377IR10VW-16 9/30/05 8:27 0.0 0.0 0.0 0.0000 0.00 0.0000 0.0256IR10VW-17 9/30/05 8:47 0.7 0.0 0.0 0.0000 0.00 0.0000 0.1235IR10VW-18 9/30/05 8:40 0.0 0.0 0.0 0.0000 0.00 0.0000 0.0214IR10VW-19 9/30/05 8:45 0.0 0.0 0.0 0.0000 0.00 0.0000 0.0517IR10VW-20 9/30/05 8:35 0.3 0.0 0.0 0.0000 0.00 0.0000 0.1001IR10VW-21 9/30/05 8:32 1.4 0.0 0.0 0.0000 0.00 0.0000 0.5733IR10VW-22 9/30/05 8:50 0.0 0.0 0.0 0.0000 0.00 0.0000 0.0918IR10VW-23 9/30/05 8:55 1.4 0.0 0.0 0.0000 0.00 0.0000 2.4789
Total Flow 0.0 0.0000 Avg. Yield Rate Total Yield 5.400
SYSTEM OFF (ALL WELLS) 1229.9 hour meter
Table 3 Summary of Monitoring at Individual Wells Page 13 of 23

TABLE 3: Summary of System Yield at Individual Wells Based on PID MonitoringPhase III SVE Treatability StudyBuilding 123, Parcel B, Hunters Point ShipyardSan Francisco, California
SYSTEM OFF (ALL WELLS) 10/14/05 1229.9 hour meter
PID Air Velocity Pressure Temp. Flow Flow Yield RateOperation
IntervalYield
(interval)Cumulative
YieldLocation Time (ppmv) (ft/min) (in-Hg) (F) (acfm) (scfm) (lbs/day) (days) (lbs) (lbs) Notes
IR10VW-01 10/14/05 9:19 1.8 0.0 0.0 0.0000 0.00 0.0000 0.6864IR10VW-02 10/14/05 9:09 0.0 0.0 0.0 0.0000 0.00 0.0000 0.0060IR10VW-03 10/14/05 9:40 0.0 0.0 0.0 0.0000 0.00 0.0000 0.2655IR10VW-04 10/14/05 9:16 0.7 0.0 0.0 0.0000 0.00 0.0000 0.1078IR10VW-05 10/14/05 9:14 0.1 0.0 0.0 0.0000 0.00 0.0000 0.0458IR10VW-06 10/14/05 8:59 0.0 0.0 0.0 0.0000 0.00 0.0000 0.0177IR10VW-07 10/14/05 9:37 0.0 0.0 0.0 0.0000 0.00 0.0000 0.0231IR10VW-08 10/14/05 9:02 0.7 0.0 0.0 0.0000 0.00 0.0000 0.3545IR10VW-09 10/14/05 9:04 1.6 0.0 0.0 0.0000 0.00 0.0000 0.0526IR10VW-10 10/14/05 8:57 0.7 0.0 0.0 0.0000 0.00 0.0000 0.0765IR10VW-11 10/14/05 9:35 0.0 0.0 0.0 0.0000 0.00 0.0000 0.0091IR10VW-12 10/14/05 8:55 1.4 0.0 0.0 0.0000 0.00 0.0000 0.1674IR10VW-13 10/14/05 8:50 0.0 0.0 0.0 0.0000 0.00 0.0000 0.0338IR10VW-14 10/14/05 9:29 0.0 0.0 0.0 0.0000 0.00 0.0000 0.0496IR10VW-15 10/14/05 8:48 0.7 0.0 0.0 0.0000 0.00 0.0000 0.0377IR10VW-16 10/14/05 8:45 0.0 0.0 0.0 0.0000 0.00 0.0000 0.0256IR10VW-17 10/14/05 8:53 1.8 0.0 0.0 0.0000 0.00 0.0000 0.1235IR10VW-18 10/14/05 9:31 0.0 0.0 0.0 0.0000 0.00 0.0000 0.0214IR10VW-19 10/14/05 9:43 0.0 0.0 0.0 0.0000 0.00 0.0000 0.0517IR10VW-20 10/14/05 9:33 0.3 0.0 0.0 0.0000 0.00 0.0000 0.1001IR10VW-21 10/14/05 9:22 1.8 0.0 0.0 0.0000 0.00 0.0000 0.5733IR10VW-22 10/14/05 9:46 0.0 0.0 0.0 0.0000 0.00 0.0000 0.0918IR10VW-23 10/14/05 9:50 2.1 0.0 0.0 0.0000 0.00 0.0000 2.4789
Total Flow 0.0 0.0000 Avg. Yield Rate Total Yield 5.400
SYSTEM OFF (ALL WELLS) 1229.9 hour meter
Table 3 Summary of Monitoring at Individual Wells Page 14 of 23

TABLE 3: Summary of System Yield at Individual Wells Based on PID MonitoringPhase III SVE Treatability StudyBuilding 123, Parcel B, Hunters Point ShipyardSan Francisco, California
SYSTEM OFF (ALL WELLS) 10/28/05 1229.9 hour meter
PID Air Velocity Pressure Temp. Flow Flow Yield RateOperation
IntervalYield
(interval)Cumulative
YieldLocation Time (ppmv) (ft/min) (in-Hg) (F) (acfm) (scfm) (lbs/day) (days) (lbs) (lbs) Notes
IR10VW-01 10/28/05 10:08 2.2 0.0 0.0 0.0000 0.00 0.0000 0.6864IR10VW-02 10/28/05 9:50 0.1 0.0 0.0 0.0000 0.00 0.0000 0.0060IR10VW-03 10/28/05 10:28 0.0 0.0 0.0 0.0000 0.00 0.0000 0.2655IR10VW-04 10/28/05 9:56 0.7 0.0 0.0 0.0000 0.00 0.0000 0.1078IR10VW-05 10/28/05 10:05 0.0 0.0 0.0 0.0000 0.00 0.0000 0.0458IR10VW-06 10/28/05 9:45 0.0 0.0 0.0 0.0000 0.00 0.0000 0.0177IR10VW-07 10/28/05 10:12 0.0 0.0 0.0 0.0000 0.00 0.0000 0.0231IR10VW-08 10/28/05 10:35 1.4 0.0 0.0 0.0000 0.00 0.0000 0.3545IR10VW-09 10/28/05 10:38 2.6 0.0 0.0 0.0000 0.00 0.0000 0.0526IR10VW-10 10/28/05 10:43 0.7 0.0 0.0 0.0000 0.00 0.0000 0.0765IR10VW-11 10/28/05 9:58 0.0 0.0 0.0 0.0000 0.00 0.0000 0.0091IR10VW-12 10/28/05 10:57 1.9 0.0 0.0 0.0000 0.00 0.0000 0.1674IR10VW-13 10/28/05 11:06 0.1 0.0 0.0 0.0000 0.00 0.0000 0.0338IR10VW-14 10/28/05 9:47 0.0 0.0 0.0 0.0000 0.00 0.0000 0.0496IR10VW-15 10/28/05 11:09 0.7 0.0 0.0 0.0000 0.00 0.0000 0.0377IR10VW-16 10/28/05 11:15 0.0 0.0 0.0 0.0000 0.00 0.0000 0.0256IR10VW-17 10/28/05 11:18 2.2 0.0 0.0 0.0000 0.00 0.0000 0.1235IR10VW-18 10/28/05 9:41 0.0 0.0 0.0 0.0000 0.00 0.0000 0.0214IR10VW-19 10/28/05 9:53 0.0 0.0 0.0 0.0000 0.00 0.0000 0.0517IR10VW-20 10/28/05 10:10 0.1 0.0 0.0 0.0000 0.00 0.0000 0.1001IR10VW-21 10/28/05 10:15 2.6 0.0 0.0 0.0000 0.00 0.0000 0.5733IR10VW-22 10/28/05 10:32 0.0 0.0 0.0 0.0000 0.00 0.0000 0.0918IR10VW-23 10/28/05 10:24 2.8 0.0 0.0 0.0000 0.00 0.0000 2.4789
Total Flow 0.0 0.0000 Avg. Yield Rate Total Yield 5.400
SYSTEM OFF (ALL WELLS) 1229.9 hour meter
Table 3 Summary of Monitoring at Individual Wells Page 15 of 23

TABLE 3: Summary of System Yield at Individual Wells Based on PID MonitoringPhase III SVE Treatability StudyBuilding 123, Parcel B, Hunters Point ShipyardSan Francisco, California
SYSTEM OFF (ALL WELLS) 11/11/05 1229.9 hour meter
PID Air Velocity Pressure Temp. Flow Flow Yield RateOperation
IntervalYield
(interval)Cumulative
YieldLocation Time (ppmv) (ft/min) (in-Hg) (F) (acfm) (scfm) (lbs/day) (days) (lbs) (lbs) Notes
IR10VW-01 11/11/05 10:25 2.8 0.0 0.0 0.0000 0.00 0.0000 0.6864IR10VW-02 11/11/05 10:06 0.3 0.0 0.0 0.0000 0.00 0.0000 0.0060IR10VW-03 11/11/05 10:45 0.0 0.0 0.0 0.0000 0.00 0.0000 0.2655IR10VW-04 11/11/05 10:14 1.2 0.0 0.0 0.0000 0.00 0.0000 0.1078IR10VW-05 11/11/05 10:23 0.0 0.0 0.0 0.0000 0.00 0.0000 0.0458IR10VW-06 11/11/05 10:03 0.0 0.0 0.0 0.0000 0.00 0.0000 0.0177IR10VW-07 11/11/05 10:31 0.0 0.0 0.0 0.0000 0.00 0.0000 0.0231IR10VW-08 11/11/05 10:52 1.1 0.0 0.0 0.0000 0.00 0.0000 0.3545IR10VW-09 11/11/05 10:55 3.6 0.0 0.0 0.0000 0.00 0.0000 0.0526IR10VW-10 11/11/05 11:00 0.4 0.0 0.0 0.0000 0.00 0.0000 0.0765IR10VW-11 11/11/05 10:16 0.0 0.0 0.0 0.0000 0.00 0.0000 0.0091IR10VW-12 11/11/05 11:15 3.2 0.0 0.0 0.0000 0.00 0.0000 0.1674IR10VW-13 11/11/05 11:25 0.1 0.0 0.0 0.0000 0.00 0.0000 0.0338IR10VW-14 11/11/05 10:01 0.0 0.0 0.0 0.0000 0.00 0.0000 0.0496IR10VW-15 11/11/05 11:23 0.7 0.0 0.0 0.0000 0.00 0.0000 0.0377IR10VW-16 11/11/05 11:33 0.0 0.0 0.0 0.0000 0.00 0.0000 0.0256IR10VW-17 11/11/05 11:36 2.8 0.0 0.0 0.0000 0.00 0.0000 0.1235IR10VW-18 11/11/05 9:57 0.0 0.0 0.0 0.0000 0.00 0.0000 0.0214IR10VW-19 11/11/05 10:10 0.0 0.0 0.0 0.0000 0.00 0.0000 0.0517IR10VW-20 11/11/05 10:27 0.1 0.0 0.0 0.0000 0.00 0.0000 0.1001IR10VW-21 11/11/05 10:34 4.2 0.0 0.0 0.0000 0.00 0.0000 0.5733IR10VW-22 11/11/05 10:49 0.0 0.0 0.0 0.0000 0.00 0.0000 0.0918IR10VW-23 11/11/05 11:10 3.8 0.0 0.0 0.0000 0.00 0.0000 2.4789
Total Flow 0.0 0.0000 Avg. Yield Rate Total Yield 5.400
SYSTEM OFF (ALL WELLS) 1229.9 hour meter
Table 3 Summary of Monitoring at Individual Wells Page 16 of 23

TABLE 3: Summary of System Yield at Individual Wells Based on PID MonitoringPhase III SVE Treatability StudyBuilding 123, Parcel B, Hunters Point ShipyardSan Francisco, California
SYSTEM OFF (ALL WELLS) 11/30/05 1229.9 hour meter
PID Air Velocity Pressure Temp. Flow Flow Yield RateOperation
IntervalYield
(interval)Cumulative
YieldLocation Time (ppmv) (ft/min) (in-Hg) (F) (acfm) (scfm) (lbs/day) (days) (lbs) (lbs) Notes
IR10VW-01 11/30/05 8:59 3.3 0.0 0.0 0.0000 0.00 0.0000 0.6864IR10VW-02 11/30/05 8:39 0.5 0.0 0.0 0.0000 0.00 0.0000 0.0060IR10VW-03 11/30/05 9:21 0.0 0.0 0.0 0.0000 0.00 0.0000 0.2655IR10VW-04 11/30/05 8:47 1.2 0.0 0.0 0.0000 0.00 0.0000 0.1078IR10VW-05 11/30/05 8:53 0.1 0.0 0.0 0.0000 0.00 0.0000 0.0458IR10VW-06 11/30/05 8:33 0.0 0.0 0.0 0.0000 0.00 0.0000 0.0177IR10VW-07 11/30/05 9:02 0.0 0.0 0.0 0.0000 0.00 0.0000 0.0231IR10VW-08 11/30/05 9:24 1.9 0.0 0.0 0.0000 0.00 0.0000 0.3545IR10VW-09 11/30/05 9:30 5.1 0.0 0.0 0.0000 0.00 0.0000 0.0526IR10VW-10 11/30/05 9:35 0.7 0.0 0.0 0.0000 0.00 0.0000 0.0765IR10VW-11 11/30/05 8:49 0.0 0.0 0.0 0.0000 0.00 0.0000 0.0091IR10VW-12 11/30/05 9:48 3.6 0.0 0.0 0.0000 0.00 0.0000 0.1674IR10VW-13 11/30/05 9:55 0.1 0.0 0.0 0.0000 0.00 0.0000 0.0338IR10VW-14 11/30/05 8:36 0.0 0.0 0.0 0.0000 0.00 0.0000 0.0496IR10VW-15 11/30/05 9:58 1.4 0.0 0.0 0.0000 0.00 0.0000 0.0377IR10VW-16 11/30/05 10:03 0.0 0.0 0.0 0.0000 0.00 0.0000 0.0256IR10VW-17 11/30/05 10:07 4.4 0.0 0.0 0.0000 0.00 0.0000 0.1235IR10VW-18 11/30/05 8:29 0.0 0.0 0.0 0.0000 0.00 0.0000 0.0214IR10VW-19 11/30/05 8:43 0.0 0.0 0.0 0.0000 0.00 0.0000 0.0517IR10VW-20 11/30/05 8:56 0.0 0.0 0.0 0.0000 0.00 0.0000 0.1001IR10VW-21 11/30/05 9:04 6.0 0.0 0.0 0.0000 0.00 0.0000 0.5733IR10VW-22 11/30/05 9:18 0.0 0.0 0.0 0.0000 0.00 0.0000 0.0918IR10VW-23 11/30/05 9:10 5.0 0.0 0.0 0.0000 0.00 0.0000 2.4789
Total Flow 0.0 0.0000 Avg. Yield Rate Total Yield 5.400
SYSTEM OFF (ALL WELLS) 1229.9 hour meter
Table 3 Summary of Monitoring at Individual Wells Page 17 of 23

TABLE 3: Summary of System Yield at Individual Wells Based on PID MonitoringPhase III SVE Treatability StudyBuilding 123, Parcel B, Hunters Point ShipyardSan Francisco, California
SYSTEM OFF (ALL WELLS) 12/16/05 1229.9 hour meter
PID Air Velocity Pressure Temp. Flow Flow Yield RateOperation
IntervalYield
(interval)Cumulative
YieldLocation Time (ppmv) (ft/min) (in-Hg) (F) (acfm) (scfm) (lbs/day) (days) (lbs) (lbs) Notes
IR10VW-01 12/16/05 11:49 4.4 0.0 0.0 0.0000 0.00 0.0000 0.6864IR10VW-02 12/16/05 11:28 0.8 0.0 0.0 0.0000 0.00 0.0000 0.0060IR10VW-03 12/16/05 12:09 0.0 0.0 0.0 0.0000 0.00 0.0000 0.2655IR10VW-04 12/16/05 11:37 1.9 0.0 0.0 0.0000 0.00 0.0000 0.1078IR10VW-05 12/16/05 11:43 0.3 0.0 0.0 0.0000 0.00 0.0000 0.0458IR10VW-06 12/16/05 11:21 0.0 0.0 0.0 0.0000 0.00 0.0000 0.0177IR10VW-07 12/16/05 11:52 0.0 0.0 0.0 0.0000 0.00 0.0000 0.0231IR10VW-08 12/16/05 12:16 1.4 0.0 0.0 0.0000 0.00 0.0000 0.3545IR10VW-09 12/16/05 12:21 6.8 0.0 0.0 0.0000 0.00 0.0000 0.0526IR10VW-10 12/16/05 12:25 1.4 0.0 0.0 0.0000 0.00 0.0000 0.0765IR10VW-11 12/16/05 11:39 0.0 0.0 0.0 0.0000 0.00 0.0000 0.0091IR10VW-12 12/16/05 12:38 4.4 0.0 0.0 0.0000 0.00 0.0000 0.1674IR10VW-13 12/16/05 12:45 0.0 0.0 0.0 0.0000 0.00 0.0000 0.0338IR10VW-14 12/16/05 11:25 0.0 0.0 0.0 0.0000 0.00 0.0000 0.0496IR10VW-15 12/16/05 12:48 0.9 0.0 0.0 0.0000 0.00 0.0000 0.0377IR10VW-16 12/16/05 12:53 0.0 0.0 0.0 0.0000 0.00 0.0000 0.0256IR10VW-17 12/16/05 12:59 6.8 0.0 0.0 0.0000 0.00 0.0000 0.1235IR10VW-18 12/16/05 11:18 0.0 0.0 0.0 0.0000 0.00 0.0000 0.0214IR10VW-19 12/16/05 11:33 0.1 0.0 0.0 0.0000 0.00 0.0000 0.0517IR10VW-20 12/16/05 11:46 0.0 0.0 0.0 0.0000 0.00 0.0000 0.1001IR10VW-21 12/16/05 11:53 7.7 0.0 0.0 0.0000 0.00 0.0000 0.5733IR10VW-22 12/16/05 12:06 0.0 0.0 0.0 0.0000 0.00 0.0000 0.0918IR10VW-23 12/16/05 12:01 6.8 0.0 0.0 0.0000 0.00 0.0000 2.4789
Total Flow 0.0 0.0000 Avg. Yield Rate Total Yield 5.400
SYSTEM OFF (ALL WELLS) 1229.9 hour meter
Table 3 Summary of Monitoring at Individual Wells Page 18 of 23

TABLE 3: Summary of System Yield at Individual Wells Based on PID MonitoringPhase III SVE Treatability StudyBuilding 123, Parcel B, Hunters Point ShipyardSan Francisco, California
SYSTEM OFF (ALL WELLS) 12/30/05 1229.9 hour meter
PID Air Velocity Pressure Temp. Flow Flow Yield RateOperation
IntervalYield
(interval)Cumulative
YieldLocation Time (ppmv) (ft/min) (in-Hg) (F) (acfm) (scfm) (lbs/day) (days) (lbs) (lbs) Notes
IR10VW-01 12/30/05 11:09 0.0 0.0 0.0 0.0000 0.00 0.0000 0.6864IR10VW-02 12/30/05 10:49 0.7 0.0 0.0 0.0000 0.00 0.0000 0.0060IR10VW-03 12/30/05 11:30 0.0 0.0 0.0 0.0000 0.00 0.0000 0.2655IR10VW-04 12/30/05 10:56 1.8 0.0 0.0 0.0000 0.00 0.0000 0.1078IR10VW-05 12/30/05 11:03 0.1 0.0 0.0 0.0000 0.00 0.0000 0.0458IR10VW-06 12/30/05 10:42 0.0 0.0 0.0 0.0000 0.00 0.0000 0.0177IR10VW-07 12/30/05 11:12 0.0 0.0 0.0 0.0000 0.00 0.0000 0.0231IR10VW-08 12/30/05 11:35 1.8 0.0 0.0 0.0000 0.00 0.0000 0.3545IR10VW-09 12/30/05 11:40 7.0 0.0 0.0 0.0000 0.00 0.0000 0.0526IR10VW-10 12/30/05 11:45 1.2 0.0 0.0 0.0000 0.00 0.0000 0.0765IR10VW-11 12/30/05 10:59 0.0 0.0 0.0 0.0000 0.00 0.0000 0.0091IR10VW-12 12/30/05 11:58 4.7 0.0 0.0 0.0000 0.00 0.0000 0.1674IR10VW-13 12/30/05 12:05 0.1 0.0 0.0 0.0000 0.00 0.0000 0.0338IR10VW-14 12/30/05 10:46 0.0 0.0 0.0 0.0000 0.00 0.0000 0.0496IR10VW-15 12/30/05 12:08 1.2 0.0 0.0 0.0000 0.00 0.0000 0.0377IR10VW-16 12/30/05 12:13 0.0 0.0 0.0 0.0000 0.00 0.0000 0.0256IR10VW-17 12/30/05 12:18 7.6 0.0 0.0 0.0000 0.00 0.0000 0.1235IR10VW-18 12/30/05 10:40 0.0 0.0 0.0 0.0000 0.00 0.0000 0.0214IR10VW-19 12/30/05 10:53 0.1 0.0 0.0 0.0000 0.00 0.0000 0.0517IR10VW-20 12/30/05 11:07 0.1 0.0 0.0 0.0000 0.00 0.0000 0.1001IR10VW-21 12/30/05 11:14 8.7 0.0 0.0 0.0000 0.00 0.0000 0.5733IR10VW-22 12/30/05 11:28 0.0 0.0 0.0 0.0000 0.00 0.0000 0.0918IR10VW-23 12/30/05 11:20 4.7 0.0 0.0 0.0000 0.00 0.0000 2.4789
Total Flow 0.0 0.0000 Avg. Yield Rate Total Yield 5.400
SYSTEM OFF (ALL WELLS) 1229.9 hour meter
Table 3 Summary of Monitoring at Individual Wells Page 19 of 23
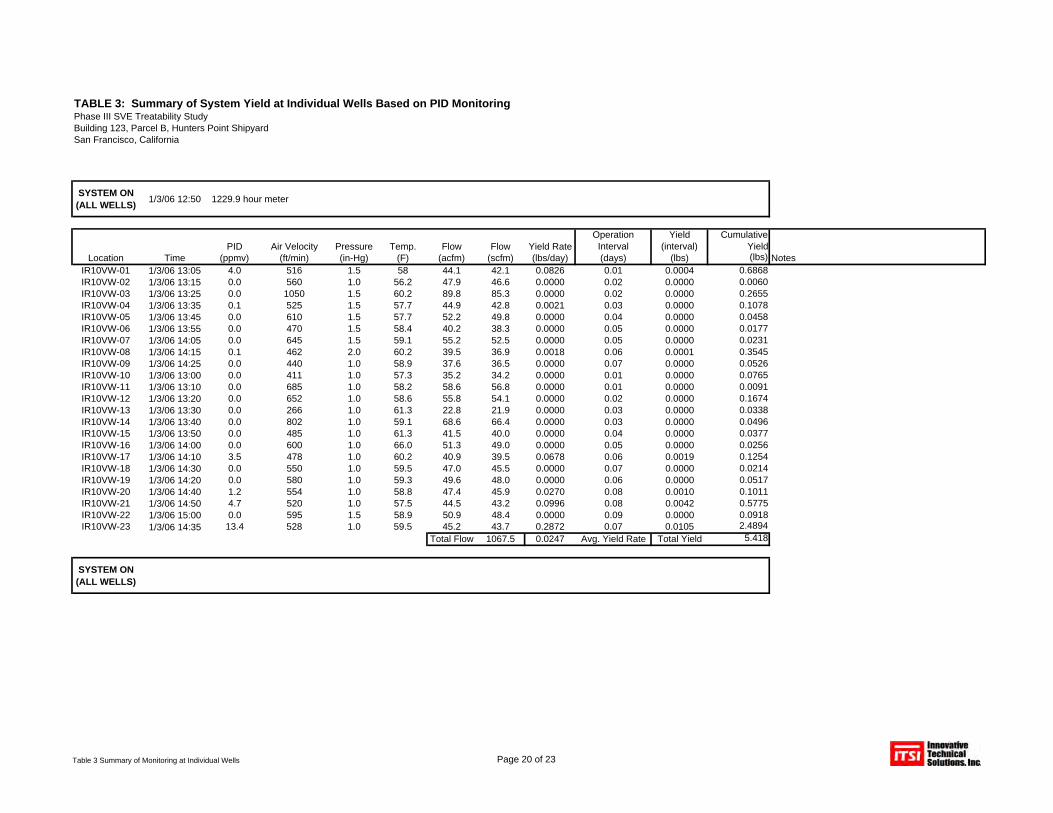
TABLE 3: Summary of System Yield at Individual Wells Based on PID MonitoringPhase III SVE Treatability StudyBuilding 123, Parcel B, Hunters Point ShipyardSan Francisco, California
SYSTEM ON (ALL WELLS) 1/3/06 12:50 1229.9 hour meter
PID Air Velocity Pressure Temp. Flow Flow Yield RateOperation
IntervalYield
(interval)Cumulative
YieldLocation Time (ppmv) (ft/min) (in-Hg) (F) (acfm) (scfm) (lbs/day) (days) (lbs) (lbs) Notes
IR10VW-01 1/3/06 13:05 4.0 516 1.5 58 44.1 42.1 0.0826 0.01 0.0004 0.6868IR10VW-02 1/3/06 13:15 0.0 560 1.0 56.2 47.9 46.6 0.0000 0.02 0.0000 0.0060IR10VW-03 1/3/06 13:25 0.0 1050 1.5 60.2 89.8 85.3 0.0000 0.02 0.0000 0.2655IR10VW-04 1/3/06 13:35 0.1 525 1.5 57.7 44.9 42.8 0.0021 0.03 0.0000 0.1078IR10VW-05 1/3/06 13:45 0.0 610 1.5 57.7 52.2 49.8 0.0000 0.04 0.0000 0.0458IR10VW-06 1/3/06 13:55 0.0 470 1.5 58.4 40.2 38.3 0.0000 0.05 0.0000 0.0177IR10VW-07 1/3/06 14:05 0.0 645 1.5 59.1 55.2 52.5 0.0000 0.05 0.0000 0.0231IR10VW-08 1/3/06 14:15 0.1 462 2.0 60.2 39.5 36.9 0.0018 0.06 0.0001 0.3545IR10VW-09 1/3/06 14:25 0.0 440 1.0 58.9 37.6 36.5 0.0000 0.07 0.0000 0.0526IR10VW-10 1/3/06 13:00 0.0 411 1.0 57.3 35.2 34.2 0.0000 0.01 0.0000 0.0765IR10VW-11 1/3/06 13:10 0.0 685 1.0 58.2 58.6 56.8 0.0000 0.01 0.0000 0.0091IR10VW-12 1/3/06 13:20 0.0 652 1.0 58.6 55.8 54.1 0.0000 0.02 0.0000 0.1674IR10VW-13 1/3/06 13:30 0.0 266 1.0 61.3 22.8 21.9 0.0000 0.03 0.0000 0.0338IR10VW-14 1/3/06 13:40 0.0 802 1.0 59.1 68.6 66.4 0.0000 0.03 0.0000 0.0496IR10VW-15 1/3/06 13:50 0.0 485 1.0 61.3 41.5 40.0 0.0000 0.04 0.0000 0.0377IR10VW-16 1/3/06 14:00 0.0 600 1.0 66.0 51.3 49.0 0.0000 0.05 0.0000 0.0256IR10VW-17 1/3/06 14:10 3.5 478 1.0 60.2 40.9 39.5 0.0678 0.06 0.0019 0.1254IR10VW-18 1/3/06 14:30 0.0 550 1.0 59.5 47.0 45.5 0.0000 0.07 0.0000 0.0214IR10VW-19 1/3/06 14:20 0.0 580 1.0 59.3 49.6 48.0 0.0000 0.06 0.0000 0.0517IR10VW-20 1/3/06 14:40 1.2 554 1.0 58.8 47.4 45.9 0.0270 0.08 0.0010 0.1011IR10VW-21 1/3/06 14:50 4.7 520 1.0 57.5 44.5 43.2 0.0996 0.08 0.0042 0.5775IR10VW-22 1/3/06 15:00 0.0 595 1.5 58.9 50.9 48.4 0.0000 0.09 0.0000 0.0918IR10VW-23 1/3/06 14:35 13.4 528 1.0 59.5 45.2 43.7 0.2872 0.07 0.0105 2.4894
Total Flow 1067.5 0.0247 Avg. Yield Rate Total Yield 5.418
SYSTEM ON (ALL WELLS)
Table 3 Summary of Monitoring at Individual Wells Page 20 of 23

TABLE 3: Summary of System Yield at Individual Wells Based on PID MonitoringPhase III SVE Treatability StudyBuilding 123, Parcel B, Hunters Point ShipyardSan Francisco, California
SYSTEM ON (ALL WELLS)
PID Air Velocity Pressure Temp. Flow Flow Yield RateOperation
IntervalYield
(interval)Cumulative
YieldLocation Time (ppmv) (ft/min) (in-Hg) (F) (acfm) (scfm) (lbs/day) (days) (lbs) (lbs) Notes
IR10VW-01 1/11/06 13:05 2.7 415 2.0 56.6 35.5 33.3 0.0442 8.01 0.5077 1.1945IR10VW-02 1/11/06 13:05 0.0 420 1.0 56.1 35.9 35.0 0.0000 8.01 0.0000 0.0060IR10VW-03 1/11/06 13:05 0.1 605 1.0 56.6 51.7 50.4 0.0025 8.01 0.0099 0.2754IR10VW-04 1/11/06 13:05 0.0 411 2.0 57 35.2 33.0 0.0000 8.01 0.0084 0.1162IR10VW-05 1/11/06 13:05 0.0 355 1.0 56.1 30.4 29.6 0.0000 8.01 0.0000 0.0458IR10VW-06 1/11/06 13:05 0.0 449 2.0 56.8 38.4 36.1 0.0000 8.01 0.0000 0.0177IR10VW-07 1/11/06 13:05 0.0 244 1.0 56.2 20.9 20.3 0.0000 8.01 0.0000 0.0231IR10VW-08 1/11/06 13:05 0.0 425 2.0 56.6 36.4 34.2 0.0000 8.01 0.0072 0.3618IR10VW-09 1/11/06 13:05 0.0 415 2.0 56.6 35.5 33.3 0.0000 8.01 0.0000 0.0526IR10VW-10 1/11/06 13:05 0.0 426 2.0 56.8 36.4 34.2 0.0000 8.01 0.0000 0.0765IR10VW-11 1/11/06 13:05 0.0 240 1.0 57.7 20.5 19.9 0.0000 8.01 0.0000 0.0091IR10VW-12 1/11/06 13:05 0.0 277 2.0 57.0 23.7 22.2 0.0000 8.01 0.0000 0.1674IR10VW-13 1/11/06 13:05 0.0 301 0.5 57.3 25.7 25.4 0.0000 8.01 0.0000 0.0338IR10VW-14 1/11/06 13:05 0.0 375 1.0 58.4 32.1 31.1 0.0000 8.01 0.0000 0.0496IR10VW-15 1/11/06 13:05 0.0 475 1.0 58 40.6 39.4 0.0000 8.01 0.0000 0.0377IR10VW-16 1/11/06 13:05 0.0 345 1.0 57.9 29.5 28.6 0.0000 8.01 0.0000 0.0256IR10VW-17 1/11/06 13:05 0.0 439 1.0 57.5 37.5 36.5 0.0000 8.01 0.2717 0.3971IR10VW-18 1/11/06 13:05 0.0 310 1.0 58.8 26.5 25.7 0.0000 8.01 0.0000 0.0214IR10VW-19 1/11/06 13:05 0.0 270 1.0 57.5 23.1 22.4 0.0000 8.01 0.0000 0.0517IR10VW-20 1/11/06 13:05 1.8 390 1.0 56.6 33.4 32.5 0.0287 8.01 0.2230 0.3241IR10VW-21 1/11/06 13:05 2.2 345 1.0 55.9 29.5 28.8 0.0310 8.01 0.5232 1.1007IR10VW-22 1/11/06 13:05 0.6 331 1.0 56.4 28.3 27.6 0.0081 8.01 0.0325 0.1243IR10VW-23 1/11/06 13:05 27.3 355 1.0 55.7 30.4 29.6 0.3964 8.01 2.7380 5.2274
Total Flow 709.1 0.0222 Avg. Yield Rate Total Yield 9.740
SYSTEM OFF (ALL WELLS) 1/11/06 12:00 1470.1 hour meter
Table 3 Summary of Monitoring at Individual Wells Page 21 of 23

TABLE 3: Summary of System Yield at Individual Wells Based on PID MonitoringPhase III SVE Treatability StudyBuilding 123, Parcel B, Hunters Point ShipyardSan Francisco, California
SYSTEM OFF (ALL WELLS)
PID Air Velocity Pressure Temp. Flow Flow Yield RateOperation
IntervalYield
(interval)Cumulative
YieldLocation Time (ppmv) (ft/min) (in-Hg) (F) (acfm) (scfm) (lbs/day) (days) (lbs) (lbs) Notes
IR10VW-01 2/1/06 11:37 0.0 0.0 0.0 0.0000 20.98 0.0000 1.1945IR10VW-02 2/1/06 11:40 0.0 0.0 0.0 0.0000 20.99 0.0000 0.0060IR10VW-03 2/1/06 11:46 0.0 0.0 0.0 0.0000 20.99 0.0000 0.2754IR10VW-04 2/1/06 11:52 0.5 0.0 0.0 0.0000 20.99 0.0000 0.1162IR10VW-05 2/1/06 11:57 0.0 0.0 0.0 0.0000 21.00 0.0000 0.0458IR10VW-06 2/1/06 12:02 0.1 0.0 0.0 0.0000 21.00 0.0000 0.0177IR10VW-07 2/1/06 12:10 0.0 0.0 0.0 0.0000 21.01 0.0000 0.0231IR10VW-08 2/1/06 12:15 0.0 0.0 0.0 0.0000 21.01 0.0000 0.3618IR10VW-09 2/1/06 11:30 3.2 0.0 0.0 0.0000 20.98 0.0000 0.0526IR10VW-10 2/1/06 11:24 0.5 0.0 0.0 0.0000 20.97 0.0000 0.0765IR10VW-11 2/1/06 11:20 0.0 0.0 0.0 0.0000 20.97 0.0000 0.0091IR10VW-12 2/1/06 11:15 0.5 0.0 0.0 0.0000 20.97 0.0000 0.1674IR10VW-13 2/1/06 11:04 0.0 0.0 0.0 0.0000 20.96 0.0000 0.0338IR10VW-14 2/1/06 11:10 0.0 0.0 0.0 0.0000 20.97 0.0000 0.0496IR10VW-15 2/1/06 10:57 0.1 0.0 0.0 0.0000 20.96 0.0000 0.0377IR10VW-16 2/1/06 10:10 0.0 0.0 0.0 0.0000 20.92 0.0000 0.0256IR10VW-17 2/1/06 10:15 2.1 0.0 0.0 0.0000 20.93 0.0000 0.3971IR10VW-18 2/1/06 10:20 0.0 0.0 0.0 0.0000 20.93 0.0000 0.0214IR10VW-19 2/1/06 10:30 0.0 0.0 0.0 0.0000 20.94 0.0000 0.0517IR10VW-20 2/1/06 10:48 0.1 0.0 0.0 0.0000 20.95 0.0000 0.3241IR10VW-21 2/1/06 10:23 3.2 0.0 0.0 0.0000 20.93 0.0000 1.1007IR10VW-22 2/1/06 10:41 0.0 0.0 0.0 0.0000 20.95 0.0000 0.1243IR10VW-23 2/1/06 10:05 5.2 0.0 0.0 0.0000 20.92 0.0000 5.2274
Total Flow 0.0 0.0000 Avg. Yield Rate Total Yield 9.740
SYSTEM OFF (ALL WELLS) 2/1/06 12:00 1470.1 hour meter
Table 3 Summary of Monitoring at Individual Wells Page 22 of 23

TABLE 3: Summary of System Yield at Individual Wells Based on PID MonitoringPhase III SVE Treatability StudyBuilding 123, Parcel B, Hunters Point ShipyardSan Francisco, California
Notes:
Yield = system yield in lbs/day[PID] = VOC concentration in ppmv as µft3/ft3
MW = molecular weight (131.5 lb TCE/lb-mole)Q = flow in scfm
PID = photoionizing detectorTCE = trichloroetheneppmv = parts per million by volumescfm = standard cubic feet per minuteµft3 = microcubic feetft3 = cubic feetlbs/day = pounds per daylbs = poundsft/min = feet per minutein-Hg = inches mercuryF = Fahrenheitacfm = actual cubic feet per minutescfm = standard cubic feet per minute
[ ] dayMinutes
ftmolelbQMWft
ftPIDYield 144000259.010 33
36 ∗⎟
⎠⎞
⎜⎝⎛ −∗∗∗∗= −
µ
Table 3 Summary of Monitoring at Individual Wells Page 23 of 23

TABLE 4: Summary of Soil Analytical Results for VOCsPhase III SVE Treatability StudyBuilding 123, Parcel B, Hunters Point ShipyardSan Francisco, California
Depth Tric
hlor
oeth
ene
Tetr
achl
oroe
then
e
Nap
htha
lene
Car
bon
Dis
ulfid
e
Oth
er V
OC
s
Location Sample ID Type Date (feet bgs) (ug/kg) (ug/kg) (ug/kg) (ug/kg) (ug/kg)IR10SG048 0502T009 Temp. 1/13/2005 8.0-9.0 2,100 <4.7 <4.7 <4.7 <RLIR10SG049 0502T010 Temp. 1/13/2005 8.0-9.0 9.1 <5.0 <5.0 <5.0 <RLIR10SG050 0502T011 Temp. 1/13/2005 8.0-9.0 18 <5.8 <5.8 <5.8 <RLIR10SG051 0502T008 Temp. 1/13/2005 8.0-9.0 <6.6 <6.6 <6.6 <6.6 <RLIR10SG052 0502T007 Temp. 1/13/2005 8.0-9.0 <5.2 <5.2 <5.2 <5.2 <RLIR10SG053 0502T012 Temp. 1/13/2005 8.0-9.0 1400 J <5.7 <5.7 <5.7 <RLIR10SG054 0502T005 Temp. 1/13/2005 8.0-9.0 <4.6 <4.6 <4.6 <4.6 <RLIR10SG054 (dup) 0502T006 Temp. 1/13/2005 8.0-9.0 <4.6 <4.6 <4.6 <4.6 <RLIR10SG055 0502T003 Temp. 1/13/2005 8.0-9.0 2,400 <5.2 <5.2 <5.2 <RLIR10SG056 0502T004 Temp. 1/13/2005 8.0-9.0 1,200 <5.9 <5.9 <5.9 <RLIR10SG057 0502T002 Temp. 1/13/2005 8.0-9.0 8,000 <140 <140 <140 <RLIR10SG058 0502T016 Temp. 1/14/2005 5.0-6.0 49 <5.0 UJ <5.0 <5.0 <RLIR10SG059 0502T017 Temp. 1/14/2005 5.0-6.0 <4.8 <4.8 UJ <4.8 <4.8 <RLIR10SG060 0502T021 Temp. 1/14/2005 5.0-6.0 <5.7 <5.7 UJ <5.7 <5.7 <RLIR10SG060 (dup) 0502T022 Temp. 1/14/2005 5.0-6.0 <5.6 <5.6 UJ <5.6 <5.6 <RLIR10SG061 0502T020 Temp. 1/14/2005 5.0-6.0 21 <5.7 <5.7 <5.7 <RLIR10SG062 0502T018 Temp. 1/14/2005 5.0-6.0 <5.6 <5.6 UJ 21 J <5.6 <RLIR10SG063 0502T024 Temp. 1/14/2005 5.0-6.0 <5.5 <5.5 UJ <5.5 <5.5 <RLIR10SG064 0502T023 Temp. 1/14/2005 5.0-6.0 <5.1 <5.1 UJ <5.1 <5.1 <RLIR10SG065 0502T019 Temp. 1/14/2005 5.0-6.0 <4.9 <4.9 UJ <4.9 <4.9 <RLIR10SG066 0512T057 Temp. 3/23/2005 9.0-10.0 <5.3 <5.3 <5.3 <5.3 <RLIR10SG067 0512T055 Temp. 3/23/2005 8.0-9.0 <5.6 <5.6 <5.6 <5.6 <RLIR10SG067 (dup) 0512T056 Temp. 3/23/2005 8.0-9.0 <5.3 <5.3 <5.3 <5.3 <RLIR10SG068 0512T054 Temp. 3/23/2005 8.0-9.0 <4.9 <4.9 <4.9 <4.9 <RLIR10SG069 0512T053 Temp. 3/23/2005 8.0-9.0 <6.0 <6.0 <6.0 <6.0 <RLIR10SG070 0512T052 Temp. 3/23/2005 8.0-9.0 <5.1 <5.1 <5.1 <5.1 <RLIR10SG071 0512T051 Temp. 3/23/2005 5.0-6.0 <5.4 <5.4 <5.4 <5.4 <RL
Table 4 Soil Results for VOCs Page 1 of 2

TABLE 4: Summary of Soil Analytical Results for VOCsPhase III SVE Treatability StudyBuilding 123, Parcel B, Hunters Point ShipyardSan Francisco, California
Depth Tric
hlor
oeth
ene
Tetr
achl
oroe
then
e
Nap
htha
lene
Car
bon
Dis
ulfid
e
Oth
er V
OC
s
Location Sample ID Type Date (feet bgs) (ug/kg) (ug/kg) (ug/kg) (ug/kg) (ug/kg)IR10SG072 0521T109 VM Well 5/23/2005 5.0-6.0 2,000 <5.8 <5.8 <5.8 <RLIR10SG073 0521T111 VM Well 5/23/2005 5.0-6.0 240 <5.2 <5.2 <5.2 <RLIR10SG073 (dup) 0521T113 VM Well 5/23/2005 4.0-5.0 140J <5.9 <5.9 9.9 <RLIR10SG074 0521T105 VM Well 5/23/2005 2.0-3.0 880 <5.7 <5.7 <5.7 <RLIR10SG074 0521T107 VM Well 5/23/2005 4.0-5.0 36,000 <5.2 <5.2 <5.2 <RLIR10SG075 0520T083 VM Well 5/19/2005 5.0-6.0 1,100 <6.0 <6.0 <6.0 UJ <RLIR10SG075 (dup) 0520T085 VM Well 5/19/2005 5.0-6.0 1,600 <6.8 <6.8 <6.8 UJ <RLIR10SG076 0521T114 VM Well 5/23/2005 4.0-5.0 <5.9 <5.9 <5.9 <5.9 <RLIR10SG077 0520T076 VM Well 5/18/2005 5.0-6.0 1,900 <5.7 <5.7 17 <RL
IR10VW15A 0520T098 SVE Well 5/20/2005 7.0-8.0 11,000 <140 <140 <140 <RLIR10VW15A (dup) 0520T099 SVE Well 5/20/2005 8.0-9.0 7,300 <140 <140 <140 <RLIR10VW16A 0520T101 SVE Well 5/20/2005 7.0-8.0 <4.7 <4.7 <4.7 <4.7 <RLIR10VW17A 0520T096 SVE Well 5/20/2005 7.0-8.0 26 J <4.8 <4.8 <4.8 <RLIR10VW18A 0520T071 SVE Well 5/18/2005 2.0-3.0 720 <5.3 <5.3 <5.3 <RLIR10VW18A 0520T073 SVE Well 5/18/2005 7.0-8.0 13 <5.3 <5.3 <5.3 <RLIR10VW19A 0520T067 SVE Well 5/18/2005 7.0-8.0 73 <4.5 <4.5 <4.5 <RLIR10VW20A 0520T079 SVE Well 5/18/2005 7.0-8.0 <5.1 <5.1 <5.1 <5.1 <RLIR10VW21A 0520T093 SVE Well 5/19/2005 7.0-8.0 120 <6.6 <6.6 <6.6 UJ <RLIR10VW22A 0520T086 SVE Well 5/19/2005 3.0-4.0 5,000 350 <130 <130 <RLIR10VW22A 0520T087 SVE Well 5/19/2005 8.0-9.0 25 <5.9 <5.9 <5.9 <RLIR10VW23A 0520T090 SVE Well 5/19/2005 7.0-8.0 <7.7 <7.7 <7.7 <7.7 UJ <RL
Notes:ug/kg = micrograms per kilogram <RL = Less than laboratory reporting limitsfeet bgs = feet below ground surface(dup) = sample is a duplicate of previously listed sample
Table 4 Soil Results for VOCs Page 2 of 2

TABLE 5: Summary of Soil Analytical Results for Geotechnical ParametersPhase III SVE Treatability StudyBuilding 123, Parcel B, Hunters Point ShipyardSan Francisco, California
Depth
Total Organic Carbon
Bulk Density
Specific Gravity at 20o C
Moisture Content
Hydraulic Conductivity
Location Sample ID Type Date (feet bgs) (%) (lbs/ft3) (unitless) (%) (cm/s)IR10SG048 0502T009 Temp. 1/13/2005 8.0-9.0 - - - 11.0 -IR10SG049 0502T010 Temp. 1/13/2005 8.0-9.0 - - - 13.0 -IR10SG050 0502T011 Temp. 1/13/2005 8.0-9.0 - - - 16.0 -IR10SG051 0502T008 Temp. 1/13/2005 8.0-9.0 - - - 12.0 -IR10SG052 0502T007 Temp. 1/13/2005 8.0-9.0 - - - 9.0 -IR10SG053 0502T012 Temp. 1/13/2005 8.0-9.0 - - - 15.0 -IR10SG054 0502T005 Temp. 1/13/2005 8.0-9.0 - - - 13.0 -IR10SG054 (dup) 0502T006 Temp. 1/13/2005 8.0-9.0 - - - 10.0 -IR10SG055 0502T003 Temp. 1/13/2005 8.0-9.0 - - - 18.0 -IR10SG056 0502T004 Temp. 1/13/2005 8.0-9.0 - - - 15.0 -IR10SG057 0502T002 Temp. 1/13/2005 8.0-9.0 - - - 12.0 -IR10SG058 0502T016 Temp. 1/14/2005 5.0-6.0 - - - 16.0 -IR10SG059 0502T017 Temp. 1/14/2005 5.0-6.0 - - - 8.0 -IR10SG060 0502T021 Temp. 1/14/2005 5.0-6.0 - - - 22.0 -IR10SG060 (dup) 0502T022 Temp. 1/14/2005 5.0-6.0 - - - 19.0 -IR10SG061 0502T020 Temp. 1/14/2005 5.0-6.0 - - - 15.0 -IR10SG062 0502T018 Temp. 1/14/2005 5.0-6.0 - - - 12.0 -IR10SG063 0502T024 Temp. 1/14/2005 5.0-6.0 - - - 18.0 -IR10SG064 0502T023 Temp. 1/14/2005 5.0-6.0 - - - 15.0 -IR10SG065 0502T019 Temp. 1/14/2005 5.0-6.0 - - - 13.0 -IR10SG066 0512T057 Temp. 3/23/2005 9.0-10.0 - - - 16.0 -IR10SG067 0512T055 Temp. 3/23/2005 8.0-9.0 - - - 13.0 -IR10SG067 (dup) 0512T056 Temp. 3/23/2005 8.0-9.0 - - - 14.0 -IR10SG068 0512T054 Temp. 3/23/2005 8.0-9.0 - - - 8.0 -IR10SG069 0512T053 Temp. 3/23/2005 8.0-9.0 - - - 11.0 -IR10SG070 0512T052 Temp. 3/23/2005 8.0-9.0 - - - 10.0 -IR10SG071 0512T051 Temp. 3/23/2005 5.0-6.0 - - - 19.0 -
IR10SG072 0521T110 VM Well 5/23/2005 4.0-5.0 - 105.5 2.66 - 0.0000200IR10SG072 0521T109 VM Well 5/23/2005 5.0-6.0 0.11 - - 17.0 -IR10SG073 0521T112 VM Well 5/23/2005 2.0-3.0 - 120.5 2.69 - 0.000000331IR10SG073 0521T111 VM Well 5/23/2005 5.0-6.0 0.09 - - 13.0 -IR10SG073 (dup) 0521T113 VM Well 5/23/2005 4.0-5.0 0.10 - - 13.0 -IR10SG074 0521T105 VM Well 5/23/2005 2.0-3.0 0.11 - - 14.0 -IR10SG074 0521T106 VM Well 5/23/2005 3.0-4.0 - 101.8 2.69 - 0.00000329IR10SG074 0521T107 VM Well 5/23/2005 4.0-5.0 0.19 - - 15.0 -IR10SG074 0521T108 VM Well 5/23/2005 5.0-6.0 - 106.8 2.74 - 0.000000524IR10SG075 0520T084 VM Well 5/19/2005 3.0-4.0 - 123.0 2.79 - 0.0000490IR10SG075 0520T083 VM Well 5/19/2005 5.0-6.0 0.04 - - 13.0 -IR10SG075 (dup) 0520T085 VM Well 5/19/2005 5.0-6.0 0.13 - - 14.0 -IR10SG076 0521T114 VM Well 5/23/2005 4.0-5.0 0.13 - - 14.0 -IR10SG076 0521T115 VM Well 5/23/2005 5.0-6.0 - 103.0 2.71 - 0.000000774IR10SG077 0520T077 VM Well 5/18/2005 4.0-5.0 - 103.6 2.57 - 0.00000643IR10SG077 0520T076 VM Well 5/18/2005 5.0-6.0 0.13 - - 14.0 -
Table 5 Geotech Results Page 1 of 2

TABLE 5: Summary of Soil Analytical Results for Geotechnical ParametersPhase III SVE Treatability StudyBuilding 123, Parcel B, Hunters Point ShipyardSan Francisco, California
Depth
Total Organic Carbon
Bulk Density
Specific Gravity at 20o C
Moisture Content
Hydraulic Conductivity
Location Sample ID Type Date (feet bgs) (%) (lbs/ft3) (unitless) (%) (cm/s)IR10VW15A 0520T100 SVE Well 5/20/2005 6.0-7.0 - 94.3 2.62 - 0.00000637IR10VW15A 0520T098 SVE Well 5/20/2005 7.0-8.0 0.13 - - 12.0 -IR10VW15A (dup) 0520T099 SVE Well 5/20/2005 8.0-9.0 0.10 - - 13.0 -IR10VW16A 0520T102 SVE Well 5/20/2005 2.0-3.0 - 119.9 2.67 - 0.00000191IR10VW16A 0520T101 SVE Well 5/20/2005 7.0-8.0 0.31 - - 11.0 -IR10VW17A 0520T097 SVE Well 5/20/2005 3.0-4.0 - 126.1 2.70 - 0.000000357IR10VW17A 0520T096 SVE Well 5/20/2005 7.0-8.0 0.06 - - 9.0 -IR10VW18A 0520T071 SVE Well 5/18/2005 2.0-3.0 0.10 - - 13.0 -IR10VW18A 0520T072 SVE Well 5/18/2005 3.0-4.0 - 111.7 2.96 - 0.00155IR10VW18A 0520T073 SVE Well 5/18/2005 7.0-8.0 0.09 - - 13.0 -IR10VW18A 0520T074 SVE Well 5/18/2005 8.0-9.0 - 121.1 2.73 - 0.00150IR10VW19A 0520T067 SVE Well 5/18/2005 7.0-8.0 0.16 - - 14.0 -IR10VW19A 0520T069 SVE Well 5/18/2005 8.0-9.0 - 118.0 - - 0.000000225IR10VW20A 0520T080 SVE Well 5/18/2005 3.0-4.0 - 112.4 2.63 - -IR10VW20A 0520T079 SVE Well 5/18/2005 7.0-8.0 0.18 - - 16.0 -IR10VW21A 0520T094 SVE Well 5/19/2005 6.0-7.0 - 118.6 2.64 - 0.000000975IR10VW21A 0520T093 SVE Well 5/19/2005 7.0-8.0 0.08 - - 10.0 -IR10VW22A 0520T088 SVE Well 5/19/2005 2.0-3.0 - 127.4 2.61 - 0.0000017IR10VW22A 0520T086 SVE Well 5/19/2005 3.0-4.0 0.02 - - 2.0 -IR10VW22A 0520T089 SVE Well 5/19/2005 7.0-8.0 - 113.6 2.62 - 0.000235IR10VW22A 0520T087 SVE Well 5/19/2005 8.0-9.0 0.05 - - 2.0 -IR10VW23A 0520T090 SVE Well 5/19/2005 7.0-8.0 0.14 - - 12.0 -IR10VW23A 0520T091 SVE Well 5/19/2005 8.0-9.0 - 123.6 2.63 - 0.00000122
Average 0.12 113.9 2.69 13.1 0.000199
Notes:% = percent by volumecm/s = centimeters per secondfeet bgs = feet below ground surfacelbs/ft3 = pounds per cubic footoC = degrees Centigrade- = not analyzed(dup) = sample is a duplicate of previously listed sample
Table 5 Geotech Results Page 2 of 2

Table 6: Summary of Soil Gas Analytical Results for VOCsPhase III SVE Treatability StudyBuilding 123, Parcel B, Hunters Point ShipyardSan Francisco, California
Sample Depth Fr
eon
12
Viny
l Chl
orid
e
Freo
n 11
Etha
nol
Freo
n 11
3
Ace
tone
2-Pr
opan
ol
Car
bon
Dis
ulfid
e
Met
hyle
ne C
hlor
ide
Met
hyl t
ert-b
utyl
Eth
er
tran
s-1,
2-D
ichl
oroe
then
e
Hex
ane
1,1-
Dic
hlor
oeth
ane
2-B
utan
one
cis-
1,2-
Dic
hlor
oeth
ene
Tetr
ahyd
rofu
ran
Chl
orof
orm
1,1,
1-Tr
ichl
oroe
than
e
Location Sample ID Date (feet bgs) (ug/L) (ug/L) (ug/L) (ug/L) (ug/L) (ug/L) (ug/L) (ug/L) (ug/L) (ug/L) (ug/L) (ug/L) (ug/L) (ug/L) (ug/L) (ug/L) (ug/L) (ug/L)IR10SG048 0503T033 1/17/2005 8.5 0.69IR10SG049 0503T034 1/17/2005 8.5 0.62IR10SG050 0503T043 1/17/2005 8.5IR10SG051 0503T035 1/17/2005 8.5 0.025 0.14 0.0080 0.057 0.011 0.0036 0.0062 0.0025 0.0033 0.093IR10SG052 0503T036 1/17/2005 8.5 0.67IR10SG053 0503T042 1/17/2005 8.5IR10SG054 0503T037 1/17/2005 9.0 0.039 0.013 0.0063 0.010 0.48IR10SG055 0503T040 1/17/2005 9.0IR10SG055 (dup) 0503T041 1/17/2005 9.0IR10SG056 0503T038 1/17/2005 9.0 0.072 0.45IR10SG057 0503T039 1/17/2005 9.0 0.14IR10SG058 0503T028 1/17/2005 5.5 1.1IR10SG058 (dup) 0503T029 1/17/2005 5.5 1.1IR10SG059 0503T027 1/17/2005 5.5 0.018 0.0025 0.0062IR10SG060 0503T031 1/17/2005 5.5 0.043 0.013 0.0070 0.0048 0.0038 0.038 0.0045IR10SG061 0503T030 1/17/2005 5.5 3.7 0.059 0.063 0.57IR10SG062 0503T026 1/17/2005 5.5 0.016 0.48 0.15IR10SG063 0503T032 1/17/2005 5.5 0.043 0.0060 0.026 0.012IR10SG066 0512T062 3/24/2005 8 0.0050 0.048 0.014 0.011 0.67 0.045 0.036IR10SG067 0512T061 3/24/2005 8 0.088 0.024 0.010 0.019 0.052 0.0031 0.030 0.024IR10SG068 0512T063 3/24/2005 8 0.014 1.6 0.029 0.0045 0.024 0.0053IR10SG069 0512T064 3/24/2005 8 0.049 0.048IR10SG070 0512T065 3/24/2005 8 0.019 0.067 0.041 0.0068 0.032IR10SG071 0512T059 3/24/2005 5 0.011 0.014 0.041 0.19 0.28 0.014IR10SG071 (dup) 0512T060 3/24/2005 5 0.011 0.016 0.040 0.19 0.27 0.015Residential Shallow Soil Gas ESL (ug/L) 0.031 2.4 1.5 7.3 0.46 46Commercial/Industrial Shallow Soil ESL (ug/L) 0.10 8.2 5.1 20 1.5 130
Notes:blank space = analyte was not detected above the laboratory reporting limitug/L = micrograms/literfeet bgs = feet below ground surface(dup) = duplicate sample of previously listed sampleESLs are provided for Project Specific Critical Analytes as specified in the Sampling and Analysis Plan (ITSI, 2004)
Table 6 Soil Gas Results Page 1 of 2

Table 6: Summary of Soil Gas Analytical Results for VOCsPhase III SVE Treatability StudyBuilding 123, Parcel B, Hunters Point ShipyardSan Francisco, California
Sample Depth
Location Sample ID Date (feet bgs)IR10SG048 0503T033 1/17/2005 8.5IR10SG049 0503T034 1/17/2005 8.5IR10SG050 0503T043 1/17/2005 8.5IR10SG051 0503T035 1/17/2005 8.5IR10SG052 0503T036 1/17/2005 8.5IR10SG053 0503T042 1/17/2005 8.5IR10SG054 0503T037 1/17/2005 9.0IR10SG055 0503T040 1/17/2005 9.0IR10SG055 (dup) 0503T041 1/17/2005 9.0IR10SG056 0503T038 1/17/2005 9.0IR10SG057 0503T039 1/17/2005 9.0IR10SG058 0503T028 1/17/2005 5.5IR10SG058 (dup) 0503T029 1/17/2005 5.5IR10SG059 0503T027 1/17/2005 5.5IR10SG060 0503T031 1/17/2005 5.5IR10SG061 0503T030 1/17/2005 5.5IR10SG062 0503T026 1/17/2005 5.5IR10SG063 0503T032 1/17/2005 5.5IR10SG066 0512T062 3/24/2005 8IR10SG067 0512T061 3/24/2005 8IR10SG068 0512T063 3/24/2005 8IR10SG069 0512T064 3/24/2005 8IR10SG070 0512T065 3/24/2005 8IR10SG071 0512T059 3/24/2005 5IR10SG071 (dup) 0512T060 3/24/2005 5Residential Shallow Soil Gas ESL (ug/L)Commercial/Industrial Shallow Soil ESL (ug/L)
Notes:blank space = analyte was not detected above the laboratoug/L = micrograms/literfeet bgs = feet below ground surface(dup) = duplicate sample of previously listed sampleESLs are provided for Project Specific Critical Analytes as
Cyc
lohe
xane
Car
bon
Tetr
achl
orid
e
2,2,
4-Tr
imet
hylp
enta
ne
Ben
zene
Hep
tane
Tric
hlor
oeth
ene
Tolu
ene
1,1,
2-Tr
ichl
oroe
than
e
Tetr
achl
oroe
then
e
Ethy
l Ben
zene
Xyle
nes
Styr
ene
Cum
ene
Prop
ylbe
nzen
e
4-Et
hylto
luen
e
1,3,
5-Tr
imet
hylb
enze
ne
1,2,
4-Tr
imet
hylb
enze
ne
1,2-
Dic
hlor
oben
zene
(ug/L) (ug/L) (ug/L) (ug/L) (ug/L) (ug/L) (ug/L) (ug/L) (ug/L) (ug/L) (ug/L) (ug/L) (ug/L) (ug/L) (ug/L) (ug/L) (ug/L) (ug/L)757085
0.015 0.0054 0.036 0.036 0.041 0.0072 0.028 0.012 0.012 0.0088110
0.014 0.00360.026 0.038 0.013 0.0090 2.1 0.031 0.0073 0.049
5857
0.24 0.12 14 0.13 0.18 0.0832624 0.3523 0.33
0.20 0.0053 0.193 0.0078 0.0056 0.00830.0090 0.0070 0.52 0.010 0.162 0.00410.048 0.022 2.5 0.020 0.1320.018 0.0048 0.0039 0.018 0.017 0.0071 0.070 0.74 0.0074 0.004
0.0035 0.24 0.014 0.0055 0.12 0.90 0.0098 0.0058 0.00770.10 0.0084 0.010 0.017 0.00690.070 0.010 0.019 0.016 0.49 0.028 0.01540.023 0.0097 0.0095 0.011 0.066 0.028 0.0065 0.00920.14 9.5 0.0340.10 0.098 0.090 0.0092 0.045 0.31 0.052 0.0084 0.039 0.011 0.0048 0.0092 0.0072 0.00750.063 0.012 0.074 0.045 0.029 0.078 0.54 0.0079 0.0046 0.016 0.0079 0.0160.061 0.012 0.072 0.046 0.030 0.076 0.53 0.0073 0.014 0.0069 0.014
0.058 1.2 0.410.19 4.1 1.4
Table 6 Soil Gas Results Page 2 of 2
TABLE 7: Summary of System Yield at GAC Vessels based on PID MonitoringPhase III SVE Treatability StudyBuilding 123, Parcel B, Hunters Point ShipyardSan Francisco, California
Run TimeConcentration
measured by PID Flow
Yield (Calculated
as TCE)Elapsed Time
Interval Cumulative YieldLocation Time (hours) (ppmv) (scfm) (lbs/day) (days) (lbs)
GAC1 Influent 6/15/05 9:27 1.2 3.5 289 0.50 0.00 0.00GAC1 Effluent 6/15/05 9:28 1.2 0.0 289GAC1 Influent 6/15/05 11:02 2.7 3.1 289 0.44 0.06 0.03
GAC1 Effluent 6/15/05 11:03 2.7 0.0 289GAC1 Influent 6/15/05 14:05 5.7 1.5 289 0.21 0.13 0.07
GAC1 Effluent 6/15/05 14:06 5.7 0.0 289GAC1 Influent 6/16/05 10:30 26.2 0.7 289 0.10 0.85 0.20
GAC1 Effluent 6/16/05 10:31 26.2 0.0 289GAC1 Influent 6/17/05 9:30 49.2 0.7 289 0.10 0.96 0.30
GAC1 Effluent 6/17/05 9:31 49.2 0.0 289GAC1 Influent 6/20/05 9:15 120.9 0.3 289 0.04 2.99 0.51
GAC1 Effluent 6/20/05 9:16 120.9 0.0 289GAC1 Influent 6/22/05 8:40 168.3 0.0 289 0.00 1.98 0.55
GAC1 Effluent 6/22/05 8:42 168.3 0.0 289GAC1 Influent 6/27/05 10:28 290.1 0.0 289 0.00 5.08 0.55
GAC1 Effluent 6/27/05 10:29 290.1 0.0 289At 6/27/05 13:30 293.3 Turned 7 wells to passive injection
GAC1 Influent 6/27/05 13:57 293.7 0.0 289 0.00 0.15 0.55GAC1 Effluent 6/27/05 13:59 293.7 0.0 289GAC1 Influent 7/1/05 8:23 384.0 0.0 289 0.00 3.76 0.55
GAC1 Effluent 7/1/05 8:25 384.0 0.0 289At 7/1/05 10:23 386.0 Turned system offAt 7/5/05 8:50 386.0 Restart system (all wells)
GAC1 Influent 7/5/05 8:52 386.0 0.0 289 0.00 0.08 0.55GAC1 Effluent 7/5/05 8:55 386.0 0.0 289GAC1 Influent 7/8/05 9:40 458.9 0.0 306 0.00 3.04 0.55
GAC1 Effluent 7/8/05 9:42 458.9 0.0 306At 7/8/05 11:11 460.3 Turned system offAt 7/20/05 8:37 460.3 Restart system (all wells)
GAC1 Influent 7/20/05 8:43 460.4 0.0 238 0.00 0.06 0.55GAC1 Effluent 7/20/05 8:44 460.4 0.0 238
At 7/20/05 10:30 462.2 Turned 11 wells to passive injectionGAC1 Influent 8/4/05 9:08 725.5 0.0 282 0.00 11.05 0.55
GAC1 Effluent 8/4/05 9:09 725.5 0.0 282At 8/4/05 10:27 726.8 Turned system offAt 8/23/05 9:18 726.8 Restart system (11 wells as passive injection)
GAC1 Influent 8/23/05 10:20 727.9 0.0 306 0.00 0.10 0.55GAC1 Effluent 8/23/05 10:23 727.9 0.0 306GAC1 Influent 9/13/05 8:43 1227.6 0.0 306 0.00 20.87 0.55
GAC1 Effluent 9/13/05 8:46 1227.6 0.0 306At 9/13/05 10:44 1229.9 Turned system offAt 1/3/06 12:50 1229.9 Restart system (all wells)
GAC1 Influent 1/3/06 15:00 1231.2 0.0 340 0.00 20.97 0.55GAC1 Effluent 1/3/06 15:00 1231.2 0.0 340GAC1 Influent 1/11/06 9:08 1470.0 0.0 340 0.00 10.00 0.55
GAC1 Effluent 1/11/06 9:09 1470.0 0.0 340At 1/11/06 11:59 1470.1 Turned system off (end of operations)
Notes:
Yield = system yield in lbs/day[PID] = VOC concentration in ppmv as µft3/ft3
MW = molecular weight (131.5 lb TCE/lb-mole)Q = flow in scfm
lb-mole = pound-molePID = photoionizing detectorTCE = trichloroetheneppmv = parts per million by volumescfm = standard cubic feet per minuteft3 = cubic feetlbs/day = pounds per daylbs = pounds
[ ] dayMinutes
ftmolelbQMWft
ftPIDYield 144000259.010 33
36 ∗⎟
⎠⎞
⎜⎝⎛ −∗∗∗∗= −
µ
Table 7 PID GAC Monitoring Page 1 of 1

TABLE 8: Summary of System Yield at GAC Vessels based on Laboratory ResultsPhase III SVE Treatability StudyBuilding 123, Parcel B, Hunters Point ShipyardSan Francisco, California
Sample Hour MeterTCE
Concentration FlowAbatement Efficiency Yield Rate
Operation Time
Interval Yield
Cumulative Yield
Location Time (hours) (ug/L) (scfm) (%) (lbs/day) (days) (lbs) (lbs)GAC1 Influent 6/15/05 15:10 6.8 17.0 289 89.4 0.44 0.28 0.12 0.12GAC1 Effluent 6/15/05 15:05 6.7 1.8 289GAC1 Influent 6/22/05 10:01 169.6 4.4 289 100.0 0.11 7.07 1.96 2.08GAC1 Effluent 6/22/05 10:10 169.8 <0.82 289GAC1 Influent 7/1/05 9:35 385.2 2.8 289 100.0 0.07 16.05 1.50 3.58GAC1 Effluent 7/1/05 9:39 285.3 <0.82 289GAC1 Influent 7/8/05 10:30 459.7 1.2 306 100.0 0.03 19.15 1.01 4.59GAC1 Effluent 7/8/05 10:35 459.8 <0.84 306GAC1 Influent 8/23/05 10:10 727.9 8.6 306 97.0 0.24 30.33 4.08 8.67GAC1 Effluent 8/23/05 10:15 727.9 0.26 306GAC1 Influent 1/3/06 13:15 1470.1 7.4 340 86.9 0.23 61.25 14.13 22.80GAC1 Effluent 1/3/06 13:35 1470.1 0.97 340
Notes:
Where:Yield = system yield in lbs/day[TCE] = TCE concentration in µg/LQ = flow in scfm
µg/L = micrograms per literscfm = standard cubic feet per minute% = percentlbs/day = pounds per daylbs = pounds
[ ] dayMinutes
ftL
glbQg
gTCEYield 14403.280022.010 36 ∗∗∗∗∗= −
µ
Table 8 Lab GAC Monitoring Page 1 of 1

TABLE 9: Percent Reduction of VOC ConcentrationsPhase III SVE Treatability StudyBuilding 123, Parcel B, Hunters Point ShipyardSan Francisco, California
Field PID Measurements
Phase II SVE TS
Phase III SVE TS
Phase III SVE TS
Phase III SVE TS Phase III SVE TS Phase III SVE TS Phase III SVE TS
Overall Reduction
Before StartSystem Startup
System Shutdown Rebound
Percent Reduction of Initial
Concentrations to Final Concentrations
Percentage Rebound
Concentrations are of Initial
Concentrations
Percent Reduction of Initial
Concentrations to Rebound
Concentrations
Pre-Phase II Initial to
Phase III Rebound
11/20/2000 6/15/2005 9/13/2005 12/30/2005 % rebound of Phase III initialSample Location (ppmv) (ppmv) (ppmv) (ppmv) % reduction % reduction % reduction
IR10SG039-5ft 56.0 2.1 0.0 0.0 100.0 0.0 100.0 100.0IR10SG039-10ft 130.0 1.8 0.0 0.0 100.0 0.0 100.0 100.0IR10SG040-5ft 110.0 1.8 0.0 0.1 100.0 5.6 94.4 99.9IR10SG040-10ft 178.0 3.7 0.0 0.0 100.0 0.0 100.0 100.0IR10SG041-5ft 202.0 13.3 0.0 7.6 100.0 57.1 42.9 96.2IR10SG041-10ft 280.0 15.8 0.0 0.0 100.0 0.0 100.0 100.0IR10SG042-5ft 400.0 1.8 0.0 0.1 100.0 5.6 94.4 100.0IR10SG042-10ft 36.0 2.7 0.0 3.0 100.0 111.1 (11.1) 91.7IR10SG043-5ft 1200.0 12.8 0.0 9.3 100.0 72.7 27.3 99.2IR10SG043-10ft 1160 11.3 0.0 9.3 100.0 82.3 17.7 99.2IR10SG044-5ft 1500 5.2 0.0 0.0 100.0 0.0 100.0 100.0IR10SG044-10ft 1755 1.8 0.0 0.0 100.0 0.0 100.0 100.0IR10SG045-5ft 750 4.3 0.0 2.4 100.0 55.8 44.2 99.7IR10SG045-10ft 170 9.8 0.0 17.0 100.0 173.5 (73.5) 90.0IR10SG046-5ft 500 8.3 0.0 2.4 100.0 28.9 71.1 99.5IR10SG046-10ft 120 7.6 0.0 4.7 100.0 61.8 38.2 96.1IR10SG047-5ft 259 12.8 0.0 8.2 100.0 64.1 35.9 96.8IR10SG047-10ft 500 1.1 0.0 0.0 100.0 0.0 100.0 100.0IR10SG072-4ft NI 23.8 0.0 0.0 100.0 0.0 100.0 NIIR10SG072-6ft NI 18.1 0.0 0.0 100.0 0.0 100.0 NIIR10SG073-4ft NI 14.7 0.0 0.0 100.0 0.0 100.0 NIIR10SG073-6ft NI 14.1 0.0 0.0 100.0 0.0 100.0 NIIR10SG074-4ft NI 210.0 18.0 117.9 91.4 56.1 43.9 NIIR10SG074-6ft NI 88.0 0.7 45.7 99.2 51.9 48.1 NIIR10SG075-4ft NI 0.7 0.0 6.4 100.0 914.3 (814.3) NIIR10SG075-6ft NI 0.7 0.0 4.1 100.0 585.7 (485.7) NIIR10SG076-2ft NI 0.0 0.0 NM - - - NIIR10SG076-4ft NI 0.0 0.0 NM - - - NIIR10SG077-4ft NI 0.0 0.0 0.0 - - - NIIR10SG077-6ft NI 0.0 0.0 0.0 - - - NIIR10VW001A 470.0 8.3 0.0 0.0 100.0 0.0 100.0 100.0IR10VW002A 868.0 0.7 0.0 0.7 100.0 100.0 0.0 99.9IR10VW003A 387.0 2.3 0.0 0.0 100.0 0.0 100.0 100.0IR10VW004A 1033.0 2.7 0.0 1.8 100.0 66.7 33.3 99.8IR10VW005A 841.0 3.9 0.0 0.1 100.0 2.6 97.4 100.0IR10VW006A 303.0 1.1 0.0 0.0 100.0 0.0 100.0 100.0IR10VW007A 981.0 1.1 0.0 0.0 100.0 0.0 100.0 100.0IR10VW008A 2000.0 14.3 0.0 1.8 100.0 12.6 87.4 99.9IR10VW009A 2000.0 3.1 0.0 7.0 100.0 225.8 (125.8) 99.7IR10VW010A 850.0 0.7 0.0 1.2 100.0 171.4 (71.4) 99.9IR10VW011A 1502.0 1.1 0.0 0.0 100.0 0.0 100.0 100.0IR10VW012A 2000.0 3.5 0.0 4.7 100.0 134.3 (34.3) 99.8IR10VW013A 1063.0 1.9 0.0 0.1 100.0 5.3 94.7 100.0IR10VW014A 1093.0 2.3 0.0 0.0 100.0 0.0 100.0 100.0IR10VW015A NI 4.3 0.0 1.2 100.0 27.9 72.1 NIIR10VW016A NI 3.9 0.0 0.0 100.0 0.0 100.0 NIIR10VW017A NI 8.3 0.0 7.6 100.0 91.6 8.4 NIIR10VW018A NI 0.7 0.0 0.0 100.0 0.0 100.0 NIIR10VW019A NI 6.3 0.0 0.1 100.0 1.6 98.4 NIIR10VW020A NI 9.9 0.0 0.1 100.0 1.0 99.0 NIIR10VW021A NI 9.9 0.0 8.7 100.0 87.9 12.1 NIIR10VW022A NI 1.9 0.0 0.0 100.0 0.0 100.0 NIIR10VW023A NI 31.0 0.9 4.7 97.1 15.2 84.8 NI
Average 99.7 66.7 33.3 99.0Average without wells that rebound
above Phase III Initial 99.7 22.7 77.3Notes:All concentrations presented are from field PID measurementsPercent Reduction = ((inital concentration-final concentration)/ initial concentration) x 100PID = photoionization detectorSVE = soil vapor extractionTS = treatability studyppmv = parts per million by volumeNI = sample location not installed at the time of the sample eventNM = not measured- = Not calculated because initial concentration was below PID detection levelPhase II SVE TS = Phase II Soil Vapor Extraction Treatability Study (IT, 2002)Phase III SVE TS = Phase III Soil Vapor Extraction Treatability Study Report (ITSI, 2006)
Table 9 Percent VOC Reduction-revRTC Page 1 of 1

TABLE 10: Ratio of TCE Concentrations from Laboratory Results to VOCs from PID MeasurementsPhase III SVE Treatability StudyBuilding 123, Parcel B, Hunters Point ShipyardSan Francisco, California
Initial Initial Initial Final Final FinalConfirmation Study Laboratory Results
for TCE
Confirmation Study PID Measurements
for VOCsCorrelation of
Laboratory Results to PID Measurements
Phase III SVE TS PID Measurements
for VOCs
Phase III SVE TS Laboratory Results
for TCE
Phase III SVE TS Laboratory Results
for TCE Correlation of Laboratory Results
Correlation of Laboratory Results to
PID Measurements
Phase III SVE TS PID Measurements for
VOCs
Phase III SVE TS Laboratory Results
for TCE
Phase III SVE TS Laboratory Results
for TCE Correlation of Laboratory Results
Correlation of Laboratory Results to
PID Measurements9/11-9/16/2002 9/13/2002 1/18/2005 1/19/2005 1/19/2005 12/30/2005 1/3/2006 1/3/2006
Sample Location ug/l (lab) ppmv (PID) ug/l (lab):ppmv (PID) ppmv (PID) ug/l (lab) ppmv (lab) ug/l (lab):ppmv (lab) ug/l (lab):ppmv (PID) ppmv (PID) ug/l (lab) ppmv (lab) ug/l (lab):ppmv (lab) ug/l (lab):ppmv (PID)IR10SG039-5ft 10.1 3.1 3.3 2.2 0.0IR10SG039-10ft 39.4 8.7 4.5 2.2 0.0IR10SG040-5ft 21.5 13.6 1.6 3.7 0.1IR10SG040-10ft 38.7 7.0 5.5 5.2 0.0IR10SG041-5ft 59.0 15.6 3.8 11.3 7.6 64 12 5.3 8.4IR10SG041-10ft 94.3 21.1 4.5 17.3 150 28 5.4 8.7 0.0IR10SG042-5ft 43.4 47.6 0.9 3.7 0.1IR10SG042-10ft 185.1 60.8 3.0 2.2 3.0IR10SG043-5ft 83.2 51.4 1.6 3.7 9.3IR10SG043-10ft 807.1 321.0 2.5 12.8 9.3IR10SG044-5ft 12.8 2.6 4.9 5.2 0.0IR10SG044-10ft 37.0 8.7 4.3 2.2 0.0IR10SG045-5ft 27.8 3.3 8.4 3.7 2.4IR10SG045-10ft 123.7 14.0 8.8 11.3 83 15 5.5 7.3 17.0 110 20 5.5 6.5IR10SG046-5ft 25.3 4.4 5.8 8.3 2.4IR10SG046-10ft 18.3 3.1 5.9 6.7 4.7IR10SG047-5ft 167.8 50.4 3.3 14.3 63 12 5.3 4.4 8.2IR10SG047-10ft 34.3 13.3 2.6 0.7 0.0IR10SG072-4ft NI NI NI NI NI NI NI NI 0.0IR10SG072-6ft NI NI NI NI NI NI NI NI 0.0IR10SG073-4ft NI NI NI NI NI NI NI NI 0.0IR10SG073-6ft NI NI NI NI NI NI NI NI 0.0IR10SG074-4ft NI NI NI NI NI NI NI NI 117.9 520 97 5.4 4.4IR10SG074-6ft NI NI NI NI NI NI NI NI 45.7IR10SG075-4ft NI NI NI NI NI NI NI NI 6.4IR10SG075-6ft NI NI NI NI NI NI NI NI 4.1IR10SG076-2ft NI NI NI NI NI NI NI NI NMIR10SG076-4ft NI NI NI NI NI NI NI NI NMIR10SG077-4ft NI NI NI NI NI NI NI NI 0.0IR10SG077-6ft NI NI NI NI NI NI NI NI 0.0IR10VW001A 70.4 16.3 4.3 6.7 0.0IR10VW002A 31.2 6.4 4.9 3.7 0.7IR10VW003A 9.8 0.4 24.5 3.7 0.0IR10VW004A 64.4 19.4 3.3 2.2 1.8IR10VW005A 111.6 30.8 3.6 6.7 0.1IR10VW006A 22.7 5.7 4.0 2.2 0.0IR10VW007A 15.7 0.4 39.3 2.2 0.0IR10VW008A 126.5 50.6 2.5 12.9 110 20 5.5 8.5 1.8IR10VW009A 168.2 63.0 2.7 11.2 7.0IR10VW010A 75.6 232.0 0.3 3.2 1.2IR10VW011A 8.0 1.9 4.2 4.8 0.0IR10VW012A 361.4 148.1 2.4 4.8 37 6.9 5.4 7.7 4.7 10 2 5.0 2.1IR10VW013A 58.5 24.0 2.4 1.6 0.1IR10VW014A 8.1 1.4 5.8 3.2 0.0IR10VW015A NI NI NI NI NI NI NI NI 1.2IR10VW016A NI NI NI NI NI NI NI NI 0.0IR10VW017A NI NI NI NI NI NI NI NI 7.6IR10VW018A NI NI NI NI NI NI NI NI 0.0IR10VW019A NI NI NI NI NI NI NI NI 0.1IR10VW020A NI NI NI NI NI NI NI NI 0.1IR10VW021A NI NI NI NI NI NI NI NI 8.7 36 6.8 5.3 4.1IR10VW022A NI NI NI NI NI NI NI NI 0.0IR10VW023A NI NI NI NI NI NI NI NI 4.7
Average Ratio: 5.6 Average Ratio: 5.4 7.3 Average Ratio: 5.3 5.1Lab to PID Lab to Lab Lab to PID Lab to Lab Lab to PID
Overall Average Ratio of Lab to PID = 6.0
Notes:Ratio = TCE concentration in ug/L / TCE concentration in ppmv
SVE = soil vapor extractionTS = treatability studyPID = photo-ionizing detectorug/L (lab) = micrograms per liter based on laboratory analysisppmv (lab) = parts per million by volume based on laboratory resultsppmv (PID) = parts per million by volume based on PID measurementNI = sample location not installed at the time of the sample eventNM = not measuredConfirmation Study = Soil Vapor Extraction Confirmation Study, Building 123, Installation Restoration Site 10, Parcel B, Hunters Point Shipyard, San Francisco by TetraTech EM, Inc., April 10, 2003.
Table 10 Correlation of Lab to PID Page 1 of 1

TABLE 11: Estimation of TCE Concentrations from PID MeasurementsPhase III SVE Treatability StudyBuilding 123, Parcel B, Hunters Point ShipyardSan Francisco, California
FinalPhase III SVE TS
PID MeasurementsEstimated TCE Concentrations
12/30/2005Sample Location ppmv (PID) (ug/L)IR10SG039-5ft 0.0 0
IR10SG039-10ft 0.0 0IR10SG040-5ft 0.1 0.6
IR10SG040-10ft 0.0 0IR10SG041-5ft 7.6 45.6
IR10SG041-10ft 0.0 0IR10SG042-5ft 0.1 0.6
IR10SG042-10ft 3.0 18IR10SG043-5ft 9.3 55.8
IR10SG043-10ft 9.3 55.8IR10SG044-5ft 0.0 0
IR10SG044-10ft 0.0 0IR10SG045-5ft 2.4 14.4
IR10SG045-10ft 17.0 102IR10SG046-5ft 2.4 14.4
IR10SG046-10ft 4.7 28.2IR10SG047-5ft 8.2 49.2
IR10SG047-10ft 0.0 0IR10SG072-4ft 0.0 0IR10SG072-6ft 0.0 0IR10SG073-4ft 0.0 0IR10SG073-6ft 0.0 0IR10SG074-4ft 117.9 707.4IR10SG074-6ft 45.7 274.2IR10SG075-4ft 6.4 38.4IR10SG075-6ft 4.1 24.6IR10SG076-2ft NM NMIR10SG076-4ft NM NMIR10SG077-4ft 0.0 0IR10SG077-6ft 0.0 0IR10VW001A 0.0 0IR10VW002A 0.7 4.2IR10VW003A 0.0 0IR10VW004A 1.8 10.8IR10VW005A 0.1 0.6IR10VW006A 0.0 0IR10VW007A 0.0 0IR10VW008A 1.8 10.8IR10VW009A 7.0 42IR10VW010A 1.2 7.2IR10VW011A 0.0 0IR10VW012A 4.7 28.2IR10VW013A 0.1 0.6IR10VW014A 0.0 0IR10VW015A 1.2 7.2IR10VW016A 0.0 0IR10VW017A 7.6 45.6IR10VW018A 0.0 0IR10VW019A 0.1 0.6IR10VW020A 0.1 0.6IR10VW021A 8.7 52.2IR10VW022A 0.0 0IR10VW023A 4.7 28.2
Notes:Estimated Laboratory Concentration (in ug/L) = PID Measurement (in ppmv) x Average Ratio of Lab to PID (6.0 from Table 9)
Bold indicates estimated concentration exceeds San Francisco Region Water Quality Control Board Residential Shallow Soil Gas Environmental Screening LevelsSVE = soil vapor extractionTS = treatability studyPID = photo-ionizing detectorµg/L = micrograms per literppmv (PID) = parts per million by volume based on PID measurementNM = not measuredConfirmation Study = Soil Vapor Extraction Confirmation Study, Building 123, Installation Restoration Site 10, Parcel B, Hunters Point Shipyard, San Francisco by TetraTech EM, Inc., April 10, 2003.
Table 11 Estimated TCE Concentrations Page 1 of 1

FIGURES


Figure 9 Coefficients
Figure 9: Coefficient of Determination (R2) for Laboratory Data to PID Measurements
R2 = 0.7045
0.0
100.0
200.0
300.0
400.0
500.0
600.0
700.0
800.0
900.0
0.0 50.0 100.0 150.0 200.0 250.0 300.0 350.0
PID Concentration in ppmv
Labo
rato
ry T
CE
Con
cent
ratio
n in
ug/
L
Best Fit Regression Line


APPENDICES

APPENDIX A PHOTOGRAPHIC LOG
Photographic Documentation
Client: U.S. Department of the Navy Prepared by: ITSI Location: Building 123, Parcel B, Hunters Point Shipyard, San Francisco, California Photograph Dates: Jan-June 2005 Photographer: ITSI Project Number: 02-307.01
Page 1 of 4
Photograph No. 001 Date: 01/13/2005 Time: 0830 Direction: Northwest
Description: Direct push rig set up for the installation of temporary soil gas sample probe.
Photograph No. 002 Date: 01/13/2005 Time: 1030 Direction: Southeast
Description: Direct push installation of temporary soil gas sample probe IR10SG054.

Photographic Documentation
Client: U.S. Department of the Navy Prepared by: ITSI Location: Building 123, Parcel B, Hunters Point Shipyard, San Francisco, California Photograph Dates: Jan-June 2005 Photographer: ITSI Project Number: 02-307.01
Page 2 of 4
Photograph No. 003 Date: 01/14/2005 Time: 0850 Direction: Southwest
Description: Installation of temporary soil gas sample probe IR10SG062.
Photograph No. 004 Date: 06/06/2005 Time: 0805 Direction: West
Description: Formerly installed SVE well connection and vapor monitoring wells.

Photographic Documentation
Client: U.S. Department of the Navy Prepared by: ITSI Location: Building 123, Parcel B, Hunters Point Shipyard, San Francisco, California Photograph Dates: Jan-June 2005 Photographer: ITSI Project Number: 02-307.01
Page 3 of 4
Photograph No. 005 Date: 06/06/2005 Time: 0830 Direction: North
Description: Typical SVE well connection.
Photograph No. 006 Date: 06/06/2005 Time: 0850 Direction: West
Description: SVE blower trailer with liquid/vapor separator.

Photographic Documentation
Client: U.S. Department of the Navy Prepared by: ITSI Location: Building 123, Parcel B, Hunters Point Shipyard, San Francisco, California Photograph Dates: Jan-June 2005 Photographer: ITSI Project Number: 02-307.01
Page 4 of 4
Photograph No. 007 Date: 06/06/2005 Time: 1230 Direction: East
Description: Activated Carbon vapor abatement units prior to installation.
Photograph No. 008 Date: 06/06/2005 Time: 1300 Direction: West
Description: The SVE positive displacement vacuum blower and motor in the noise reduction enclosure.

APPENDIX B BORING LOGS

SOIL CLASSIFICATION LEGENDUNIFIED SOIL CLASSIFICATION SYSTEM
MAJOR DIVISIONS SYMBOLS TYPICAL NAMES
GW Well-graded gravels, gravel-sand mixtures, little or no fines
GP Poorly-graded gravels, gravel-sand mixtures, little or no fines
GM Sitly gravels, gravel-sand mixtures
GC Clayey gravels, gravel-sand-clay mixtures
SW Well-graded sands or gravel-sands, little or no fines
SP Poorly graded sands or gravelly sands, little or no fines
SM Silty sands, sand-silt mixtures
SC Clayey sands, sand-clay mixtures
ML Inorganic silts and very fine sands, rock flour, silty or clayey fine sands or clayey silts with slight plasticity
CL Inorganic clays of low to medium plasticity, gravelly clays, sandy clays, silty clays, lean clays
OL Organic silts and organic silty clays of low plasticity
MH Inorganic silts, micaceous or diatomaceous fine sandy or silty soils, elastic silts
CH Inorganic clays of high plasticity, fat clays
OH Organic clays of medium to high plasticity, organic silty clays, organic silts
PT Peat and other highly organic soils
WBR Weathered Bedrock
BR
Depth to Static Water Level in Boring or Well
Depth to Water Level Encountered During DrillingDEPTH TO GROUNDWATER MARKERS
GRAVELS MORE THEN 1/2
COARSE FRACTION > NO. 4
SIEVE SIZE
CLEAN GRAVELS WITH LESS THAN 15% FINES
GRAVELS WITH GREATER THAN 15% FINES
Rock
Rock Bedrock
OTHER SYMBOLS
SAND MORE THEN 1/2
COARSE FRACTION < NO. 4
SIEVE SIZE
CLEAN SANDS WITH LESS THAN 15% FINES
SANDS WITH GREATER THAN 15% FINES
SILTS AND CLAYS LIQUID LIMIT 50% OR LESS
SILTS AND CLAYS LIQUID LIMIT GREATER THAN 50%
Crushed Rock
Cement/Bentonite Grout
Bentonite
Filter Pack (Sand)

Boring: IR10SG048 Sheet 1 of 1Well Name: IR10SG048 Project # : 02-307.01
Location:Client:Logged By: E. Ehlers Drilling Co.: Precision SamplingDate Started: 1/13/2005 Drill Rig: Track Geoprobe G610Date Completed: 1/13/2005 Driller Name: Ernesto
(See Site Map) Date Backfilled: 3/15/2006 Drilling Method: Direct PushBoring Diam.: 2" Sampler: 4 ft. Butyrate LinersGround Elev.: 14.13 Casing Mtrl/Size: 1/4 inch teflon tubingTOC Elev.: N/A Screen Mtrl/Size: 1 inch filter screenNorthing: 453351.3 Slot Size: N/A
Sketch of Boring Location: Easting: 1460841 Sand Size: 2/12 sand
00.00.0 10.00.0 20.00.0 30.00.0 40.00.0 50.00.0 60.00.0 70.0
0502T009 0.0 80.00.0 90.00.0 100.00.0 110.0
12
13
14
15
16
17
18
19
20
End of boring at 12 ft. bgs
Concrete floor (12 inch slab)
Project Name:
Parcel B Hunters Point ShipyardU.S. Navy SW Div. Naval Facilities Engineering Command
Hunters Point Phase III Soil Vapor Extraction Treatability Study
Soil Description
PID
(ppm
)
DP
DP
Same as above. Wet at approximately 11 ft. bgs.
FILL: Gravelly CLAY. Gray (Gley2 6/10G). Moist. Low plasticity. Soft to stiff.
Wel
l Cas
ing/
Bor
ehol
e B
ackf
ill
Blo
ws
/ 6"
or P
ress
ure
(psi
)
Sam
ple
Num
ber
Sam
ple
Inte
rval
Rec
over
ed In
terv
alD
rive
Inte
rval
Surface Completion: Temporary soil gas sampling probe. Grout to surface with approximately 2 feet of 1/4 inch teflon tubing extending from hole.
Dep
th (f
eet)
Soil
Gra
phic
Soil
Sym
bol (
USG
S)
DP
FILL: Sandy GRAVEL with clay. Dark brown (10YR 3/3). Moist. Angular gravel. Medium Density.
GC
CL
FILL: Sandy CLAY. Greenish gray (Gley2 5/10BG). Moist. Very low plasticity. Firm. Possible weathered bedrock (serpentinite).
CL

Boring: IR10SG049 Sheet 1 of 1Well Name: IR10SG049 Project # : 02-307.01
Location:Client:Logged By: E. Ehlers Drilling Co.: Precision SamplingDate Started: 1/13/2005 Drill Rig: Track Geoprobe G610Date Completed: 1/13/2005 Driller Name: Ernesto
(See Site Map) Date Backfilled: 3/15/2006 Drilling Method: Direct PushBoring Diam.: 2" Sampler: 4 ft. Butyrate LinersGround Elev.: 14.2 Casing Mtrl/Size: 1/4 inch teflon tubingTOC Elev.: N/A Screen Mtrl/Size: 1 inch filter screenNorthing: 453348.0 Slot Size: N/A
Sketch of Boring Location: Easting: 1460879 Sand Size: 2/12 sand
00.00.0 10.00.0 20.00.0 30.00.0 40.00.0 50.00.0 60.00.0 70.0
0502T010 0.0 80.00.0 90.00.0 100.00.0 110.0
12
13
14
15
16
17
18
19
20
DP
FILL: Sandy GRAVEL. Dark brown (10YR 3/3). Trace clay. Well graded. Moist. Angular gravel. Medium Density.GW
SP
GC
FILL: SAND. Dark brown (10YR 3/3). Medium grained. Poorly graded. Dry. Low to medium Density.
FILL: Clayey GRAVEL. Dark brown (10YR 3/3). Well graded. Moist. Angular gravel (over 2 inches in diameter). Dense.
CL
Sam
ple
Inte
rval
Rec
over
ed In
terv
alD
rive
Inte
rval
Surface Completion: Temporary soil gas sampling probe. Grout to surface with approximately 2 feet of 1/4 inch teflon tubing extending from hole.
Dep
th (f
eet)
Soil
Gra
phic
Soil
Sym
bol (
USG
S)
PID
(ppm
)
Wel
l Cas
ing/
Bor
ehol
e B
ackf
ill
Same as above. Wet at approximately 10 ft. bgs.
FILL: Gravelly CLAY, gray (gley2 6/10G)
Blo
ws
/ 6"
or P
ress
ure
(psi
)
Sam
ple
Num
ber
Soil Description
DP
DP
Project Name:
Parcel B Hunters Point ShipyardU.S. Navy SW Div. Naval Facilities Engineering Command
Hunters Point Phase III Soil Vapor Extraction Treatability Study
End of boring at 12 ft. bgs
Concrete floor (12 inch slab)

Boring: IR10SG050 Sheet 1 of 1Well Name: IR10SG050 Project # : 02-307.01
Location:Client:Logged By: E. Ehlers Drilling Co.: Precision SamplingDate Started: 1/13/2005 Drill Rig: Track Geoprobe G610Date Completed: 1/13/2005 Driller Name: Ernesto
(See Site Map) Date Backfilled: 3/15/2006 Drilling Method: Direct PushBoring Diam.: 3" Sampler: 4 ft. Butyrate LinersGround Elev.: 14.48 Casing Mtrl/Size: 1/4 inch teflon tubingTOC Elev.: N/A Screen Mtrl/Size: 1 inch filter screenNorthing: 453363.1 Slot Size: N/A
Sketch of Boring Location: Easting: 1460890 Sand Size: 2/12 sand
00.00.0 10.00.0 20.00.0 30.00.0 40.00.0 50.00.0 60.00.0 70.0
0502T011 0.0 80.00.0 90.00.0 100.00.0 110.0
12
13
14
15
16
17
18
19
20
End of boring at 12 ft. bgs
Concrete floor (12 inch slab)
Project Name:
Parcel B Hunters Point ShipyardU.S. Navy SW Div. Naval Facilities Engineering Command
Hunters Point Phase III Soil Vapor Extraction Treatability Study
Soil Description
PID
(ppm
)
DP
DP
FILL: GRAVEL. Gray (Gley2 6/10G). Dry. Poor to moderately graded. Loose.
Same as above. Wet at approximately 10.5 ft. bgs.
Wel
l Cas
ing/
Bor
ehol
e B
ackf
ill
FILL: Sandy CLAY. Gray (Gley2 6/10G). Moist. Moderately graded. Low plasticity. Medium dense
Blo
ws
/ 6"
or P
ress
ure
(psi
)
Sam
ple
Num
ber
Sam
ple
Inte
rval
Rec
over
ed In
terv
alD
rive
Inte
rval
Surface Completion: Temporary soil gas sampling probe. Grout to surface with approximately 2 feet of 1/4 inch teflon tubing extending from hole.
Dep
th (f
eet)
Soil
Gra
phic
Soil
Sym
bol (
USG
S)
GC
CL
DP
FILL: Clayey GRAVEL. Dark brown (10YR 3/3). Moist. Well graded. Angular gravel. Medium Density.
CL
GP
FILL: Sandy CLAY. Greenish gray (Gley2 4/5BG). Moist. Moderate to well graded. Trace gravel. Medium dense. Firm. Very low plasticity.

Boring: IR10SG051 Sheet 1 of 1Well Name: IR10SG051 Project # : 02-307.01
Location:Client:Logged By: E. Ehlers Drilling Co.: Precision SamplingDate Started: 1/13/2005 Drill Rig: Track Geoprobe G610Date Completed: 1/13/2005 Driller Name: Ernesto
(See Site Map) Date Backfilled: 3/15/2006 Drilling Method: Direct PushBoring Diam.: 3" Sampler: 4 ft. Butyrate LinersGround Elev.: 14.17 Casing Mtrl/Size: 1/4 inch teflon tubingTOC Elev.: N/A Screen Mtrl/Size: 1 inch filter screenNorthing: 453358.9 Slot Size: N/A
Sketch of Boring Location: Easting: 1460808 Sand Size: 2/12 sand
00.00.0 10.00.0 20.00.0 30.00.0 40.00.0 50.00.0 60.00.0 70.00.0 80.0
0502T008 0.0 90.00.0 100.00.0 110.0
12
13
14
15
16
17
18
19
20
FILL: Sandy GRAVEL some clay (5 to 10%). Dark brown (10YR 3/3). Moist. Moderate to well graded. Angular gravel up to 2 inches diameter. Medium Density.GC
GC
FILL: Sandy GRAVEL same as above except gray (gley2 6/10G).
DP
Dep
th (f
eet)
Soil
Gra
phic
Soil
Sym
bol (
USG
S)
Sam
ple
Num
ber
Sam
ple
Inte
rval
Rec
over
ed In
terv
alD
rive
Inte
rval
PID
(ppm
)
DP
DP
Same as above. Wet at approximately 10 ft. bgs.
Wel
l Cas
ing/
Bor
ehol
e B
ackf
ill
Blo
ws
/ 6"
or P
ress
ure
(psi
)
Project Name:
Parcel B Hunters Point ShipyardU.S. Navy SW Div. Naval Facilities Engineering Command
Hunters Point Phase III Soil Vapor Extraction Treatability Study
Soil Description
Surface Completion: Temporary soil gas sampling probe. Grout to surface with approximately 2 feet of 1/4 inch teflon tubing extending from hole.
End of boring at 12 ft. bgs
Concrete floor (12 inch slab)

Boring: IR10SG052 Sheet 1 of 1Well Name: IR10SG052 Project # : 02-307.01
Location:Client:Logged By: E. Ehlers Drilling Co.: Precision SamplingDate Started: 1/13/2005 Drill Rig: Track Geoprobe G610Date Completed: 1/13/2005 Driller Name: Ernesto
(See Site Map) Date Backfilled: 3/15/2006 Drilling Method: Direct PushBoring Diam.: 3" Sampler: 4 ft. Butyrate LinersGround Elev.: 14.08 Casing Mtrl/Size: 1/4 inch teflon tubingTOC Elev.: N/A Screen Mtrl/Size: 1 inch filter screenNorthing: 453376.7 Slot Size: N/A
Sketch of Boring Location: Easting: 1460827 Sand Size: 2/12 sand
00.00.0 10.00.0 20.00.0 30.00.0 40.00.0 50.00.0 60.00.0 70.00.0 80.0
0502T007 0.0 90.00.0 100.00.0 110.0
12
13
14
15
16
17
18
19
20
End of boring at 12 ft. bgs
Concrete floor (12 inch slab)
Project Name:
Parcel B Hunters Point ShipyardU.S. Navy SW Div. Naval Facilities Engineering Command
Hunters Point Phase III Soil Vapor Extraction Treatability Study
Soil Description
Surface Completion: Temporary soil gas sampling probe. Grout to surface with approximately 2 feet of 1/4 inch teflon tubing extending from hole.
PID
(ppm
)
DP
DP
Same as above. Wet at approximately 10 ft. bgs.
Wel
l Cas
ing/
Bor
ehol
e B
ackf
ill
Blo
ws
/ 6"
or P
ress
ure
(psi
)
Sam
ple
Num
ber
Sam
ple
Inte
rval
Rec
over
ed In
terv
alD
rive
Inte
rval
Dep
th (f
eet)
Soil
Gra
phic
Soil
Sym
bol (
USG
S)
DP
FILL: Sandy GRAVEL some clay (5 to 10%). Dark brown (10YR 3/3). Moist. Moderate to well graded. Angular gravel up to 2 inches diameter. Medium Density.GC
GC
FILL: Sandy GRAVEL same as above except gray (gley2 6/10G). Moist. Moderate to well graded.

Boring: IR10SG053 Sheet 1 of 1Well Name: IR10SG053 Project # : 02-307.01
Location:Client:Logged By: E. Ehlers Drilling Co.: Precision SamplingDate Started: 1/13/2005 Drill Rig: Track Geoprobe G610Date Completed: 1/13/2005 Driller Name: Ernesto
(See Site Map) Date Backfilled: 3/15/2006 Drilling Method: Direct PushBoring Diam.: 3" Sampler: 4 ft. Butyrate LinersGround Elev.: 14.37 Casing Mtrl/Size: 1/4 inch teflon tubingTOC Elev.: N/A Screen Mtrl/Size: 1 inch filter screenNorthing: 453386.5 Slot Size: N/A
Sketch of Boring Location: Easting: 1460858 Sand Size: 2/12 sand
00.00.0 10.00.0 20.00.0 30.00.0 40.00.0 50.00.0 60.00.0 70.0
0502T012 0.0 80.00.0 90.00.0 100.00.0 110.0
12
13
14
15
16
17
18
19
20
FILL: Clayey SAND with trace gravel (5%). Dark brown (10YR 3/3). Moist. Moderately graded. Medium Density.
FILL: Gravely CLAY with sand. Greenish gray (Gley2 5/10BG). Moist. Well graded. Moderate to low plasticity. Medium dense.
CL
SC
GC
DP
Surface Completion: Temporary soil gas sampling probe. Grout to surface with approximately 2 feet of 1/4 inch teflon tubing extending from hole.
Dep
th (f
eet)
Soil
Gra
phic
Soil
Sym
bol (
USG
S)
Sam
ple
Num
ber
Sam
ple
Inte
rval
Rec
over
ed In
terv
alD
rive
Inte
rval
PID
(ppm
)
DP
DP
Wel
l Cas
ing/
Bor
ehol
e B
ackf
ill
Blo
ws
/ 6"
or P
ress
ure
(psi
)
Project Name:
Parcel B Hunters Point ShipyardU.S. Navy SW Div. Naval Facilities Engineering Command
Hunters Point Phase III Soil Vapor Extraction Treatability Study
Soil Description
End of boring at 12 ft. bgs
Concrete floor (12 inch slab)
FILL: Clayey GRAVEL. Gray (Gley2 5/10BG). Moist. Well graded. Medium dense.

Boring: IR10SG054 Sheet 1 of 1Well Name: IR10SG054 Project # : 02-307.01
Location:Client:Logged By: E. Ehlers Drilling Co.: Precision SamplingDate Started: 1/13/2005 Drill Rig: Track Geoprobe G610Date Completed: 1/13/2005 Driller Name: Ernesto
(See Site Map) Date Backfilled: 3/15/2006 Drilling Method: Direct PushBoring Diam.: 3" Sampler: 4 ft. Butyrate LinersGround Elev.: 14.16 Casing Mtrl/Size: 1/4 inch teflon tubingTOC Elev.: N/A Screen Mtrl/Size: 1 inch filter screenNorthing: 453397.5 Slot Size: N/A
Sketch of Boring Location: Easting: 1460787 Sand Size: 2/12 sand
00.00.0 10.00.0 20.00.0 30.00.0 40.00.0 50.00.0 60.00.0 70.0
0502T005 0.0 80.00.0 90.00.0 100.00.0 110.0
12
13
14
15
16
17
18
19
20
End of boring at 12 ft. bgs
Concrete floor (12 inch slab)
Project Name:
Parcel B Hunters Point ShipyardU.S. Navy SW Div. Naval Facilities Engineering Command
Hunters Point Phase III Soil Vapor Extraction Treatability Study
Soil Description
SC
GC
Blo
ws
/ 6"
or P
ress
ure
(psi
)
Sam
ple
Num
ber
Driv
e In
terv
al
Surface Completion: Temporary soil gas sampling probe. Grout to surface with approximately 2 feet of 1/4 inch teflon tubing extending from hole.
Dep
th (f
eet)
Soil
Gra
phic
Soil
Sym
bol (
USG
S)
PID
(ppm
)
Wel
l Cas
ing/
Bor
ehol
e B
ackf
ill
Sam
ple
Inte
rval
Rec
over
ed In
terv
al
FILL: Clayey SAND some gravel (10%). Dark brown (10YR 3/3). Moist. Moderately graded. Medium Density.
FILL: Sandy GRAVEL with some clay (5%). Gray (Gley2 6/10G). Moist. Well graded up to 2" diameter. Medium-high density.
Brick fragment at 7.5'
DP
DP
DP

Boring: IR10SG055 Sheet 1 of 1Well Name: IR10SG055 Project # : 02-307.01
Location:Client:Logged By: E. Ehlers Drilling Co.: Precision SamplingDate Started: 1/13/2005 Drill Rig: Track Geoprobe G610Date Completed: 1/13/2005 Driller Name: Ernesto
(See Site Map) Date Backfilled: 3/15/2006 Drilling Method: Direct PushBoring Diam.: 3" Sampler: 4 ft. Butyrate LinersGround Elev.: 14.05 Casing Mtrl/Size: 1/4 inch teflon tubingTOC Elev.: N/A Screen Mtrl/Size: 1 inch filter screenNorthing: 453420.3 Slot Size: N/A
Sketch of Boring Location: Easting: 1460831 Sand Size: 2/12 sand
00.00.0 10.00.0 20.00.0 30.00.0 40.00.0 50.00.0 60.00.0 70.00.0 8
0502T003 0.00.0 90.00.0 100.00.0 110.00.0 120.00.0 130.00.0 140.00.0 150.0
16
17
18
19
20
SP
FILL: Clayey SAND (clay=10-15%), trace gravel (<5%). Dark brown (10YR 3/3). Moist. Moderately graded. Medium density.
FILL: Clayey SAND to Sandy CLAY with gravel. Gray (Gley2 6/5B). Moist to wet. Well graded. Moderate to low plasticity. Medium dense.
End of boring at 16 ft. bgs
SC
DP
SC/CL
Project Name:
Parcel B Hunters Point ShipyardU.S. Navy SW Div. Naval Facilities Engineering Command
Hunters Point Phase III Soil Vapor Extraction Treatability Study
PID
(ppm
)
Wel
l Cas
ing/
Bor
ehol
e B
ackf
ill Surface Completion: Temporary soil gas sampling probe. Grout to surface with approximately 2 feet of 1/4 inch teflon tubing extending from hole.
Dep
th (f
eet)
Soil
Gra
phic
Soil
Sym
bol (
USG
S)
Soil Description
FILL: SAND with some clay (0-5%), trace gravel (<5%). Dark brown (10YR 3/3). Moist. Moderately graded. Low-moderate density.
Concrete floor (12 inch slab)
Blo
ws
/ 6"
or P
ress
ure
(psi
)
Sam
ple
Num
ber
Sam
ple
Inte
rval
Rec
over
ed In
terv
alD
rive
Inte
rval
DP
DP
DP

Boring: IR10SG056 Sheet 1 of 1Well Name: IR10SG056 Project # : 02-307.01
Location:Client:Logged By: E. Ehlers Drilling Co.: Precision SamplingDate Started: 1/13/2005 Drill Rig: Track Geoprobe G610Date Completed: 1/13/2005 Driller Name: Ernesto
(See Site Map) Date Backfilled: 3/15/2006 Drilling Method: Direct PushBoring Diam.: 3" Sampler: 4 ft. Butyrate LinersGround Elev.: 14.13 Casing Mtrl/Size: 1/4 inch teflon tubingTOC Elev.: N/A Screen Mtrl/Size: 1 inch filter screenNorthing: 453414.0 Slot Size: N/A
Sketch of Boring Location: Easting: 1460785 Sand Size: 2/12 sand
00.00.0 10.00.0 20.00.0 30.00.0 40.00.0 50.00.0 60.00.0 70.00.0 80.0
0502T004 0.0 90.00.0 100.00.0 110.0
12
13
14
15
16
17
18
19
20
End of boring at 12 ft. bgs
Concrete floor (12 inch slab)
Increasing gravel content
Project Name:
Parcel B Hunters Point ShipyardU.S. Navy SW Div. Naval Facilities Engineering Command
Hunters Point Phase III Soil Vapor Extraction Treatability Study
Soil Description
PID
(ppm
)
DP
DP
FILL: Sandy GRAVEL up to 2 inches in diameter some clay (5%). Gray (Gley2 6/5B). Moist. Well graded Medium dense
Wel
l Cas
ing/
Bor
ehol
e B
ackf
ill
Blo
ws
/ 6"
or P
ress
ure
(psi
)
Sam
ple
Num
ber
Sam
ple
Inte
rval
Rec
over
ed In
terv
alD
rive
Inte
rval
Surface Completion: Temporary soil gas sampling probe. Grout to surface with approximately 2 feet of 1/4 inch teflon tubing extending from hole.
Dep
th (f
eet)
Soil
Gra
phic
Soil
Sym
bol (
USG
S)
DP
FILL: Clayey SAND with gravel (10%). Dark brown (10YR 3/3). Moist. Moderately graded with gravel up to 2 inches in diameter. Medium Density.
FILL: Clayey SAND with gravel (10%). Gray (Gley2 6/5B). Moist to wet. Moderately graded. Medium Density.
SC
GW
SC

Boring: IR10SG057 Sheet 1 of 1Well Name: IR10SG057 Project # : 02-307.01
Location:Client:Logged By: E. Ehlers Drilling Co.: Precision SamplingDate Started: 1/13/2005 Drill Rig: Track Geoprobe G610Date Completed: 1/13/2005 Driller Name: Ernesto
(See Site Map) Date Backfilled: 3/15/2006 Drilling Method: Direct PushBoring Diam.: 3" Sampler: 4 ft. Butyrate LinersGround Elev.: 14.06 Casing Mtrl/Size: 1/4 inch teflon tubingTOC Elev.: N/A Screen Mtrl/Size: 1 inch filter screenNorthing: 453445.3 Slot Size: N/A
Sketch of Boring Location: Easting: 1460804 Sand Size: 2/12 sand
00.00.0 10.00.0 20.00.0 30.00.0 40.00.0 50.00.0 60.00.0 70.00.0 80.0
0502T002 0.0 90.0
10
11
12
13
14
15
16
17
18
19
20
SC
DP
DP
DP
Blo
ws
/ 6"
or P
ress
ure
(psi
)
Sam
ple
Num
ber
Sam
ple
Inte
rval
Rec
over
ed In
terv
alD
rive
Inte
rval
End of boring at 10 ft. bgs
Soil Description
PID
(ppm
)
Wel
l Cas
ing/
Bor
ehol
e B
ackf
ill Surface Completion: Temporary soil gas sampling probe. Grout to surface with approximately 2 feet of 1/4 inch teflon tubing extending from hole.
Dep
th (f
eet)
Soil
Gra
phic
Soil
Sym
bol (
USG
S)
SC
Project Name:
Parcel B Hunters Point ShipyardU.S. Navy SW Div. Naval Facilities Engineering Command
Hunters Point Phase III Soil Vapor Extraction Treatability Study
Concrete floor (12 inch slab)
FILL: Clayey SAND with gravel (10-15%). Dark brown (10YR 3/3). Moist. Moderately graded with gravel up to 2 inches in diameter. Medium Density.
FILL: Clayey SAND with gravel (10%). Gray (Gley2 6/5B). Moist. Moderately graded. Medium Density.

Boring: IR10SG058 Sheet 1 of 1Well Name: IR10SG058 Project # : 02-307.01
Location:Client:Logged By: E. Ehlers Drilling Co.: Precision SamplingDate Started: 1/14/2005 Drill Rig: Track Geoprobe G610Date Completed: 1/14/2005 Driller Name: Ernesto
(See Site Map) Date Backfilled: 3/15/2006 Drilling Method: Direct PushBoring Diam.: 3" Sampler: 4 ft. Butyrate LinersGround Elev.: 10.46 Casing Mtrl/Size: 1/4 inch teflon tubingTOC Elev.: N/A Screen Mtrl/Size: 1 inch filter screenNorthing: 453405.2 Slot Size: N/A
Sketch of Boring Location: Easting: 1460905 Sand Size: 2/12 sand
00.00.0 10.00.0 20.00.0 30.00.0 40.0
0502T016 0.0 50.00.0 60.00.0 70.00.0 80.00.0 90.00.0 100.00.0 110.0
12
13
14
15
16
17
18
19
20
DP
Dep
th (f
eet)
Soil
Gra
phic
Sam
ple
Num
ber
Sam
ple
Inte
rval
Rec
over
ed In
terv
alD
rive
Inte
rval
PID
(ppm
)
DP
Soil
Sym
bol (
USG
S)
SC
SC
FILL: Clayey SAND with gravel (5-10%). Fine-medium sand (35-50%). Clay (25-40%). Dark brown (10YR 3/3). Moist. Well graded. Medium Density.
FILL: Clayey SAND with gravel. Gray (Gley2 5/5BG). Moist to wet. Angular gravel (serpentinite). Moderately graded. Medium Density.
Wel
l Cas
ing/
Bor
ehol
e B
ackf
ill
Blo
ws
/ 6"
or P
ress
ure
(psi
)
Soil Description
Surface Completion: Temporary soil gas sampling probe. Grout to surface with approximately 2 feet of 1/4 inch teflon tubing extending from hole.
DP
Project Name:
Parcel B Hunters Point ShipyardU.S. Navy SW Div. Naval Facilities Engineering Command
Hunters Point Phase III Soil Vapor Extraction Treatability Study
End of boring at 12 ft. bgs
2 inches asphalt with 6 inches base gravel

Boring: IR10SG059 Sheet 1 of 1Well Name: IR10SG059 Project # : 02-307.01
Location:Client:Logged By: E. Ehlers Drilling Co.: Precision SamplingDate Started: 1/14/2005 Drill Rig: Track Geoprobe G610Date Completed: 1/14/2005 Driller Name: Ernesto
(See Site Map) Date Backfilled: 3/15/2006 Drilling Method: Direct PushBoring Diam.: 3" Sampler: 4 ft. Butyrate LinersGround Elev.: 10.35 Casing Mtrl/Size: 1/4 inch teflon tubingTOC Elev.: N/A Screen Mtrl/Size: 1 inch filter screenNorthing: 453414.1 Slot Size: N/A
Sketch of Boring Location: Easting: 1460923 Sand Size: 2/12 sand
00.00.0 10.00.0 20.00.0 30.00.0 40.0
0502T017 0.0 50.00.0 60.00.0 70.0
8
9
10
11
12
13
14
15
16
17
18
19
20
2 inches asphalt with 6 inches base gravel
Project Name:
Parcel B Hunters Point ShipyardU.S. Navy SW Div. Naval Facilities Engineering Command
Hunters Point Phase III Soil Vapor Extraction Treatability Study
Soil Description
Surface Completion: Temporary soil gas sampling probe. Grout to surface with approximately 2 feet of 1/4 inch teflon tubing extending from hole.
FILL: Clayey SAND with with gravel. Dark brown (10YR 3/3). Moist. Well graded. Medium Density.
Sam
ple
Num
ber
Sam
ple
Inte
rval
PID
(ppm
)
Wel
l Cas
ing/
Bor
ehol
e B
ackf
ill
Soil
Gra
phic
Soil
Sym
bol (
USG
S)
Note: Refusal at 7 feet (rock/cobble) in first attempt. Offset 2 feet and retry.
End of boring at 8 ft. bgs
SC
SC
FILL: Clayey SAND and gravel. Gray (Gley2 5/5BG). Moist. Angular gravel (serpentinite). Moderately graded. Medium Density.
Dep
th (f
eet)
Rec
over
ed In
terv
alD
rive
Inte
rval
DP
DP
Blo
ws
/ 6"
or P
ress
ure
(psi
)

Boring: IR10SG060 Sheet 1 of 1Well Name: IR10SG060 Project # : 02-307.01
Location:Client:Logged By: E. Ehlers Drilling Co.: Precision SamplingDate Started: 1/14/2005 Drill Rig: Track Geoprobe G610Date Completed: 1/14/2005 Driller Name: Ernesto
(See Site Map) Date Backfilled: 3/15/2006 Drilling Method: Direct PushBoring Diam.: 3" Sampler: 4 ft. Butyrate LinersGround Elev.: 10.26 Casing Mtrl/Size: 1/4 inch teflon tubingTOC Elev.: N/A Screen Mtrl/Size: 1 inch filter screenNorthing: 453434.6 Slot Size: N/A
Sketch of Boring Location: Easting: 1460865 Sand Size: 2/12 sand
00.00.0 10.00.0 20.00.0 30.00.0 40.0
0502T021 0.0 50.00.0 60.00.0 70.0
8
9
10
11
12
13
14
15
16
17
18
19
20
Dep
th (f
eet)
Rec
over
ed In
terv
alD
rive
Inte
rval
DP
DP
Blo
ws
/ 6"
or P
ress
ure
(psi
)
Sam
ple
Num
ber
SP
CL
Soil
Gra
phic
Soil
Sym
bol (
USG
S)
Sam
ple
Inte
rval
PID
(ppm
)
Wel
l Cas
ing/
Bor
ehol
e B
ackf
ill
End of boring at 8 ft. bgs
Soil Description
Water appears perched in sand above the clay.
Surface Completion: Temporary soil gas sampling probe. Grout to surface with approximately 2 feet of 1/4 inch teflon tubing extending from hole.
FILL: SAND. Dark brown (10YR 3/3). Moist to saturated (at 3 ft). Very poorly graded. Loose.
4 inches asphalt with 6 inches base gravel
Project Name:
Parcel B Hunters Point ShipyardU.S. Navy SW Div. Naval Facilities Engineering Command
Hunters Point Phase III Soil Vapor Extraction Treatability Study
FILL: Gravelly CLAY. Gray (Gley2 6/5BG). Moist. Stiff. Very low plasticity. Weathered serpentinite.

Boring: IR10SG061 Sheet 1 of 1Well Name: IR10SG061 Project # : 02-307.01
Location:Client:Logged By: E. Ehlers Drilling Co.: Precision SamplingDate Started: 1/14/2005 Drill Rig: Track Geoprobe G610Date Completed: 1/14/2005 Driller Name: Ernesto
(See Site Map) Date Backfilled: 3/15/2006 Drilling Method: Direct PushBoring Diam.: 3" Sampler: 4 ft. Butyrate LinersGround Elev.: 9.80 Casing Mtrl/Size: 1/4 inch teflon tubingTOC Elev.: N/A Screen Mtrl/Size: 1 inch filter screenNorthing: 453440.1 Slot Size: N/A
Sketch of Boring Location: Easting: 1460886 Sand Size: 2/12 sand
00.00.0 10.00.0 20.00.0 30.00.0 40.0
0502T020 0.0 50.00.0 60.00.0 7 Saturated at 7.0 feet.0.0
8
9
10
11
12
13
14
15
16
17
18
19
20
4 inches asphalt with 6 inches base gravel
Project Name:
Parcel B Hunters Point ShipyardU.S. Navy SW Div. Naval Facilities Engineering Command
Hunters Point Phase III Soil Vapor Extraction Treatability Study
End of boring at 8 ft. bgs
FILL: Clayey SAND with gravel. Dark brown (10YR 3/3). Moist. Well graded. Medium dense.
FILL: Clayey Gravel with trace sand. Dark brown (10YR 3/3). Damp. Loose. Moderately graded.
FILL: Gravelly CLAY. Gray (Gley2 6/5BG). Moist. Stiff. Very low plasticity. Weathered serpentinite.
Wel
l Cas
ing/
Bor
ehol
e B
ackf
ill
Soil
Gra
phic
Soil
Sym
bol (
USG
S)
Soil Description
Surface Completion: Temporary soil gas sampling probe. Grout to surface with approximately 2 feet of 1/4 inch teflon tubing extending from hole.
Sam
ple
Inte
rval
PID
(ppm
)
CL
SC
GC
Dep
th (f
eet)
Rec
over
ed In
terv
alD
rive
Inte
rval
DP
DP
Blo
ws
/ 6"
or P
ress
ure
(psi
)
Sam
ple
Num
ber

Boring: IR10SG062 Sheet 1 of 1Well Name: IR10SG062 Project # : 02-307.01
Location:Client:Logged By: E. Ehlers Drilling Co.: Precision SamplingDate Started: 1/14/2005 Drill Rig: Track Geoprobe G610Date Completed: 1/14/2005 Driller Name: Ernesto
(See Site Map) Date Backfilled: 3/15/2006 Drilling Method: Direct PushBoring Diam.: 3" Sampler: 4 ft. Butyrate LinersGround Elev.: 10.26 Casing Mtrl/Size: 1/4 inch teflon tubingTOC Elev.: N/A Screen Mtrl/Size: 1 inch filter screenNorthing: 453441.6 Slot Size: N/A
Sketch of Boring Location: Easting: 1460919 Sand Size: 2/12 sand
00.00.0 10.00.0 20.00.0 30.00.0 40.0
0502T018 0.0 50.00.0 60.0 Saturated at 7.0 feet.0.0 70.0
8
9
10
11
12
13
14
15
16
17
18
19
20
Dep
th (f
eet)
Rec
over
ed In
terv
alD
rive
Inte
rval
DP
DP
Blo
ws
/ 6"
or P
ress
ure
(psi
)
Sam
ple
Num
ber
Sam
ple
Inte
rval
PID
(ppm
)
Soil
Gra
phic
Soil
Sym
bol (
USG
S)
Wel
l Cas
ing/
Bor
ehol
e B
ackf
ill
FILL: Sandy CLAY with gravel. Gray (Gley2 6/5BG). Moist. Soft. Very low plasticity. Weathered serpentinite.
FILL: Clayey SAND with gravel. Dark brown (10YR 3/3). Moist. Well graded. Medium dense.
End of boring at 8 ft. bgs
CL
SC
Project Name:
Parcel B Hunters Point ShipyardU.S. Navy SW Div. Naval Facilities Engineering Command
Hunters Point Phase III Soil Vapor Extraction Treatability Study
Soil Description
Surface Completion: Temporary soil gas sampling probe. Grout to surface with approximately 2 feet of 1/4 inch teflon tubing extending from hole.
4 inches asphalt with 6 inches base gravel
Rust staining at 7.5 feet bgs. (zero valent iron staining?) Soil same as above.

Boring: IR10SG063 Sheet 1 of 1Well Name: IR10SG063 Project # : 02-307.01
Location:Client:Logged By: E. Ehlers Drilling Co.: Precision SamplingDate Started: 1/14/2005 Drill Rig: Track Geoprobe G610Date Completed: 1/14/2005 Driller Name: Ernesto
(See Site Map) Date Backfilled: 3/15/2006 Drilling Method: Direct PushBoring Diam.: 3" Sampler: 4 ft. Butyrate LinersGround Elev.: 10.34 Casing Mtrl/Size: 1/4 inch teflon tubingTOC Elev.: N/A Screen Mtrl/Size: 1 inch filter screenNorthing: 453451.8 Slot Size: N/A
Sketch of Boring Location: Easting: 1460841 Sand Size: 2/12 sand
00.00.0 10.00.0 20.00.0 30.00.0 40.0
0502T024 0.0 50.00.0 60.00.0 7 Saturated at 7.0 feet.0.0
8
9
10
11
12
13
14
15
16
17
18
19
20
Dep
th (f
eet)
Rec
over
ed In
terv
alD
rive
Inte
rval
DP
DP
Blo
ws
/ 6"
or P
ress
ure
(psi
)
Sam
ple
Num
ber
Sam
ple
Inte
rval
PID
(ppm
)
Soil
Sym
bol (
USG
S)
Wel
l Cas
ing/
Bor
ehol
e B
ackf
ill
Soil
Gra
phic
GC
CL
FILL: Clayey Gravel with trace sand. Dark brown (10YR 3/3). Moist. Medium dense. Well graded.
Project Name:
Parcel B Hunters Point ShipyardU.S. Navy SW Div. Naval Facilities Engineering Command
Hunters Point Phase III Soil Vapor Extraction Treatability Study
Soil Description
Surface Completion: Temporary soil gas sampling probe. Grout to surface with approximately 2 feet of 1/4 inch teflon tubing extending from hole.
End of boring at 8 ft. bgs
4 inches asphalt with 6 inches base gravel
FILL: Gravelly CLAY. Gray (Gley2 6/5BG). Moist. Stiff. Very low plasticity. Weathered serpentinite.

Boring: IR10SG064 Sheet 1 of 1Well Name: IR10SG064 Project # : 02-307.01
Location:Client:Logged By: E. Ehlers Drilling Co.: Precision SamplingDate Started: 1/14/2005 Drill Rig: Track Geoprobe G610Date Completed: 1/14/2005 Driller Name: Ernesto
(See Site Map) Date Backfilled: 3/15/2006 Drilling Method: Direct PushBoring Diam.: 3" Sampler: 4 ft. Butyrate LinersGround Elev.: 10.04 Casing Mtrl/Size: 1/4 inch teflon tubingTOC Elev.: N/A Screen Mtrl/Size: 1 inch filter screenNorthing: 453457.4 Slot Size: N/A
Sketch of Boring Location: Easting: 1460877 Sand Size: 2/12 sand
00.00.0 10.00.0 20.00.0 30.00.0 40.0
0502T023 0.0 50.00.0 60.0 Saturated at 7.0 feet.0.0 70.0
8
9
10
11
12
13
14
15
16
17
18
19
20
4 inches asphalt with 6 inches base gravel
Project Name:
Parcel B Hunters Point ShipyardU.S. Navy SW Div. Naval Facilities Engineering Command
Hunters Point Phase III Soil Vapor Extraction Treatability Study
Soil Description
Surface Completion: Temporary soil gas sampling probe. Grout to surface with approximately 2 feet of 1/4 inch teflon tubing extending from hole.
Wel
l Cas
ing/
Bor
ehol
e B
ackf
ill
End of boring at 8 ft. bgs
Soil
Gra
phic
Soil
Sym
bol (
USG
S)
FILL: Clayey SAND with gravel. Dark brown (10YR 3/3). Moist. Well graded. Medium dense.
FILL: Sandy CLAY with gravel. Gray (Gley2 6/5BG). Moist. Stiff to Soft (near water table). Weathered serpentinite.
DPCL
SC
Dep
th (f
eet)
Rec
over
ed In
terv
alD
rive
Inte
rval
DP
Blo
ws
/ 6"
or P
ress
ure
(psi
)
Sam
ple
Num
ber
Sam
ple
Inte
rval
PID
(ppm
)

Boring: IR10SG065 Sheet 1 of 1Well Name: IR10SG065 Project # : 02-307.01
Location:Client:Logged By: E. Ehlers Drilling Co.: Precision SamplingDate Started: 1/14/2005 Drill Rig: Track Geoprobe G610Date Completed: 1/14/2005 Driller Name: Ernesto
(See Site Map) Date Backfilled: 3/15/2006 Drilling Method: Direct PushBoring Diam.: 3" Sampler: 4 ft. Butyrate LinersGround Elev.: 10.15 Casing Mtrl/Size: 1/4 inch teflon tubingTOC Elev.: N/A Screen Mtrl/Size: 1 inch filter screenNorthing: 453465.0 Slot Size: N/A
Sketch of Boring Location: Easting: 1460929 Sand Size: 2/12 sand
00.00.0 10.00.0 20.00.0 30.00.0 40.0
0502T019 0.0 50.00.0 60.00.0 70.0
8
9
10
11
12
13
14
15
16
17
18
19
20
Dep
th (f
eet)
Rec
over
ed In
terv
alD
rive
Inte
rval
DP
DP
Blo
ws
/ 6"
or P
ress
ure
(psi
)
Sam
ple
Num
ber
Sam
ple
Inte
rval
PID
(ppm
)
Soil
Sym
bol (
USG
S)
Wel
l Cas
ing/
Bor
ehol
e B
ackf
ill
Soil
Gra
phic
End of boring at 8 ft. bgs
CL
SC
FILL: Clayey SAND with gravel. Dark brown (10YR 3/3). Moist. Well graded. Medium dense.
Project Name:
Parcel B Hunters Point ShipyardU.S. Navy SW Div. Naval Facilities Engineering Command
Hunters Point Phase III Soil Vapor Extraction Treatability Study
Soil Description
Surface Completion: Temporary soil gas sampling probe. Grout to surface with approximately 2 feet of 1/4 inch teflon tubing extending from hole.
FILL: Sandy CLAY with gravel. Gray (Gley2 6/5BG). Moist. Medium Stiff. Very low plasticity. Weathered serpentinite.
4 inches asphalt with 6 inches base gravel

Boring: IR10SG066 Sheet 1 of 1Well Name: IR10SG066 Project # : 02-307.01
Location:Client:Logged By: E. Ehlers/S. Lee Drilling Co.: Precision SamplingDate Started: 3/23/2005 Drill Rig: Track Geoprobe G610Date Completed: 3/23/2005 Driller Name: Ernesto
(See Site Map) Date Backfilled: 3/15/2006 Drilling Method: Direct PushBoring Diam.: 2" Sampler: 4 ft. Butyrate LinersGround Elev.: 14.21 Casing Mtrl/Size: 1/4 inch teflon tubingTOC Elev.: N/A Screen Mtrl/Size: 1 inch filter screenNorthing: 453307.3 Slot Size: N/A
Sketch of Boring Location: Easting: 1460865 Sand Size: 2/12 sand
00.10.1 10.10.1 20.10.1 30.1 SW0.1 40.10.1 50.10.1 60.10.1 70.10.1 80.10.1 90.10.1 100.10.1 110.1
12
13
14
15
16
17
18
19
20
DP
Blo
ws
/ 6"
or P
ress
ure
(psi
)
Sam
ple
Num
ber
Sam
ple
Inte
rval
Rec
over
ed In
terv
alD
rive
Inte
rval
DP
DP
CL
Soil Description
FILL: Sandy-gravelly CLAY. Brownish gray (10YR 4/6). Damp. Well graded. Angular gravel. Stiff.
Concrete floor (12 inch slab)
PID
(ppm
)
Wel
l Cas
ing/
Bor
ehol
e B
ackf
ill Surface Completion: Temporary soil gas sampling probe. Grout to surface with approximately 2 feet of 1/4 inch teflon tubing extending from hole.
Dep
th (f
eet)
Soil
Gra
phic
Soil
Sym
bol (
USG
S)
Project Name:
Parcel B Hunters Point ShipyardU.S. Navy SW Div. Naval Facilities Engineering Command
Hunters Point Phase III Soil Vapor Extraction Treatability Study
End of boring at 12 ft. bgs
FILL: SAND with trace gravel. Olive (5Y 4/3). Damp. Loose. Angular gravel. Moderately graded.
CL
FILL: Sandy-gravelly CLAY. Brownish gray (10YR 4/6). Damp. Well graded. Angular gravel. Soft. Occassional gravel layers ( 1 to 2 inches thick).
Boring: IR10SG067 Sheet 1 of 1Well Name: IR10SG067 Project # : 02-307.01
Location:Client:Logged By: E. Ehlers/S. Lee Drilling Co.: Precision SamplingDate Started: 3/23/2005 Drill Rig: Track Geoprobe G610Date Completed: 3/23/2005 Driller Name: Ernesto
(See Site Map) Date Backfilled: 3/15/2006 Drilling Method: Direct PushBoring Diam.: 2" Sampler: 4 ft. Butyrate LinersGround Elev.: 14.13 Casing Mtrl/Size: 1/4 inch teflon tubingTOC Elev.: N/A Screen Mtrl/Size: 1 inch filter screenNorthing: 453316.5 Slot Size: N/A
Sketch of Boring Location: Easting: 1460911 Sand Size: 2/12 sand
00.10.1 10.10.1 20.10.1 30.10.1 40.10.1 50.10.1 60.10.1 70.10.1 80.10.1 90.10.1 100.10.1 110.1
12
13
14
15
16
17
18
19
20
End of boring at 12 ft. bgsGravel seam (2 inches thick) at 11.5 feet bgs. Saturated. Angular gravel. Loose.
Project Name:
Parcel B Hunters Point ShipyardU.S. Navy SW Div. Naval Facilities Engineering Command
Hunters Point Phase III Soil Vapor Extraction Treatability Study
PID
(ppm
)
Wel
l Cas
ing/
Bor
ehol
e B
ackf
ill Surface Completion: Temporary soil gas sampling probe. Grout to surface with approximately 2 feet of 1/4 inch teflon tubing extending from hole.
Dep
th (f
eet)
Soil
Gra
phic
Soil
Sym
bol (
USG
S)
Soil Description
FILL: SAND with trace gravel. Medium brown (10YR 4/6). Moist. Loose. Very poorly graded.
Concrete floor (12 inch slab)
Blo
ws
/ 6"
or P
ress
ure
(psi
)
Sam
ple
Num
ber
Sam
ple
Inte
rval
Rec
over
ed In
terv
alD
rive
Inte
rval
DP
DP
DP
CLFill: Sandy CLAY. Grayish brown (10YR 5/2). Moist to wet. Soft. Moderate plasticity. Moderately graded.
SP
FILL: Sandy-gravelly CLAY. Brownish gray (10YR 3/2). Damp. Very well graded. Angular gravel. Stiff.
CL

Boring: IR10SG068 Sheet 1 of 1Well Name: IR10SG068 Project # : 02-307.01
Location:Client:Logged By: E. Ehlers/S. Lee Drilling Co.: Precision SamplingDate Started: 3/23/2005 Drill Rig: Track Geoprobe G610Date Completed: 3/23/2005 Driller Name: Ernesto
(See Site Map) Date Backfilled: 3/15/2006 Drilling Method: Direct PushBoring Diam.: 2" Sampler: 4 ft. Butyrate LinersGround Elev.: 14.45 Casing Mtrl/Size: 1/4 inch teflon tubingTOC Elev.: N/A Screen Mtrl/Size: 1 inch filter screenNorthing: 453347.1 Slot Size: N/A
Sketch of Boring Location: Easting: 1460927 Sand Size: 2/12 sand
00.10.1 10.10.1 20.10.1 30.10.1 40.10.1 50.10.1 60.10.1 70.10.1 80.10.1 90.10.1 100.10.1 110.1
12
13
14
15
16
17
18
19
20
FILL: Sandy-gravelly CLAY. Brownish gray (10YR 3/2). Damp. Well graded. Angular gravel. Stiff.
FILL: Sandy-gravelly CLAY. Brownish gray (10YR 3/2). Damp. Well graded. Angular gravel. Stiff. Gravel consists of weathered serpentinite.
End of boring at 12 ft. bgs
Project Name:
Parcel B Hunters Point ShipyardU.S. Navy SW Div. Naval Facilities Engineering Command
Hunters Point Phase III Soil Vapor Extraction Treatability Study
PID
(ppm
)
Wel
l Cas
ing/
Bor
ehol
e B
ackf
ill Surface Completion: Temporary soil gas sampling probe. Grout to surface with approximately 2 feet of 1/4 inch teflon tubing extending from hole.
Dep
th (f
eet)
Soil
Gra
phic
Soil
Sym
bol (
USG
S)
Soil DescriptionConcrete floor (12 inch slab)
DP
Blo
ws
/ 6"
or P
ress
ure
(psi
)
Sam
ple
Num
ber
Sam
ple
Inte
rval
Rec
over
ed In
terv
alD
rive
Inte
rval
DP
DP
CL
CL

Boring: IR10SG069 Sheet 1 of 1Well Name: IR10SG069 Project # : 02-307.01
Location:Client:Logged By: E. Ehlers/S. Lee Drilling Co.: Precision SamplingDate Started: 3/23/2005 Drill Rig: Track Geoprobe G610Date Completed: 3/23/2005 Driller Name: Ernesto
(See Site Map) Date Backfilled: 3/15/2006 Drilling Method: Direct PushBoring Diam.: 2" Sampler: 4 ft. Butyrate LinersGround Elev.: 14.33 Casing Mtrl/Size: 1/4 inch teflon tubingTOC Elev.: N/A Screen Mtrl/Size: 1 inch filter screenNorthing: 453425.6 Slot Size: N/A
Sketch of Boring Location: Easting: 1460757 Sand Size: 2/12 sand
0
10.8
20.9
31.0
41.1
51.1
61.2
71.2
80.7
90.8
100.8
110.7
12
13
14
15
16
17
18
19
20
FILL: Sandy-gravelly CLAY. Brownish gray (10YR 3/2). Damp. Well graded. Angular gravel. Stiff. Gravel consists of weathered serpentinite.
CL
SP
CL
FILL: Sandy-gravelly CLAY. Brownish gray (10YR 3/2). Damp. Very well graded. Angular gravel. Medium stiff.
DP
DP
DP
Blo
ws
/ 6"
or P
ress
ure
(psi
)
Sam
ple
Num
ber
Sam
ple
Inte
rval
Rec
over
ed In
terv
alD
rive
Inte
rval
FILL: SAND with trace gravel. Medium brown (10YR 4/6). Moist. Loose. Very poorly graded.
Concrete floor (12 inch slab)
PID
(ppm
)
Wel
l Cas
ing/
Bor
ehol
e B
ackf
ill Surface Completion: Temporary soil gas sampling probe. Grout to surface with approximately 2 feet of 1/4 inch teflon tubing extending from hole.
Dep
th (f
eet)
Soil
Gra
phic
Soil
Sym
bol (
USG
S)
Soil Description
Project Name:
Parcel B Hunters Point ShipyardU.S. Navy SW Div. Naval Facilities Engineering Command
Hunters Point Phase III Soil Vapor Extraction Treatability Study
End of boring at 12 ft. bgs

Boring: IR10SG070 Sheet 1 of 1Well Name: IR10SG070 Project # : 02-307.01
Location:Client:Logged By: E. Ehlers/S. Lee Drilling Co.: Precision SamplingDate Started: 3/23/2005 Drill Rig: Track Geoprobe G610Date Completed: 3/23/2005 Driller Name: Ernesto
(See Site Map) Date Backfilled: 3/15/2006 Drilling Method: Direct PushBoring Diam.: 2" Sampler: 4 ft. Butyrate LinersGround Elev.: 14.02 Casing Mtrl/Size: 1/4 inch teflon tubingTOC Elev.: N/A Screen Mtrl/Size: 1 inch filter screenNorthing: 453451.1 Slot Size: N/A
Sketch of Boring Location: Easting: 1460772 Sand Size: 2/12 sand
0
11.2
21.0
31.1
41.2
51.1
61.1
71.1
81.1
91.2
101.1
111.1
12
13
14
15
16
17
18
19
20
End of boring at 12 ft. bgs
Project Name:
Parcel B Hunters Point ShipyardU.S. Navy SW Div. Naval Facilities Engineering Command
Hunters Point Phase III Soil Vapor Extraction Treatability Study
Concrete floor (12 inch slab)
PID
(ppm
)
Wel
l Cas
ing/
Bor
ehol
e B
ackf
ill Surface Completion: Temporary soil gas sampling probe. Grout to surface with approximately 2 feet of 1/4 inch teflon tubing extending from hole.
Dep
th (f
eet)
Soil
Gra
phic
Soil
Sym
bol (
USG
S)
Soil Description
Sam
ple
Num
ber
Sam
ple
Inte
rval
Rec
over
ed In
terv
alD
rive
Inte
rval
DP
DP
DP
Blo
ws
/ 6"
or P
ress
ure
(psi
)
CL
CL
FILL: Sandy-gravelly CLAY. Brownish gray (10YR 3/2). Damp. Well graded. Angular gravel. Stiff. Gravel consists of weathered serpentinite.
SP
FILL: Sandy-gravelly CLAY. Brownish gray (10YR 3/2). Damp. Very well graded. Angular gravel. Medium stiff.
FILL: SAND with trace gravel. Medium brown (10YR 4/6). Moist. Loose. Very poorly graded.

Boring: IR10SG071 Sheet 1 of 1Well Name: IR10SG071 Project # : 02-307.01
Location:Client:Logged By: E. Ehlers/S. Lee Drilling Co.: Precision SamplingDate Started: 1/14/2005 Drill Rig: Track Geoprobe G610Date Completed: 1/14/2005 Driller Name: Ernesto
(See Site Map) Date Backfilled: 3/15/2006 Drilling Method: Direct PushBoring Diam.: 3" Sampler: 4 ft. Butyrate LinersGround Elev.: 10.10 Casing Mtrl/Size: 1/4 inch teflon tubingTOC Elev.: N/A Screen Mtrl/Size: 1 inch filter screenNorthing: 453461.4 Slot Size: N/A
Sketch of Boring Location: Easting: 1460901 Sand Size: 2/12 sand
0
1
2
3
4
5
6
7
8
9
10
11
12
13
14
15
16
17
18
19
20
4 inches asphalt with 6 inches base gravel
Project Name:
Parcel B Hunters Point ShipyardU.S. Navy SW Div. Naval Facilities Engineering Command
Hunters Point Phase III Soil Vapor Extraction Treatability Study
Soil Description
Surface Completion: Temporary soil gas sampling probe. Grout to surface with approximately 2 feet of 1/4 inch teflon tubing extending from hole.
End of boring at 8 ft. bgs
GC
CL
CL
FILL: Clayey Gravel with trace sand. Dark brown (10YR 3/3). Damp. Loose. Angular gravel. Well graded.
FILL: Sandy, gravelly CLAY. Brownish gray (10YR 4/1). Damp. Medium stiff. Angular gravel.
FILL: Gravelly CLAY. Gray (Gley2 6/5BG). Moist. Stiff. Very low plasticity. Weathered serpentinite.
Sam
ple
Inte
rval
PID
(ppm
)
Soil
Sym
bol (
USG
S)
Wel
l Cas
ing/
Bor
ehol
e B
ackf
ill
Soil
Gra
phic
Dep
th (f
eet)
Rec
over
ed In
terv
alD
rive
Inte
rval
DP
DP
Blo
ws
/ 6"
or P
ress
ure
(psi
)
Sam
ple
Num
ber

Boring: IR10VW-15A Sheet 1 of 1Well Name: IR10VW-15A Project # : 02-307.01
Location:Client:Logged By: E. Ehlers Drilling Co.: Precision SamplingDate Started: 5/20/2005 Drill Rig: Track Geoprobe G610Date Completed: 5/20/2005 Driller Name: Ernesto
(See Site Map) Date Backfilled: Drilling Method: Direct Push/HSABoring Diam.: 12" Sampler: 4 ft. Butyrate LinersGround Elev.: 14.37 Casing Mtrl/Size: 4 inch Sch. 40 PVCTOC Elev.: N/A Screen Mtrl/Size: 4 inch Sch. 40 PVCNorthing: 453374.6 Slot Size: 0.02
Sketch of Boring Location: Easting: 1460892 Sand Size: #3 Monterey
00.00.0 10.00.0 20.00.0 30.00.0 40.00.0 50.00.0 60.00.0 70.00.0 80.00.0 90.0
10
11
12
13
14
15
16
17
18
19
20
FILL: Gravelly CLAY. Dark brown (10YR 3/3). Moist. Very well graded. Some large gravel over 2 inches diameter. Stiff. Low to moderate plasticity.
CL
CL
FILL: Gravelly CLAY (30 to 40% gravel). Gray green (Gley2 6/5 BG). Moist. Very well graded. Some large gravel over 2 inches diameter. Medium dense. Clay is weathered serpentinite.
DP
Dep
th (f
eet)
Soil
Gra
phic
Soil
Sym
bol (
USG
S)
Sam
ple
Num
ber
Sam
ple
Inte
rval
Rec
over
ed In
terv
alD
rive
Inte
rval
PID
(ppm
)
DP
DP
End of boring at 10 ft. bgs
Wel
l Cas
ing/
Bor
ehol
e B
ackf
ill
Blo
ws
/ 6"
or P
ress
ure
(psi
)
Project Name:
Parcel B Hunters Point ShipyardU.S. Navy SW Div. Naval Facilities Engineering Command
Hunters Point Phase III Soil Vapor Extraction Treatability Study
Soil Description
Surface Completion: Grout to surface with approximately 2.5 feet of 4 inch Sch. 40 PVC casing capped with a TEE fitting and flexible 4-inch vacuum hose connecting to system piping by cam-lock quick connect fittings.
2 inches asphalt over 10" concrete

Boring: IR10VW-16A Sheet 1 of 1Well Name: IR10VW-16A Project # : 02-307.01
Location:Client:Logged By: E. Ehlers Drilling Co.: Precision SamplingDate Started: 5/20/2005 Drill Rig: Track Geoprobe G610Date Completed: 5/20/2005 Driller Name: Ernesto
(See Site Map) Date Backfilled: Drilling Method: Direct Push/HSABoring Diam.: 12" Sampler: 4 ft. Butyrate LinersGround Elev.: 14.34 Casing Mtrl/Size: 4 inch Sch. 40 PVCTOC Elev.: N/A Screen Mtrl/Size: 4 inch Sch. 40 PVCNorthing: 453361.7 Slot Size: 0.02
Sketch of Boring Location: Easting: 1460893 Sand Size: #3 Monterey
00.00.0 10.00.0 20.00.0 30.00.0 40.00.0 50.00.0 60.00.0 70.00.0 80.00.0 90.0
10
11
12
13
14
15
16
17
18
19
20
2 inches asphalt over 10" concrete
Project Name:
Parcel B Hunters Point ShipyardU.S. Navy SW Div. Naval Facilities Engineering Command
Hunters Point Phase III Soil Vapor Extraction Treatability Study
Soil Description
Surface Completion: Grout to surface with approximately 2.5 feet of 4 inch Sch. 40 PVC casing capped with a TEE fitting and flexible 4-inch vacuum hose connecting to system piping by cam-lock quick connect fittings.
PID
(ppm
)
DP
DP
End of boring at 10 ft. bgs
Wel
l Cas
ing/
Bor
ehol
e B
ackf
ill
Blo
ws
/ 6"
or P
ress
ure
(psi
)
Sam
ple
Num
ber
Sam
ple
Inte
rval
Rec
over
ed In
terv
alD
rive
Inte
rval
Dep
th (f
eet)
Soil
Gra
phic
Soil
Sym
bol (
USG
S)
DP
FILL: Gravelly CLAY. Dark brown (10YR 3/3). Moist. Very well graded. Some large gravel over 2 inches diameter. Stiff. Low to moderate plasticity.
CL
CL
FILL: Gravelly CLAY. Gray green (Gley2 6/5 BG). Moist. Very well graded. Some large gravel over 2 inches diameter. Stiff. Clay is weathered serpentinite.

Boring: IR10VW-17A Sheet 1 of 1Well Name: IR10VW-17A Project # : 02-307.01
Location:Client:Logged By: E. Ehlers Drilling Co.: Precision SamplingDate Started: 5/20/2005 Drill Rig: Track Geoprobe G610Date Completed: 5/20/2005 Driller Name: Ernesto
(See Site Map) Date Backfilled: Drilling Method: Direct Push/HSABoring Diam.: 12" Sampler: 4 ft. Butyrate LinersGround Elev.: 14.29 Casing Mtrl/Size: 4 inch Sch. 40 PVCTOC Elev.: N/A Screen Mtrl/Size: 4 inch Sch. 40 PVCNorthing: 453374.8 Slot Size: 0.02
Sketch of Boring Location: Easting: 1460878 Sand Size: #3 Monterey
00.00.0 10.00.0 20.00.0 30.00.0 40.00.0 50.00.0 60.00.0 70.00.0 80.00.0 90.0
10
11
12
13
14
15
16
17
18
19
20
DP
Soil
Gra
phic
Soil
Sym
bol (
USG
S)
FILL: Gravelly CLAY. Dark brown (10YR 3/3). Moist. Well graded. Some large gravel over 2 inches diameter. Stiff. Low to moderate plasticity.
CL
CL
FILL: Gravelly CLAY (30 to 40% gravel). Gray green (Gley2 6/5 BG). Moist. Very well graded. Some large gravel over 2 inches diameter. Medium dense. Clay is weathered serpentinite.
Sam
ple
Inte
rval
Rec
over
ed In
terv
alD
rive
Inte
rval
Dep
th (f
eet)
PID
(ppm
)
DP
DP
End of boring at 10 ft. bgs
Wel
l Cas
ing/
Bor
ehol
e B
ackf
ill
Blo
ws
/ 6"
or P
ress
ure
(psi
)
Sam
ple
Num
ber
Project Name:
Parcel B Hunters Point ShipyardU.S. Navy SW Div. Naval Facilities Engineering Command
Hunters Point Phase III Soil Vapor Extraction Treatability Study
Soil Description
Surface Completion: Grout to surface with approximately 2.5 feet of 4 inch Sch. 40 PVC casing capped with a TEE fitting and flexible 4-inch vacuum hose connecting to system piping by cam-lock quick connect fittings.
2 inches asphalt over 10" concrete

Boring: IR10VW-18A Sheet 1 of 1Well Name: IR10VW-18A Project # : 02-307.01
Location:Client:Logged By: E. Ehlers Drilling Co.: Precision SamplingDate Started: 5/18/2005 Drill Rig: Track Geoprobe G610Date Completed: 5/18/2005 Driller Name: Ernesto
(See Site Map) Date Backfilled: Drilling Method: Direct Push/HSABoring Diam.: 12" Sampler: 4 ft. Butyrate LinersGround Elev.: 14.19 Casing Mtrl/Size: 4 inch Sch. 40 PVCTOC Elev.: N/A Screen Mtrl/Size: 4 inch Sch. 40 PVCNorthing: 453349.5 Slot Size: 0.02
Sketch of Boring Location: Easting: 1460876 Sand Size: #3 Monterey
00.00.0 10.00.0 20.00.0 30.00.0 40.00.0 50.00.0 60.00.0 70.00.0 80.00.0 90.0
10
11
12
13
14
15
16
17
18
19
20
2 inches asphalt over 10" concrete
Project Name:
Parcel B Hunters Point ShipyardU.S. Navy SW Div. Naval Facilities Engineering Command
Hunters Point Phase III Soil Vapor Extraction Treatability Study
Soil Description
Surface Completion: Grout to surface with approximately 2.5 feet of 4 inch Sch. 40 PVC casing capped with a TEE fitting and flexible 4-inch vacuum hose connecting to system piping by cam-lock quick connect fittings.
PID
(ppm
)
DP
DP
End of boring at 10 ft. bgs
Wel
l Cas
ing/
Bor
ehol
e B
ackf
ill
Blo
ws
/ 6"
or P
ress
ure
(psi
)
CL
Sam
ple
Num
ber
DP
Soil
Gra
phic
Soil
Sym
bol (
USG
S)
GW
SW
Sam
ple
Inte
rval
Rec
over
ed In
terv
alD
rive
Inte
rval
Dep
th (f
eet)
FILL: Gravelly SAND (10 to 15% gravel). Dark brown (10YR 3/3). Moist. Well graded. Loose to medium dense.
FILL: Clayey GRAVEL with some sand. Red brown (10 YR 3/3). Moist. Loose to dense. Angular gravel. Observed large gravel and cobbles (over 2 inches diameter) from 7 feet.
FILL: Gravelly CLAY. Gray green (Gley2 6/5 BG). Moist. Very well graded. Stiff. Low plasticity. Clay is weathered serpentinite.

Boring: IR10VW-19A Sheet 1 of 1Well Name: IR10VW-19A Project # : 02-307.01
Location:Client:Logged By: E. Ehlers Drilling Co.: Precision SamplingDate Started: 5/18/2005 Drill Rig: Track Geoprobe G610Date Completed: 5/18/2005 Driller Name: Ernesto
(See Site Map) Date Backfilled: Drilling Method: Direct Push/HSABoring Diam.: 12" Sampler: 4 ft. Butyrate LinersGround Elev.: 14.15 Casing Mtrl/Size: 4 inch Sch. 40 PVCTOC Elev.: N/A Screen Mtrl/Size: 4 inch Sch. 40 PVCNorthing: 453350.9 Slot Size: 0.02
Sketch of Boring Location: Easting: 1460845 Sand Size: #3 Monterey
00.00.0 10.00.0 20.00.0 30.00.0 40.00.0 50.00.0 60.00.0 70.00.0 80.00.0 90.0
10
11
12
13
14
15
16
17
18
19
20
GC
CL
CLFILL: Gravelly CLAY. Gray green (Gley2 6/5 BG). Moist. Very well graded. Stiff. Low plasticity. Clay is weathered serpentinite.
FILL: Gravelly CLAY. Gray (Gley2 6/10 G). Moist. Very well graded. Soft to stiff. Low plasticity.
DP
DP
DP
End of boring at 10 ft. bgs
Wel
l Cas
ing/
Bor
ehol
e B
ackf
ill
Soil
Gra
phic
Soil
Sym
bol (
USG
S)
FILL: Sandy GRAVEL with clay. Dark brown (10YR 3/3). Moist. Well graded. Medium dense. Angular gravel.
Blo
ws
/ 6"
or P
ress
ure
(psi
)
Sam
ple
Num
ber
Soil Description
Surface Completion: Grout to surface with approximately 2.5 feet of 4 inch Sch. 40 PVC casing capped with a TEE fitting and flexible 4-inch vacuum hose connecting to system piping by cam-lock quick connect fittings.
Rec
over
ed In
terv
alD
rive
Inte
rval
Dep
th (f
eet)
PID
(ppm
)
Sam
ple
Inte
rval
Project Name:
Parcel B Hunters Point ShipyardU.S. Navy SW Div. Naval Facilities Engineering Command
Hunters Point Phase III Soil Vapor Extraction Treatability Study
2 inches asphalt over 10" concrete

Boring: IR10VW-20A Sheet 1 of 1Well Name: IR10VW-20A Project # : 02-307.01
Location:Client:Logged By: E. Ehlers Drilling Co.: Precision SamplingDate Started: 5/18/2005 Drill Rig: Track Geoprobe G610Date Completed: 5/18/2005 Driller Name: Ernesto
(See Site Map) Date Backfilled: Drilling Method: Direct Push/HSABoring Diam.: 12" Sampler: 4 ft. Butyrate LinersGround Elev.: 14.10 Casing Mtrl/Size: 4 inch Sch. 40 PVCTOC Elev.: N/A Screen Mtrl/Size: 4 inch Sch. 40 PVCNorthing: 453374.2 Slot Size: 0.02
Sketch of Boring Location: Easting: 1460824 Sand Size: #3 Monterey
00.00.0 10.00.0 20.00.0 30.00.0 40.00.0 50.00.0 60.0 GP0.0 70.00.0 80.00.0 90.0
10
11
12
13
14
15
16
17
18
19
20
FILL: Clayey GRAVEL with some sand. Dark brown (10 YR 3/3). Moist. Medium to high density. Angular gravel. Some gravel over 2 inches diameter.
CL
GW
FILL: GRAVEL. 1/4 inch diameter crushed/angular. Dry. Poorly graded. Loose. FILL: Gravelly CLAY. Gray green (Gley2 6/5BG). Moist. Stiff. Low plasticity. Weathered serpentinite.
DP
DP
DP
End of boring at 10 ft. bgs
Wel
l Cas
ing/
Bor
ehol
e B
ackf
ill
Soil
Gra
phic
Soil
Sym
bol (
USG
S)
Blo
ws
/ 6"
or P
ress
ure
(psi
)
Sam
ple
Num
ber
Soil Description
Surface Completion: Grout to surface with approximately 2.5 feet of 4 inch Sch. 40 PVC casing capped with a TEE fitting and flexible 4-inch vacuum hose connecting to system piping by cam-lock quick connect fittings.
Sam
ple
Inte
rval
Rec
over
ed In
terv
alD
rive
Inte
rval
Dep
th (f
eet)
PID
(ppm
)
Project Name:
Parcel B Hunters Point ShipyardU.S. Navy SW Div. Naval Facilities Engineering Command
Hunters Point Phase III Soil Vapor Extraction Treatability Study
2 inches asphalt over 10" concrete

Boring: IR10VW-21A Sheet 1 of 1Well Name: IR10VW-21A Project # : 02-307.01
Location:Client:Logged By: E. Ehlers Drilling Co.: Precision SamplingDate Started: 5/19/2005 Drill Rig: Track Geoprobe G610Date Completed: 5/20/2005 Driller Name: Ernesto
(See Site Map) Date Backfilled: Drilling Method: Direct Push/HSABoring Diam.: 12" Sampler: 4 ft. Butyrate LinersGround Elev.: 14.07 Casing Mtrl/Size: 4 inch Sch. 40 PVCTOC Elev.: N/A Screen Mtrl/Size: 4 inch Sch. 40 PVCNorthing: 453440.2 Slot Size: 0.02
Sketch of Boring Location: Easting: 1460808 Sand Size: #3 Monterey
00.00.0 10.00.0 20.00.0 30.00.0 40.00.0 50.00.0 60.00.0 70.00.0 80.00.0 90.0
10
11
12
13
14
15
16
17
18
19
20
FILL: Gravelly CLAY. Dark brown (10YR 3/3). Moist. Very well graded. Stiff. Moderate plasticity.
GW
FILL: Clayey GRAVEL (30% Clay). Gray green (Gley2 6/5 BG). Moist. Medium dense. Very well graded. Angular gravel can be over 2 inches diameter.
DP
DP
DP
End of boring at 10 ft. bgs
Wel
l Cas
ing/
Bor
ehol
e B
ackf
ill
Soil
Gra
phic
Soil
Sym
bol (
USG
S)
CL
Blo
ws
/ 6"
or P
ress
ure
(psi
)
Sam
ple
Num
ber
Soil Description
Surface Completion: Grout to surface with approximately 2.5 feet of 4 inch Sch. 40 PVC casing capped with a TEE fitting and flexible 4-inch vacuum hose connecting to system piping by cam-lock quick connect fittings.
Sam
ple
Inte
rval
Rec
over
ed In
terv
alD
rive
Inte
rval
Dep
th (f
eet)
PID
(ppm
)
Project Name:
Parcel B Hunters Point ShipyardU.S. Navy SW Div. Naval Facilities Engineering Command
Hunters Point Phase III Soil Vapor Extraction Treatability Study
12" concrete

Boring: IR10VW-22A Sheet 1 of 1Well Name: IR10VW-22A Project # : 02-307.01
Location:Client:Logged By: E. Ehlers Drilling Co.: Precision SamplingDate Started: 5/19/2005 Drill Rig: Track Geoprobe G610Date Completed: 5/19/2005 Driller Name: Ernesto
(See Site Map) Date Backfilled: Drilling Method: Direct Push/HSABoring Diam.: 12" Sampler: 4 ft. Butyrate LinersGround Elev.: 14.11 Casing Mtrl/Size: 4 inch Sch. 40 PVCTOC Elev.: N/A Screen Mtrl/Size: 4 inch Sch. 40 PVCNorthing: 453413.6 Slot Size: 0.02
Sketch of Boring Location: Easting: 1460784 Sand Size: #3 Monterey
00.00.0 10.00.0 20.00.0 30.00.0 40.00.0 50.00.0 60.00.0 70.00.0 80.00.0 90.0
10
11
12
13
14
15
16
17
18
19
20
2 inches asphalt over 10" concrete
Project Name:
Parcel B Hunters Point ShipyardU.S. Navy SW Div. Naval Facilities Engineering Command
Hunters Point Phase III Soil Vapor Extraction Treatability Study
Blo
ws
/ 6"
or P
ress
ure
(psi
)
Sam
ple
Num
ber
Soil Description
Surface Completion: Grout to surface with approximately 2.5 feet of 4 inch Sch. 40 PVC casing capped with a TEE fitting and flexible 4-inch vacuum hose connecting to system piping by cam-lock quick connect fittings.
GW
Sam
ple
Inte
rval
Rec
over
ed In
terv
alD
rive
Inte
rval
Dep
th (f
eet)
Note: Observed large gravel (>2") and cobbles in cuttings
End of boring at 10 ft. bgs
Wel
l Cas
ing/
Bor
ehol
e B
ackf
ill
GP
CL
FILL: GRAVEL some sand and clay (10 to 15%). Dry. Loose to medium dense. Poorly graded. Very angular gravel (crushed). FILL: Gravelly CLAY. Gray green (Gley2 6/5BG). Moist. Stiff. Low plasticity. Weathered serpentinite.
PID
(ppm
)
Soil
Gra
phic
Soil
Sym
bol (
USG
S)
FILL: Clayey GRAVEL with some sand. Dark brown (10 YR 3/3). Moist. Medium to high density. Angular gravel. Some gravel over 2 inches diameter.
DP
DP
DP

Boring: IR10VW-23A Sheet 1 of 1Well Name: IR10VW-23A Project # : 02-307.01
Location:Client:Logged By: E. Ehlers Drilling Co.: Precision SamplingDate Started: 5/19/2005 Drill Rig: Track Geoprobe G610Date Completed: 5/19/2005 Driller Name: Ernesto
(See Site Map) Date Backfilled: Drilling Method: Direct Push/HSABoring Diam.: 12" Sampler: 4 ft. Butyrate LinersGround Elev.: 14.15 Casing Mtrl/Size: 4 inch Sch. 40 PVCTOC Elev.: N/A Screen Mtrl/Size: 4 inch Sch. 40 PVCNorthing: 453416.9 Slot Size: 0.02
Sketch of Boring Location: Easting: 1460768 Sand Size: #3 Monterey
00.00.0 10.00.0 20.00.0 30.00.0 40.00.0 50.00.0 60.00.0 70.00.0 80.00.0 90.0
10
11
12
13
14
15
16
17
18
19
20
FILL: Gravelly SAND (10 to 15% gravel). Dark brown (10YR 3/3). Moist. Well graded. Loose to medium dense.
SW
GW
FILL: Clayey GRAVEL. Gray green (Gley2 6/5 BG). Dry to moist. Loose to medium dense. Very well graded. Angular gravel.
DP
DP
DP
End of boring at 10 ft. bgs
Wel
l Cas
ing/
Bor
ehol
e B
ackf
ill
Soil
Gra
phic
Soil
Sym
bol (
USG
S)
Blo
ws
/ 6"
or P
ress
ure
(psi
)
Sam
ple
Num
ber
Soil Description
Surface Completion: Grout to surface with approximately 2.5 feet of 4 inch Sch. 40 PVC casing capped with a TEE fitting and flexible 4-inch vacuum hose connecting to system piping by cam-lock quick connect fittings.
Sam
ple
Inte
rval
Rec
over
ed In
terv
alD
rive
Inte
rval
Dep
th (f
eet)
PID
(ppm
)
Project Name:
Parcel B Hunters Point ShipyardU.S. Navy SW Div. Naval Facilities Engineering Command
Hunters Point Phase III Soil Vapor Extraction Treatability Study
2 inches asphalt over 10" concrete

Boring: IR10SG072-4 Sheet 1 of 1Well Name: IR10SG072-4 Project # : 02-307.01
Location:Client:Logged By: E. Ehlers Drilling Co.: Precision SamplingDate Started: 5/23/2005 Drill Rig: Track Geoprobe G610Date Completed: 5/23/2005 Driller Name: Ernesto
(See Site Map) Date Backfilled: Drilling Method: Direct Push/HSABoring Diam.: 10" Sampler: 4 ft. Butyrate LinersGround Elev.: 14.04 Casing Mtrl/Size: 2" Sch. 40 PVCTOC Elev.: N/A Screen Mtrl/Size: 2" Sch. 40 PVCNorthing: 453445.6 Slot Size: 0.02
Sketch of Boring Location: Easting: 1460805 Sand Size: #3 Monterey
0.0 00.00.0 10.00.0 20.00.0 30.00.0 40.00.0 50.0
6
7
8
9
10
11
12
13
14
15
16
17
18
19
20
End of boring at 6 ft. bgs
Dep
th (f
eet)
Rec
over
ed In
terv
alD
rive
Inte
rval
DP
Blo
ws
/ 6"
or P
ress
ure
(psi
)
Sam
ple
Num
ber
Sam
ple
Inte
rval
PID
(ppm
)
DP
Soil
Sym
bol (
USG
S)
Wel
l Cas
ing/
Bor
ehol
e B
ackf
ill
Soil
Gra
phic
CL
GW
FILL: Gravelly CLAY. Dark brown (10YR 3/3). Moist. Stiff. Very well graded. Moderate plasticity
FILL: Clayey GRAVEL (25-30% clay). Gray green (Gley2 6/5 BG). Moist. Medium dense to loose. Very well graded. Angular gravel that can be greater than 2 inches in diameter.
Project Name:
Parcel B Hunters Point ShipyardU.S. Navy SW Div. Naval Facilities Engineering Command
Hunters Point Phase III Soil Vapor Extraction Treatability Study
Soil Description (from soil boring IR10SG072-6)
Surface Completion: Vapor monitoring well. Grout to surface with approximately 2 feet of Sch. 40 PVC casing extending from hole. Capped with Sch. 40 PVC slip cap and 1/4 inch PVC lab cock valve.
2 inches asphalt with 10 inches concrete

Boring: IR10SG072-6 Sheet 1 of 1Well Name: IR10SG072-6 Project # : 02-307.01
Location:Client:Logged By: E. Ehlers Drilling Co.: Precision SamplingDate Started: 5/23/2005 Drill Rig: Track Geoprobe G610Date Completed: 5/23/2005 Driller Name: Ernesto
(See Site Map) Date Backfilled: Drilling Method: Direct Push/HSABoring Diam.: 10" Sampler: 4 ft. Butyrate LinersGround Elev.: 14.06 Casing Mtrl/Size: 2" Sch. 40 PVCTOC Elev.: N/A Screen Mtrl/Size: 2" Sch. 40 PVCNorthing: 453446.2 Slot Size: 0.02
Sketch of Boring Location: Easting: 1460806 Sand Size: #3 Monterey
0
0.0 10.00.0 20.00.0 30.00.0 40.00.0 50.0
6
7
8
9
10
11
12
13
14
15
16
17
18
19
20
2 inches asphalt with 10 inches concrete
Project Name:
Parcel B Hunters Point ShipyardU.S. Navy SW Div. Naval Facilities Engineering Command
Hunters Point Phase III Soil Vapor Extraction Treatability Study
Soil Description
Surface Completion: Vapor monitoring well. Grout to surface with approximately 2 feet of Sch. 40 PVC casing extending from hole. Capped with Sch. 40 PVC slip cap and 1/4 inch PVC lab cock valve.
FILL: Gravelly CLAY. Dark brown (10YR 3/3). Moist. Stiff. Very well graded. Moderate plasticity
FILL: Clayey GRAVEL (25-30% clay). Gray green (Gley2 6/5 BG). Moist. Medium dense to loose. Very well graded. Angular gravel that can be greater than 2 inches in diameter.
Soil
Sym
bol (
USG
S)
Wel
l Cas
ing/
Bor
ehol
e B
ackf
ill
Soil
Gra
phic
CL
GW
Dep
th (f
eet)
Rec
over
ed In
terv
alD
rive
Inte
rval
DP
Blo
ws
/ 6"
or P
ress
ure
(psi
)
Sam
ple
Num
ber
Sam
ple
Inte
rval
PID
(ppm
)
End of boring at 6 ft. bgs
DP

Boring: IR10SG073-4 Sheet 1 of 1Well Name: IR10SG073-4 Project # : 02-307.01
Location:Client:Logged By: E. Ehlers Drilling Co.: Precision SamplingDate Started: 5/23/2005 Drill Rig: Track Geoprobe G610Date Completed: 5/23/2005 Driller Name: Ernesto
(See Site Map) Date Backfilled: Drilling Method: Direct Push/HSABoring Diam.: 10" Sampler: 4 ft. Butyrate LinersGround Elev.: 14.07 Casing Mtrl/Size: 2" Sch. 40 PVCTOC Elev.: N/A Screen Mtrl/Size: 2" Sch. 40 PVCNorthing: 453430.4 Slot Size: 0.02
Sketch of Boring Location: Easting: 1460800 Sand Size: #3 Monterey
0.0 00.00.0 10.00.0 20.00.0 30.00.0 40.00.0 50.0
6
7
8
9
10
11
12
13
14
15
16
17
18
19
20
2 inches asphalt over 10 inches concrete
Project Name:
Parcel B Hunters Point ShipyardU.S. Navy SW Div. Naval Facilities Engineering Command
Hunters Point Phase III Soil Vapor Extraction Treatability Study
Soil Description (from soil boring IR10SG073-6)
Surface Completion: Vapor monitoring well. Grout to surface with approximately 2 feet of Sch. 40 PVC casing extending from hole. Capped with Sch. 40 PVC slip cap and 1/4 inch PVC lab cock valve.
FILL: Gravelly CLAY. Dark brown (10YR 3/3). Moist. Stiff. Very well graded. Moderate plasticity
GW
CL
Soil
Sym
bol (
USG
S)
FILL: Clayey GRAVEL. Gray green (Gley2 6/5 BG). Moist. Medium dense to loose. Very well graded. Angular gravel that can be greater than 2 inches in diameter.
Wel
l Cas
ing/
Bor
ehol
e B
ackf
ill
Soil
Gra
phic
Dep
th (f
eet)
Rec
over
ed In
terv
alD
rive
Inte
rval
DP
Blo
ws
/ 6"
or P
ress
ure
(psi
)
Sam
ple
Num
ber
Sam
ple
Inte
rval
PID
(ppm
)
End of boring at 6 ft. bgs
DP

Boring: IR10SG073-6 Sheet 1 of 1Well Name: IR10SG073-6 Project # : 02-307.01
Location:Client:Logged By: E. Ehlers Drilling Co.: Precision SamplingDate Started: 5/23/2005 Drill Rig: Track Geoprobe G610Date Completed: 5/23/2005 Driller Name: Ernesto
(See Site Map) Date Backfilled: Drilling Method: Direct Push/HSABoring Diam.: 10" Sampler: 4 ft. Butyrate LinersGround Elev.: 14.06 Casing Mtrl/Size: 2" Sch. 40 PVCTOC Elev.: N/A Screen Mtrl/Size: 2" Sch. 40 PVCNorthing: 453428.6 Slot Size: 0.02
Sketch of Boring Location: Easting: 1460801 Sand Size: #3 Monterey
0
0.0 10.00.0 20.00.0 30.00.0 40.00.0 50.0
6
7
8
9
10
11
12
13
14
15
16
17
18
19
20
End of boring at 6 ft. bgs
GW
CL
Dep
th (f
eet)
Rec
over
ed In
terv
alD
rive
Inte
rval
DP
Blo
ws
/ 6"
or P
ress
ure
(psi
)
Sam
ple
Num
ber
Sam
ple
Inte
rval
PID
(ppm
)
DP
Soil
Sym
bol (
USG
S)
FILL: Clayey GRAVEL. Gray green (Gley2 6/5 BG). Moist. Medium dense to loose. Very well graded. Angular gravel that can be greater than 2 inches in diameter.
Wel
l Cas
ing/
Bor
ehol
e B
ackf
ill
Soil
Gra
phic
FILL: Gravelly CLAY. Dark brown (10YR 3/3). Moist. Stiff. Very well graded. Moderate plasticity
Project Name:
Parcel B Hunters Point ShipyardU.S. Navy SW Div. Naval Facilities Engineering Command
Hunters Point Phase III Soil Vapor Extraction Treatability Study
Soil Description
Surface Completion: Vapor monitoring well. Grout to surface with approximately 2 feet of Sch. 40 PVC casing extending from hole. Capped with Sch. 40 PVC slip cap and 1/4 inch PVC lab cock valve.
2 inches asphalt with 10 inches concrete

Boring: IR10SG074-4 Sheet 1 of 1Well Name: IR10SG074-4 Project # : 02-307.01
Location:Client:Logged By: E. Ehlers Drilling Co.: Precision SamplingDate Started: 5/23/2005 Drill Rig: Track Geoprobe G610Date Completed: 5/23/2005 Driller Name: Ernesto
(See Site Map) Date Backfilled: Drilling Method: Direct Push/HSABoring Diam.: 10" Sampler: 4 ft. Butyrate LinersGround Elev.: 14.39 Casing Mtrl/Size: 2" Sch. 40 PVCTOC Elev.: N/A Screen Mtrl/Size: 2" Sch. 40 PVCNorthing: 453410.0 Slot Size: 0.02
Sketch of Boring Location: Easting: 1460757 Sand Size: #3 Monterey
0.0 00.00.0 10.00.0 20.00.0 30.00.0 40.00.0 50.0
6
7
8
9
10
11
12
13
14
15
16
17
18
19
20
End of boring at 6 ft. bgs
CL
CL
Dep
th (f
eet)
Rec
over
ed In
terv
alD
rive
Inte
rval
DP
Blo
ws
/ 6"
or P
ress
ure
(psi
)
Sam
ple
Num
ber
Sam
ple
Inte
rval
PID
(ppm
)
DP
Soil
Sym
bol (
USG
S)
Wel
l Cas
ing/
Bor
ehol
e B
ackf
ill
Soil
Gra
phic
FILL: Gravelly CLAY. Dark brown (10YR 3/3). Moist. Stiff. Very well graded. Some gravel over 2 inches diameter. Low to moderate plasticity.
FILL: Gravelly CLAY. Gray green (Gley2 6/5 BG). Moist. Medium dense. Very well graded. Angular gravel.
Project Name:
Parcel B Hunters Point ShipyardU.S. Navy SW Div. Naval Facilities Engineering Command
Hunters Point Phase III Soil Vapor Extraction Treatability Study
Soil Description (from soil boring IR10SG074-6)
Surface Completion: Vapor monitoring well. Grout to surface with approximately 2 feet of Sch. 40 PVC casing extending from hole. Capped with Sch. 40 PVC slip cap and 1/4 inch PVC lab cock valve.
2 inches asphalt with 10 inches concrete

Boring: IR10SG074-6 Sheet 1 of 1Well Name: IR10SG074-6 Project # : 02-307.01
Location:Client:Logged By: E. Ehlers Drilling Co.: Precision SamplingDate Started: 5/23/2005 Drill Rig: Track Geoprobe G610Date Completed: 5/23/2005 Driller Name: Ernesto
(See Site Map) Date Backfilled: Drilling Method: Direct Push/HSABoring Diam.: 10" Sampler: 4 ft. Butyrate LinersGround Elev.: 14.42 Casing Mtrl/Size: 2" Sch. 40 PVCTOC Elev.: N/A Screen Mtrl/Size: 2" Sch. 40 PVCNorthing: 453411.1 Slot Size: 0.02
Sketch of Boring Location: Easting: 1460755 Sand Size: #3 Monterey
0
10.0
20.0
34.1
40.8
50.0
6
7
8
9
10
11
12
13
14
15
16
17
18
19
20
2 inches asphalt with 10 inches concrete
Project Name:
Parcel B Hunters Point ShipyardU.S. Navy SW Div. Naval Facilities Engineering Command
Hunters Point Phase III Soil Vapor Extraction Treatability Study
Soil Description
Surface Completion: Vapor monitoring well. Grout to surface with approximately 2 feet of Sch. 40 PVC casing extending from hole. Capped with Sch. 40 PVC slip cap and 1/4 inch PVC lab cock valve.
FILL: Gravelly CLAY. Dark brown (10YR 3/3). Moist. Stiff. Very well graded. Some gravel over 2 inches diameter. Low to moderate plasticity.
FILL: Gravelly CLAY. Gray green (Gley2 6/5 BG). Moist. Medium dense. Very well graded. Angular gravel.
CL
CL
Soil
Sym
bol (
USG
S)
Wel
l Cas
ing/
Bor
ehol
e B
ackf
ill
Soil
Gra
phic
Dep
th (f
eet)
Rec
over
ed In
terv
alD
rive
Inte
rval
DP
Blo
ws
/ 6"
or P
ress
ure
(psi
)
Sam
ple
Num
ber
Sam
ple
Inte
rval
PID
(ppm
)
End of boring at 6 ft. bgs
DP

Boring: IR10SG075-4 Sheet 1 of 1Well Name: IR10SG075-4 Project # : 02-307.01
Location:Client:Logged By: E. Ehlers Drilling Co.: Precision SamplingDate Started: 5/19/2005 Drill Rig: Track Geoprobe G610Date Completed: 5/19/2005 Driller Name: Ernesto
(See Site Map) Date Backfilled: Drilling Method: Direct Push/HSABoring Diam.: 10" Sampler: 4 ft. Butyrate LinersGround Elev.: 14.16 Casing Mtrl/Size: 2" Sch. 40 PVCTOC Elev.: N/A Screen Mtrl/Size: 2" Sch. 40 PVCNorthing: 453394.6 Slot Size: 0.02
Sketch of Boring Location: Easting: 1460801 Sand Size: #3 Monterey
0
10.0
20.0
30.0
41.3
50.0
6
7
8
9
10
11
12
13
14
15
16
17
18
19
20
2 inches asphalt with 10 inches concrete
FILL: Gravelly CLAY. Gray green (Gley2 6/5 BG). Moist. Stiff. Low plasticity. Angular gravel.
Project Name:
Parcel B Hunters Point ShipyardU.S. Navy SW Div. Naval Facilities Engineering Command
Hunters Point Phase III Soil Vapor Extraction Treatability Study
Soil Description (from soil boring IR10SG075-6)
Surface Completion: Vapor monitoring well. Grout to surface with approximately 2 feet of Sch. 40 PVC casing extending from hole. Capped with Sch. 40 PVC slip cap and 1/4 inch PVC lab cock valve.
FILL: Gravelly CLAY. Dark brown (10YR 3/3). Moist. Medium dense. Some gravel over 2 inches diameter. Low to moderate plasticity.
FILL: Medium SAND, some gravel (5-10%). Dark brown (10YR 3/3). Moist. Loose. Poor to moderately graded.
CL
SP
Soil
Sym
bol (
USG
S)
Wel
l Cas
ing/
Bor
ehol
e B
ackf
ill
Soil
Gra
phic
Dep
th (f
eet)
Rec
over
ed In
terv
alD
rive
Inte
rval
DP
Blo
ws
/ 6"
or P
ress
ure
(psi
)
Sam
ple
Num
ber
Sam
ple
Inte
rval
PID
(ppm
)
DP
End of boring at 6 ft. bgs
CL

Boring: IR10SG075-6 Sheet 1 of 1Well Name: IR10SG075-6 Project # : 02-307.01
Location:Client:Logged By: E. Ehlers Drilling Co.: Precision SamplingDate Started: 5/19/2005 Drill Rig: Track Geoprobe G610Date Completed: 5/19/2005 Driller Name: Ernesto
(See Site Map) Date Backfilled: Drilling Method: Direct Push/HSABoring Diam.: 10" Sampler: 4 ft. Butyrate LinersGround Elev.: 14.14 Casing Mtrl/Size: 2" Sch. 40 PVCTOC Elev.: N/A Screen Mtrl/Size: 2" Sch. 40 PVCNorthing: 453395.6 Slot Size: 0.02
Sketch of Boring Location: Easting: 1460798 Sand Size: #3 Monterey
0
10.0
20.0
30.0
41.3
50.0
6
7
8
9
10
11
12
13
14
15
16
17
18
19
20
End of boring at 6 ft. bgs
SP
CL
Dep
th (f
eet)
Rec
over
ed In
terv
alD
rive
Inte
rval
DP
Blo
ws
/ 6"
or P
ress
ure
(psi
)
Sam
ple
Num
ber
Sam
ple
Inte
rval
PID
(ppm
)
DP
Soil
Sym
bol (
USG
S)
Wel
l Cas
ing/
Bor
ehol
e B
ackf
ill
Soil
Gra
phic
FILL: Gravelly CLAY. Dark brown (10YR 3/3). Moist. Medium dense. Some gravel over 2 inches diameter. Low to moderate plasticity.
FILL: Medium SAND, some gravel (5-10%). Dark brown (10YR 3/3). Moist. Loose. Poor to moderately graded.
CL
Project Name:
Parcel B Hunters Point ShipyardU.S. Navy SW Div. Naval Facilities Engineering Command
Hunters Point Phase III Soil Vapor Extraction Treatability Study
Soil Description
Surface Completion: Vapor monitoring well. Grout to surface with approximately 2 feet of Sch. 40 PVC casing extending from hole. Capped with Sch. 40 PVC slip cap and 1/4 inch PVC lab cock valve.
2 inches asphalt with 10 inches concrete
FILL: Gravelly CLAY. Gray green (Gley2 6/5 BG). Moist. Stiff. Low plasticity. Angular gravel.
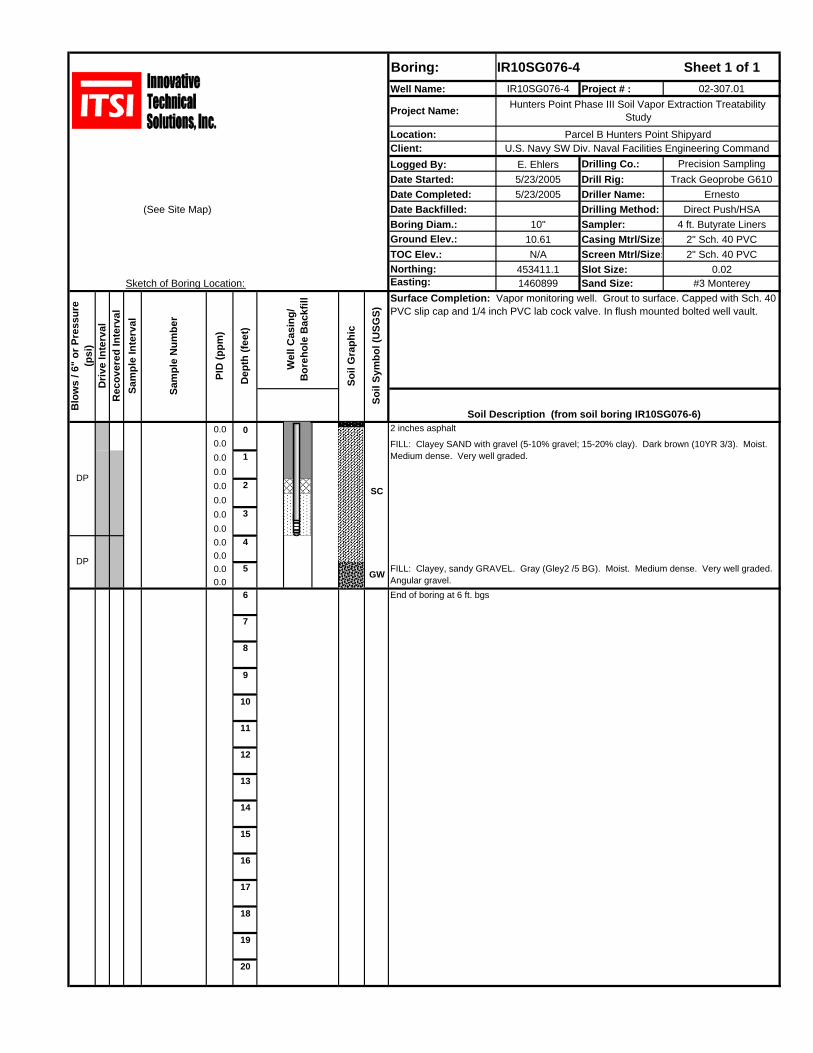
Boring: IR10SG076-4 Sheet 1 of 1Well Name: IR10SG076-4 Project # : 02-307.01
Location:Client:Logged By: E. Ehlers Drilling Co.: Precision SamplingDate Started: 5/23/2005 Drill Rig: Track Geoprobe G610Date Completed: 5/23/2005 Driller Name: Ernesto
(See Site Map) Date Backfilled: Drilling Method: Direct Push/HSABoring Diam.: 10" Sampler: 4 ft. Butyrate LinersGround Elev.: 10.61 Casing Mtrl/Size: 2" Sch. 40 PVCTOC Elev.: N/A Screen Mtrl/Size: 2" Sch. 40 PVCNorthing: 453411.1 Slot Size: 0.02
Sketch of Boring Location: Easting: 1460899 Sand Size: #3 Monterey
0.0 00.00.0 10.00.0 20.00.0 30.00.0 40.00.0 50.0
6
7
8
9
10
11
12
13
14
15
16
17
18
19
20
2 inches asphalt
FILL: Clayey, sandy GRAVEL. Gray (Gley2 /5 BG). Moist. Medium dense. Very well graded. Angular gravel.
Project Name:
Parcel B Hunters Point ShipyardU.S. Navy SW Div. Naval Facilities Engineering Command
Hunters Point Phase III Soil Vapor Extraction Treatability Study
GW
SC
FILL: Clayey SAND with gravel (5-10% gravel; 15-20% clay). Dark brown (10YR 3/3). Moist. Medium dense. Very well graded.
Soil
Sym
bol (
USG
S)
Wel
l Cas
ing/
Bor
ehol
e B
ackf
ill
Soil
Gra
phic
Soil Description (from soil boring IR10SG076-6)
Surface Completion: Vapor monitoring well. Grout to surface. Capped with Sch. 40 PVC slip cap and 1/4 inch PVC lab cock valve. In flush mounted bolted well vault.
Dep
th (f
eet)
Rec
over
ed In
terv
alD
rive
Inte
rval
DP
Blo
ws
/ 6"
or P
ress
ure
(psi
)
Sam
ple
Num
ber
Sam
ple
Inte
rval
PID
(ppm
)
End of boring at 6 ft. bgs
DP

Boring: IR10SG076-6 Sheet 1 of 1Well Name: IR10SG076-6 Project # : 02-307.01
Location:Client:Logged By: E. Ehlers Drilling Co.: Precision SamplingDate Started: 5/23/2005 Drill Rig: Track Geoprobe G610Date Completed: 5/23/2005 Driller Name: Ernesto
(See Site Map) Date Backfilled: Drilling Method: Direct Push/HSABoring Diam.: 10" Sampler: 4 ft. Butyrate LinersGround Elev.: 10.48 Casing Mtrl/Size: 2" Sch. 40 PVCTOC Elev.: N/A Screen Mtrl/Size: 2" Sch. 40 PVCNorthing: 453411.3 Slot Size: 0.02
Sketch of Boring Location: Easting: 1460901 Sand Size: #3 Monterey
0
0.0 10.00.0 20.00.0 30.00.0 40.00.0 50.0
6
7
8
9
10
11
12
13
14
15
16
17
18
19
20
End of boring at 6 ft. bgs
GW
SC
FILL: Clayey SAND with gravel (5-10% gravel; 15-20% clay). Dark brown (10YR 3/3). Moist. Medium dense. Very well graded.
Dep
th (f
eet)
Rec
over
ed In
terv
alD
rive
Inte
rval
DP
Blo
ws
/ 6"
or P
ress
ure
(psi
)
Sam
ple
Num
ber
Sam
ple
Inte
rval
PID
(ppm
)
DP
Soil
Sym
bol (
USG
S)
Wel
l Cas
ing/
Bor
ehol
e B
ackf
ill
Soil
Gra
phic
Soil Description
Surface Completion: Vapor monitoring well. Grout to surface. Capped with Sch. 40 PVC slip cap and 1/4 inch PVC lab cock valve. In flush mounted bolted well vault.
Project Name:
Parcel B Hunters Point ShipyardU.S. Navy SW Div. Naval Facilities Engineering Command
Hunters Point Phase III Soil Vapor Extraction Treatability Study
2 inches asphalt
FILL: Clayey, sandy GRAVEL. Gray (Gley2 /5 BG). Moist. Medium dense. Very well graded. Angular gravel.

Boring: IR10SG077-4 Sheet 1 of 1Well Name: IR10SG077-4 Project # : 02-307.01
Location:Client:Logged By: E. Ehlers Drilling Co.: Precision SamplingDate Started: 5/18/2005 Drill Rig: Track Geoprobe G610Date Completed: 5/18/2005 Driller Name: Ernesto
(See Site Map) Date Backfilled: Drilling Method: Direct Push/HSABoring Diam.: 10" Sampler: 4 ft. Butyrate LinersGround Elev.: 14.20 Casing Mtrl/Size: 2" Sch. 40 PVCTOC Elev.: N/A Screen Mtrl/Size: 2" Sch. 40 PVCNorthing: 453334.1 Slot Size: 0.02
Sketch of Boring Location: Easting: 1460869 Sand Size: #3 Monterey
0.0 00.00.0 10.00.0 20.00.0 30.00.0 40.00.0 50.0
6
7
8
9
10
11
12
13
14
15
16
17
18
19
20
12 inches concrete
Project Name:
Parcel B Hunters Point ShipyardU.S. Navy SW Div. Naval Facilities Engineering Command
Hunters Point Phase III Soil Vapor Extraction Treatability Study
Soil Description (from soil boring IR10SG077-6)
Surface Completion: Vapor monitoring well. Grout to surface with approximately 2 feet of Sch. 40 PVC casing extending from hole. Capped with Sch. 40 PVC slip cap and 1/4 inch PVC lab cock valve.
FILL: Gravelly SAND (10-15% gravel). Dark brown (10YR 3/3). Moist. Loose to medium dense. Well graded. Angular gravel with some gravel over 2 inches diameter.
FILL: Gravelly CLAY. Gray green (Gley2 6/5 BG). Moist. Stiff. Low plasticity. Weathered serpentinite.
Soil
Sym
bol (
USG
S)
Wel
l Cas
ing/
Bor
ehol
e B
ackf
ill
Soil
Gra
phic
Dep
th (f
eet)
Rec
over
ed In
terv
alD
rive
Inte
rval
DP
Blo
ws
/ 6"
or P
ress
ure
(psi
)
Sam
ple
Num
ber
Sam
ple
Inte
rval
PID
(ppm
)
DP
End of boring at 6 ft. bgs
SW
CL

Boring: IR10SG077-6 Sheet 1 of 1Well Name: IR10SG077-6 Project # : 02-307.01
Location:Client:Logged By: E. Ehlers Drilling Co.: Precision SamplingDate Started: 5/18/2005 Drill Rig: Track Geoprobe G610Date Completed: 5/18/2005 Driller Name: Ernesto
(See Site Map) Date Backfilled: Drilling Method: Direct Push/HSABoring Diam.: 10" Sampler: 4 ft. Butyrate LinersGround Elev.: 14.15 Casing Mtrl/Size: 2" Sch. 40 PVCTOC Elev.: N/A Screen Mtrl/Size: 2" Sch. 40 PVCNorthing: 453334.2 Slot Size: 0.02
Sketch of Boring Location: Easting: 1460871 Sand Size: #3 Monterey
0
10.0
20.0
30.0
40.0
50.0
6
7
8
9
10
11
12
13
14
15
16
17
18
19
20
End of boring at 6 ft. bgs
DP
Dep
th (f
eet)
Rec
over
ed In
terv
alD
rive
Inte
rval
DP
Blo
ws
/ 6"
or P
ress
ure
(psi
)
Sam
ple
Num
ber
Sam
ple
Inte
rval
PID
(ppm
)
Soil
Sym
bol (
USG
S)
Wel
l Cas
ing/
Bor
ehol
e B
ackf
ill
Soil
Gra
phic
FILL: Gravelly SAND (10-15% gravel). Dark brown (10YR 3/3). Moist. Loose to medium dense. Well graded. Angular gravel with some gravel over 2 inches diameter.
FILL: Gravelly CLAY. Gray green (Gley2 6/5 BG). Moist. Stiff. Low plasticity. Weathered serpentinite.
SW
CL
Project Name:
Parcel B Hunters Point ShipyardU.S. Navy SW Div. Naval Facilities Engineering Command
Hunters Point Phase III Soil Vapor Extraction Treatability Study
Soil Description
Surface Completion: Vapor monitoring well. Grout to surface with approximately 2 feet of Sch. 40 PVC casing extending from hole. Capped with Sch. 40 PVC slip cap and 1/4 inch PVC lab cock valve.
12 inches concrete

APPENDIX C LABORATORY ANALYTICAL REPORTS AND COC RECORDS


