sites of cone system sensitivity loss in retinitis pigmentosa
TRANSCRIPT
Sites of Cone System Sensitivity Lossin Retinitis Pigmentosa
William H. Seiple, Karen Holopigian, Vivienne C. Greenstein, and Donald C. Hood*
Purpose. To examine the sites of cone sensitivity loss in patients with retinitis pigmentosa bycomparing focal electroretinographic and psychophysical modulation thresholds.
Methods. Both psychophysical and electrophysiologic increment threshold curves were ob-tained in retinitis pigmentosa patients and a group of age-matched, normally-sighted adults.
Results. The majority of the retinitis pigmentosa data could be accounted for by a verticaldisplacement of the normal curve. The retinitis pigmentosa patients showed similar patterns ofcone sensitivity losses using both techniques.
Conclusions. The combined electrophysiologic and psychophysical results provide support foran outer retina locus for these cone sensitivity losses. The data suggest that these deficits maybe caused by a spatially independent loss of cone photoreceptors with normal adaptationproperties in the remaining photoreceptors. Invest Ophthalmol Vis Sci 1993;34:2638-2645.
JL here are reports in the psychophysical literaturethat cone system sensitivity is decreased in some pa-tients with retinitis pigmentosa (RP).1'2 The sites andmechanisms of these sensitivity losses, however, re-main unclear. Although this group of hereditary de-generative retinal diseases primarily affects the pho-toreceptors, postreceptoral contributions to these def-icits have also been suggested.34 One approach towardidentifying the retinal sites of cone sensitivity loss inRP is to compare the results of psychophysical andelectrophysiologic techniques. In the current experi-ment, the changes in focal electroretinogram (FERG)thresholds for high temporal frequency stimuli (>20Hz) caused by RP were compared to the changes inpsychophysically elicited thresholds for the same stim-uli. The FERG thresholds provide an assay of outer
From, the Department of Ophthalmology, New York University Medical Center andand * Psychology Department, Columbia University, New York, New York.This xuorh was partially supported by a grant from RP Fighting Blindness and byan unrestricted grant from Research to Prevent Blindness, Inc. to the Departmentof Ophthalmology, NYU Medical, Center.Submitted for publication: August 10, 1992; accepted February 17, 1993.Proprietary interest category: N.Reprint requests: William Seiple, Department of Ophthalmology, BEL5N15, NYUMedical Center, 550 First Ave, New York, NY 10016.
retinal functioning5 and the psychophysical thresholdsprovide an assay of both receptor and postreceptorintegrity.
The various mechanisms that have been proposedto account for sensitivity losses in RP patients will notnecessarily have the same effect on these two mea-sures. Differential effects on FERG and psychophysi-cal thresholds might be expected even if the deficit isacting at the level of the receptors. For example, a lossof perifoveal cones and a subsequent reduction of thevisual field area might be expected to have a largeeffect on the FERG, but no effect on psychophysicalthresholds if they are foveally determined. Therefore,a comparison between the changes in electrophysio-logic and psychophysical thresholds provides a power-ful tool for examining hypotheses about the sites andmechanisms of sensitivity loss.
In this study, the sites of cone system sensitivityloss in RP patients were examined by comparing elec-trophysiologic and psychophysical increment thresh-olds obtained under the same stimulus conditions. Ifthe sites of cone sensitivity losses are at the level of theouter retina, then both FERG and psychophysicalthresholds should be increased. Deficits at postrecep-
2638Investigative Ophthalmology & Visual Science, August 1993, Vol. 34, No. 9Copyright © Association for Research in Vision and Ophthalmology
Downloaded From: http://iovs.arvojournals.org/pdfaccess.ashx?url=/data/journals/iovs/933175/ on 03/31/2018

Cone System Loss in RP 2639
toral sites should produce elevated psychophysicalthresholds, but normal FERG thresholds.
METHODS
Subjects
Eleven patients with RP participated in this study(mean age = 37 years). All had nondetectable standardfull-field electroretinograms (both photopic and sco-topic), central visual fields of at least 10 degrees (asmeasured on a Goldmann perimeter with a III/4ewhite target) and corrected visual acuities of 20/40 orbetter (see Table 1 for clinical characteristics). The pa-tients had no significant media or lens opacities, andhad no evidence of macular edema on fluorescein angi-ography. Data were also collected on nine control ob-servers with corrected visual acuity of 20/20 or betterand normal ophthalmologic examinations (mean age= 32 years). All subjects gave informed consent to par-ticipate in this study; the research followed the tenetsof the Declaration of Helsinki and was approved by theNew York University Human Subjects Committee.
Stimulus
The stimulus was a diffused array of red light-emittingdiodes (peak wavelength 660 nm) subtending 9 de-grees.6 The array was located at the center of an illumi-nated (white) ganzfeld bowl and the light-emittingdiodes were sinusoidally modulated.* For each adapt-ing level, the mean luminance of the light-emittingdiode array and the illuminated background were ad-justed to be equal using the photopic filter setting of aSpectraspot photometer (Photo Research Co., Bur-bank, CA).
FERG Recording
Monocular FERGs were recorded using a gold-foilelectrode referenced to the ipsilateral ear. The contra-lateral ear served as ground. The data were amplified
* There is a nonlinear relationship between voltage input andlight output of light-emitting diodes. A consequence of this nonlin-earity is that symmetrical modulations of voltage around a meanvoltage level will produce asymmetrical modulations of light outputaround the mean light level. That is, a voltage deviation above themean will produce a larger increase in light output than the de-crease in light output produced by an equal voltage deviation belowthe mean. This would result in a small increase in the mean adapta-tion level which would be greatest for large modulations around lowmean levels. For example, at 100% modulation around a mean levelof 2.0 log td the increase in the mean adaptation level would be 0.1log td. However, because we are measuring threshold performance,the change in mean adaptation level would be much less than thatobserved using 100% modulation. For example, at 2.0 log td meanadaptation level, FERG thresholds for the control subjects averaged27% modulation. At this threshold modulation, the error in calcu-lating the mean adapting level is only 0.02 log td. At the highermean levels (3.5 and 4.0 log td), light output was linearly related tovoltage; therefore, light modulation was symmetrical and there wasno change in mean adaptation level.
TABLE l. RP Patient Characteristics
No.
123456789
1011
Age
4724363020304039294339
Acuity
20/20-20/3020/2020/2520/20-20/30+20/4020/30-20/1520/2020/20-
VisualField
10-15>30>3010-20>30>3010-15
10>30
1020
Mode
Usher'sISOARISOUsher'sARISOISOISOISOAR
ISO, isolated. AR, autosomal recessive.
(Gain = 10K) and band-pass filtered between 1 and100 Hz.
Electrophysiologic Threshold Retrieval
A swept-stimulus, lock-in amplifier retrieval methodwas used to estimate FERG thresholds.57 FERG am-plitudes were quantified in real time as stimulus modu-lation was changed from subthreshold (0.01%) to su-prathreshold (100%). FERG modulation thresholdswere then obtained by extrapolating these amplitudeversus modulation functions to the zero responselevel.
Procedure
Threshold data were collected at six levels of retinalilluminance, from 1.5 to 4.0 log trolands (td). Beforetesting, the subject's pupil was dilated with 1% tropi-camide (Mydriacyl, Alcon, Ft. Worth, TX) and 2.5%phenylephrine (Mydfrin, Alcon). The eye was darkadapted for 45 minutes and then light adapted to thelowest mean level of adaptation (1.5 log td for both thestimulus and the background) for 2 minutes. The sub-ject's psychophysical thresholds for flicker detectionwere measured at temporal frequencies between 20and 50 Hz. The modulation depth of the stimulus wasslowly increased from below threshold until the sub-ject reported seeing flicker. Four estimates of flickerthreshold were averaged for each stimulus condition.After this, FERG thresholds for only the 30-Hz flickerrate were recorded. FERG amplitude was measuredcontinuously as stimulus modulation depth variedfrom 0.01% to 100% during a 20-second period.Three thresholds were obtained for each adaptinglevel. The mean luminance of both the test stimulusand background were then increased to the nextadapting level. The subject was light adapted to thenew level for 2 minutes and psychophysical and FERGthresholds were again obtained. This procedure wasrepeated for all six adapting levels.
Downloaded From: http://iovs.arvojournals.org/pdfaccess.ashx?url=/data/journals/iovs/933175/ on 03/31/2018
2640 Investigative Ophthalmology & Visual Science, August 1993, Vol. 34, No. 9
RESULTS
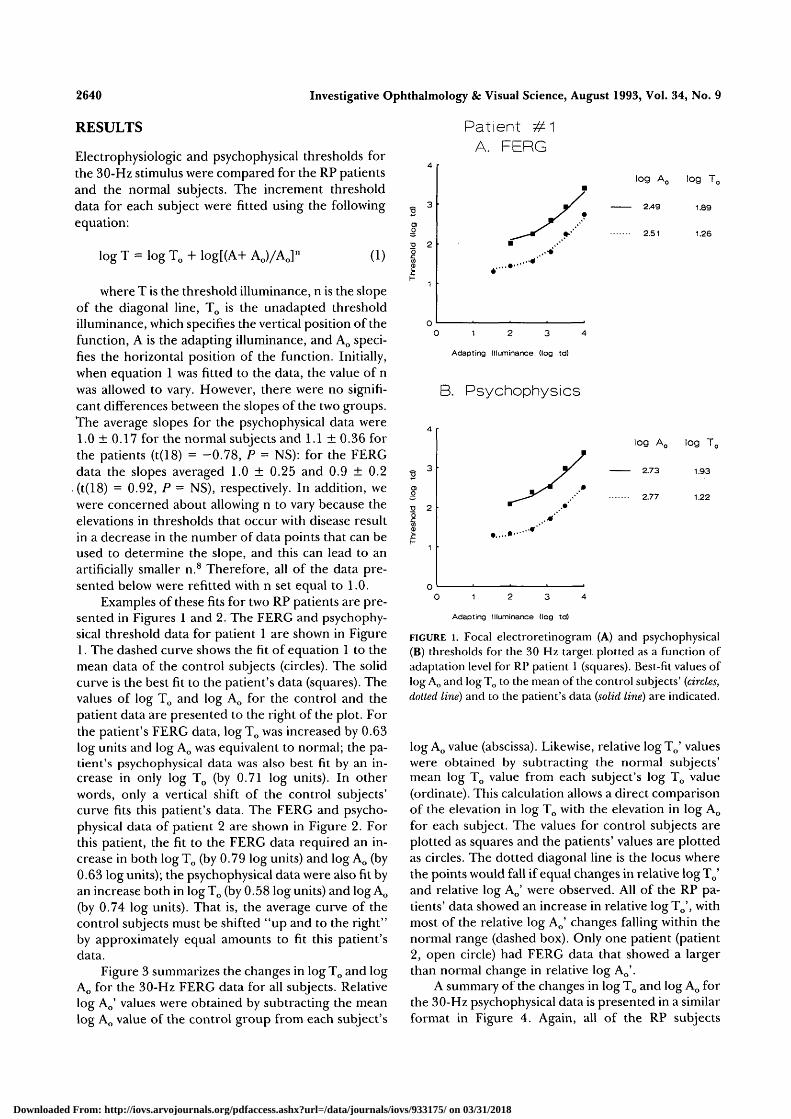
Electrophysiologic and psychophysical thresholds forthe 30-Hz stimulus were compared for the RP patientsand the normal subjects. The increment thresholddata for each subject were fitted using the followingequation:
Patient #1A. FERG
log T = log To + log[(A+ Ao)/Ao]n
(1)
where T is the threshold illuminance, n is the slopeof the diagonal line, To is the unadapted thresholdilluminance, which specifies the vertical position of thefunction, A is the adapting illuminance, and Ao speci-fies the horizontal position of the function. Initially,when equation 1 was fitted to the data, the value of nwas allowed to vary. However, there were no signifi-cant differences between the slopes of the two groups.The average slopes for the psychophysical data were1.0 ± 0.17 for the normal subjects and 1.1 ± 0.36 forthe patients (t(18) = -0.78, P = NS): for the FERGdata the slopes averaged 1.0 ± 0.25 and 0.9 ± 0.2(t(18) = 0.92, P = NS), respectively. In addition, wewere concerned about allowing n to vary because theelevations in thresholds that occur with disease resultin a decrease in the number of data points that can beused to determine the slope, and this can lead to anartificially smaller n.8 Therefore, all of the data pre-sented below were refitted with n set equal to 1.0.
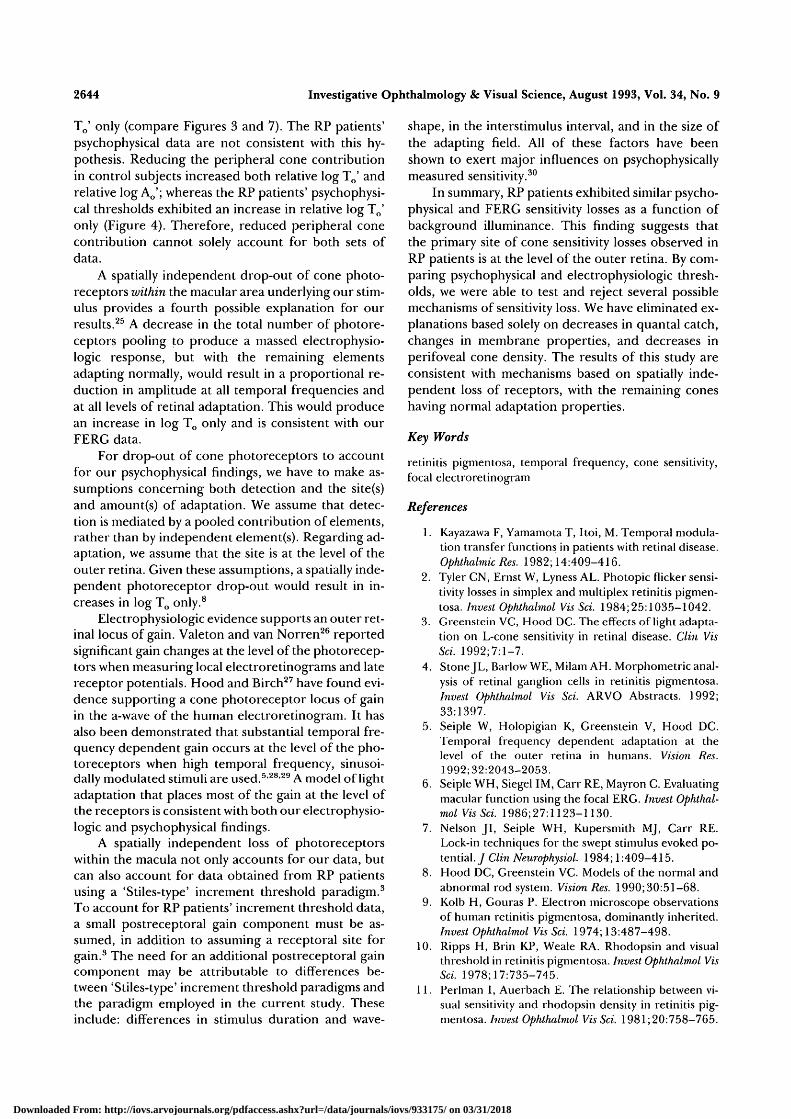
Examples of these fits for two RP patients are pre-sented in Figures 1 and 2. The FERG and psychophy-sical threshold data for patient 1 are shown in Figure1. The dashed curve shows the fit of equation 1 to themean data of the control subjects (circles). The solidcurve is the best fit to the patient's data (squares). Thevalues of log To and log Ao for the control and thepatient data are presented to the right of the plot. Forthe patient's FERG data, log To was increased by 0.63log units and log Ao was equivalent to normal; the pa-tient's psychophysical data was also best fit by an in-crease in only log To (by 0.71 log units). In otherwords, only a vertical shift of the control subjects'curve fits this patient's data. The FERG and psycho-physical data of patient 2 are shown in Figure 2. Forthis patient, the fit to the FERG data required an in-crease in both log To (by 0.79 log units) and log Ao (by0.63 log units); the psychophysical data were also fit byan increase both in log To (by 0.58 log units) and log Ao
(by 0.74 log units). That is, the average curve of thecontrol subjects must be shifted "up and to the right"by approximately equal amounts to fit this patient'sdata.
Figure 3 summarizes the changes in log To and logAo for the 30-Hz FERG data for all subjects. Relativelog Ao' values were obtained by subtracting the meanlog Ao value of the control group from each subject's
•o 2
log Ao log To
2.49 1.89
2.51 1.26
0 1 2 3 4
Adapting Illuminance (log td)
B. Psychophysics
•a 2
log Ao log Tc
2.73 1.93
2.77 1.22
Adapting Illuminance (log td)
FIGURE l. Focal electroretinogram (A) and psychophysical(B) thresholds for the 30 Hz target plotted as a function ofadaptation level for RP patient 1 (squares). Best-fit values oflog Ao and log To to the mean of the control subjects' (circles,dotted line) and to the patient's data (solid line) are indicated.
log Ao value (abscissa). Likewise, relative logTo' valueswere obtained by subtracting the normal subjects'mean log To value from each subject's log To value(ordinate). This calculation allows a direct comparisonof the elevation in log To with the elevation in log Ao
for each subject. The values for control subjects areplotted as squares and the patients' values are plottedas circles. The dotted diagonal line is the locus wherethe points would fall if equal changes in relative logT0'and relative log Ao' were observed. All of the RP pa-tients' data showed an increase in relative log To', withmost of the relative log Ao' changes falling within thenormal range (dashed box). Only one patient (patient2, open circle) had FERG data that showed a largerthan normal change in relative log Ao'.
A summary of the changes in log To and log Ao forthe 30-Hz psychophysical data is presented in a similarformat in Figure 4. Again, all of the RP subjects
Downloaded From: http://iovs.arvojournals.org/pdfaccess.ashx?url=/data/journals/iovs/933175/ on 03/31/2018

Cone System Loss in RP 2641
Patient #2A. FERG
2 2
log Ao log To
3.14 2.05
2.51 1.26
0 1 2 3 4
Adapting Illuminance flog td)
B. Psychophysics
2 2
0)
log Ao log Tc
3.51 1.80
2.77 1.22
Adapting Illuminance (log td)
FIGURE 2. Focal electroretinogram (A) and psychophysical(B) thresholds for the 30 Hz target plotted as a function ofadaptation level for RP patient 2 (squares). Best-fit values oflog Ao and log To to the mean of the control subjects' (circles,dotted line) and to the patient's data (solid line) are indicated.
showed increases beyond the normal range in relativelog To', and most had normal relative log Ao' values.Patient 2 (open circle), however, showed a relativelyequivalent increase in both relative log To' and relativelog Ao\ similar to his FERG data.
DISCUSSION
Although RP is primarily a disease of the photorecep-tors and retinal pigment epithelium, evidence hasbeen presented that implicates postreceptoral deficitsas well.3'4 In this study, we compared focal electroreti-nographic and psychophysical temporal modulationthresholds as a function of adaptation level to investi-gate sites and mechanisms of central cone sensitivitylosses in patients with RP. The sensitivity losses weobserved in both the electrophysiologic and psycho-physical data were qualitatively similar. Because the
FERG thresholds provide an assay of outer retinalfunction,5 the similarity between the two sets of resultssuggests a receptoral locus for these sensitivity defi-cits. Several possible mechanisms could result in sensi-tivity losses at the level of the photoreceptors.
For example, it has been proposed that sensitivitylosses in RP patients may be caused by a loss of photo-pigment or misalignment of photoreceptors9"13. A re-duction of photopigment density would result in a de-crease in quantal catch and would therefore decreasethe effective intensity of both the stimulus and thebackground, similar to placing a neutral density filterin front of the eye. This multiplicative scaling of inten-sity would lead to the increment threshold curves be-ing shifted "up and over" (i.e., the increase in log To
would equal the increase in log Ao) so that sensitivitylosses would be greatest at lower background levelsand the data would approach normal values at thehigher levels.31416
To demonstrate the effects of decreased quantalcatch and to determine whether the data collectedwith our procedure are consistent with a decreasedquantal catch hypothesis, we compared 30-Hz FERGand psychophysical thresholds with and without a 0.5
Psychophysics
i-
o
+JO0
DC
1.00
0.75
0.50
0.25
0.00
-0.25
-0.50
a
L a 1
-0.50 0.00 0.50 1.00
Relative Log Ac
FIGURE 3. The mean log To fit to the control subjects' FERGdata is subtracted from the log To value fit to each subject'sdata. These data are plotted against the difference betweeneach patient's log Ao and the log Ao value fit to the mean ofthe control subjects' data. The individual differences for thecontrol subjects are plotted as squares and the patients' dataplotted as circles. The dotted box encloses the control sub-jects' data and the dashed diagonal line is the locus of pointsfor equal changes in relative log To' and relative log Ao'.
Downloaded From: http://iovs.arvojournals.org/pdfaccess.ashx?url=/data/journals/iovs/933175/ on 03/31/2018

2642 Investigative Ophthalmology & Visual Science, August 1993, Vol. 34, No. 9
FERG
1.00
• o\-
:ive
Log
Rela
i
0.75
0.50
0.25
0.00
-0.25
-0.50-0.50 0.00 0.50 1.00
Relative Log Ac
FIGURE 4. The mean log To fit to the control subjects' psy-chophysical data is subtracted from the log To value fit toeach subject's data. These data are plotted against the differ-ence between each patient's log Ao and the log Ao value fit tothe mean of the control subjects' data. The individual differ-ences for the control subjects are plotted as squares and thepatients' data plotted as circles. The dotted box encloses thecontrol subjects' data and the dotted diagonal line is thelocus where the points would fall if equal changes in relativelog To' and relative log Ao' were observed.
neutral density filter (Model 50962, Oriel Corpora-tion, Stratford CT) in four control subjects. Thefilter's attenuation was flat over the wavelengths em-ployed in this study. The results of this experiment arepresented in Figure 5. Relative log Ao' values werederived by subtracting each subject's log Ao value fromtheir log Ao value obtained with the filter. Similarly,the relative log To' values were calculated by subtract-ing each subject's log To from the log To obtained withthe filter. This yielded a measure of the change in logAo and log To caused by the neutral density filter. Theneutral density filter resulted in relatively equivalentincreases in log To and log Ao for both the electrophysi-ologic and psychophysical measures. The data fromonly one RP patient (patient 2) are consistent with thisreduced 'quantal catch' hypothesis (Figs. 3, 4). For theremaining ten patients, relative log To' was increasedand relative log Ao' was unchanged. The patients' data,therefore, are not consistent with a decrease in quan-tum catch of the functioning cones. Greenstein andHood315 also found that a decrease in quantal catchdid not account for the psychophysical threshold
losses observed in a group of RP patients. In addition,Kilbride et al17, using a densitometric technique, wereunable to account for their RP results based on aquantal catch hypothesis.
A second hypothesis for sensitivity losses in RPpatients is a change in the photoreceptor membraneproperties, which may delay reestablishment of equilib-rium.1819 We previously demonstrated that the phaseof the FERG as a function of temporal frequency inRP patients is normal despite large losses in respon-siveness.6 In addition, RP patients' electroretino-graphic implicit times were found to be within the nor-mal range, although recovery times were prolonged.18
A delayed recovery should reduce response amplitudein proportion to temporal frequency, independent ofthe level of retinal illuminance. This would cause thedifference between the log To values for the RP pa-tients and the normal subjects to increase with tem-poral frequency. To examine this, we compared thepsychophysical data of the two groups as a function oftemporal frequency (Figure 6). These data are notconsistent with the above hypothesis. The differencesbetween log Tos of the averaged data for the controlsubjects and the patients are relatively constant withtemporal frequency.
Reductions in psychophysical sensitivity observedin RP patients have also been attributed to a loss of
0.5 Neutral Density Filter
1.00
0.75
0.50
0.25
0.00
PP
XT /T / '
FERG
-0.25
-0.50-0.50-0.25 0.00 0.25 0.50 0.75 1.00
Relative Log Ao
FIGURE 5. The log To value fit to the threshold data collectedwithout a neutral density filter have been subtracted fromlog To value fit to the subject's data collected with a 0.5neutral density filter. The same was done for the log Ao val-ues. The average of four control subjects' log To difference(± 1 SD) is plotted against the average log Ao difference (± 1SD) (circle = FERG; square = psychophysical).
Downloaded From: http://iovs.arvojournals.org/pdfaccess.ashx?url=/data/journals/iovs/933175/ on 03/31/2018

Cone System Loss in RP
A. Log Ao
4.0 r
3.0
.2.0
1.0
0.0
— Normals
-- Patients
10 20 30 40
Temporal Frequency (Hz)
B. Log Tn
50
3.5
2.6
1.7
-0.1
-1.010 2 0 3 0 4 0 5 0
Temporal Frequency (Hz)
FIGURE 6. Averaged (± 1 SD) log Ao (A) and log To (B) valuesobtained by fitting equation 1 to the control subjects' (cir-cles) and patients' (square) psychophysical thresholds as afunction of temporal frequency.
cone photoreceptors. Two patterns have been ob-served: a loss of the perifoveal cone photoreceptorswith a relative sparing of the central cones, and a spa-tially independent loss of photoreceptors throughoutthe macular area.9-20"22
A third testable hypothesis, a loss of perifovealphotoreceptors, was mimicked by recording modula-tion thresholds in response to a smaller diameter stim-ulus. The use of a smaller diameter stimulus reducesthe contributions of perifoveal cone photoreceptorswhile retaining the contribution from intact centralphotoreceptors. Thresholds for a 10-degree stimuluswere compared to thresholds for a 2-degree stimulusin four control subjects. The results of this experimentare presented in Figure 7. Relative log Ao' and relativelog To' values were calculated by subtracting the valueobtained with the larger target from the correspond-
2643
ing value obtained with the smaller target. Becausethere have been some questions concerning changesin the slopes of these functions with decreasing targetsize, our data were initially fitted allowing the slope ofequation 1 (n) to vary. The average slopes for the psy-chophysical data were 1.0 ± 0.2 for the large targetand 1.0 ± 0.2 for the small target (t(6) = 0.0, P = NS).For the FERG data the average slopes were 0.9 ± 0.2and 1.0 ± 0.2, respectively (t(6) = -0.40, P = NS).Because there were no statistically significant differ-ences, the data were refitted with n = 1.0. For thepsychophysical data, reducing the stimulus area re-sulted in an increase in both relative log To' and rela-tive log Ao'. These psychophysical data agree with pre-vious reports of psychophysical sensitivity changes as afunction of target size.23'24 For the FERG data, relativelog To' also increased for the smaller stimulus; how-ever, the value of relative log Ao' did not change. TheRP patients' FERG sensitivity losses are consistentwith the results observed in control subjects when thecontributions of perifoveal photoreceptors was re-duced; that is, both showed an increase in relative log
10° vs 2° Target
1.00
0.75
o
_roCD
DC
FERG
<
//
//
///
T /
PP/
0.50
0.25
0.00
-0.25
-0.50
-0.50-0.25 0.00 0.25 0.50 0.75 1.00
Relative Log Ao
FIGURE 7. The log To fit to the threshold data from a 10-de-gree target have been subtracted from log To fit to the sub-ject's data collected with a 2-degree target. These data areplotted against the difference in the log Ao with the 10 de-gree target subtracted from the log Ao obtained for the 2-de-gree target. The points plotted are the average differences(± 1 SD) for the psychophysical (square) and FERG (circle)for four control subjects. The dotted diagonal line is thelocus where the points would fall if equal changes in relativelog To' and relative log Ao' were observed.
Downloaded From: http://iovs.arvojournals.org/pdfaccess.ashx?url=/data/journals/iovs/933175/ on 03/31/2018
2644 Investigative Ophthalmology & Visual Science, August 1993, Vol. 34, No. 9
To' only (compare Figures 3 and 7). The RP patients'psychophysical data are not consistent with this hy-pothesis. Reducing the peripheral cone contributionin control subjects increased both relative log To' andrelative log Ao'; whereas the RP patients' psychophysi-cal thresholds exhibited an increase in relative log To'only (Figure 4). Therefore, reduced peripheral conecontribution cannot solely account for both sets ofdata.
A spatially independent drop-out of cone photo-receptors within the macular area underlying our stim-ulus provides a fourth possible explanation for ourresults.25 A decrease in the total number of photore-ceptors pooling to produce a massed electrophysio-logic response, but with the remaining elementsadapting normally, would result in a proportional re-duction in amplitude at all temporal frequencies andat all levels of retinal adaptation. This would producean increase in log To only and is consistent with ourFERG data.
For drop-out of cone photoreceptors to accountfor our psychophysical findings, we have to make as-sumptions concerning both detection and the site(s)and amount(s) of adaptation. We assume that detec-tion is mediated by a pooled contribution of elements,rather than by independent element(s). Regarding ad-aptation, we assume that the site is at the level of theouter retina. Given these assumptions, a spatially inde-pendent photoreceptor drop-out would result in in-creases in log To only.8
Electrophysiologic evidence supports an outer ret-inal locus of gain. Valeton and van Norren26 reportedsignificant gain changes at the level of the photorecep-tors when measuring local electroretinograms and latereceptor potentials. Hood and Birch27 have found evi-dence supporting a cone photoreceptor locus of gainin the a-wave of the human electroretinogram. It hasalso been demonstrated that substantial temporal fre-quency dependent gain occurs at the level of the pho-toreceptors when high temporal frequency, sinusoi-dally modulated stimuli are used.528'29 A model of lightadaptation that places most of the gain at the level ofthe receptors is consistent with both our electrophysio-logic and psychophysical findings.
A spatially independent loss of photoreceptorswithin the macula not only accounts for our data, butcan also account for data obtained from RP patientsusing a 'Stiles-type' increment threshold paradigm.3
To account for RP patients' increment threshold data,a small postreceptoral gain component must be as-sumed, in addition to assuming a receptoral site forgain.3 The need for an additional postreceptoral gaincomponent may be attributable to differences be-tween 'Stiles-type' increment threshold paradigms andthe paradigm employed in the current study. Theseinclude: differences in stimulus duration and wave-
shape, in the interstimulus interval, and in the size ofthe adapting field. All of these factors have beenshown to exert major influences on psychophysicallymeasured sensitivity.30
In summary, RP patients exhibited similar psycho-physical and FERG sensitivity losses as a function ofbackground illuminance. This finding suggests thatthe primary site of cone sensitivity losses observed inRP patients is at the level of the outer retina. By com-paring psychophysical and electrophysiologic thresh-olds, we were able to test and reject several possiblemechanisms of sensitivity loss. We have eliminated ex-planations based solely on decreases in quantal catch,changes in membrane properties, and decreases inperifoveal cone density. The results of this study areconsistent with mechanisms based on spatially inde-pendent loss of receptors, with the remaining coneshaving normal adaptation properties.
Key Words
retinitis pigmentosa, temporal frequency, cone sensitivity,focal electroretinogram
References
1. Kayazawa F, Yamamota T, Itoi, M. Temporal modula-tion transfer functions in patients with retinal disease.Ophthalmic Res. 1982; 14:409-416.
2. Tyler CN, Ernst W, Lyness AL. Photopic flicker sensi-tivity losses in simplex and multiplex retinitis pigmen-tosa. Invest Ophthalmol Vis Sci. 1984; 25:1035-1042.
3. Greenstein VC, Hood DC. The effects of light adapta-tion on L-cone sensitivity in retinal disease. Clin VisSci. 1992;7:l-7.
4. Stone JL, Barlow WE, Milam AH. Morphometric anal-ysis of retinal ganglion cells in retinitis pigmentosa.Invest Ophthalmol Vis Sci. ARVO Abstracts. 1992;33:1397.
5. Seiple W, Holopigian K, Greenstein V, Hood DC.Temporal frequency dependent adaptation at thelevel of the outer retina in humans. Vision Res.1992;32:2043-2053.
6. Seiple WH, Siegel IM, Carr RE, Mayron C. Evaluatingmacular function using the focal ERG. Invest Ophthal-mol Vis Sci. 1986;27:1123-1130.
7. Nelson JI, Seiple WH, Kupersmith MJ, Carr RE.Lock-in techniques for the swept stimulus evoked po-tential. J Clin Neurophysiol. 1984; 1:409-415.
8. Hood DC, Greenstein VC. Models of the normal andabnormal rod system. Vision Res. 1990; 30:51-68.
9. Kolb H, Gouras P. Electron microscope observationsof human retinitis pigmentosa, dominantly inherited.Invest Ophthalmol Vis Sci. 1974; 13:487-498.
10. Ripps H, Brin KP, Weale RA. Rhodopsin and visualthreshold in retinitis pigmentosa. Invest Ophthalmol VisSci. 1978; 17:735-745.
11. Perlman I, Auerbach E. The relationship between vi-sual sensitivity and rhodopsin density in retinitis pig-mentosa. Invest Ophthalmol Vis Sci. 1981;20:758-765.
Downloaded From: http://iovs.arvojournals.org/pdfaccess.ashx?url=/data/journals/iovs/933175/ on 03/31/2018

Cone System Loss in RP 2645
12. van Meel GJ, van Norren D. Foveal densitometry inRP. Invest Ophthalmol Vis Sci. 1983;24:1123-1130.
13. Gouras P, MacKay CJ. Light adaptation of the electro-retinogram: Diminished in retinitis pigmentosa. InvestOphthalmol Vis Sci. 1989;30:619-624.
14. Hood DC, Greenstein VC. An approach to testing al-ternative hypotheses of changes in visual sensitivitydue to retinal disease. Invest Ophthalmol Vis Sci.1982;23:96-101.
15. Greenstein VC, Hood DC. Test of decreased respon-siveness hypothesis in retinitis pigmentosa. AmerJ Op-tom Physiol Optics. 1986;63:22-27.
16. Hood DC. Testing hypotheses about developmentwith electroretinographic and incremental-thresholdddU.JOpt Soc Am. 1988; 5:2159-2165.
17. Kilbride PE, Fishman M, Fishman GA, Hutman LP.Foveal cone pigment density difference and reflec-tance in retinitis pigmentosa. Arch Ophthalmol.1986; 104:220-224.
18. Seiple W, Greenstein V, Carr R. Temporal sensitivitylosses in heredoretinal disease: Tests of hypotheses. BrJ Ophthalmol. 1989; 73:440-447.
19. Dagnelie G, Massof RW. Foveal cone involvement inretinitis pigmentosa progression assessed throughllash-on-flash parameters. Invest Ophthalmol Vis Sci.1993;34:231-242.
20. Flannery JG, Faber DB, Bird AC, Bok D. Degenerativechanges in a retina affected with autosomal dominantretinitis pigmentosa. Invest Ophthalmol Vis Sci.1989;30:191-211.
21. Szamier RB, Berson EL. Retinal ultrastructure in ad-
vanced retinitis pigmentosa. Invest Ophthalmol Vis Sci.1977; 16:947-962.
22. Szamier RB, Berson EL, Klein R, Meyers S. Sex-linkedretinitis pigmentosa: Ultrastructure of photorecep-tors and pigment epithelium. Invest Ophthalmol Vis Sci.1979;18:145-160.
23. Barlow HG. Dark and light adaptation: psychophysics.In: Jameson D, Hurvich LM, eds. The Handbook of Sen-sory Physiology, Vol 7. Berlin: Springer-Verlag; 1972.
24. Chen B, MacLeod DIA, Stockman A. Improvement inhuman vision under bright light: grain or gain?y Phys-iol. 1987;394:41-66.
25. Sandberg MA, Berson EL. Visual acuity and cone spa-tial density in retinitis pigmentosa. Invest OphthalmolVis Sci. 1983;24:1511-1513.
26. Valeton JM, van Norren D. Light adaptation of pri-mate cones: an analysis based on extracellular data.Vision Res. 1983;23:1539-1547.
27. Hood DC, Birch D. Changes in the gain and time con-stant of human cone photoreceptors with light adapta-tion. Advances in Color Vision, Technical Digest, OpticalSoc Am. 1992;4:10-12.
28. Baron WS, Boynton RM. Response of primate conesto sinusoidally flickering homochromatic stimuli. JPhysiol. 1975; 246:311-331
29. Abraham FA, Alpern M, Kirk DB. Electroretinogramsevoked by sinusoidal excitation of human cones.y Phys-iol. 1985;363:135-150.
30. Brown JL. Flicker and intermittent stimulation. In:Graham, CH, ed. Vision and Visual Perception. NewYork: John Wiley and Sons, Inc; 1965:215-320.
Downloaded From: http://iovs.arvojournals.org/pdfaccess.ashx?url=/data/journals/iovs/933175/ on 03/31/2018