scientific irrigation scheduling provisional analysis and research plan bpa december 2014
TRANSCRIPT
Scientific Irrigation Scheduling
provisional analysis and research plan
BPADecember 2014

2
Baseline
Scientific Irrigation SchedulingOverview
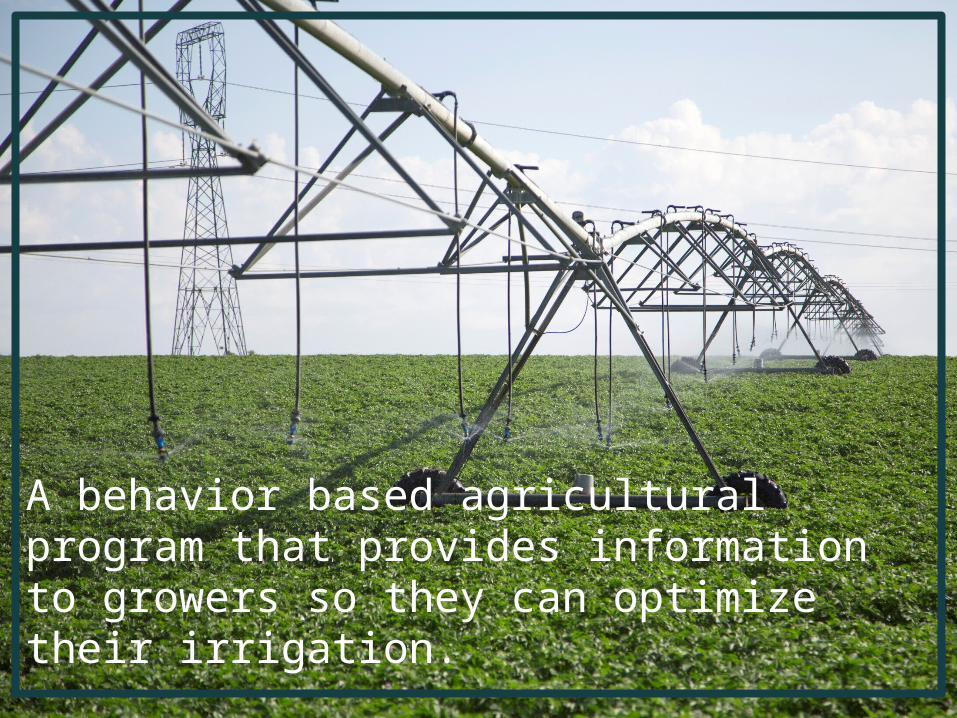
A behavior based agricultural program that provides information to growers so they can optimize their irrigation.
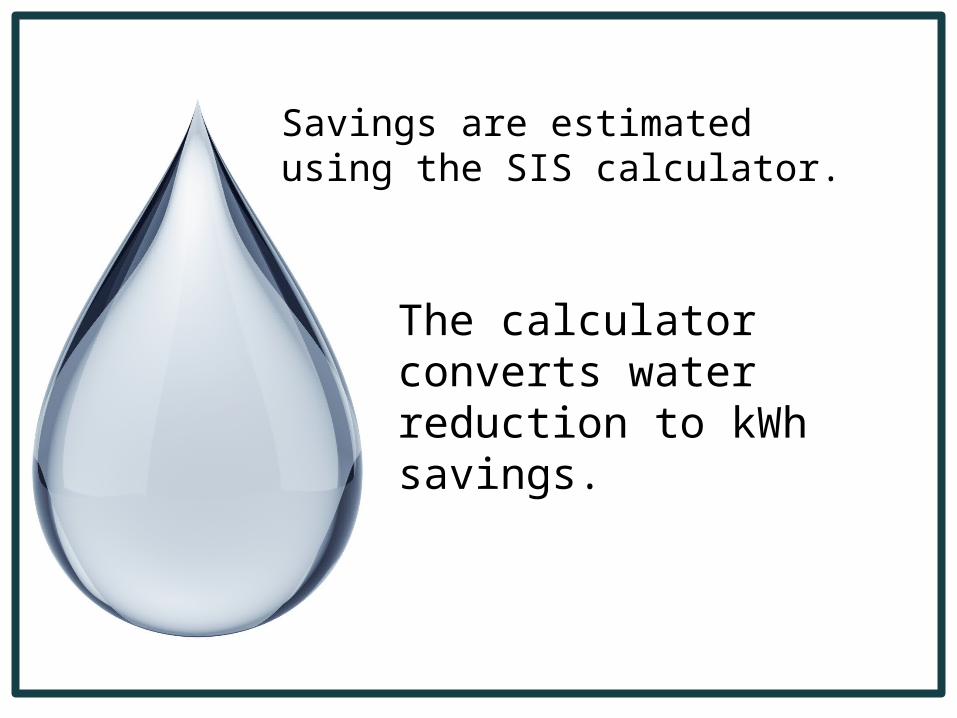
Savings are estimated using the SIS calculator.
The calculator converts water reduction to kWh savings.
The calculator estimates 10% water reduction.
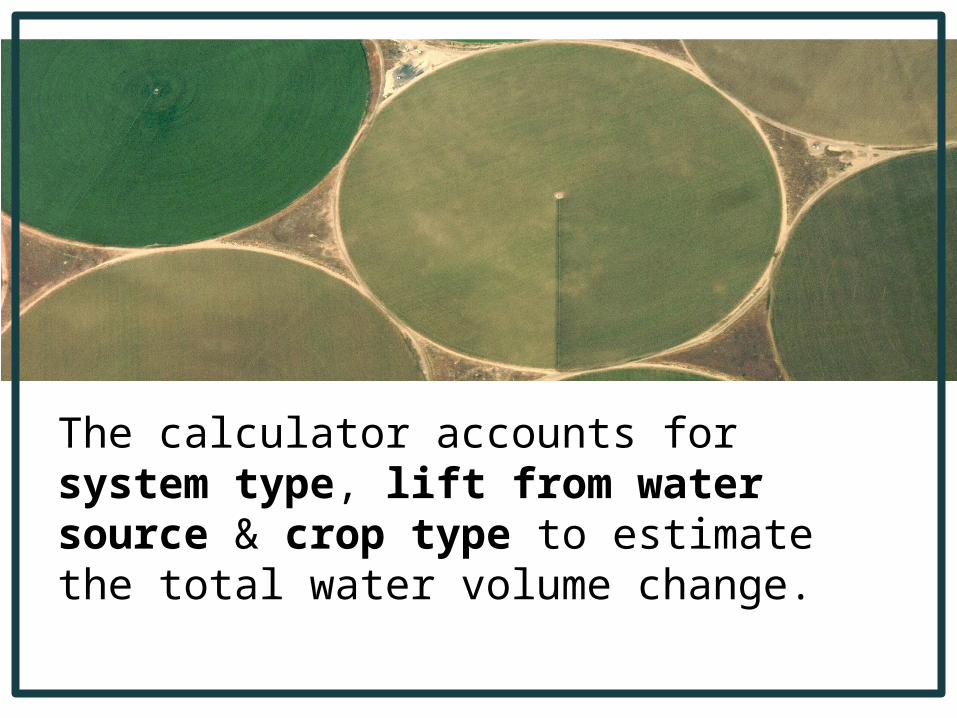
The calculator accounts for system type, lift from water source & crop type to estimate the total water volume change.

Regional Technical ForumReview Background
2006
2012
2013
2014
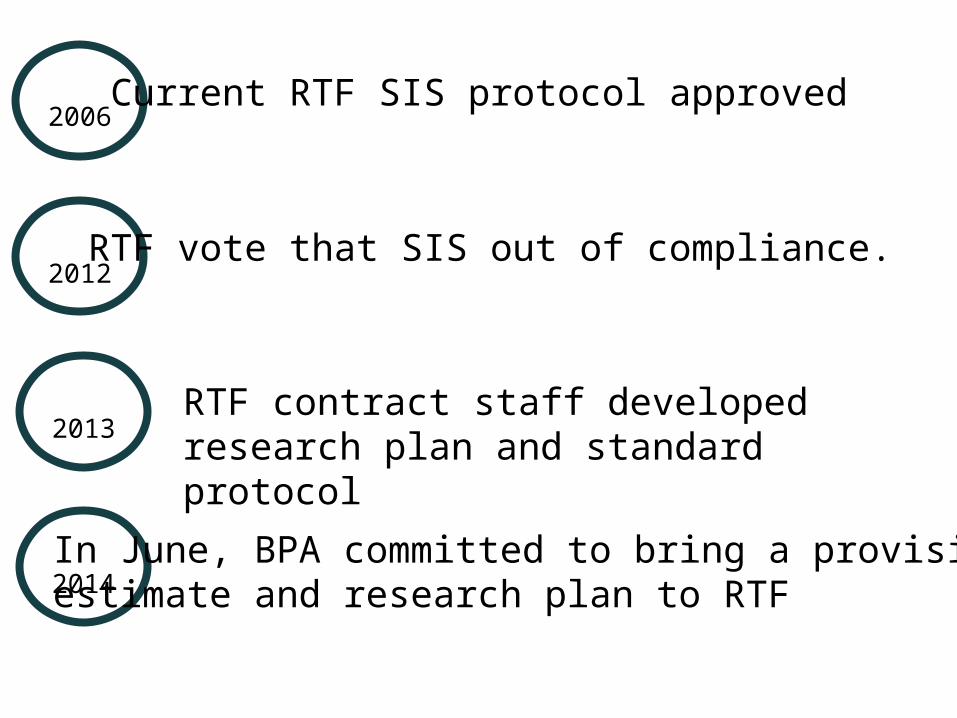
Current RTF SIS protocol approved
RTF vote that SIS out of compliance.
RTF contract staff developed research plan and standard protocol
In June, BPA committed to bring a provisional estimate and research plan to RTF
num
ber
of u
nits
sol
d
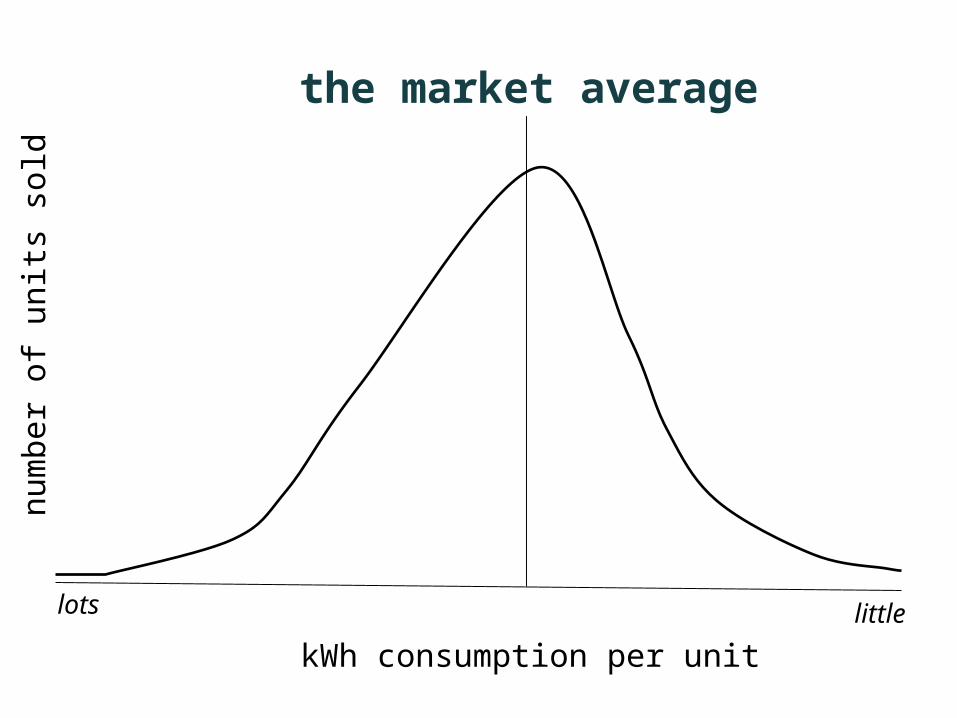
kWh consumption per unit
lots little
the market average
num
ber
of s
ales
kWh consumption per unit
lots little
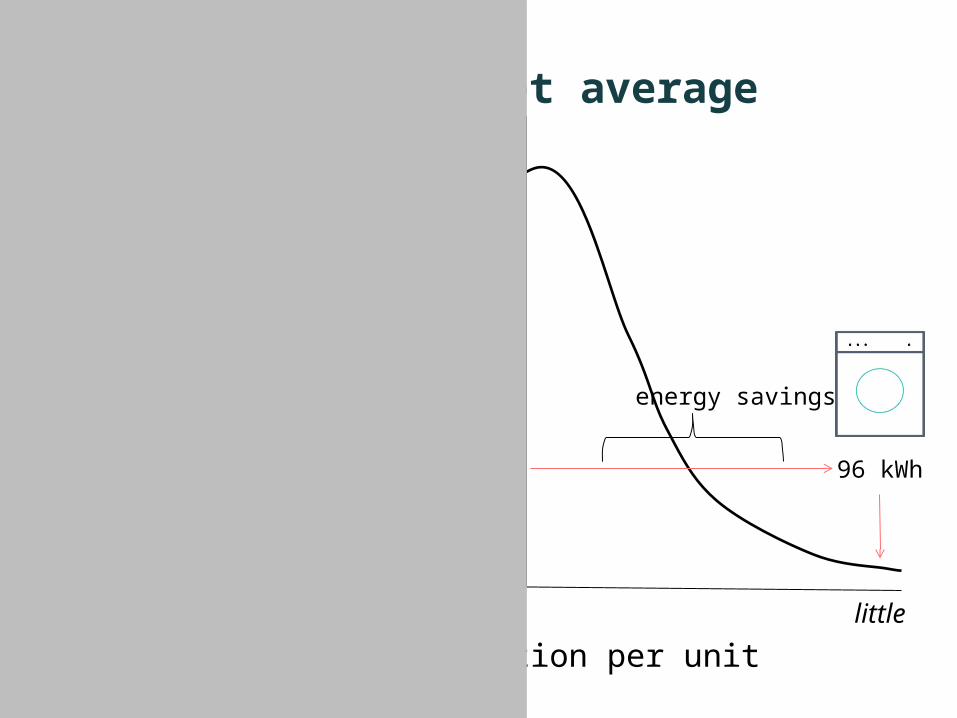
96 kWh
the market average
energy savings
num
ber
of s
ales
kWh consumption per unit
lots little
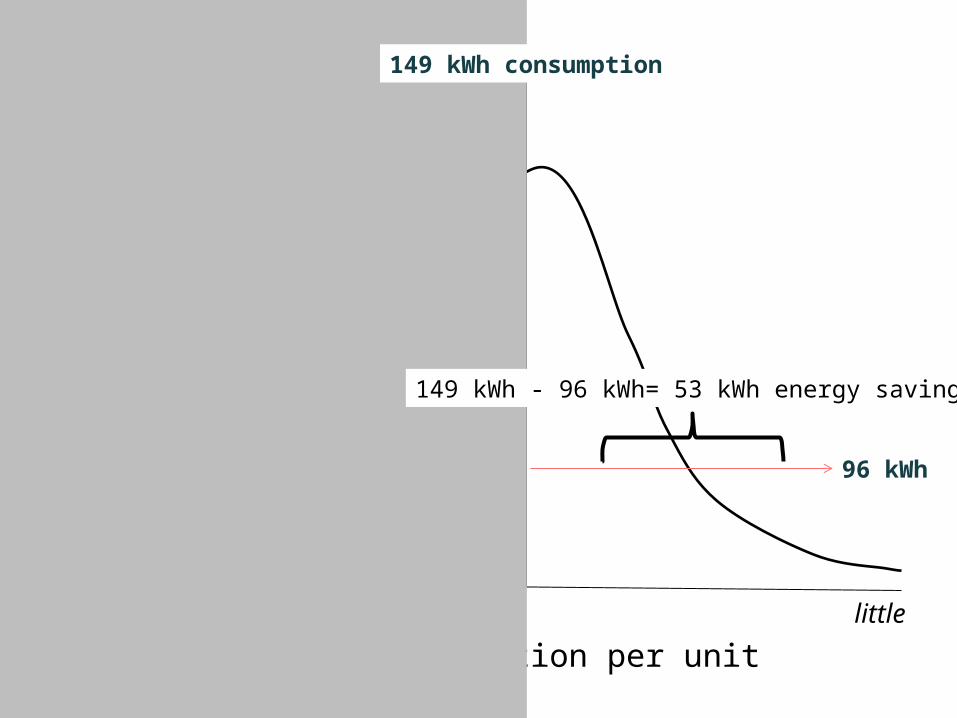
96 kWh
149 kWh - 96 kWh= 53 kWh energy savings
149 kWh consumption
num
ber
of a
cres
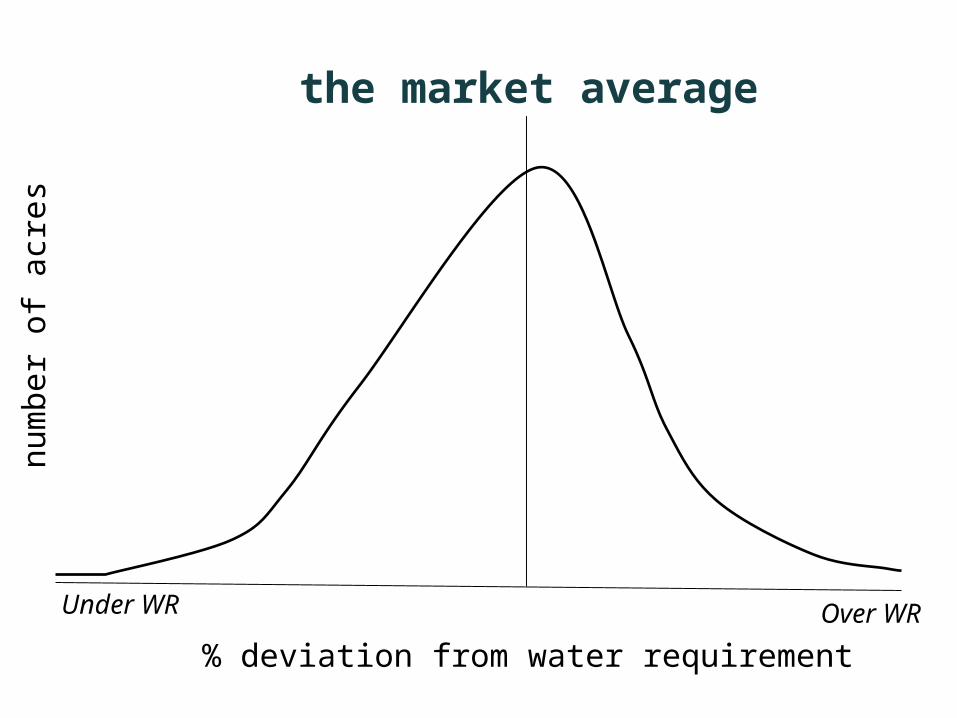
% deviation from water requirement
Under WR Over WR
the market average
num
ber
of a
cres
% deviation from water requirement
Under WR Over WR
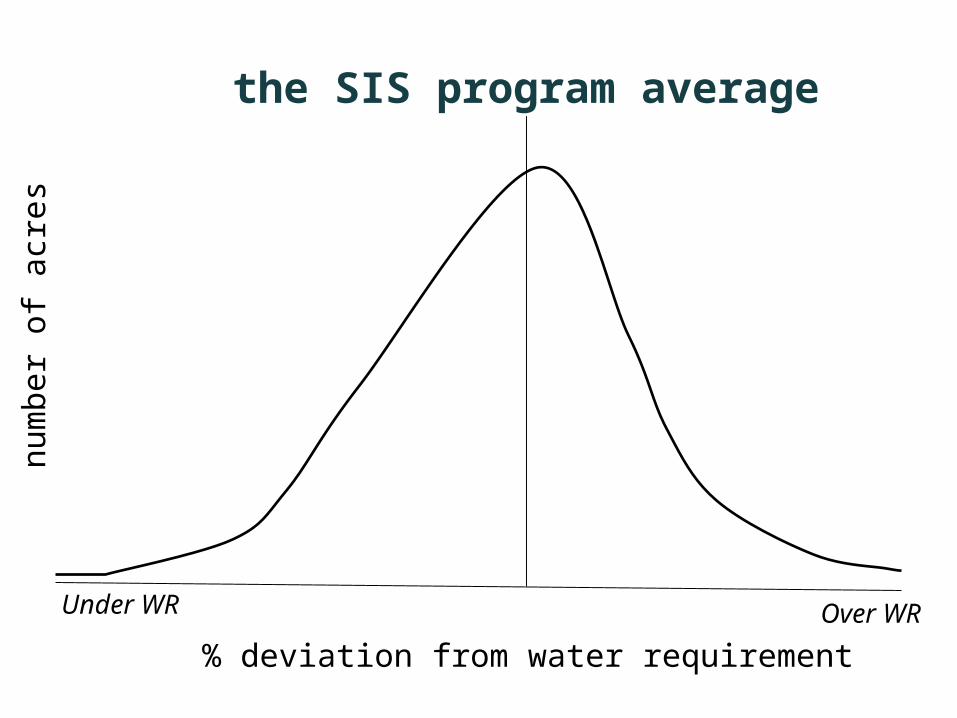
the SIS program average
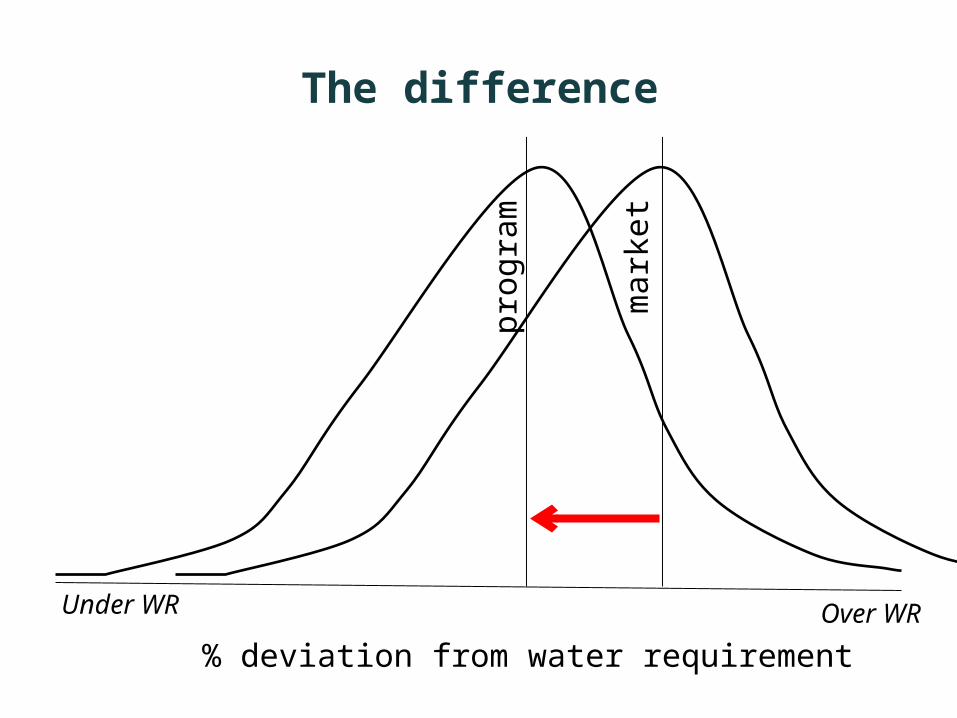
% deviation from water requirement
Under WR Over WR
The difference
mar
ket
prog
ram

Research Plan

Baseline Market Study
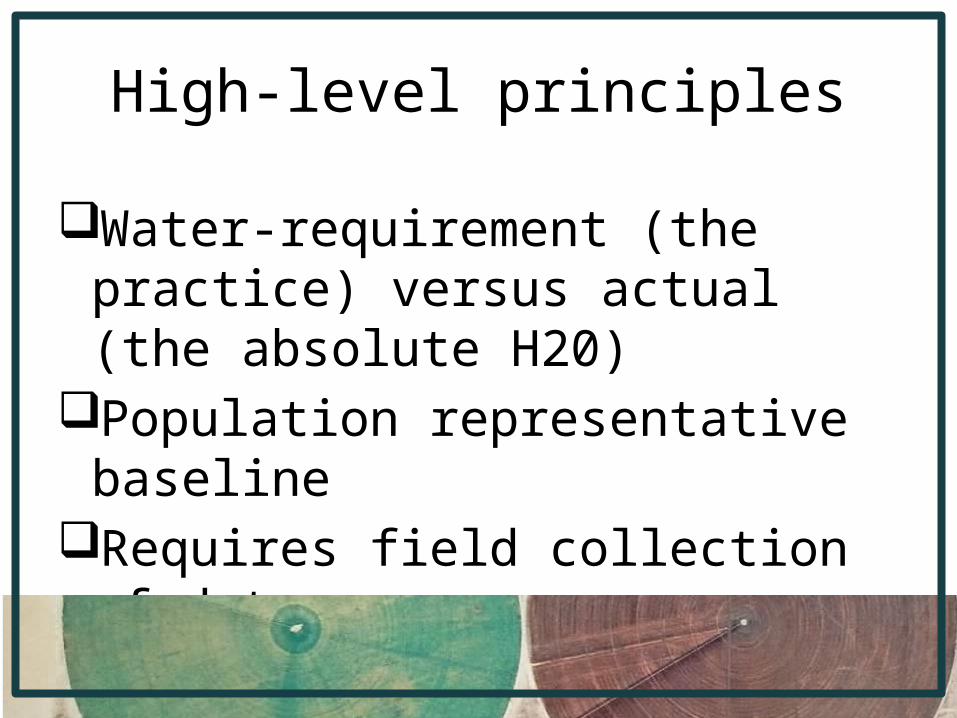
High-level principles
Water-requirement (the practice) versus actual (the absolute H20)
Population representative baseline
Requires field collection of data
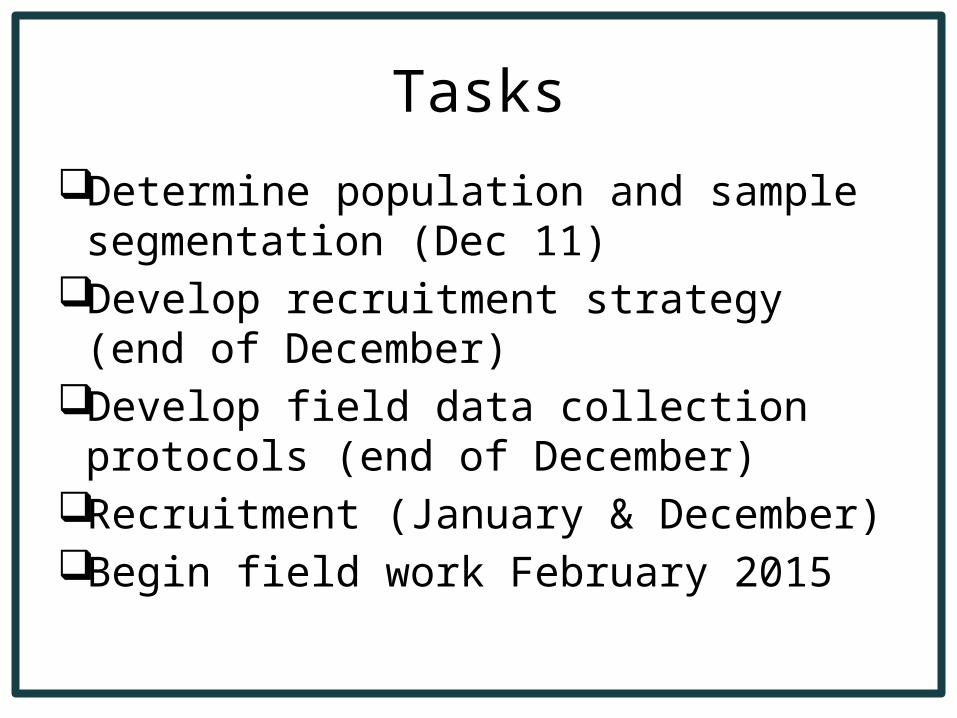
Tasks
Determine population and sample segmentation (Dec 11)
Develop recruitment strategy (end of December)
Develop field data collection protocols (end of December)
Recruitment (January & December)Begin field work February 2015
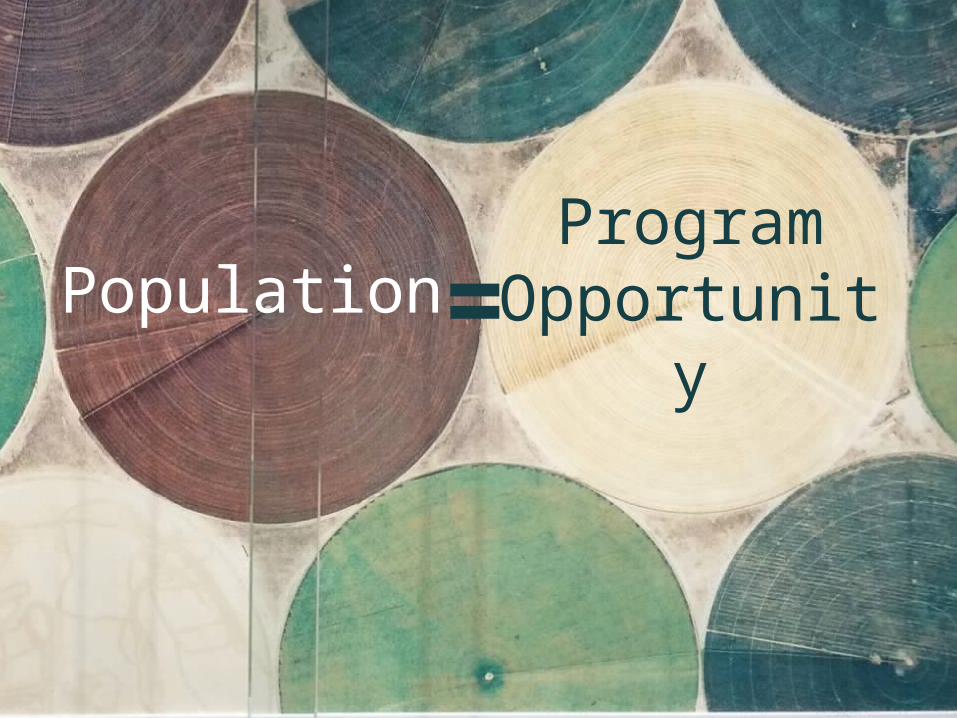
Population ProgramOpportunity=

liftdeficit
irrigation
crop value

program coverage
croprotation
mixed fields
Grower Recruitment
Coordination with utilitiesUnbiased sample vs. realities of
recruitment limitationsProviding value proposition for
study participation vs. keeping costs lower
Field Work
Consistency in data collection and data definitions
Safety protocolsCommunication protocols

Provisional
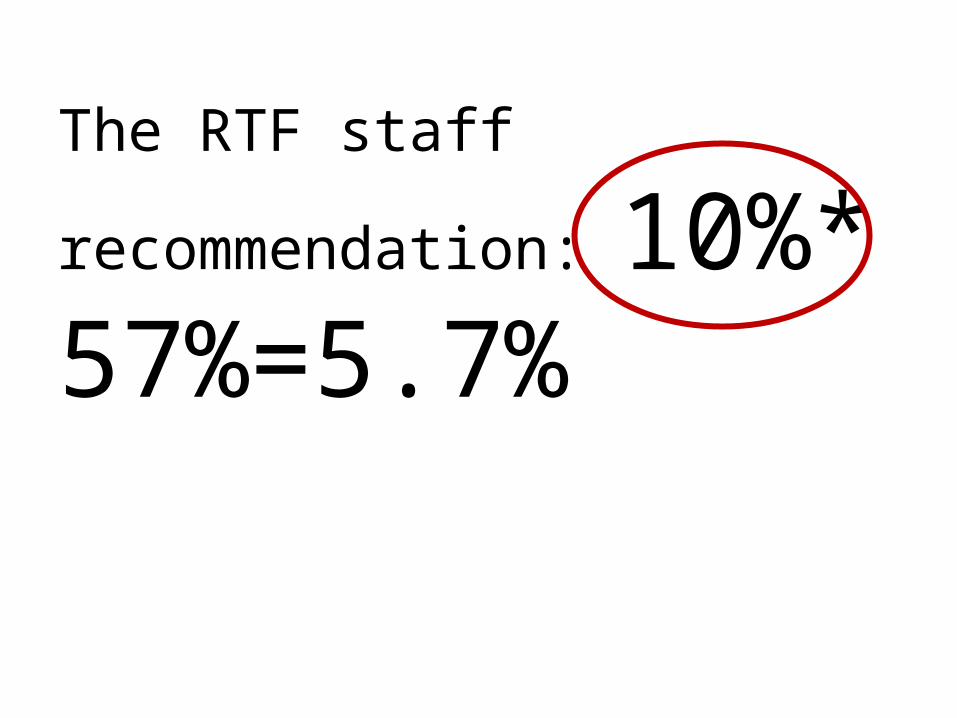
The RTF staff recommendation:
10%* 57%=5.7%
First Number to Examine:
10%Water reduction
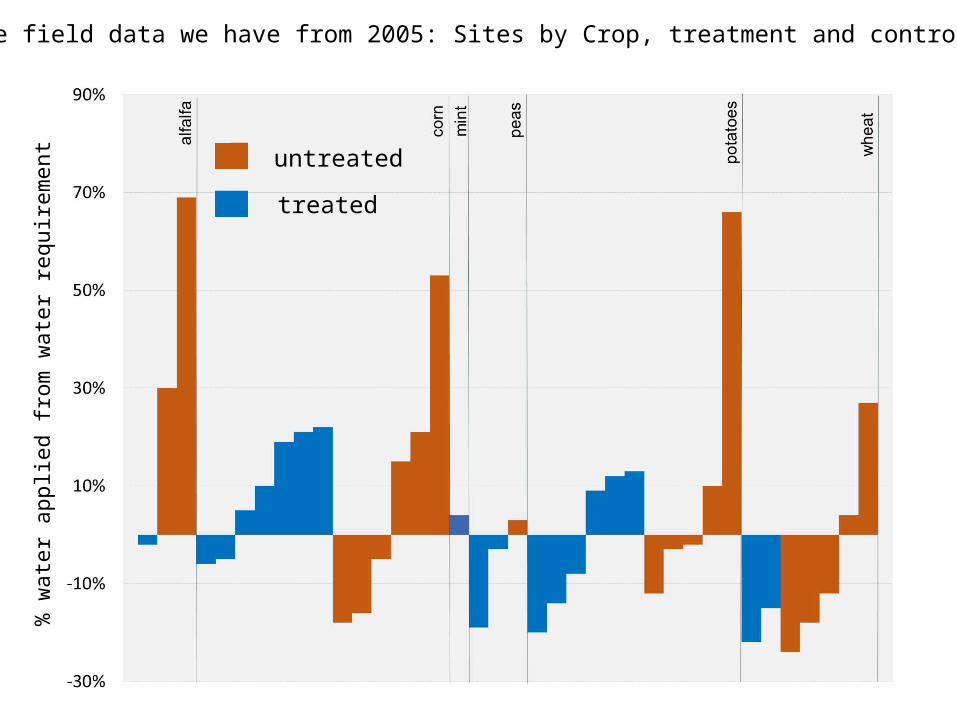
The field data we have from 2005: Sites by Crop, treatment and control
untreated
treated
% w
ater
app
lied
from
wat
er r
equi
rem
ent
31
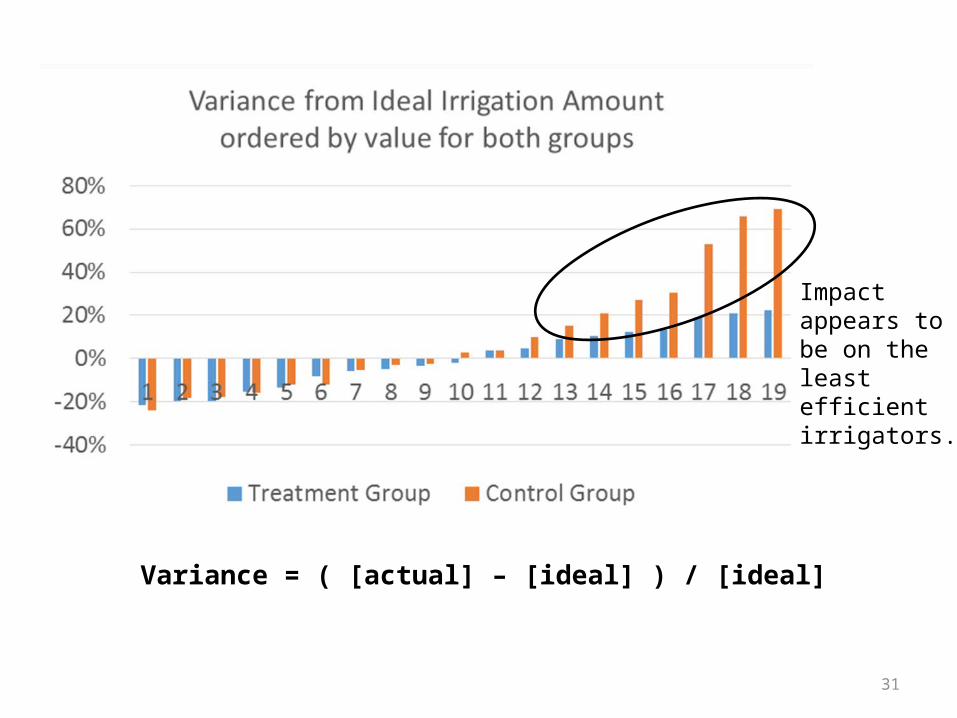
Variance = ( [actual] – [ideal] ) / [ideal]
Impact appears to be on the least efficient irrigators.
10% is a straight average of the
treatment and control: sites were not selected randomly or to be representative.
10% is based on data that are not
statistically significant.
Second Number to Examine:
57%of acres are not implementing SIS practices
35
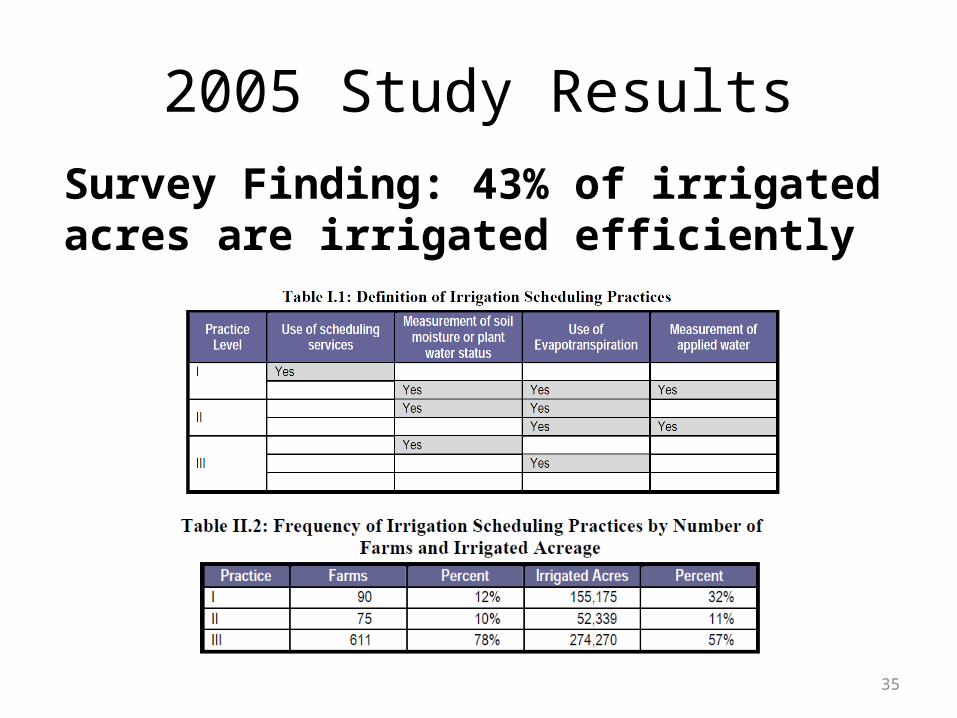
2005 Study Results
Survey Finding: 43% of irrigated acres are irrigated efficiently
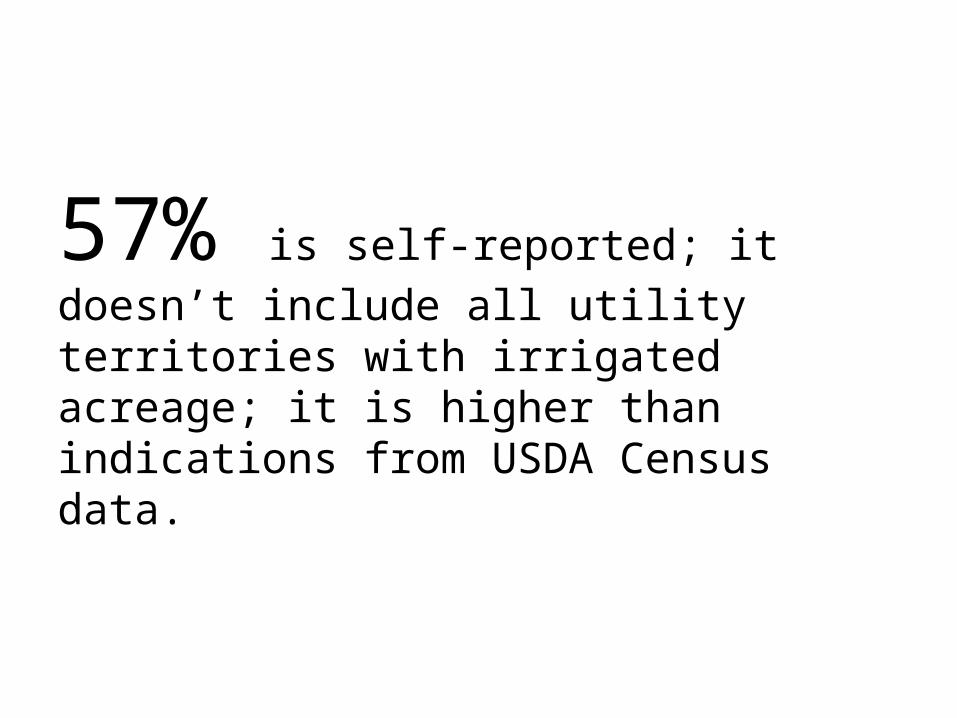
57% is self-reported; it doesn’t include
all utility territories with irrigated acreage; it is higher than indications from USDA Census data.
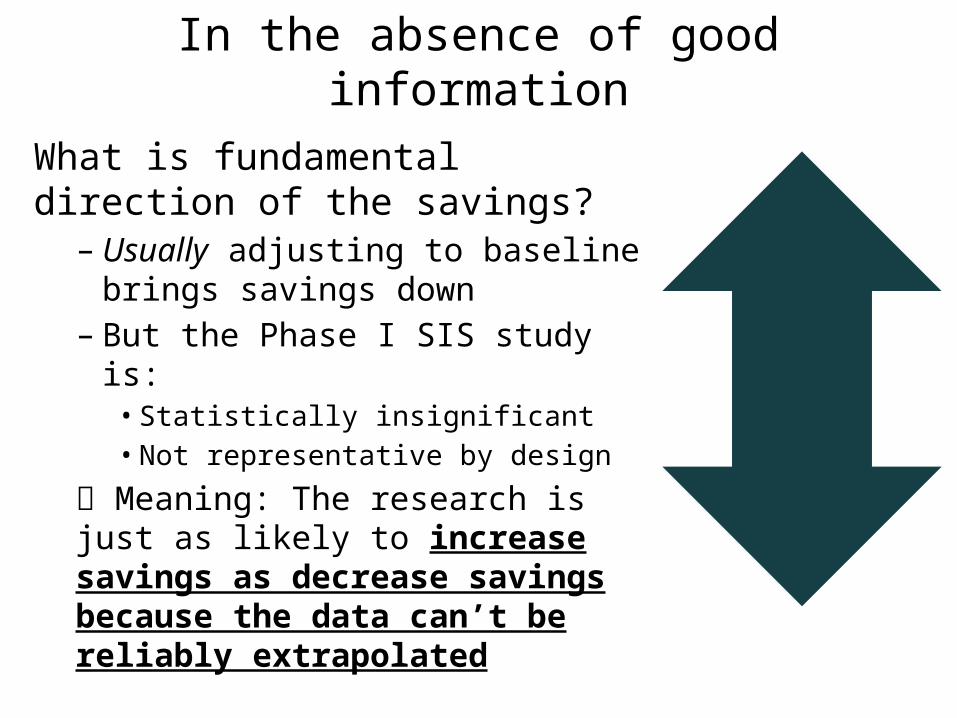
In the absence of good information
What is fundamental direction of the savings?
– Usually adjusting to baseline brings savings down
– But the Phase I SIS study is:• Statistically insignificant• Not representative by design
Meaning: The research is just as likely to increase savings as decrease savings because the data can’t be reliably extrapolated
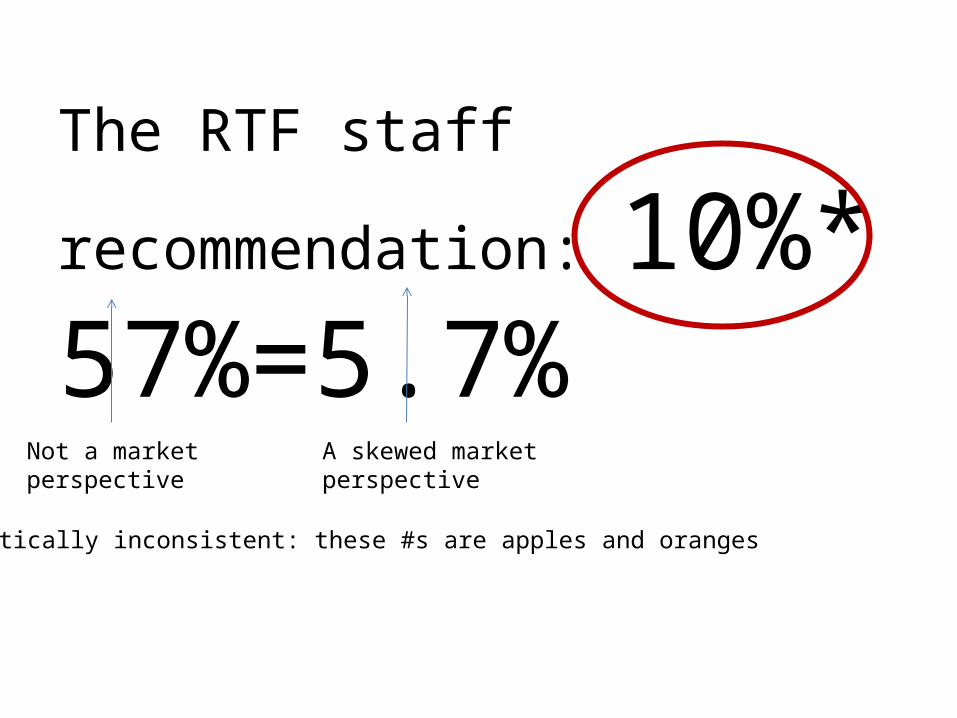
The RTF staff recommendation:
10%* 57%=5.7%
Not a marketperspective
A skewed marketperspective
Theoretically inconsistent: these #s are apples and oranges
We can’t (yet) change that we have poor data
We can change that we have a poor method.
Let’s use a good method for our poor data.
Provisional
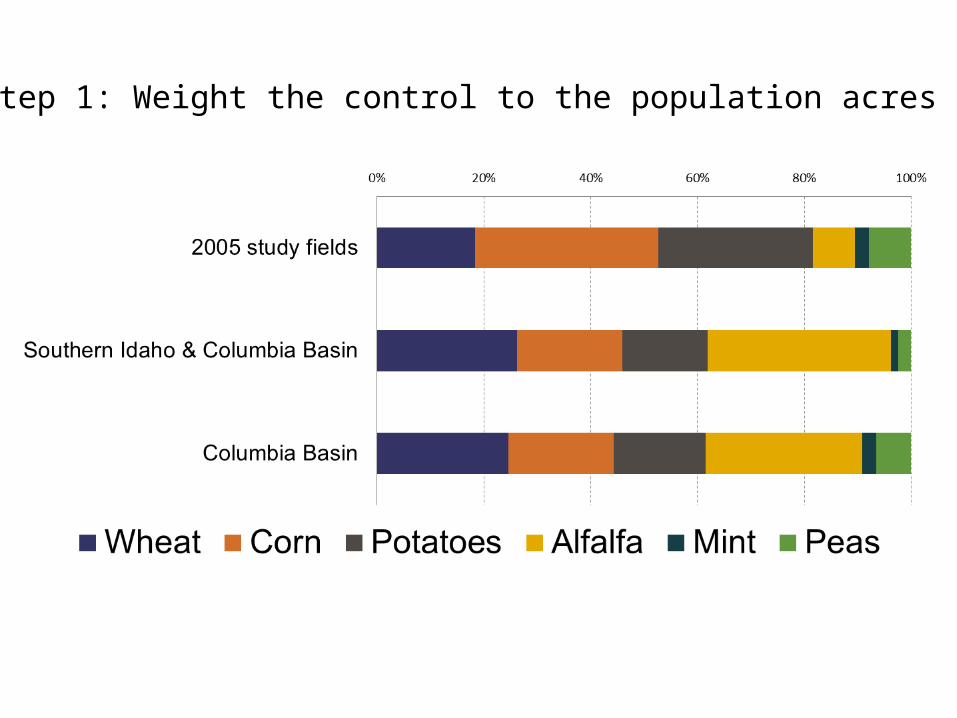
Step 1: Weight the control to the population acres
Provisional
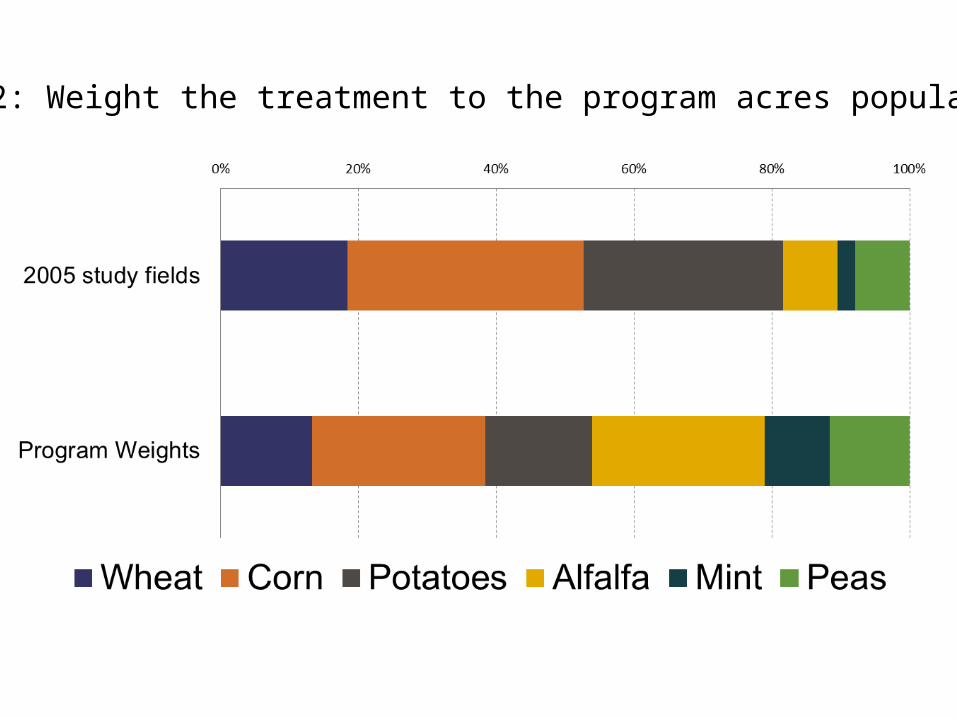
Step 2: Weight the treatment to the program acres population
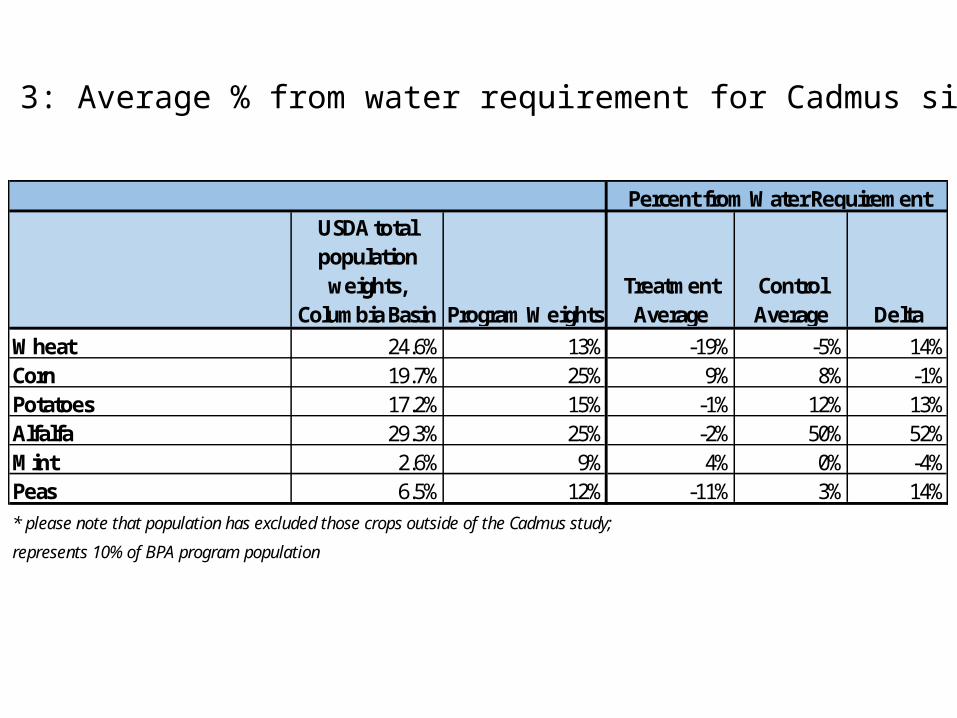
Step 3: Average % from water requirement for Cadmus sites
USDA total population
weights, Columbia Basin Program Weights
Treatment Average
Control Average Delta
Wheat 24.6% 13% -19% -5% 14%Corn 19.7% 25% 9% 8% -1%Potatoes 17.2% 15% -1% 12% 13%Alfalfa 29.3% 25% -2% 50% 52%Mint 2.6% 9% 4% 0% -4%Peas 6.5% 12% -11% 3% 14%* please note that population has excluded those crops outside of the Cadmus study;
represents 10% of BPA program population
Percent from Water Requirement
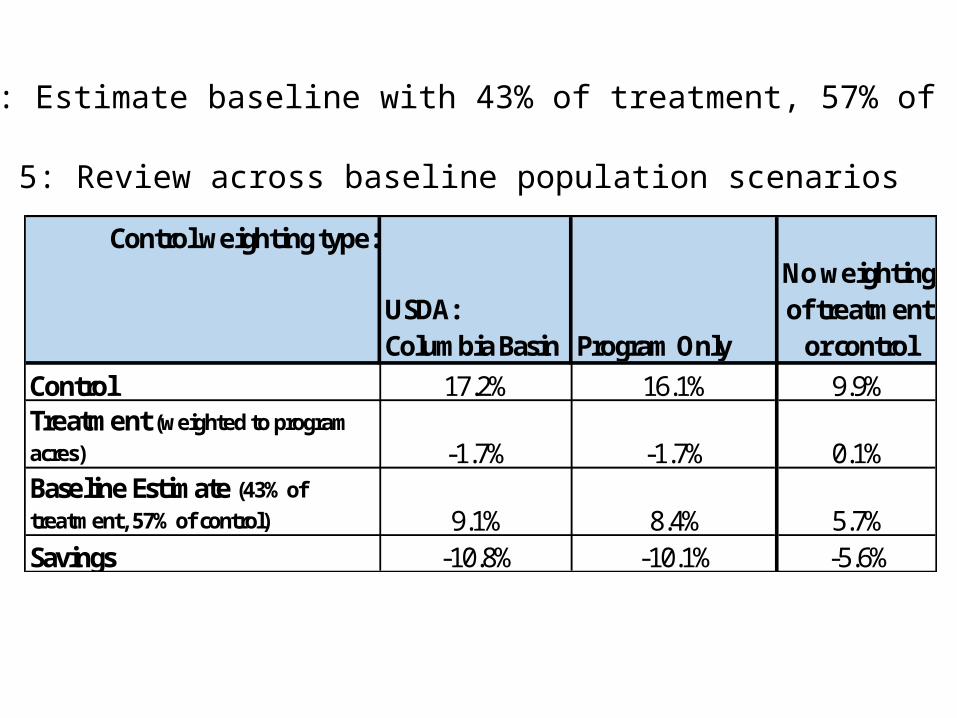
Step 4: Estimate baseline with 43% of treatment, 57% of control
Step 5: Review across baseline population scenarios
Control weighting type:
USDA: Columbia Basin Program Only
No weighting of treatment
or controlControl 17.2% 16.1% 9.9%Treatment (weighted to program acres) -1.7% -1.7% 0.1%Baseline Estimate (43% of treatment, 57% of control) 9.1% 8.4% 5.7%Savings -10.8% -10.1% -5.6%
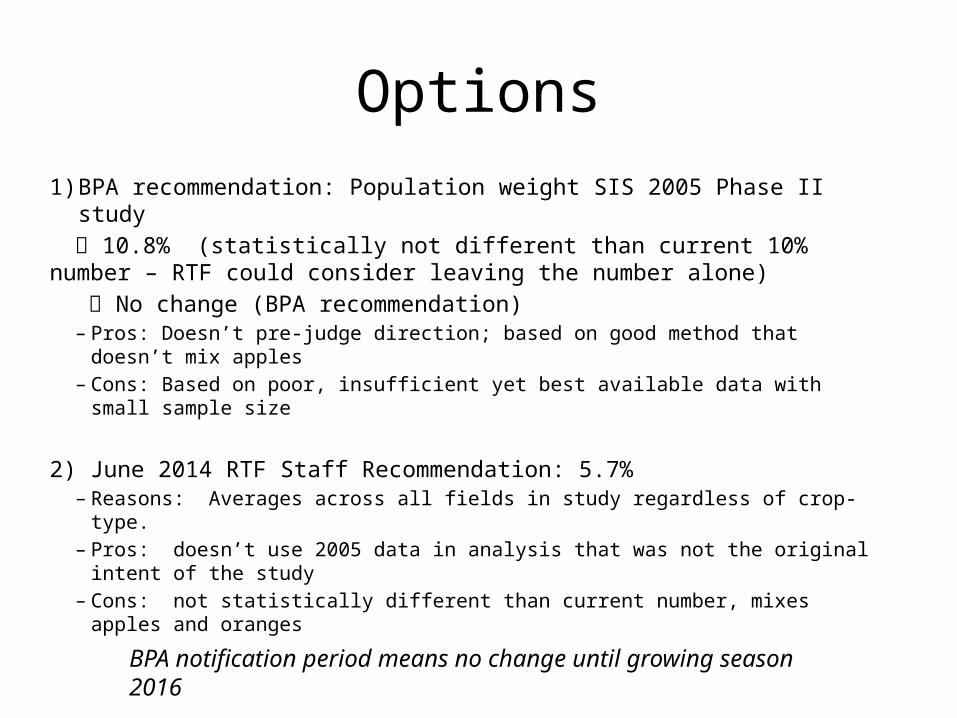
Options
1) BPA recommendation: Population weight SIS 2005 Phase II study
10.8% (statistically not different than current 10% number – RTF could consider leaving the number alone)
No change (BPA recommendation)– Pros: Doesn’t pre-judge direction; based on good method that doesn’t mix
apples– Cons: Based on poor, insufficient yet best available data with small sample
size
2) June 2014 RTF Staff Recommendation: 5.7% – Reasons: Averages across all fields in study regardless of crop-type.– Pros: doesn’t use 2005 data in analysis that was not the original intent of the
study– Cons: not statistically different than current number, mixes apples and
orangesBPA notification period means no change until growing season 2016