reprocessing of sangan iron ore tailings by...
TRANSCRIPT
Corresponding author: [email protected] (A. Behnamfard).
Shahrood University of Technology
Iranian Society of Mining
Engineering (IRSME)
Journal of Mining and Environment (JME)
journal homepage: www.jme.shahroodut.ac.ir
Vol. 10, No. 3, 2019, 729-745. DOI: 10.22044/jme.2019.8137.1682
Reprocessing of Sangan iron ore tailings by flotation
S. Ghasemi1, A. Behnamfard1* and R. Arjmand2
1. Department of Mining Engineering, Faculty of Engineering, University of Birjand, Birjand, Iran 2. Opal Parsian Sangan Industrial and Mineral (OPSIM) Company, Khaf, Iran
Received 24 February 2019; received in revised form 28 March 2019; accepted 22 April 2019
Keywords
Iron Ore Tailing
Upgradation
Reverse Flotation
Anionic Collector
Natural Depression
Abstract The Sangan processing plant consists of four consecutive low-intensity magnetic separation steps with the same magnetic field intensity of 1300 Gauss for upgradation of iron ore. Hence, the iron ore minerals with lower magnetic susceptibility or interlocked with gangue minerals have no opportunity for upgradation, and proceed to the tailing dam. Flotation is a powerful technique for upgradation of these materials, and it is the focus of this research work. A sample of 43.09% Fe and 12.1% FeO was taken from the tailings of second step of magnetic separation. The ore minerals of the sample were determined to be magnetite and hematite. A concentrate of 67% Fe and mass recovery of 50% was produced through the Davis tube test. A reverse flotation route was selected for upgradation of the sample. Fatty acid-based anionic collectors with trade names Alke and Dirol were used in the flotation experiments. The design of experiments was done by resolution IV fractional factorial design with nine factors at two levels per factor. A resolution IV design allows discrimination of all main effects and two-factor interactions. A concentrate of 53.92% Fe at a mass recovery of 60% was obtained at optimum flotation conditions of solid content 20%, pH 12, collector concentration of 1 kg/t, starch as depressant at a concentration of 5 kg/t, Alke/Dirol collector mass ratio of 30/70, conditioning time of 10 min., and concentration of Ca2+ as activator 1 kg/t. In this research work, the concept of natural depression of iron minerals in the reverse flotation was introduced and evaluated.
1. Introduction Annually, more than 1.5 billion tons of crude steel is produced in the world [1]. Iran is the thirteenth largest producer, and in 2017, it produced 21.2 million tons of crude steel up from 17.9 million tons in 2016 [1]. For every one ton of crude steel produced, approximately 2.5 to 3 tons of tailings will be discharged [2]. The tailings are produced during the upgradation of run of mine (ROM) iron ores and smelting of iron ore concentrate. Most of the tailing is produced during the upgradation of ROM iron ores in mineral processing plants, in which the ROM ore with iron grade of 30-40% is upgraded to a concentrate with iron grade more than 65% [2]. In the iron ore processing plants, usually the iron minerals are separated from gangue minerals during several consecutive wet
low-intensity magnetic separation steps [3, 4]. The tailings fall in the category of high risk wastes since they not only cover huge land but also pollute environment through several issues, for instance, acid mine drainage (AMD) [5-7]. Therefore, the management of tailings has a crucial importance for iron ore mineral processing plants [8]. It is usually performed in the best way by implementing the 3Rs concept [9]. The 3R strategy sets the goal of tailing reduction, reuse, and recycling [9]. In the recent years, interest in upgradation of iron ore tailings has increased worldwide. These activities are initiated not only to recover minerals but also to address various environmental issues associated with tailings [10]. Several technologies
Ghasemi et al./ Journal of Mining & Environment, Vol. 10, No. 3, 2019
730
have been employed in this regard including gravity separation, high-intensity magnetic separation, and flotation [11-14]. The gravity separation due to decreased gravitational effect and high-intensity magnetic separation due to reduced drag force have been found to be ineffective for treatment of iron tailings with fine particle sizes. However, froth flotation is a powerful technique for treatment of these materials. Therefore, it is in this regard that flotation has gained importance in treating iron ore tailings in the recent years [15, 16]. The flotation of iron ores is usually performed by reverse flotation using cationic or anionic collectors [17]. The reverse flotation using cationic collectors is the most popular flotation route for the upgradation of low-grade iron ores and iron ore tailings [18, 19]. In the reverse cationic flotation route, after depression of iron minerals by a suitable depressant such as starch at alkaline pH values, the gangue minerals are floated by a cationic collector such as dodecylamine or ether amine. The reverse flotation using cationic collectors is very sensitive to slime-sized materials, and de-sliming must be performed before the flotation process, which results in some iron loss [15]. Furthermore, the high cost of cationic collector increases the operating costs of this process and restricts its usage [17]. The reverse flotation using anionic collectors can be a suitable alternative route for the upgradation of iron ore tailings. This flotation route is not sensitive to the presence of slime-sized materials, and the anionic collectors are significantly cheaper than the cationic collectors. In reverse flotation by anionic collectors, initially, lime is added to the pulp for the pH adjustment at alkaline values and activation of silicate minerals. After that, the depression of iron minerals is performed through addition of a suitable depressant. Finally, gangue minerals are floated by an anionic collector such as fatty acids [20]. The efficient depression of iron minerals is one of the main challenges of this flotation route. The performance and operational costs of this process are highly dependent on the precise determination of the type and dosage of depressant [21-24]. In this research work, upgradation of the tailings of a magnetic separator was investigated by the reverse anionic flotation route, and the effects of various operating parameters on the process were evaluated. The main focus of this work is to find the best conditions for depression of iron minerals. Hence, the concept of natural depression of iron minerals
was introduced and evaluated.
2. Materials and methods 2.1. Reagents Analytical reagent grade calcium nitrate tetrahydrate and sodium hydroxide were used in the flotation experiments as the activator and pH regulator, respectively. The collector used in the flotation tests included two types of Alke and Dirol collectors based on fatty acids, and the Dirol collector, in addition to the collecting effect, had a frothing effect; the collectors were provided by a local producer. Sodium silicate with a SiO2/Na2O ratio of 2.5 was provided from the Silicate Gostar Isfahan Co. (Iran). Corn starch was provided from a local producer, and it was used as the depressant along with sodium silicate in the flotation tests. Analytical reagent grade HCl, phosphoric acid, sulfuric acid, tin chloride, mercuric chloride, potassium dichromate, and sodium diphenylamine sulfonate were used for analyzing the Fe and FeO contents of the samples by the titration method.
2.2. Iron ore sample The Sangan iron ore mine is located in the Khorasan-Razavi Province, east of Iran. It is one of the largest iron mines in Iran and in the Middle East with an iron ore reserve more than 1.2 billion tons. The first iron ore processing plant in this area annually produces 2.6 million tons of concentrate with an iron grade of more than 65%. In this plant, the processing circuit consists of four sequential steps of low-intensity magnetic separation. The drum type magnetic separators have a diameter of 1220 mm, a length of 2400 mm, and a magnetic intensity of 1300 Gauss. The tailing of all magnetic separators are transferred to the tailing dam after thickening. The sample used in this work was taken from the tailings of the rougher wet low intensity magnetic separators (i.e., second step magnetic separation). For this purpose, a total of 7000 liters of pulp was taken using a 2.5-liter sampler in a one-month period. The pulp, after dewatering through decantation and filtering by laboratory filterpress, was dried in a laboratory oven at 90°C. After that, the sample was homogenized and used in the experiments.
2.3. Sample characterization In order to determine the total iron content of the sample, an exact amount of the sample was dissolved in concentrated HCl at elevated temperatures, and then Fe(III) ions were reduced to Fe(II) ions by tin chloride. The solution volume was reached to the mark with distilled water and
Ghasemi et al./ Journal of Mining & Environment, Vol. 10, No. 3, 2019
731
sulfuric acid. The extra amount of tin chloride was neutralized by mercury chloride. After adding phosphoric acid, the total iron content of the solution was measured by titration using potassium dichromate as the titrant and sodium diphenyl sulfonate as the indicator. For the FeO analysis, a similar method with the total iron analysis was applied, by this difference that tin chloride was not added to the leach solution. The mineralogical composition of the sample was determined on a Philips-Xpert Pro. device by conducting the X-Ray Diffraction (XRD) test. Determination of the maximum recovery of iron minerals by low-intensity magnetic separators was performed by Eriez' Davis Tube Tester Model EDT at the three different magnetic field intensities of 1420, 2340, and 3800 Gauss. The high-resolution imaging by scanning electron microscopy (LEO, 1450 UP, Zeiss; Oberkochen, Germany) was performed to identify different phases of the sample. The identification of chemical composition of the detected phases was performed by Energy Dispersive X-Ray (EDS) analyzer (INCA ENERGY 350 accessory) connected to Scanning Electron Microscopy (SEM).
2.4. Flotation tests A certain amount of the sample was poured into the flotation cell, and the solid content was set in a pre-determined amount by adding a certain volume of water. The pulp pH was adjusted to the desired amount by adding 2 M sodium hydroxide solution. Then a certain amount of calcium nitrate salt, as the activator of gangue minerals, was added to the cell and conditioned for 3 min. Afterwards, the depressant of iron minerals (i.e. corn starch or sodium silicate) was added to the cell and conditioned for 3 min. The collector was
added to the cell, and the conditioning time was considered to be 1 or 10 min. The collector used in the flotation experiments was a mixture of Alke and Dirol collectors with mass ratios of 30/70 and 70/30. After opening the air valve, the froth phase was collected for 5 min. The flotation tailing and concentrate were dewatered, dried in an oven at 90°C, and analyzed for total Fe by the titration method. The natural depression of iron minerals was studied through placement of a rectangular magnet with dimensions of 10*15 cm under the flotation cell before opening the air valve. The magnetic field intensity of the magnet was measured to be 636 Gauss by Magnetic field Gaussmeter TM701 (Japan). The effects of different operating parameters were investigated on the performance of reverse anionic flotation of the sample. The design of flotation tests was done by the Minitab 17 software package using a 2^(9-4) fractional factorial design with nine factors at two levels per factor. Table 1 shows the design factors and their levels. The randomized run order of the flotation experiments and operating conditions of experimental runs are shown in Table 2. In order to investigate the effect of natural depression of iron minerals through placement of a magnet under the flotation cell on the depressant consumption in the reverse flotation, a series of flotation tests were arranged. The first test was conducted with no presence of magnet and no depressant addition. The second flotation test was performed with magnet and without depressant addition. In the third and fourth flotation tests, the magnet was placed under the flotation cell, and the depressant was added to the flotation cell at dosages of 5 and 40 kg/t, respectively.
Table 1. Factors and their levels for the fractional factorial design.
Variable levels Design factors
high low 40 20 Solid content 12 8 pH
5 kg/t 1 kg/t Collector concentration Sodium silicate Starch Depressant type
40 kg/t 5 kg/t Depressant concentration 70:30 30:70 Collector ratio
10 min 1 min Conditioning time 5 kg/t 1 kg/t Ca ion concentration Yes No Magnet
Ghasemi et al./ Journal of Mining & Environment, Vol. 10, No. 3, 2019
732
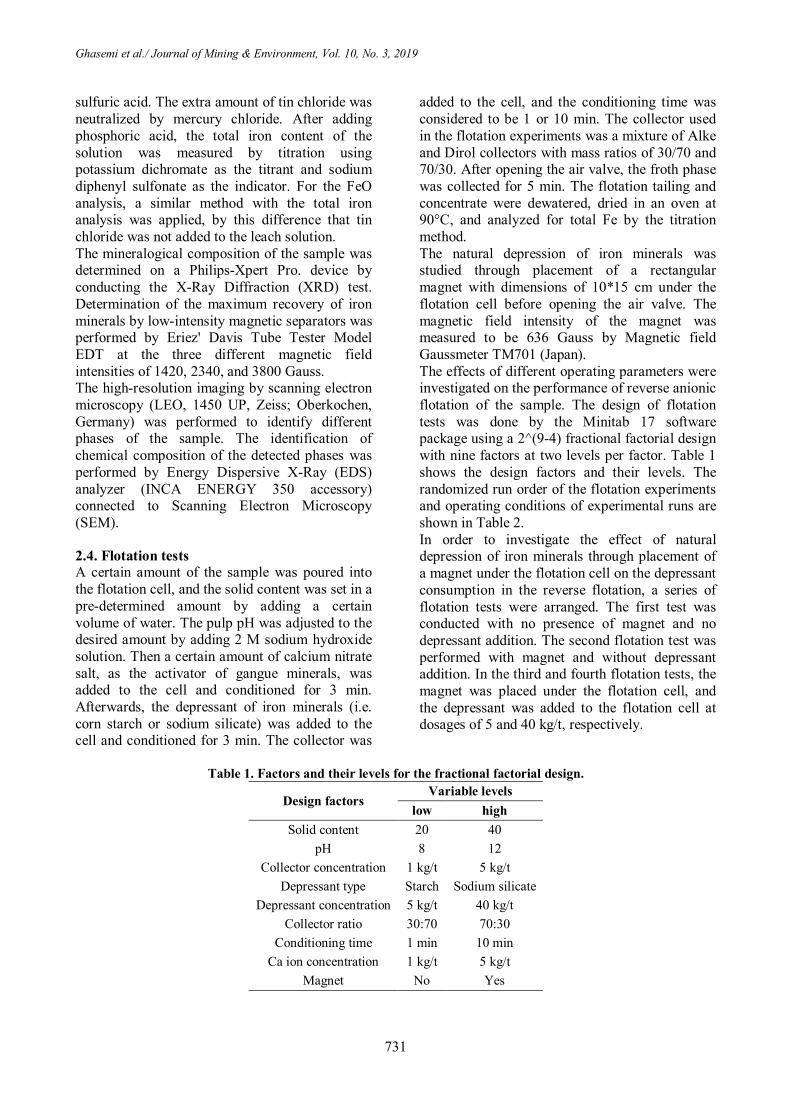
Table 2. The randomized run order of the experiments and the operating conditions of the experimental runs.
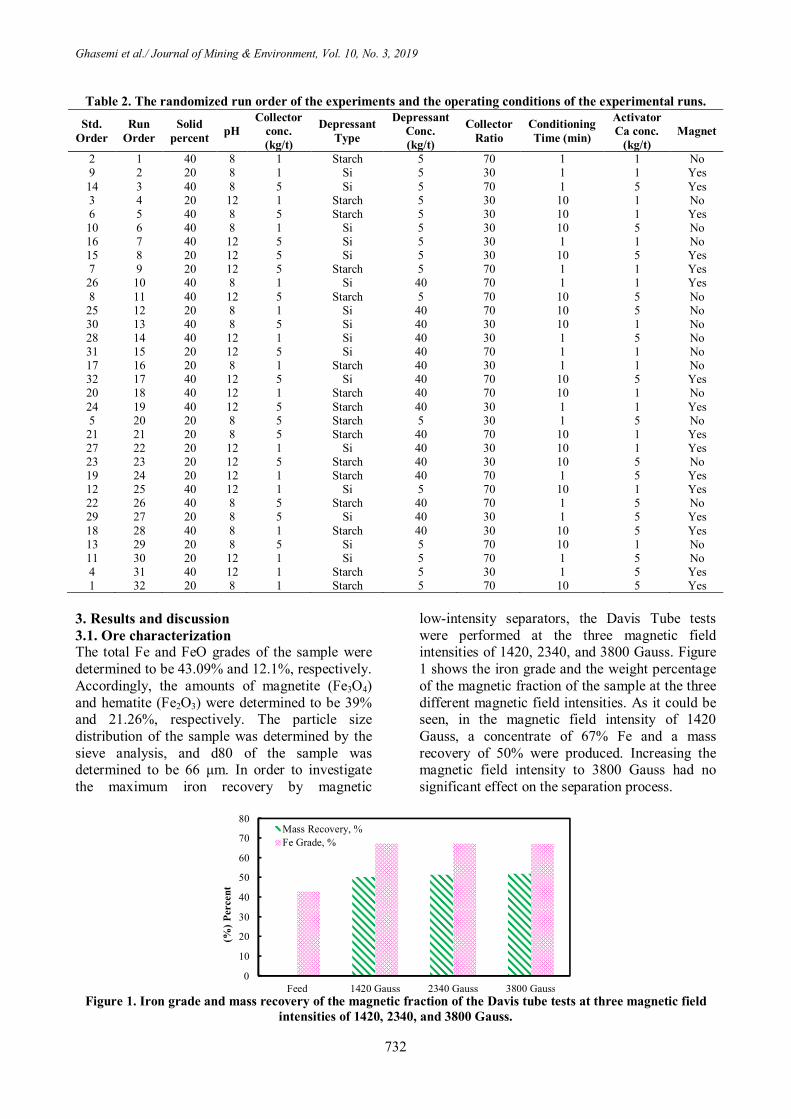
3. Results and discussion 3.1. Ore characterization The total Fe and FeO grades of the sample were determined to be 43.09% and 12.1%, respectively. Accordingly, the amounts of magnetite (Fe3O4) and hematite (Fe2O3) were determined to be 39% and 21.26%, respectively. The particle size distribution of the sample was determined by the sieve analysis, and d80 of the sample was determined to be 66 μm. In order to investigate the maximum iron recovery by magnetic
low-intensity separators, the Davis Tube tests were performed at the three magnetic field intensities of 1420, 2340, and 3800 Gauss. Figure 1 shows the iron grade and the weight percentage of the magnetic fraction of the sample at the three different magnetic field intensities. As it could be seen, in the magnetic field intensity of 1420 Gauss, a concentrate of 67% Fe and a mass recovery of 50% were produced. Increasing the magnetic field intensity to 3800 Gauss had no significant effect on the separation process.
Figure 1. Iron grade and mass recovery of the magnetic fraction of the Davis tube tests at three magnetic field
intensities of 1420, 2340, and 3800 Gauss.
0
10
20
30
40
50
60
70
80
Feed 1420 Gauss 2340 Gauss 3800 Gauss
Perc
ent
(%)
Mass Recovery, %Fe Grade, %
Std. Order
Run Order
Solid percent pH
Collector conc. (kg/t)
Depressant Type
Depressant Conc. (kg/t)
Collector Ratio
Conditioning Time (min)
Activator Ca conc.
(kg/t) Magnet
2 1 40 8 1 Starch 5 70 1 1 No 9 2 20 8 1 Si 5 30 1 1 Yes 14 3 40 8 5 Si 5 70 1 5 Yes 3 4 20 12 1 Starch 5 30 10 1 No 6 5 40 8 5 Starch 5 30 10 1 Yes 10 6 40 8 1 Si 5 30 10 5 No 16 7 40 12 5 Si 5 30 1 1 No 15 8 20 12 5 Si 5 30 10 5 Yes 7 9 20 12 5 Starch 5 70 1 1 Yes 26 10 40 8 1 Si 40 70 1 1 Yes 8 11 40 12 5 Starch 5 70 10 5 No 25 12 20 8 1 Si 40 70 10 5 No 30 13 40 8 5 Si 40 30 10 1 No 28 14 40 12 1 Si 40 30 1 5 No 31 15 20 12 5 Si 40 70 1 1 No 17 16 20 8 1 Starch 40 30 1 1 No 32 17 40 12 5 Si 40 70 10 5 Yes 20 18 40 12 1 Starch 40 70 10 1 No 24 19 40 12 5 Starch 40 30 1 1 Yes 5 20 20 8 5 Starch 5 30 1 5 No 21 21 20 8 5 Starch 40 70 10 1 Yes 27 22 20 12 1 Si 40 30 10 1 Yes 23 23 20 12 5 Starch 40 30 10 5 No 19 24 20 12 1 Starch 40 70 1 5 Yes 12 25 40 12 1 Si 5 70 10 1 Yes 22 26 40 8 5 Starch 40 70 1 5 No 29 27 20 8 5 Si 40 30 1 5 Yes 18 28 40 8 1 Starch 40 30 10 5 Yes 13 29 20 8 5 Si 5 70 10 1 No 11 30 20 12 1 Si 5 70 1 5 No 4 31 40 12 1 Starch 5 30 1 5 Yes 1 32 20 8 1 Starch 5 70 10 5 Yes
Ghasemi et al./ Journal of Mining & Environment, Vol. 10, No. 3, 2019
733
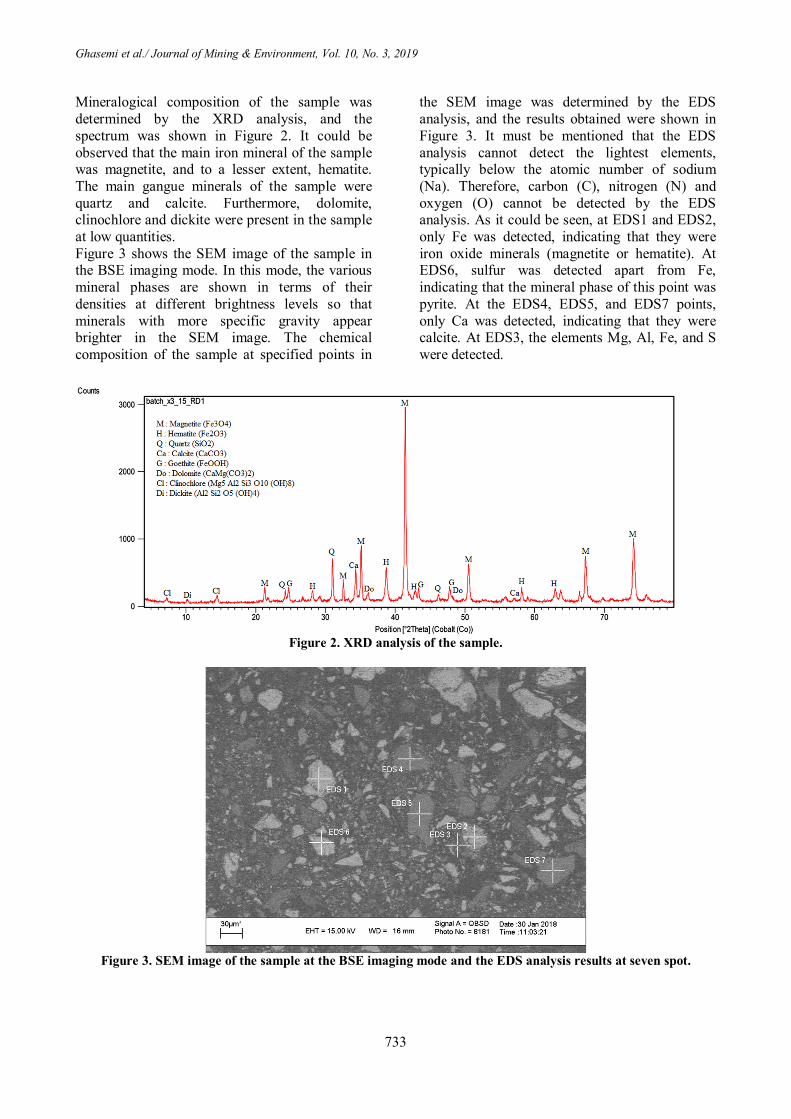
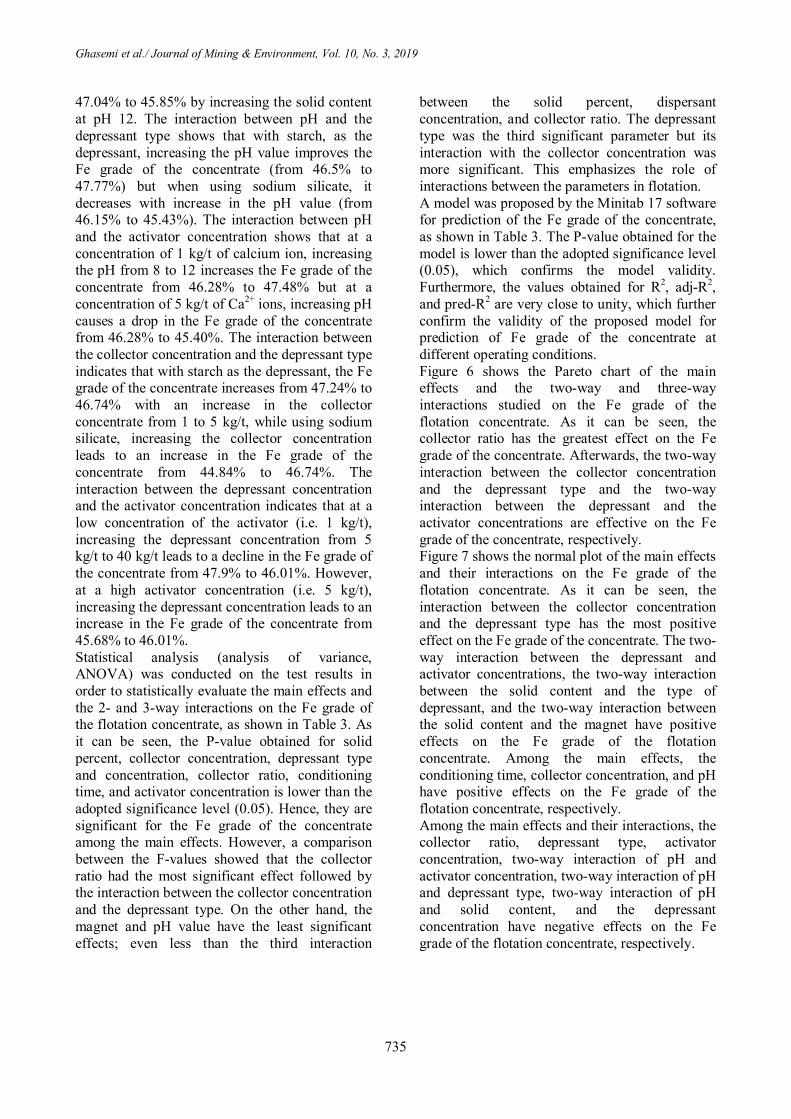
Mineralogical composition of the sample was determined by the XRD analysis, and the spectrum was shown in Figure 2. It could be observed that the main iron mineral of the sample was magnetite, and to a lesser extent, hematite. The main gangue minerals of the sample were quartz and calcite. Furthermore, dolomite, clinochlore and dickite were present in the sample at low quantities. Figure 3 shows the SEM image of the sample in the BSE imaging mode. In this mode, the various mineral phases are shown in terms of their densities at different brightness levels so that minerals with more specific gravity appear brighter in the SEM image. The chemical composition of the sample at specified points in
the SEM image was determined by the EDS analysis, and the results obtained were shown in Figure 3. It must be mentioned that the EDS analysis cannot detect the lightest elements, typically below the atomic number of sodium (Na). Therefore, carbon (C), nitrogen (N) and oxygen (O) cannot be detected by the EDS analysis. As it could be seen, at EDS1 and EDS2, only Fe was detected, indicating that they were iron oxide minerals (magnetite or hematite). At EDS6, sulfur was detected apart from Fe, indicating that the mineral phase of this point was pyrite. At the EDS4, EDS5, and EDS7 points, only Ca was detected, indicating that they were calcite. At EDS3, the elements Mg, Al, Fe, and S were detected.
Figure 2. XRD analysis of the sample.
Figure 3. SEM image of the sample at the BSE imaging mode and the EDS analysis results at seven spot.

Ghasemi et al./ Journal of Mining & Environment, Vol. 10, No. 3, 2019
734
Figure 3. Continued.
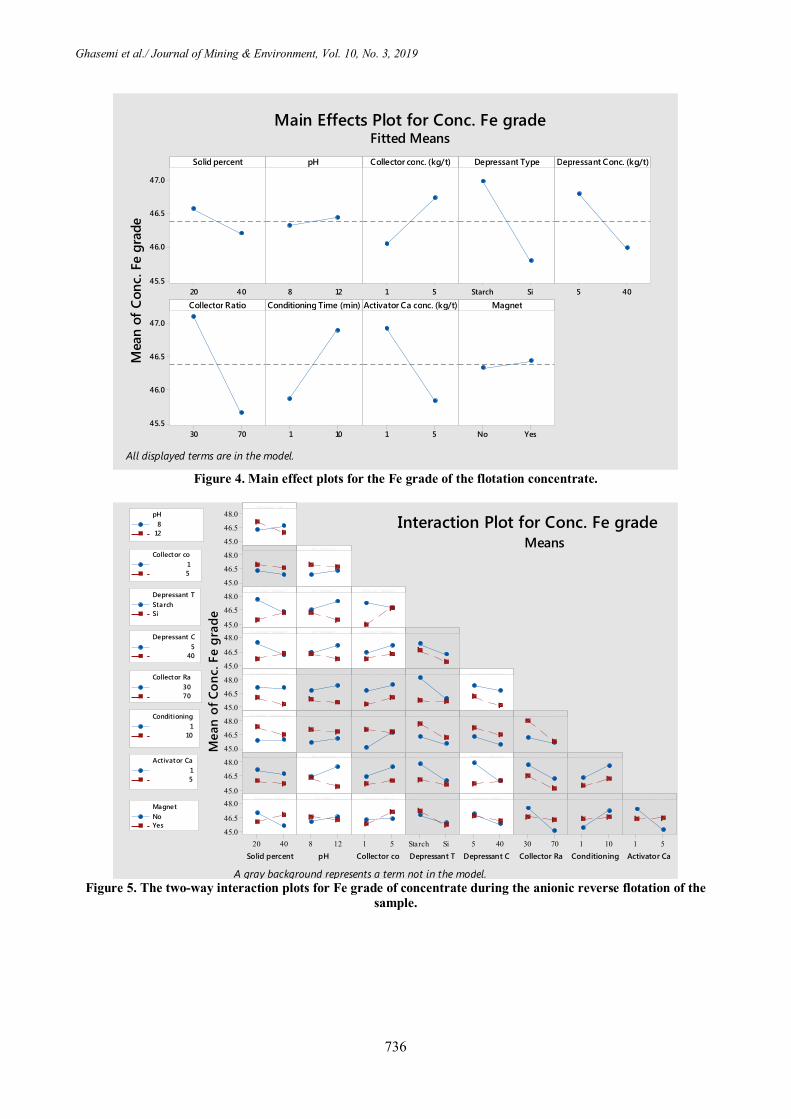
3.2. Flotation tests Figure 4 shows the effects of the process parameters on the iron grade of the anionic reverse flotation concentrate. It can be seen that increasing the collector concentration, pH, and conditioning time, and the presence of a magnet under the flotation cell have a positive effect on the Fe grade of the flotation concentrate. When using starch as the depressant in comparison to sodium silicate, a concentrate with a higher iron grade is obtained since starch is the sole depressant of iron minerals but sodium silicate has some depressing effects on the silicate minerals apart from iron minerals. The Fe grade of the concentrate decreases with increase in the solid content, depressant, and activator concentrations. In the flotation tests, a combination of two types of collectors Alke and Dirol with mass ratios of 30/70 and 70/30 were used. As shown in Figure 4, the Fe grade of the concentrate decreases with increase in the collector ratio from 30/70 to 70/30. Figure 5 shows the two-way interaction plots for the Fe grade of the concentrate during the anionic reverse flotation of the sample. The interaction
between the solid content and the magnet shows that in the absence of the magnet, increasing the solid content leads to a drop in the iron grade of the concentrate but in the presence of the magnet, increasing the solid content increases the Fe grade of the concentrate. The interaction between the collector concentration and the magnet shows that in the absence of the magnet, increasing the collector concentration has a negligible effect on the Fe grade of the concentrate, while in the presence of the magnet, increasing the collector concentration increases the Fe grade of the concentrate. The interaction between the activator concentration and the magnet shows that in the absence of the magnet, the Fe grade of the concentrate decreases with increase in the activator concentration, while in the presence of the magnet, increasing the activator concentration has no significant effect on the Fe grade of the concentrate. The interaction between the solid content and pH indicates that at pH 8, increasing the solid content from 20% to 40% has a low but positive effect on the Fe grade of the concentrate but the Fe grade of the concentrate decreases from
Fe
Fe
Fe
Fe
Fe
Fe
Fe
0 5 10
Fe
Fe
Fe
Fe
Fe
Fe
Fe
Fe
Fe
0 5 10
S Fe
Fe
Fe
Mg
Al
Al
Al
S
S
SFe
Fe
Fe
Fe
0 5 10
Ca
Ca
Ca
Ca
Ca
Ca
Ca
Ca
0 5 10
Ca
Ca
Ca
Ca
Ca
Ca
Ca
Ca
0 5 10
S Fe
Fe
Fe
S
S
S
S
Fe
Fe
Fe
Fe
0 5 10
Ca
Ca
Ca
Ca
Ca
Ca
Ca
Ca
Fe
Fe
Fe
Fe
0 5 10
EDS 1 EDS 2 EDS 3
EDS 4 EDS 5 EDS 6
EDS 7
Ghasemi et al./ Journal of Mining & Environment, Vol. 10, No. 3, 2019
735
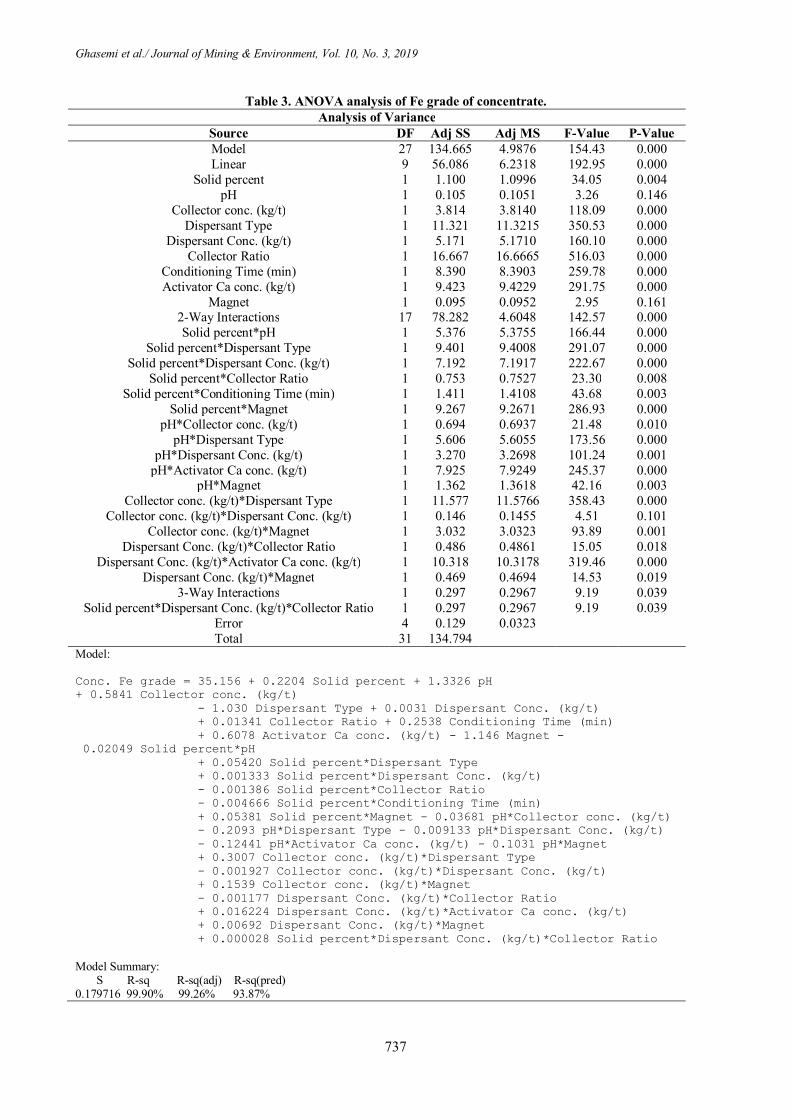
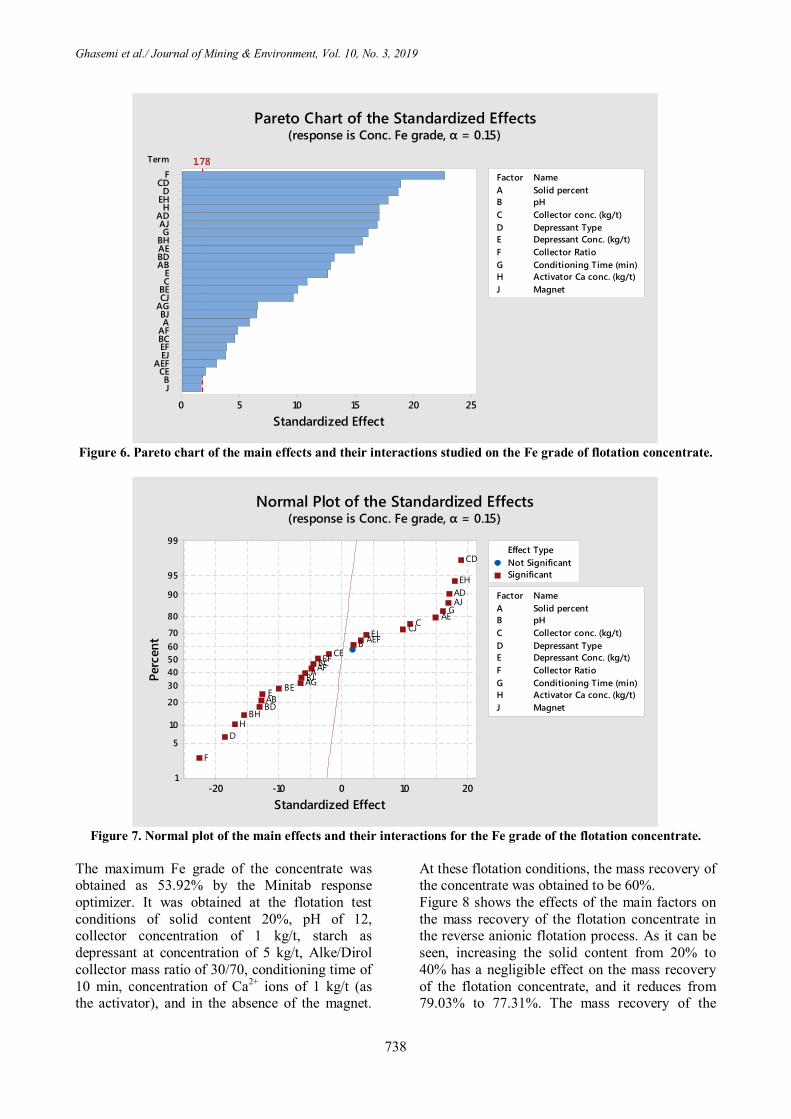
47.04% to 45.85% by increasing the solid content at pH 12. The interaction between pH and the depressant type shows that with starch, as the depressant, increasing the pH value improves the Fe grade of the concentrate (from 46.5% to 47.77%) but when using sodium silicate, it decreases with increase in the pH value (from 46.15% to 45.43%). The interaction between pH and the activator concentration shows that at a concentration of 1 kg/t of calcium ion, increasing the pH from 8 to 12 increases the Fe grade of the concentrate from 46.28% to 47.48% but at a concentration of 5 kg/t of Ca2+ ions, increasing pH causes a drop in the Fe grade of the concentrate from 46.28% to 45.40%. The interaction between the collector concentration and the depressant type indicates that with starch as the depressant, the Fe grade of the concentrate increases from 47.24% to 46.74% with an increase in the collector concentrate from 1 to 5 kg/t, while using sodium silicate, increasing the collector concentration leads to an increase in the Fe grade of the concentrate from 44.84% to 46.74%. The interaction between the depressant concentration and the activator concentration indicates that at a low concentration of the activator (i.e. 1 kg/t), increasing the depressant concentration from 5 kg/t to 40 kg/t leads to a decline in the Fe grade of the concentrate from 47.9% to 46.01%. However, at a high activator concentration (i.e. 5 kg/t), increasing the depressant concentration leads to an increase in the Fe grade of the concentrate from 45.68% to 46.01%. Statistical analysis (analysis of variance, ANOVA) was conducted on the test results in order to statistically evaluate the main effects and the 2- and 3-way interactions on the Fe grade of the flotation concentrate, as shown in Table 3. As it can be seen, the P-value obtained for solid percent, collector concentration, depressant type and concentration, collector ratio, conditioning time, and activator concentration is lower than the adopted significance level (0.05). Hence, they are significant for the Fe grade of the concentrate among the main effects. However, a comparison between the F-values showed that the collector ratio had the most significant effect followed by the interaction between the collector concentration and the depressant type. On the other hand, the magnet and pH value have the least significant effects; even less than the third interaction
between the solid percent, dispersant concentration, and collector ratio. The depressant type was the third significant parameter but its interaction with the collector concentration was more significant. This emphasizes the role of interactions between the parameters in flotation. A model was proposed by the Minitab 17 software for prediction of the Fe grade of the concentrate, as shown in Table 3. The P-value obtained for the model is lower than the adopted significance level (0.05), which confirms the model validity. Furthermore, the values obtained for R2, adj-R2, and pred-R2 are very close to unity, which further confirm the validity of the proposed model for prediction of Fe grade of the concentrate at different operating conditions. Figure 6 shows the Pareto chart of the main effects and the two-way and three-way interactions studied on the Fe grade of the flotation concentrate. As it can be seen, the collector ratio has the greatest effect on the Fe grade of the concentrate. Afterwards, the two-way interaction between the collector concentration and the depressant type and the two-way interaction between the depressant and the activator concentrations are effective on the Fe grade of the concentrate, respectively. Figure 7 shows the normal plot of the main effects and their interactions on the Fe grade of the flotation concentrate. As it can be seen, the interaction between the collector concentration and the depressant type has the most positive effect on the Fe grade of the concentrate. The two-way interaction between the depressant and activator concentrations, the two-way interaction between the solid content and the type of depressant, and the two-way interaction between the solid content and the magnet have positive effects on the Fe grade of the flotation concentrate. Among the main effects, the conditioning time, collector concentration, and pH have positive effects on the Fe grade of the flotation concentrate, respectively. Among the main effects and their interactions, the collector ratio, depressant type, activator concentration, two-way interaction of pH and activator concentration, two-way interaction of pH and depressant type, two-way interaction of pH and solid content, and the depressant concentration have negative effects on the Fe grade of the flotation concentrate, respectively.
Ghasemi et al./ Journal of Mining & Environment, Vol. 10, No. 3, 2019
736
Figure 4. Main effect plots for the Fe grade of the flotation concentrate.
Figure 5. The two-way interaction plots for Fe grade of concentrate during the anionic reverse flotation of the
sample.
4020
47.0
46.5
46.0
45.5128 51 SiStarch 405
7030
47.0
46.5
46.0
45.5101 51 YesNo
Solid percent
Mea
n of
Con
c. F
e gr
ade
pH Collector conc. (kg/t) Depressant Type Depressant Conc. (kg/t)
Collector Ratio Conditioning Time (min) Activator Ca conc. (kg/t) Magnet
Main Effects Plot for Conc. Fe gradeFitted Means
All displayed terms are in the model.
48.0
46.5
45.0
48.0
46.5
45.0
48.0
46.5
45.048.0
46.5
45.0
48.0
46.5
45.0
48.0
46.5
45.0
48.0
46.5
45.0
4020
48.0
46.5
45.0128 51 SiStarch 405 7030 101 51
So lid p ercen * p H
So lid p ercen * Co llect o r co p H * Co llecto r co
So lid p ercen * Dep ressan t T p H * Dep ressan t T Co llecto r co * Dep ressan t T
So lid p ercen * Dep ressan t C p H * Dep ressan t C Co llecto r co * Dep ressan t C Dep ressan t T * Dep ressan t C
So lid p ercen * Co llect o r Ra p H * Co llecto r Ra Co llecto r co * Co llecto r Ra Dep ressan t T * Co llecto r Ra Dep ressan t C * Co llecto r Ra
So l id p ercen * Co n d iti o n in g p H * Co n d itio n in g Co llecto r co * Co n d it io n in g Dep ressan t T * Co n d i tio n in g Dep ressan t C * Co n d i tio n in g Co llecto r Ra * Co n d i tio n in g
So lid p ercen * Activ at o r Ca p H * Activ ato r Ca Co llecto r co * Activ ato r Ca Dep ressan t T * Activ ato r Ca Dep ressan t C * Activ ato r Ca Co llecto r Ra * Activ ato r Ca Co n d itio n in g * Act iv ato r Ca
So lid p ercen * Mag n et
Solid percent
p H * Mag n et
pH
Co llecto r co * Mag n et
Collector co
Dep ressan t T * Mag n et
Depressant T
Dep ressan t C * Mag n et
Depressant C
Co llecto r Ra * Mag n et
Collector Ra
Co n d iti o n in g * M ag n et
Conditioning
Activ at o r Ca * M ag n et
Activator Ca
812
pH
15
Collector co
StarchSi
Depressant T
540
Depressant C
3070
Collector Ra
110
Conditioning
15
Activator Ca
NoYes
Magnet
Mea
n of
Con
c. F
e gr
ade
Interaction Plot for Conc. Fe gradeMeans
A gray background represents a term not in the model.
Ghasemi et al./ Journal of Mining & Environment, Vol. 10, No. 3, 2019
737
Table 3. ANOVA analysis of Fe grade of concentrate. Analysis of Variance
Source DF Adj SS Adj MS F-Value P-Value Model 27 134.665 4.9876 154.43 0.000 Linear 9 56.086 6.2318 192.95 0.000
Solid percent 1 1.100 1.0996 34.05 0.004 pH 1 0.105 0.1051 3.26 0.146
Collector conc. (kg/t) 1 3.814 3.8140 118.09 0.000 Dispersant Type 1 11.321 11.3215 350.53 0.000
Dispersant Conc. (kg/t) 1 5.171 5.1710 160.10 0.000 Collector Ratio 1 16.667 16.6665 516.03 0.000
Conditioning Time (min) 1 8.390 8.3903 259.78 0.000 Activator Ca conc. (kg/t) 1 9.423 9.4229 291.75 0.000
Magnet 1 0.095 0.0952 2.95 0.161 2-Way Interactions 17 78.282 4.6048 142.57 0.000 Solid percent*pH 1 5.376 5.3755 166.44 0.000
Solid percent*Dispersant Type 1 9.401 9.4008 291.07 0.000 Solid percent*Dispersant Conc. (kg/t) 1 7.192 7.1917 222.67 0.000
Solid percent*Collector Ratio 1 0.753 0.7527 23.30 0.008 Solid percent*Conditioning Time (min) 1 1.411 1.4108 43.68 0.003
Solid percent*Magnet 1 9.267 9.2671 286.93 0.000 pH*Collector conc. (kg/t) 1 0.694 0.6937 21.48 0.010
pH*Dispersant Type 1 5.606 5.6055 173.56 0.000 pH*Dispersant Conc. (kg/t) 1 3.270 3.2698 101.24 0.001
pH*Activator Ca conc. (kg/t) 1 7.925 7.9249 245.37 0.000 pH*Magnet 1 1.362 1.3618 42.16 0.003
Collector conc. (kg/t)*Dispersant Type 1 11.577 11.5766 358.43 0.000 Collector conc. (kg/t)*Dispersant Conc. (kg/t) 1 0.146 0.1455 4.51 0.101
Collector conc. (kg/t)*Magnet 1 3.032 3.0323 93.89 0.001 Dispersant Conc. (kg/t)*Collector Ratio 1 0.486 0.4861 15.05 0.018
Dispersant Conc. (kg/t)*Activator Ca conc. (kg/t) 1 10.318 10.3178 319.46 0.000 Dispersant Conc. (kg/t)*Magnet 1 0.469 0.4694 14.53 0.019
3-Way Interactions 1 0.297 0.2967 9.19 0.039 Solid percent*Dispersant Conc. (kg/t)*Collector Ratio 1 0.297 0.2967 9.19 0.039
Error 4 0.129 0.0323 Total 31 134.794
Model: Conc. Fe grade = 35.156 + 0.2204 Solid percent + 1.3326 pH + 0.5841 Collector conc. (kg/t) - 1.030 Dispersant Type + 0.0031 Dispersant Conc. (kg/t) + 0.01341 Collector Ratio + 0.2538 Conditioning Time (min) + 0.6078 Activator Ca conc. (kg/t) - 1.146 Magnet - 0.02049 Solid percent*pH + 0.05420 Solid percent*Dispersant Type + 0.001333 Solid percent*Dispersant Conc. (kg/t) - 0.001386 Solid percent*Collector Ratio - 0.004666 Solid percent*Conditioning Time (min) + 0.05381 Solid percent*Magnet - 0.03681 pH*Collector conc. (kg/t) - 0.2093 pH*Dispersant Type - 0.009133 pH*Dispersant Conc. (kg/t) - 0.12441 pH*Activator Ca conc. (kg/t) - 0.1031 pH*Magnet + 0.3007 Collector conc. (kg/t)*Dispersant Type - 0.001927 Collector conc. (kg/t)*Dispersant Conc. (kg/t) + 0.1539 Collector conc. (kg/t)*Magnet - 0.001177 Dispersant Conc. (kg/t)*Collector Ratio + 0.016224 Dispersant Conc. (kg/t)*Activator Ca conc. (kg/t) + 0.00692 Dispersant Conc. (kg/t)*Magnet + 0.000028 Solid percent*Dispersant Conc. (kg/t)*Collector Ratio Model Summary: S R-sq R-sq(adj) R-sq(pred) 0.179716 99.90% 99.26% 93.87%
Ghasemi et al./ Journal of Mining & Environment, Vol. 10, No. 3, 2019
738
Figure 6. Pareto chart of the main effects and their interactions studied on the Fe grade of flotation concentrate.
Figure 7. Normal plot of the main effects and their interactions for the Fe grade of the flotation concentrate.
The maximum Fe grade of the concentrate was obtained as 53.92% by the Minitab response optimizer. It was obtained at the flotation test conditions of solid content 20%, pH of 12, collector concentration of 1 kg/t, starch as depressant at concentration of 5 kg/t, Alke/Dirol collector mass ratio of 30/70, conditioning time of 10 min, concentration of Ca2+ ions of 1 kg/t (as the activator), and in the absence of the magnet.
At these flotation conditions, the mass recovery of the concentrate was obtained to be 60%. Figure 8 shows the effects of the main factors on the mass recovery of the flotation concentrate in the reverse anionic flotation process. As it can be seen, increasing the solid content from 20% to 40% has a negligible effect on the mass recovery of the flotation concentrate, and it reduces from 79.03% to 77.31%. The mass recovery of the
Term
JB
CEAEF
EJEFBCAFA
BJAGCJBECE
ABBDAEBH
GAJ
ADH
EHD
CDF
2520151050
A Solid percentB pHC Collector conc. (kg/t)D Depressant TypeE Depressant Conc. (kg/t)F Collector RatioG Conditioning Time (min)H Activator Ca conc. (kg/t)J Magnet
Factor Name
Standardized Effect
1.78
Pareto Chart of the Standardized Effects(response is Conc. Fe grade, α = 0.15)
20100-10-20
99
95
90
80
7060504030
20
10
5
1
A Solid percentB pHC Collector conc. (kg/t)D Depressant TypeE Depressant Conc. (kg/t)F Collector RatioG Conditioning Time (min)H Activator Ca conc. (kg/t)J Magnet
Factor Name
Standardized Effect
Perc
ent
Not SignificantSignificant
Effect Type
AEFEJ
EH
EF
CJ
CE
CD
BJ
BH
BE
BD
BC
AJ
AGAF
AE
AD
AB
H
G
F
E
D
C
B
A
Normal Plot of the Standardized Effects(response is Conc. Fe grade, α = 0.15)

Ghasemi et al./ Journal of Mining & Environment, Vol. 10, No. 3, 2019
739
concentrate decreases from 78.54% to 77.87% by increasing the pulp pH from 8 to 12. The collector concentration has a negative effect on the mass recovery of the concentrate, so increasing the collector concentration from 1 kg/t to 5 kg/t reduces the mass recovery of the concentrate from 83.79% to 72.55%. The mass recovery of the concentrate decreases from 83.19% to 73.15% when using starch instead of sodium silicate as the depressant. Sodium silicate has some depressing effects on the silicate minerals apart from iron minerals. As a result, the mass recovery of the concentrate of the reverse flotation increases using sodium silicate as the depressant, while the Fe grade of the concentrate decreases. The mass recovery of the concentrate increases from 77.44% to 78.9% by increasing the depressant concentration from 5 kg/t to 40 kg/t. The mass recovery of the concentrate increases from 75.27% to 81.77% by increasing the mass ratio of the Alke/Dirol collectors from 30/70 to 70/30.
Thus when the amount of the Dirol collector is higher than that for the Alke collector, a concentrate with a higher Fe grade is obtained but the mass recovery of the concentrate is reduced. Increasing the conditioning time from 1 to 10 min leads to a loss in the mass recovery of the concentrate, and it decreases from 80.02% to 76.32%. The reason for this is that by increasing the conditioning time, the opportunity for collector adsorption on the gangue mineral surfaces increases, and thus their hydrophobicity increases. The mass recovery of the concentrate increases from 76.97% to 79.55% by increasing the calcium ion concentration from 1 kg/t to 5 kg/t. Finally, the presence of a magnet under the flotation cell causes an increase in the mass recovery of the concentrate from 75.17 to 81.17%. The reason for this is that the presence of a magnet under the flotation cell attracts the iron minerals and prevents from their flotation.
Figure 8. Main effect plots for the mass recovery of the flotation concentrate.
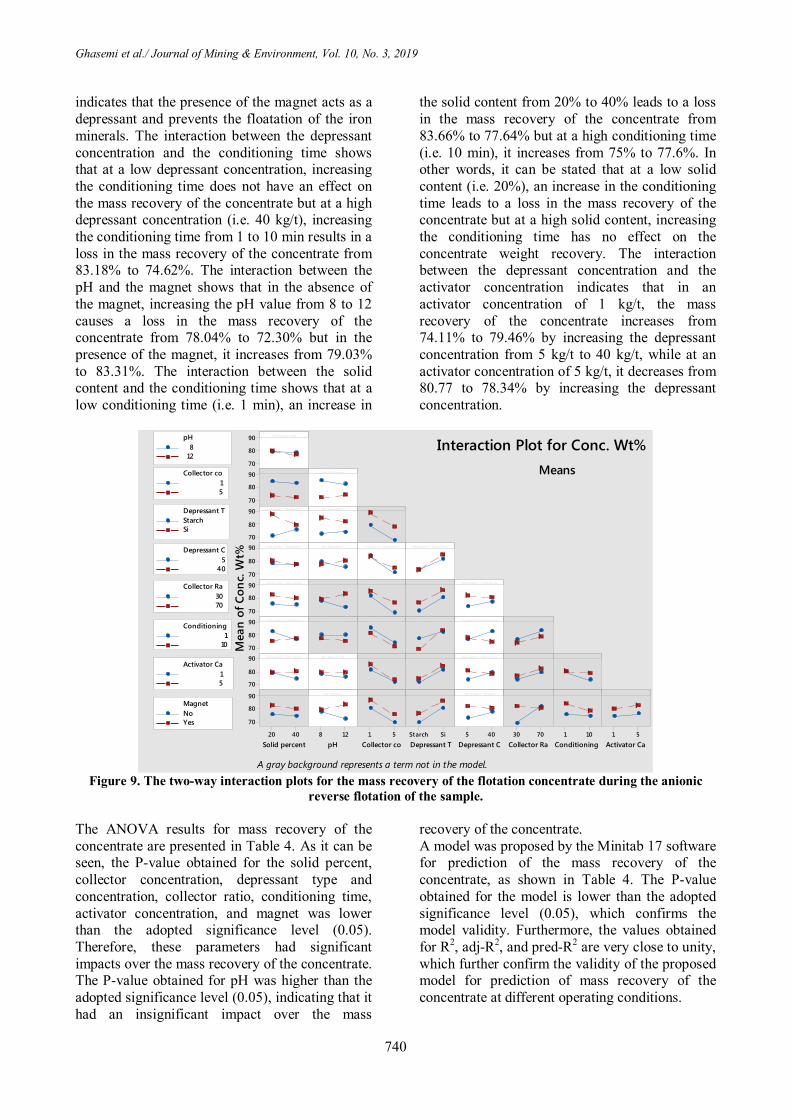
Figure 9 shows the two-way interaction plots for the mass recovery of the reverse flotation concentrate. The interaction between the solid content and the depressant type shows that when using sodium silicate as the depressant, increasing the solid content from 20% to 40% leads to a reduction in the mass recovery of the concentrate from 87.5% to 78.88%, while by using starch as the depressant, it increases from 70.56% to 75.74%. The interaction between the depressant
concentration and the magnet shows that in the presence of the magnet, the mass recovery of the concentrate decreases from 82.08% to 80.26% by increasing the concentration of the depressant from 5 kg/t to 40 kg/t, while in the absence of the magnet, it increases from 72.8% to 77.54%. It can be seen that in the presence of the magnet and at a low concentration of the depressant, the mass recovery of the concentrate is 82.88% but in the absence of the magnet, its amount is 72.08%. This
4020
84
81
78
75
72128 51 SiStarch 405
7030
84
81
78
75
72101 51 YesNo
Solid percent
Mea
n of
Con
c. W
t%
pH Collector conc. (kg/t) Depressant Type Depressant Conc. (kg/t)
Collector Ratio Conditioning Time (min) Activator Ca conc. (kg/t) Magnet
Main Effects Plot for Conc. Wt%Fitted Means
All displayed terms are in the model.
Ghasemi et al./ Journal of Mining & Environment, Vol. 10, No. 3, 2019
740
indicates that the presence of the magnet acts as a depressant and prevents the floatation of the iron minerals. The interaction between the depressant concentration and the conditioning time shows that at a low depressant concentration, increasing the conditioning time does not have an effect on the mass recovery of the concentrate but at a high depressant concentration (i.e. 40 kg/t), increasing the conditioning time from 1 to 10 min results in a loss in the mass recovery of the concentrate from 83.18% to 74.62%. The interaction between the pH and the magnet shows that in the absence of the magnet, increasing the pH value from 8 to 12 causes a loss in the mass recovery of the concentrate from 78.04% to 72.30% but in the presence of the magnet, it increases from 79.03% to 83.31%. The interaction between the solid content and the conditioning time shows that at a low conditioning time (i.e. 1 min), an increase in
the solid content from 20% to 40% leads to a loss in the mass recovery of the concentrate from 83.66% to 77.64% but at a high conditioning time (i.e. 10 min), it increases from 75% to 77.6%. In other words, it can be stated that at a low solid content (i.e. 20%), an increase in the conditioning time leads to a loss in the mass recovery of the concentrate but at a high solid content, increasing the conditioning time has no effect on the concentrate weight recovery. The interaction between the depressant concentration and the activator concentration indicates that in an activator concentration of 1 kg/t, the mass recovery of the concentrate increases from 74.11% to 79.46% by increasing the depressant concentration from 5 kg/t to 40 kg/t, while at an activator concentration of 5 kg/t, it decreases from 80.77 to 78.34% by increasing the depressant concentration.
Figure 9. The two-way interaction plots for the mass recovery of the flotation concentrate during the anionic
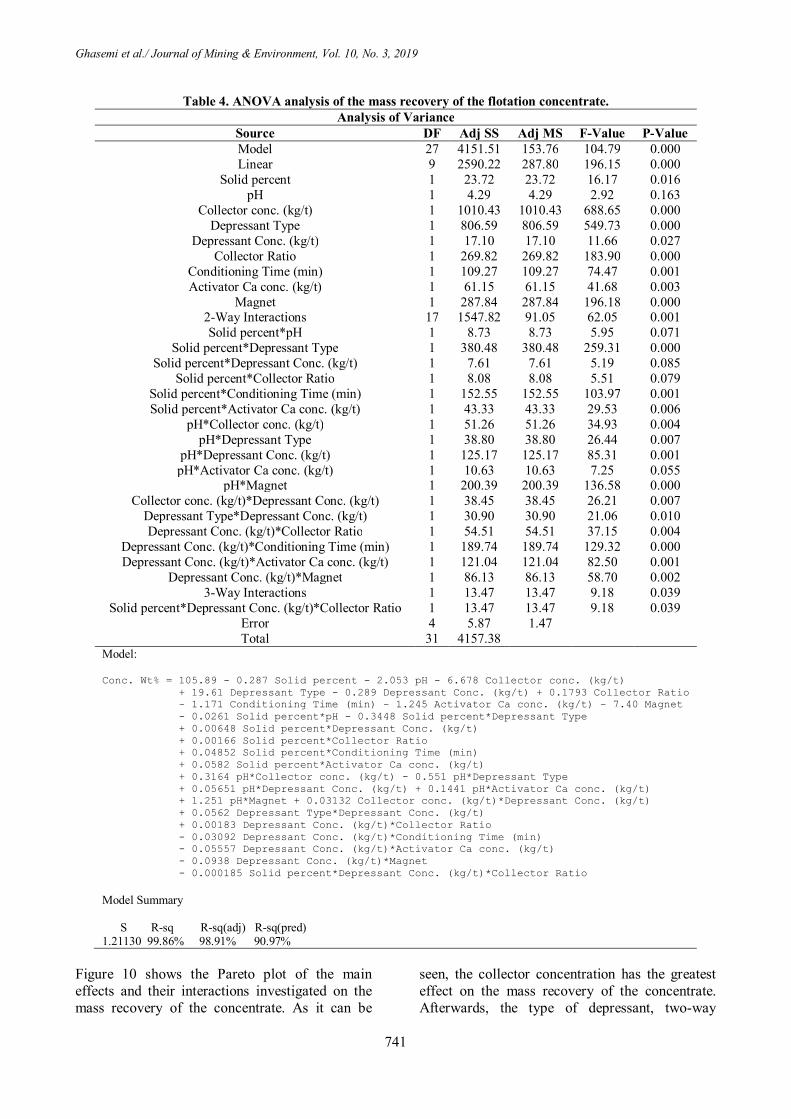
reverse flotation of the sample. The ANOVA results for mass recovery of the concentrate are presented in Table 4. As it can be seen, the P-value obtained for the solid percent, collector concentration, depressant type and concentration, collector ratio, conditioning time, activator concentration, and magnet was lower than the adopted significance level (0.05). Therefore, these parameters had significant impacts over the mass recovery of the concentrate. The P-value obtained for pH was higher than the adopted significance level (0.05), indicating that it had an insignificant impact over the mass
recovery of the concentrate. A model was proposed by the Minitab 17 software for prediction of the mass recovery of the concentrate, as shown in Table 4. The P-value obtained for the model is lower than the adopted significance level (0.05), which confirms the model validity. Furthermore, the values obtained for R2, adj-R2, and pred-R2 are very close to unity, which further confirm the validity of the proposed model for prediction of mass recovery of the concentrate at different operating conditions.
90
80
70
90
80
70
90
80
70
90
80
70
90
80
70
90
80
70
90
80
70
4020
90
80
70
128 51 SiStarch 405 7030 101 51
Solid percen * pH
S olid pe rce n * Co llector co pH * Colle ctor co
S olid pe rce n * Depressan t T pH * De pre ssa nt T Colle ctor co * Depressan t T
S o lid pe rce n * Depressan t C pH * De pre ssa nt C Colle ctor co * Depressan t C Depressa nt T * De pre ssan t C
S olid pe rce n * Co llector Ra pH * Co lle ctor Ra Collector co * Co llector Ra Depressa nt T * Co llector Ra Depressa nt C * Co llector Ra
S olid pe rce n * Condition ing pH * Condition ing Colle ctor co * Condition ing De pre ssa nt T * Condition ing De pre ssa nt C * Condition ing Colle ctor Ra * Condition ing
S olid pe rce n * Activa tor Ca pH * Activ a tor Ca Collector co * Activa tor Ca Depressa nt T * Activa tor Ca Depressa nt C * Activa tor Ca Colle ctor Ra * Activa tor Ca Conditioning * Activa tor Ca
Solid pe rcen * M agne t
Solid percent
pH * Ma gne t
pH
Colle ctor co * M agne t
Collector co
De pre ssa n t T * M agne t
Depressant T
De pre ssa n t C * M agne t
Depressant C
Colle ctor Ra * M agne t
Collector Ra
Condition ing * Ma gne t
Conditioning
Activa tor Ca * M agnet
Activator Ca
812
pH
15
Collector co
StarchSi
Depressant T
540
Depressant C
3070
Collector Ra
110
Conditioning
15
Activator Ca
NoYes
Magnet
Mea
n of
Con
c. W
t%
Interaction Plot for Conc. Wt%Means
A gray background represents a term not in the model.
Ghasemi et al./ Journal of Mining & Environment, Vol. 10, No. 3, 2019
741
Table 4. ANOVA analysis of the mass recovery of the flotation concentrate. Analysis of Variance
Source DF Adj SS Adj MS F-Value P-Value Model 27 4151.51 153.76 104.79 0.000 Linear 9 2590.22 287.80 196.15 0.000
Solid percent 1 23.72 23.72 16.17 0.016 pH 1 4.29 4.29 2.92 0.163
Collector conc. (kg/t) 1 1010.43 1010.43 688.65 0.000 Depressant Type 1 806.59 806.59 549.73 0.000
Depressant Conc. (kg/t) 1 17.10 17.10 11.66 0.027 Collector Ratio 1 269.82 269.82 183.90 0.000
Conditioning Time (min) 1 109.27 109.27 74.47 0.001 Activator Ca conc. (kg/t) 1 61.15 61.15 41.68 0.003
Magnet 1 287.84 287.84 196.18 0.000 2-Way Interactions 17 1547.82 91.05 62.05 0.001 Solid percent*pH 1 8.73 8.73 5.95 0.071
Solid percent*Depressant Type 1 380.48 380.48 259.31 0.000 Solid percent*Depressant Conc. (kg/t) 1 7.61 7.61 5.19 0.085
Solid percent*Collector Ratio 1 8.08 8.08 5.51 0.079 Solid percent*Conditioning Time (min) 1 152.55 152.55 103.97 0.001 Solid percent*Activator Ca conc. (kg/t) 1 43.33 43.33 29.53 0.006
pH*Collector conc. (kg/t) 1 51.26 51.26 34.93 0.004 pH*Depressant Type 1 38.80 38.80 26.44 0.007
pH*Depressant Conc. (kg/t) 1 125.17 125.17 85.31 0.001 pH*Activator Ca conc. (kg/t) 1 10.63 10.63 7.25 0.055
pH*Magnet 1 200.39 200.39 136.58 0.000 Collector conc. (kg/t)*Depressant Conc. (kg/t) 1 38.45 38.45 26.21 0.007
Depressant Type*Depressant Conc. (kg/t) 1 30.90 30.90 21.06 0.010 Depressant Conc. (kg/t)*Collector Ratio 1 54.51 54.51 37.15 0.004
Depressant Conc. (kg/t)*Conditioning Time (min) 1 189.74 189.74 129.32 0.000 Depressant Conc. (kg/t)*Activator Ca conc. (kg/t) 1 121.04 121.04 82.50 0.001
Depressant Conc. (kg/t)*Magnet 1 86.13 86.13 58.70 0.002 3-Way Interactions 1 13.47 13.47 9.18 0.039
Solid percent*Depressant Conc. (kg/t)*Collector Ratio 1 13.47 13.47 9.18 0.039 Error 4 5.87 1.47 Total 31 4157.38
Model: Conc. Wt% = 105.89 - 0.287 Solid percent - 2.053 pH - 6.678 Collector conc. (kg/t) + 19.61 Depressant Type - 0.289 Depressant Conc. (kg/t) + 0.1793 Collector Ratio - 1.171 Conditioning Time (min) - 1.245 Activator Ca conc. (kg/t) - 7.40 Magnet - 0.0261 Solid percent*pH - 0.3448 Solid percent*Depressant Type + 0.00648 Solid percent*Depressant Conc. (kg/t) + 0.00166 Solid percent*Collector Ratio + 0.04852 Solid percent*Conditioning Time (min) + 0.0582 Solid percent*Activator Ca conc. (kg/t) + 0.3164 pH*Collector conc. (kg/t) - 0.551 pH*Depressant Type + 0.05651 pH*Depressant Conc. (kg/t) + 0.1441 pH*Activator Ca conc. (kg/t) + 1.251 pH*Magnet + 0.03132 Collector conc. (kg/t)*Depressant Conc. (kg/t) + 0.0562 Depressant Type*Depressant Conc. (kg/t) + 0.00183 Depressant Conc. (kg/t)*Collector Ratio - 0.03092 Depressant Conc. (kg/t)*Conditioning Time (min) - 0.05557 Depressant Conc. (kg/t)*Activator Ca conc. (kg/t) - 0.0938 Depressant Conc. (kg/t)*Magnet - 0.000185 Solid percent*Depressant Conc. (kg/t)*Collector Ratio Model Summary S R-sq R-sq(adj) R-sq(pred) 1.21130 99.86% 98.91% 90.97%
Figure 10 shows the Pareto plot of the main effects and their interactions investigated on the mass recovery of the concentrate. As it can be
seen, the collector concentration has the greatest effect on the mass recovery of the concentrate. Afterwards, the type of depressant, two-way

Ghasemi et al./ Journal of Mining & Environment, Vol. 10, No. 3, 2019
742
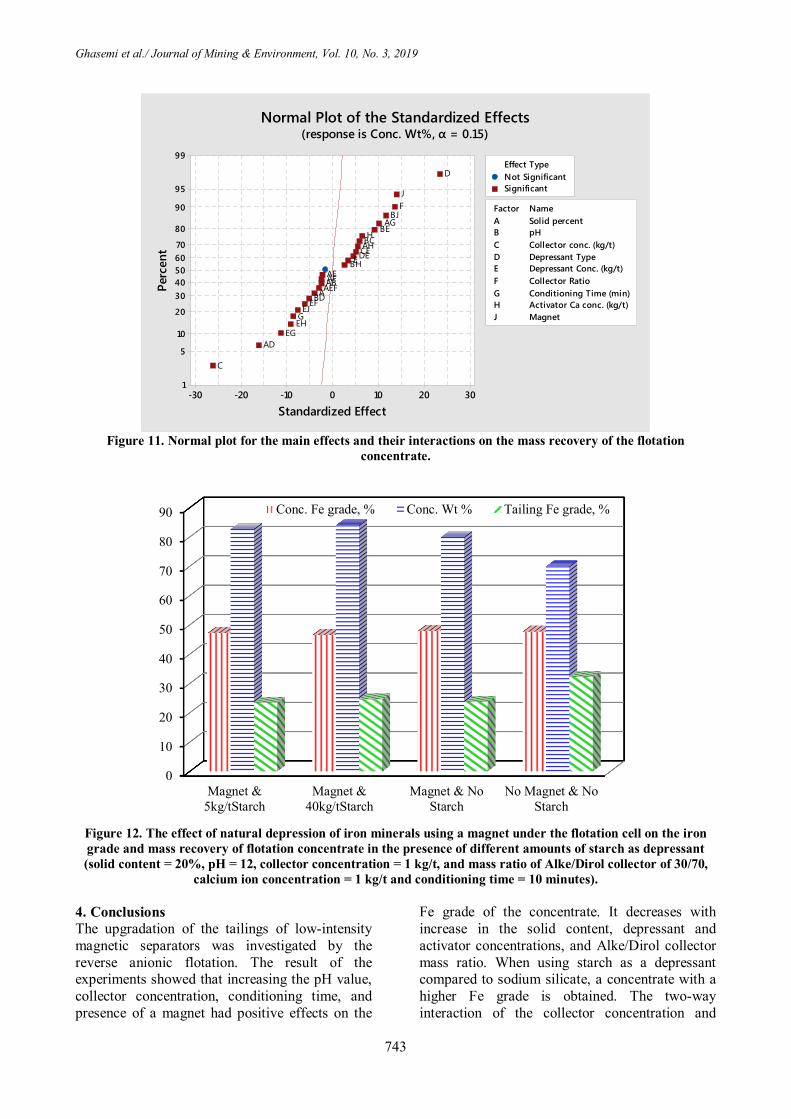
interaction of the solid content and the type of depressant, the magnet, collector ratio, two-way interaction of pH and magnet, two-way interaction of the depressant concentration and the conditioning time, two-way interaction of the solid content and conditioning time, two-way interaction of pH and the concentration of depressant, two-way interaction of the depressant and activator concentration, and the conditioning time affect the process, respectively. Figure 11 shows the normal plot of the main effects and their interactions on the mass recovery of the concentrate. As it can be seen, the depressant type has the most positive effect on the process, and then the magnet, collector ratio, the two-way interaction of pH and magnet, the two-way interaction of the solid content and the conditioning time, the two-way interaction of the pH and the depressant concentration, and activator concentration have positive effects on the mass recovery of the concentrate, respectively. The collector concentration has the most negative effect on the mass recovery of the concentrate. After that, two-way interaction of the solid content and the depressant type, two-way interaction of the depressant concentration and conditioning time, the two-way interaction of the depressant and activator concentrations, conditioning time, the two-way interaction of the depressant concentration and magnet, the two-way interaction of the depressant concentration and collector ratio, the two-way interaction of the pH and the type of depressant and solid content have negative effects on the mass recovery of the flotation concentrate, respectively.
The results of the flotation tests showed that the presence of a magnet under the flotation cell in the reverse flotation of iron ore had no significant effect on the Fe grade of the flotation concentrate, while it had a significant positive effect on the mass recovery of the flotation concentrate. In order to investigate the effect of the magnet on the amount of depressant consumption in the reverse flotation, a series of flotation tests was performed. In one test, no magnet was present and no depressant was added. In the other tests, the magnet was present but the amount of depressant was variable. The results obtained are presented in Figure 12. As it can be seen, in the absence of the magnet and the depressant, the Fe grade of the flotation tailing (i.e. froth phase) is high and the mass recovery of the concentrate is low. In the presence of the magnet and without depressant addition, the mass recovery of the concentrate increases from 70% to 80%, the Fe grade of the concentrate remains without any change, and the Fe grade of the flotation tailing decreases from 32.2% to 23.7%. In the presence of the magnet, addition of 5 kg/t of starch, as the depressant, has no significant effect on the Fe grade of the concentrate, while the mass recovery of the concentrate increases slightly from 80% to 82.75%. Further increasing the dosage of starch to 40 kg/t in the presence of the magnet has no significant effect on both of the Fe grade and mass recovery of the flotation concentrate. Therefore, the results of these tests showed that the presence of a magnet could play the role of the depressant in the reverse flotation of an iron ore.
Figure 10. Pareto plot for the main effects and their interactions on the mass recovery of the flotation
concentrate.
Term
BAEAFABBH
AEFEA
DECEBDAHBCEFHEJG
EHBE
AGEGBJFJ
ADDC
302520151050
A Solid percentB pHC Collector conc. (kg/t)D Depressant TypeE Depressant Conc. (kg/t)F Collector RatioG Conditioning Time (min)H Activator Ca conc. (kg/t)J Magnet
Factor Name
Standardized Effect
1.78
Pareto Chart of the Standardized Effects(response is Conc. Wt%, α = 0.15)
Ghasemi et al./ Journal of Mining & Environment, Vol. 10, No. 3, 2019
743
Figure 11. Normal plot for the main effects and their interactions on the mass recovery of the flotation
concentrate.
Figure 12. The effect of natural depression of iron minerals using a magnet under the flotation cell on the iron grade and mass recovery of flotation concentrate in the presence of different amounts of starch as depressant (solid content = 20%, pH = 12, collector concentration = 1 kg/t, and mass ratio of Alke/Dirol collector of 30/70,
calcium ion concentration = 1 kg/t and conditioning time = 10 minutes). 4. Conclusions The upgradation of the tailings of low-intensity magnetic separators was investigated by the reverse anionic flotation. The result of the experiments showed that increasing the pH value, collector concentration, conditioning time, and presence of a magnet had positive effects on the
Fe grade of the concentrate. It decreases with increase in the solid content, depressant and activator concentrations, and Alke/Dirol collector mass ratio. When using starch as a depressant compared to sodium silicate, a concentrate with a higher Fe grade is obtained. The two-way interaction of the collector concentration and
3020100-10-20-30
99
95
90
80
7060504030
20
10
5
1
A Solid percentB pHC Collector conc. (kg/t)D Depressant TypeE Depressant Conc. (kg/t)F Collector RatioG Conditioning Time (min)H Activator Ca conc. (kg/t)J Magnet
Factor Name
Standardized Effect
Perc
ent
Not SignificantSignificant
Effect Type
AEF
EJ
EHEG
EF
DECE
BJ
BH
BE
BD
BCAH
AG
AFAE
AD
AB
J
H
G
F
E
D
C
A
Normal Plot of the Standardized Effects(response is Conc. Wt%, α = 0.15)
0
10
20
30
40
50
60
70
80
90
Magnet &5kg/tStarch
Magnet &40kg/tStarch
Magnet & NoStarch
No Magnet & NoStarch
Conc. Fe grade, % Conc. Wt % Tailing Fe grade, %
Ghasemi et al./ Journal of Mining & Environment, Vol. 10, No. 3, 2019
744
depressant type and the effect of the collector mass ratio had the most positive and negative effects on the Fe grade of the concentrate, respectively. At the flotation test conditions of solid content of 20%, pH of 12, collector concentration of 1 kg/t, starch as the depressant at a concentration of 5 kg/t, Alke/Dirol collector mass ratio of 30/70, conditioning time of 10 min, Ca2+ as the activator at a concentration of 1 kg/t, and in the absence of a magnet, a concentrate with a maximum Fe grade of 53.92% and a mass recovery of 60% were obtained. The mass recovery of the concentrate increases with increase in the depressant and activator concentrations, and Alke/Dirol collector mass ratio. The mass recovery of the concentrate decreased from 83.19% to 73.15% using starch instead of sodium silicate as the depressant. The mass recovery of the concentrate increased from 75.17% to 81.17% when a magnet was placed under the flotation cell. The increase in the solid content, pH, collector concentration, and conditioning time had negative effects on the mass recovery of the concentrate. The collector concentration and depressant type had the most negative and positive effects on the mass recovery of the concentrate, respectively. The test results showed that natural depression of iron minerals occurred in the reverse flotation of iron ores through placement of a magnet under the flotation cell. The mass recovery of the flotation concentrate increases sharply by applying this technique, while it has no significant effect on the Fe grade of the flotation concentrate. A concentrate of 47.94% of Fe and mass recovery of 80% was obtained by placement of a magnet under the flotation cell without any addition of starch as the depressant. In the presence of the magnet, addition of starch as the depressant slightly increases the mass recovery of the flotation concentrate, while it has no significant effect on the Fe grade of the concentrate. Hence, the presence of a magnet under the flotation cell could play the role of depressant in the reverse flotation process of the iron ore samples, and this flotation process could be perform without any depressant addition.
Acknowledgments The authors of the paper wish to express their deep gratitude to the Iranian Mines & Mining Industries Development & Renovation organization (IMIDRO) to provide part of the project costs and Mr. Arash Tohry for providing the collectors used in the experiments.
References [1]. Basson, E. (2018). World steel in figures 2018, World steel Association, Brussels, Belgium. 7 P.
[2]. Li, C., Sun, H., Bai, J. and Li, L. (2010). Innovative methodology for comprehensive utilization of iron ore tailings: Part 1. The recovery of iron from iron ore tailings using magnetic separation after magnetizing roasting. J. Hazard. Mater. 174 (1-3): 71-77.
[3]. Svoboda, J. and Fujita, T. (2003). Recent developments in magnetic methods of material separation. Miner. Eng. 16 (9): 785-792.
[4]. Ersayin, S. (2004). Low intensity magnetic separator modelling: a pseudo liberation approach. Miner. Process. Extr. Metall. 113 (3): 167-174.
[5]. Das, S.K., Kumar, S. and Ramachandrarao, P. (2000). Exploitation of iron ore tailing for the development of ceramic tiles. Waste Manag. 20 (8): 725-729.
[6]. Ghose, M.K. and Sen, P.K. (2001). Characteristics of iron ore tailing slime in India and its test for required pond size. Environ. Monit. Assess. 68 (1): 51-61.
[7]. Dudka, S. and Adriano, D.C. (1997). Environmental impacts of metal ore mining and processing: a review. J. Environ. Qual. 26 (3): 590-602.
[8]. Dold, B. (2008). Sustainability in metal mining: from exploration, over processing to mine waste management. Rev. Environ. Sci. Biotechnol. 7 (4): 275.
[9]. Lottermoser, B.G. (2011). Recycling, reuse and rehabilitation of mine wastes. Elements. 7 (6): 405-410.
[10]. Kumar, R. and Mandre, N.R. (2017). Recovery of iron from iron ore slimes by selective flocculation. J. South. Afr. Inst. Min. Metall. 117 (4): 397-400.
[11]. Batisteli, G.M.B. and Peres, A.E.C. (2008). Residual amine in iron ore flotation. Miner. Eng. 21 (12-14): 873-876.
[12]. Das, B., Prakash, S., Das, S.K. and Reddy, P.S.R. (2007). Effective beneficiation of low grade iron ore through jigging operation. J. Miner. Mater. Char. Eng. 7 (1): 27-37.
[13]. Dworzanowski, M. (2012). Maximizing the recovery of fine iron ore using magnetic separation. J. South. Afr. Inst. Min. Metall. 112 (3): 197-202.
[14]. Rocha, L., Caneado, R.Z.L. and Peres, A.E.C. (2010). Iron ore flotation. Miner. Eng. 23 (11-13): 842-845.
[15]. Araujo, A.C., Viana, P.R.M. and Peres, A.E.C. (2005). Reagents in iron ores flotation. Miner. Eng. 18: 219-224.
[16]. Thella, J.S., Mukherjee, A.K. and Srikakulapu, N.G. (2012). Processing of high alumina iron ore
Ghasemi et al./ Journal of Mining & Environment, Vol. 10, No. 3, 2019
745
slimes using classification and flotation. Powder Technol. 217: 418-426.
[17]. Ma, X., Marques, M. and Gontijo, C. (2011). Comparative studies of reverse cationic/anionic flotation of Vale iron ore. Intern. J. Miner. Process. 100: 179-183.
[18]. Filippov, L.O., Severov, V.V. and Filippova, I.V. (2014). An overview of the beneficiation of iron ores via reverse cationic flotation. Intern. J. Miner. Process. 127: 62-69.
[19]. Mhonde, N.P., Wiese, J.G. and McFadzean, B. (2017). Comparison of collector performance for a South African and a Brazilian iron ore considering mineralogical characteristics. Miner. Eng. 113: 55-67.
[20]. Quast, K. (2017). An investigation of the flotation minimum in the oleate flotation of hematite under
alkaline conditions. Miner. Eng. 113: 71-82.
[21]. Arantes, R.S. and Lima, R.M.F. (2013). Influence of sodium silicate modulus on iron ore flotation with sodium oleate. Intern. J. Miner. Process. 125: 157-160.
[22]. Lima, N.P., Valadão, G.E.S. and Peres, A.E.C. (2013). Effect of amine and starch dosages on the reverse cationic flotation of an iron ore. Miner. Eng. 45: 180-184.
[23]. Kar, B., Sahoo, H., Rath, S.S. and Das, B. (2013). Investigations on different starches as depressants for iron ore flotation. Miner. Eng. 49: 1-6.
[24]. Tohry, A. and Dehghani, A. (2016). Effect of sodium silicate on the reverse anionic flotation of a siliceous–phosphorus iron ore. Sep. Purif. Technol. 164: 28-33.
1398وم، سال سدوره دهم، شماره زیست، پژوهشی معدن و محیط -و همکاران/ نشریه علمی قاسمی
سنگان به روش فلوتاسیون آهن سنگفرآوري مجدد باطله
2و رضا ارجمند *1، علی بهنام فرد1سلمان قاسمی
بخش مهندسی معدن، دانشکده مهندسی، دانشگاه بیرجند، ایران - 1 شرکت صنعتی و معدنی اپال پارسیان سنگان، خواف، ایران - 2
2/4/2019، پذیرش 24/2/2019ارسال
[email protected]* نویسنده مسئول مکاتبات:
چکیده:
کانسنگ آهنگوس براي پرعیارسازي 1300کارخانه فرآوري سنگان شامل چهار مرحله متوالی جدایش مغناطیسی شدت پایین با شدت میدان مغناطیسی مشابه شـوند. طلـه منتقـل مـی هاي گانگ فرصتی براي جدایش پیدا نکرده و بـه سـد با تر یا درگیر با کانیدار با پذیرش مغناطیسی پایینهاي آهنبنابراین، کانی؛ است
% FeO 1/12% و Fe 09/43اي با عیار ها است و در این پژوهش مورد توجه قرار گرفته است. نمونهفلوتاسیون یک تکنولوژي قدرتمند براي پرعیارسازي این کانیاي بـا عیـار آهـن منیتیت و هماتیت تعیین گردید. کنسانترهدار با ارزش این نمونه هاي آهناز باطله جدایش مغناطیسی مرحله دوم این کارخانه گرفته شد. کانی
% توسط تست دیویس تیوب تولید گردید. از رویکرد فلوتاسیون معکوس براي پرعیارسازي این نمونه استفاده شد. کلکتورهاي آنیونی از نوع 50% و بازیابی وزنی 67با IVسطح رزولوشنها با استفاده از طرح عاملی جزئی در یون استفاده شد. طراحی آزمایشهاي فلوتاسدر آزمایش Dirolو Alkeهاي تجاري اسید چرب با نام
اي با عیار آهـن هاي دوتایی را دارد. کنسانترهتوانایی تعیین تمامی اثرات اصلی و اندرکنش IVسطح رزولوشنعامل در دو سطح براي هر عامل به انجام رسید. 9، نشاسته به عنوان بازداشـت کننـده بـا kg/t1، غلظت کلکتور 12برابر با pH%، 20شرایط بهینه فلوتاسیون شامل درصد جامد % در60% با بازیابی وزنی 92/53
حاصل شد. در kg/t1کننده با غلظت به عنوان فعال +Ca2و یون دقیقه 10سازي ، زمان آماده70/30برابر با Alke/Dirol، نسبت جرمی کلکتور kg/t5غلظت دار در فلوتاسیون معکوس معرفی و ارزیابی گردید. هاي آهنهش همچنین مفهوم بازداشت طبیعی کانیاین پژو
، پرعیارسازي، فلوتاسیون معکوس، کلکتور آنیونی، بازداشت طبیعی.آهن کانسنگباطله کلمات کلیدي: