iron ore - delivering optimal value - rio tinto · pdf fileinvestor roadshow – august...
TRANSCRIPT
Investor roadshow – August 2017
Iron Ore - delivering optimal value
Chris Salisbury, chief executive, Iron Ore

| © Rio Tinto 2017
Cautionary statements
This presentation has been prepared by Rio Tinto plc and Rio Tinto Limited (“Rio Tinto”). By accessing/attending this presentation you acknowledge that you have read and understood the following statement.
Forward-looking statements
This document contains certain forward-looking statements with respect to the financial condition, results of operations and business of the Rio Tinto Group. These statements are forward-looking statements within the meaning of Section 27A of the US Securities Act of 1933, and Section 21E of the US Securities Exchange Act of 1934. The words “intend”, “aim”, “project”, “anticipate”, “estimate”, “plan”, “believes”, “expects”, “may”, “should”, “will”, “target”, “set to” or similar expressions, commonly identify such forward-looking statements.
Examples of forward-looking statements include those regarding estimated ore reserves, anticipated production or construction dates, costs, outputs and productive lives of assets or similar factors. Forward-looking statements involve known and unknown risks, uncertainties, assumptions and other factors set forth in this presentation.
For example, future ore reserves will be based in part on market prices that may vary significantly from current levels. These may materially affect the timing and feasibility of particular developments. Other factors include the ability to produce and transport products profitably, demand for our products, changes to the assumptions regarding the recoverable value of our tangible and intangible assets, the effect of foreign currency exchange rates on market prices and operating costs, and activities by governmental authorities, such as changes in taxation or regulation, and political uncertainty.
In light of these risks, uncertainties and assumptions, actual results could be materially different from projected future results expressed or implied by these forward-looking statements which speak only as to the date of this presentation. Except as required by applicable regulations or by law, the Rio Tinto Group does not undertake any obligation to publicly update or revise any forward-looking statements, whether as a result of new information or future events. The Group cannot guarantee that its forward-looking statements will not differ materially from actual results. In this presentation all figures are US dollars unless stated otherwise.
Disclaimer
Neither this presentation, nor the question and answer session, nor any part thereof, may be recorded, transcribed, distributed, published or reproduced in any form, except as permitted by Rio Tinto. By accessing/ attending this presentation, you agree with the foregoing and, upon request, you will promptly return any records or transcripts at the presentation without retaining any copies.
This presentation contains a number of non-IFRS financial measures. Rio Tinto management considers these to be key financial performance indicators of the business and they are defined and/or reconciled in Rio Tinto’s annual results press release and/or Annual report.
Reference to consensus figures are not based on Rio Tinto’s own opinions, estimates or forecasts and are compiled and published without comment from, or endorsement or verification by, Rio Tinto. The consensus figures do not necessarily reflect guidance provided from time to time by Rio Tinto where given in relation to equivalent metrics, which to the extent available can be found on the Rio Tinto website.
By referencing consensus figures, Rio Tinto does not imply that it endorses, confirms or expresses a view on the consensus figures. The consensus figures are provided for informational purposes only and are not intended to, nor do they, constitute investment advice or any solicitation to buy, hold or sell securities or other financial instruments. No warranty or representation, either express or implied, is made by Rio Tinto or its affiliates, or their respective directors, officers and employees, in relation to the accuracy, completeness or achievability of the consensus figures and, to the fullest extent permitted by law, no responsibility or liability is accepted by any of those persons in respect of those matters. Rio Tinto assumes no obligation to update, revise or supplement the consensus figures to reflect circumstances existing after the date hereof.
2
| © Rio Tinto 2017
Supporting statements
Mineral Resources and Ore Reserves
The Pilbara Mineral Resource and Ore Reserve estimates which appear on slide 14 are reported on a 100% basis. These Mineral Resource and Ore Reserve estimates, together with the ownership
percentages for each joint venture were set out in the Mineral Resource and Ore Reserve statements in the 2012 to 2016 Rio Tinto annual reports to shareholders released to the market on 15 March 2013,
14 March 2014, 6 March 2015 and 3 March 2016 respectively. The Competent Persons responsible for reporting of those Mineral Resources and Ore Reserves were B Sommerville (Resources) and L
Fouche (Reserves 2012-2014) and C Tabb (Reserves 2015-2016).
Rio Tinto is not aware of any new information or data that materially affects the above Mineral Resource and Ore Reserve estimates as reported in the 2016 annual report. All material assumptions on
which the estimates in the 2016 annual report were based continue to apply and have not materially changed. The form and context in which those findings are presented have not been materially
modified. Mineral Resources are reported exclusive of Ore Reserves. Ore Reserves are reported as dry product tonnes. Mineral Resources are reported on an dry in situ basis.
3

| © Rio Tinto 2017
Rio Tinto value proposition
Long-term strategy Cash focus Capital discipline and
shareholder returns
Team and performance
culture
World-class assets Value over volume Strong balance sheet Safety first
Delivering >2% CAGR1 CuEq growth $2 billion cost savings delivered six
months early 40-60% returns through the cycle Assets at the heart of our business
Licence to Operate $5 billion free cash flow from mine
to market productivity by 2021 Portfolio shaping
Commercial and operational
excellence
4 1 Copper equivalent CAGR, 2015-2025.

| © Rio Tinto 2017
World-class assets at the core of our business
5
Iron Ore Bauxite Aluminium Copper
Main
businesses Pilbara Bauxite Canadian smelters Oyu Tolgoi,
Escondida
Competitive
advantages
Low-cost, world-class assets
Integrated infrastructure
Benchmark product
Technical marketing
Large, low-cost bauxite
assets
Technical leadership
and marketing
First quartile smelters
Low-cost renewable power
Large, long-life, low-cost
Attractive growth options
Technology and innovation
H1 2017
margins
69% FOB EBITDA
margin
45%1
FOB EBITDA
margin
35%1
Operating EBITDA
margin
47%1
Operating EBITDA
margin
1 Margins exclude product group overheads

| © Rio Tinto 2017
Focusing on value over volume
6
Capex
Sustaining
Replacement
Growth
Operating cost
Unit cost
Impact on cost base
Revenue
Price impact of
incremental tonnes
Protecting quality
Maximising free cash flow through
the cycle
| © Rio Tinto 2017
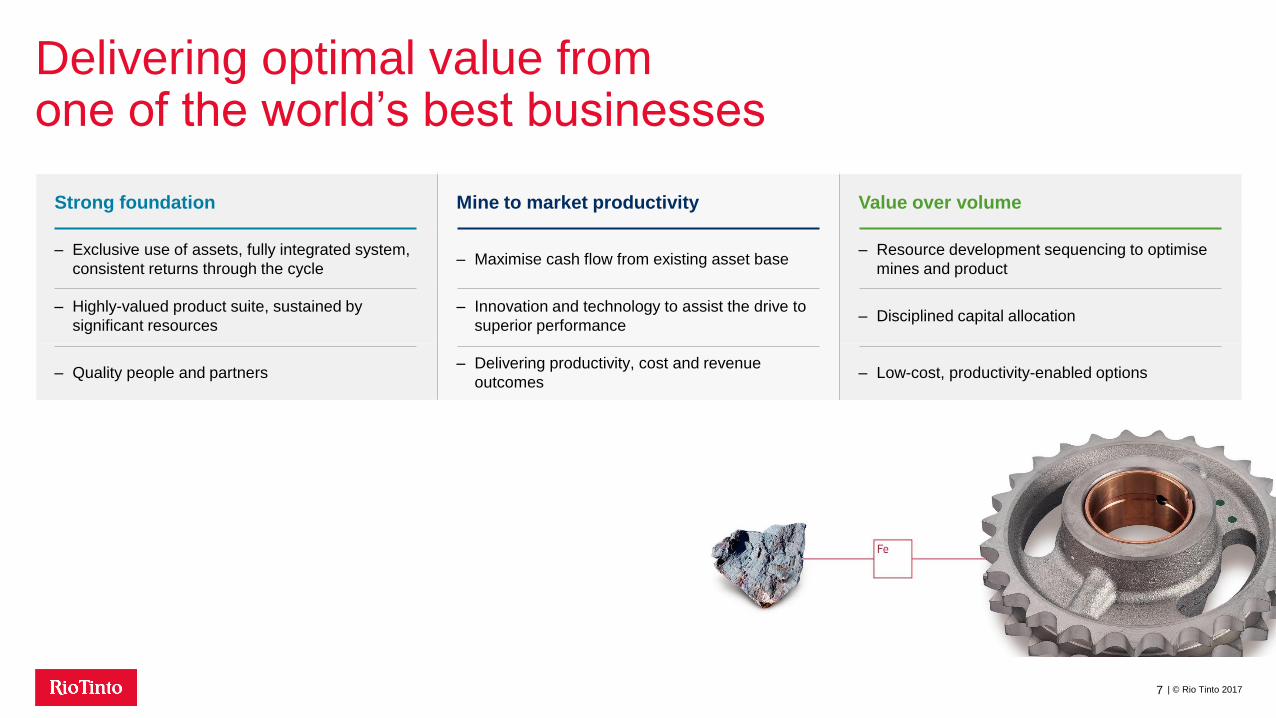
Delivering optimal value from one of the world’s best businesses
7
Strong foundation Mine to market productivity Value over volume
– Exclusive use of assets, fully integrated system,
consistent returns through the cycle – Maximise cash flow from existing asset base
– Resource development sequencing to optimise
mines and product
– Highly-valued product suite, sustained by
significant resources
– Innovation and technology to assist the drive to
superior performance – Disciplined capital allocation
– Quality people and partners – Delivering productivity, cost and revenue
outcomes – Low-cost, productivity-enabled options
| © Rio Tinto 2017
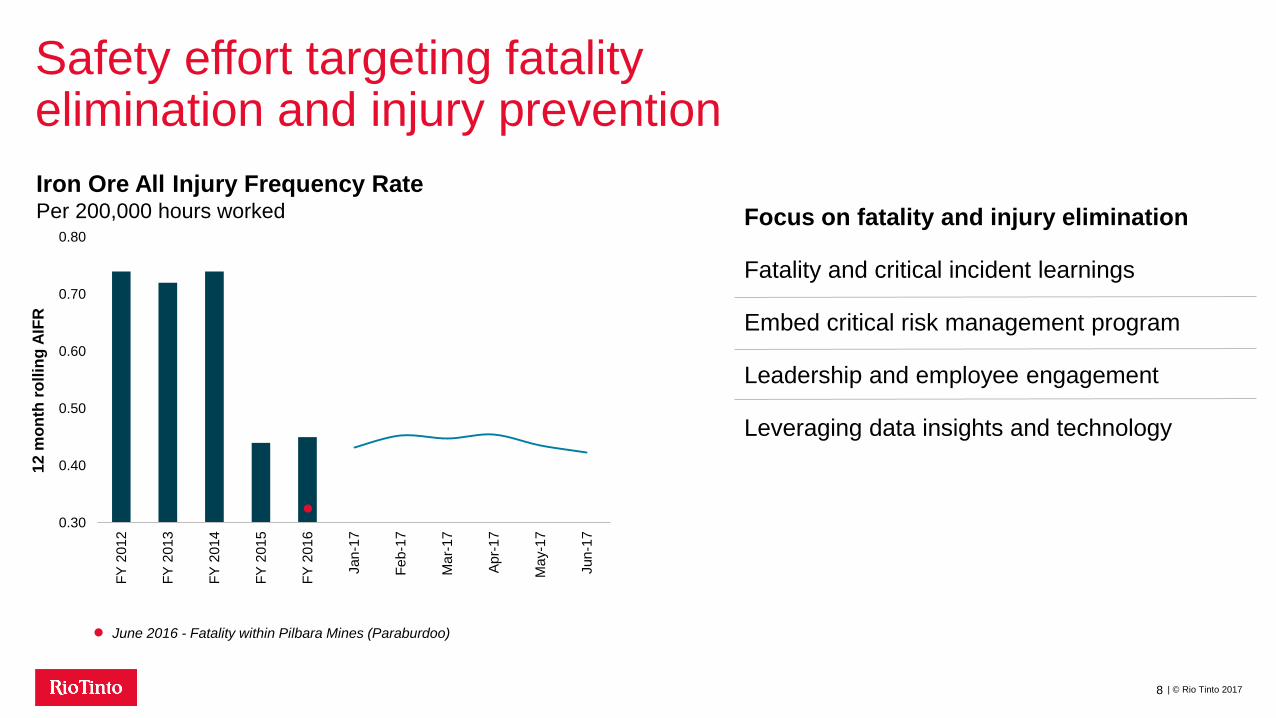
Safety effort targeting fatality elimination and injury prevention
8
0.30
0.40
0.50
0.60
0.70
0.80
FY
201
2
FY
201
3
FY
201
4
FY
201
5
FY
201
6
Jan
-17
Fe
b-1
7
Ma
r-17
Ap
r-1
7
Ma
y-1
7
Jun
-17
12
mo
nth
ro
llin
g A
IFR
Iron Ore All Injury Frequency Rate Per 200,000 hours worked
June 2016 - Fatality within Pilbara Mines (Paraburdoo)
Focus on fatality and injury elimination
Fatality and critical incident learnings
Embed critical risk management program
Leadership and employee engagement
Leveraging data insights and technology
| © Rio Tinto 2017
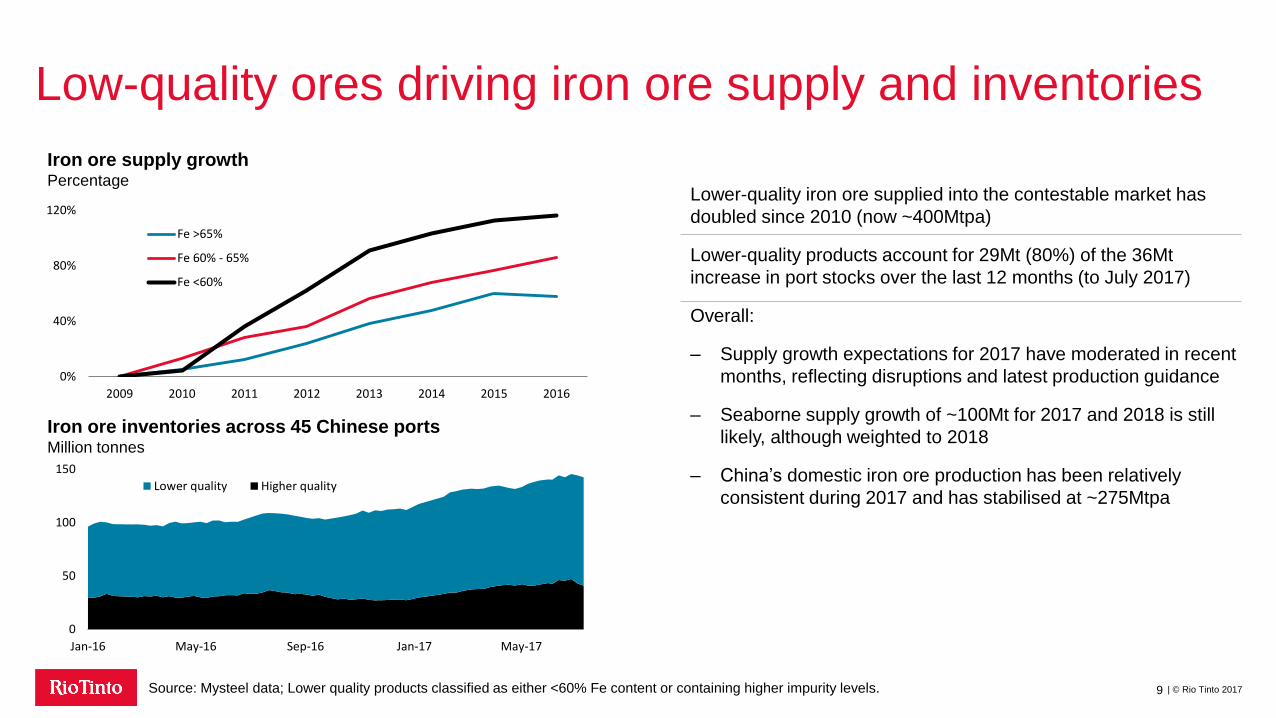
Low-quality ores driving iron ore supply and inventories
9
Iron ore inventories across 45 Chinese ports Million tonnes
Source: Mysteel data; Lower quality products classified as either <60% Fe content or containing higher impurity levels.
Lower-quality iron ore supplied into the contestable market has
doubled since 2010 (now ~400Mtpa)
Lower-quality products account for 29Mt (80%) of the 36Mt
increase in port stocks over the last 12 months (to July 2017)
Overall:
– Supply growth expectations for 2017 have moderated in recent
months, reflecting disruptions and latest production guidance
– Seaborne supply growth of ~100Mt for 2017 and 2018 is still
likely, although weighted to 2018
– China’s domestic iron ore production has been relatively
consistent during 2017 and has stabilised at ~275Mtpa
Iron ore supply growth Percentage
0%
40%
80%
120%
2009 2010 2011 2012 2013 2014 2015 2016
Fe >65%
Fe 60% - 65%
Fe <60%
0
50
100
150
Jan-16 May-16 Sep-16 Jan-17 May-17
Lower quality Higher quality
| © Rio Tinto 2017
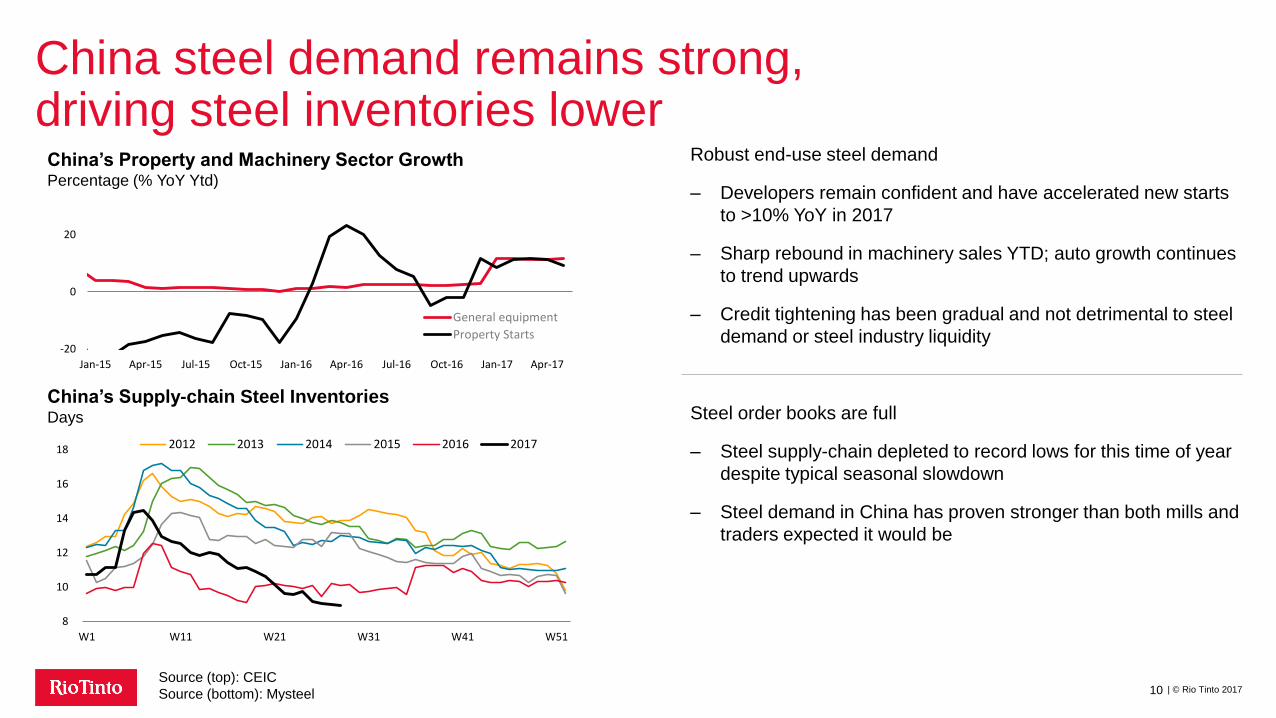
China steel demand remains strong, driving steel inventories lower
10
China’s Property and Machinery Sector Growth Percentage (% YoY Ytd)
Source (top): CEIC
Source (bottom): Mysteel
China’s Supply-chain Steel Inventories Days
Robust end-use steel demand
– Developers remain confident and have accelerated new starts
to >10% YoY in 2017
– Sharp rebound in machinery sales YTD; auto growth continues
to trend upwards
– Credit tightening has been gradual and not detrimental to steel
demand or steel industry liquidity
Steel order books are full
– Steel supply-chain depleted to record lows for this time of year
despite typical seasonal slowdown
– Steel demand in China has proven stronger than both mills and
traders expected it would be
8
10
12
14
16
18
W1 W11 W21 W31 W41 W51
2012 2013 2014 2015 2016 2017
-20
0
20
Jan-15 Apr-15 Jul-15 Oct-15 Jan-16 Apr-16 Jul-16 Oct-16 Jan-17 Apr-17
General equipment
Property Starts
| © Rio Tinto 2017
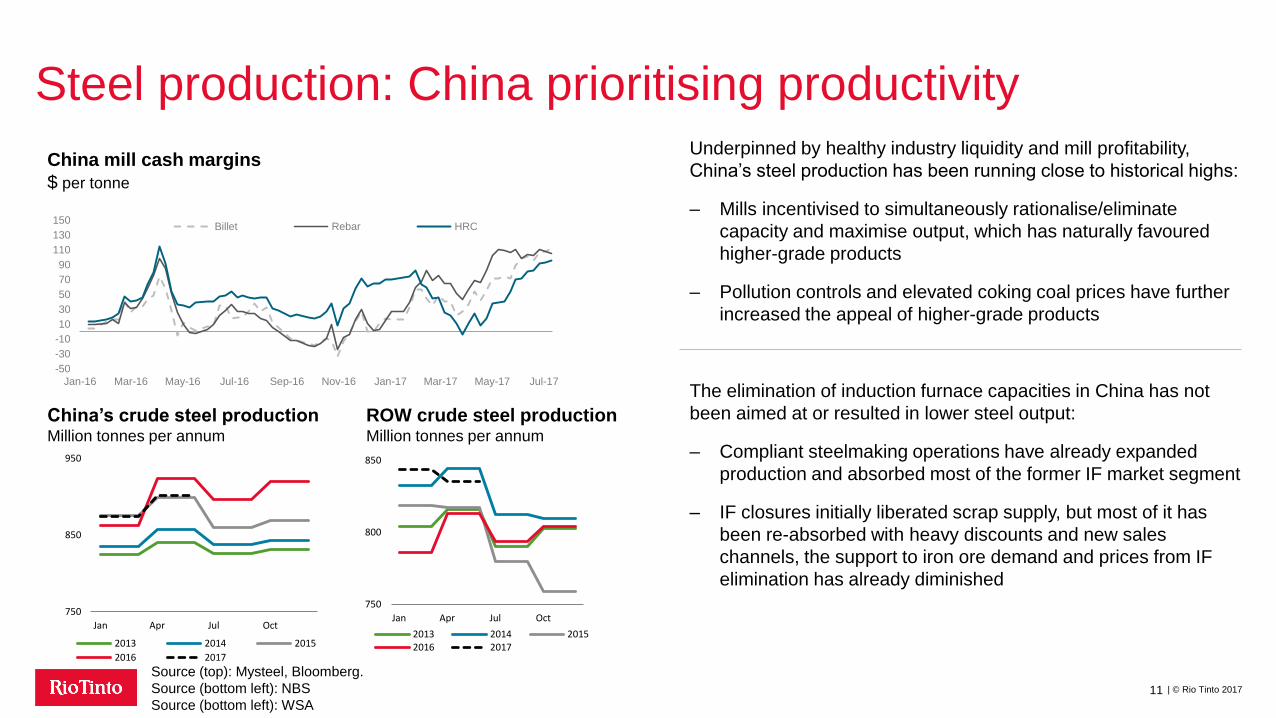
Steel production: China prioritising productivity
11
China’s crude steel production Million tonnes per annum
ROW crude steel production Million tonnes per annum
Underpinned by healthy industry liquidity and mill profitability,
China’s steel production has been running close to historical highs:
– Mills incentivised to simultaneously rationalise/eliminate
capacity and maximise output, which has naturally favoured
higher-grade products
– Pollution controls and elevated coking coal prices have further
increased the appeal of higher-grade products
The elimination of induction furnace capacities in China has not
been aimed at or resulted in lower steel output:
– Compliant steelmaking operations have already expanded
production and absorbed most of the former IF market segment
– IF closures initially liberated scrap supply, but most of it has
been re-absorbed with heavy discounts and new sales
channels, the support to iron ore demand and prices from IF
elimination has already diminished
Source (top): Mysteel, Bloomberg.
Source (bottom left): NBS
Source (bottom left): WSA
750
850
950
Jan Apr Jul Oct
2013 2014 2015
2016 2017
750
800
850
Jan Apr Jul Oct
2013 2014 20152016 2017
China mill cash margins
$ per tonne
-50
-30
-10
10
30
50
70
90
110
130
150
Jan-16 Mar-16 May-16 Jul-16 Sep-16 Nov-16 Jan-17 Mar-17 May-17 Jul-17
Billet Rebar HRC
| © Rio Tinto 2017
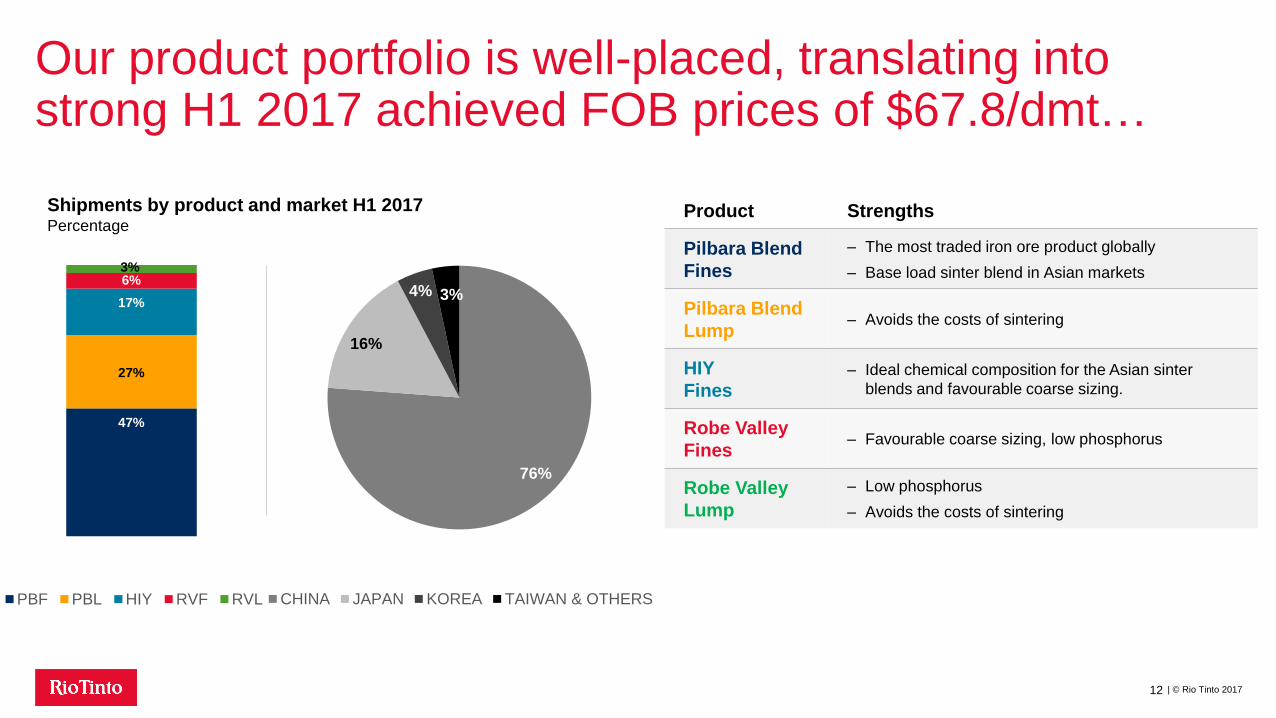
Our product portfolio is well-placed, translating into strong H1 2017 achieved FOB prices of $67.8/dmt…
12
Shipments by product and market H1 2017 Percentage
Product Strengths
Pilbara Blend
Fines
– The most traded iron ore product globally
– Base load sinter blend in Asian markets
Pilbara Blend
Lump – Avoids the costs of sintering
HIY
Fines – Ideal chemical composition for the Asian sinter
blends and favourable coarse sizing.
Robe Valley
Fines – Favourable coarse sizing, low phosphorus
Robe Valley
Lump
– Low phosphorus
– Avoids the costs of sintering
76%
16%
4% 3%
CHINA JAPAN KOREA TAIWAN & OTHERS
47%
27%
17%
6% 3%
PBF PBL HIY RVF RVL

| © Rio Tinto 2017
…including the industry benchmark Pilbara Blend
13
Fines Lump
Customers value the consistency and liquidity of the Pilbara Blend
– Easier to manage blast furnace mix
– Technical expertise provided to maximise value in use
– Most traded product and widely available at China ports
– Reduces inventory
Our Pilbara Blend products have been produced for over a decade
and have experienced robust customer demand throughout market
cycles
– Rio Tinto is the largest lump producer (~27% of tonnes)
– Platts lump premium averaged ~$4.9/dmt to the 62% fines index
during the first half of 2017
Platts 62% Fe index and lump premium H1 2017 US$/dry metric tonne
Avg: $74.5
Max: $95.1
Min: $54.0
Avg: $79.4
Max: $99.4
Min: $63.2
+$4.9
Alumina Silica Phosphorus Fe
Ship Mine/Rail
Blending reduces product variability Product quality variance from mean

| © Rio Tinto 2017
We have substantial resources sustaining future production…
14
Large Mineral Resources support system optionality
and sustain premium Pilbara Blend
Ore Reserves maintained in line with depletion
Maintaining evaluation drilling and resource
development programmes
Pilbara resources, reserves1 and production Million tonnes (LHS, dry; RHS, wet)
1 Refer to the statements supporting these resource and reserve estimates set out on Slide 3 of this presentation
Mineral Resources (LHS), Ore Reserves (LHS), Production (RHS)
-
75.0
150.0
225.0
300.0
375.0
0
5,000
10,000
15,000
20,000
25,000
2012 2013 2014 2015 2016Measured Indicated InferredProved Probable Production
| © Rio Tinto 2017
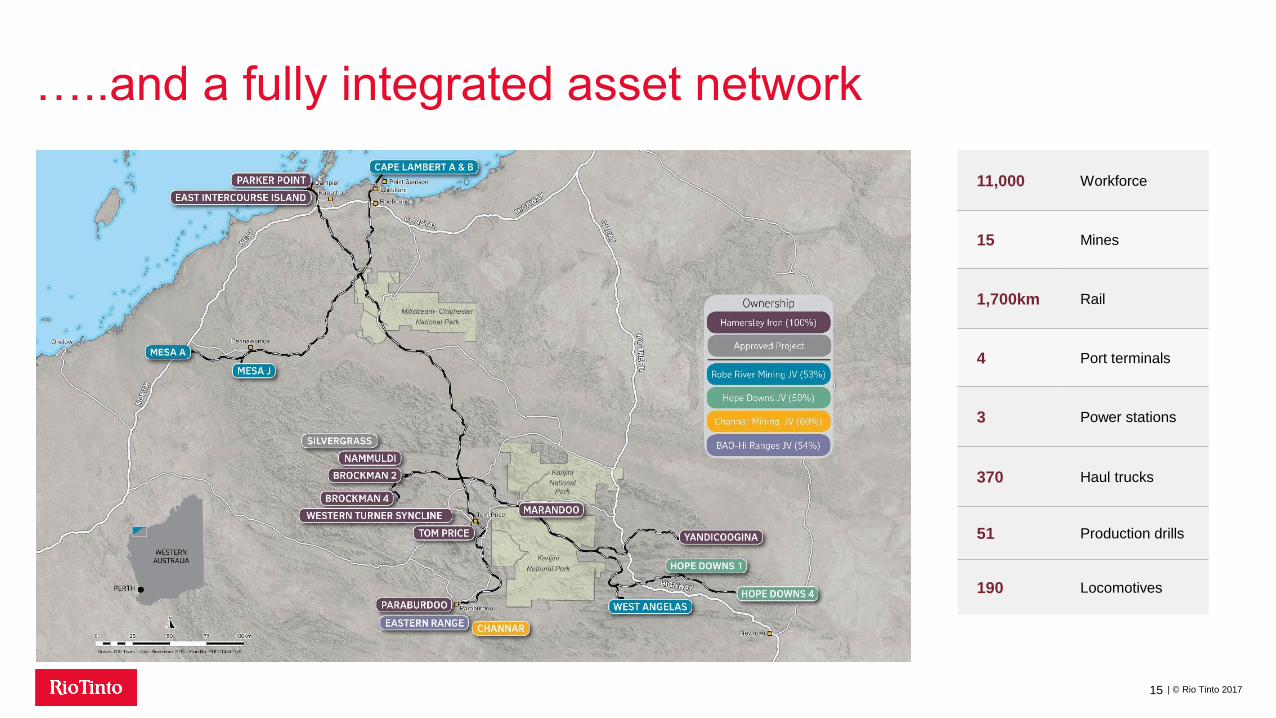
…..and a fully integrated asset network
15
11,000 Workforce
15 Mines
1,700km Rail
4 Port terminals
3 Power stations
370 Haul trucks
51 Production drills
190 Locomotives

| © Rio Tinto 2017
Iron Ore: continues to sustain our low-cost advantage
16
Pilbara cash unit cost US$ per tonne
Pre-tax operating cash cost improvements Reduction vs. 2012 US$m
1H 2017 cash unit cost of $13.8/t (3% lower than 1H 2016)
Maintaining attractive FOB EBITDA margin (69% in 1H 2017)
> $1.5 billion in pre-tax cost improvements since 2012
Pipeline of >2000 productivity and cost improvement initiatives
323
359
371
315
156
2013 2014 2015 2016 H1 2017
$1.5bn
22.9 20.4
16.2 14.3 13.8
H12013
H22013
H12014
H22014
H12015
H22015
H12016
H22016
H12017

| © Rio Tinto 2017
Replicating best practice drives greater value……
17
J F M A M J
2015 2016 2017
Haul Truck Effective Utilisation Time %, indexed, Jun YTD, site comparison
Plant Effective Utilisation
Time %, indexed, Jun YTD, site comparison
Collaboration and standardisation, with data analytics
assisting rapid change
Around 23% of operating fleet autonomous
15% improvement in load & haul costs; reduction in capex & opex
Automation retrofit potential being explored
Currently >30% volume beneficiated
– Ore quality and product handleability
Replicating best practice across the system:
– Conveyor system availability
– Process control improvement
1.00
1.20
IO Ave. IO Best Perf.
15% 20%
1.00 1.03
1.15
| © Rio Tinto 2017
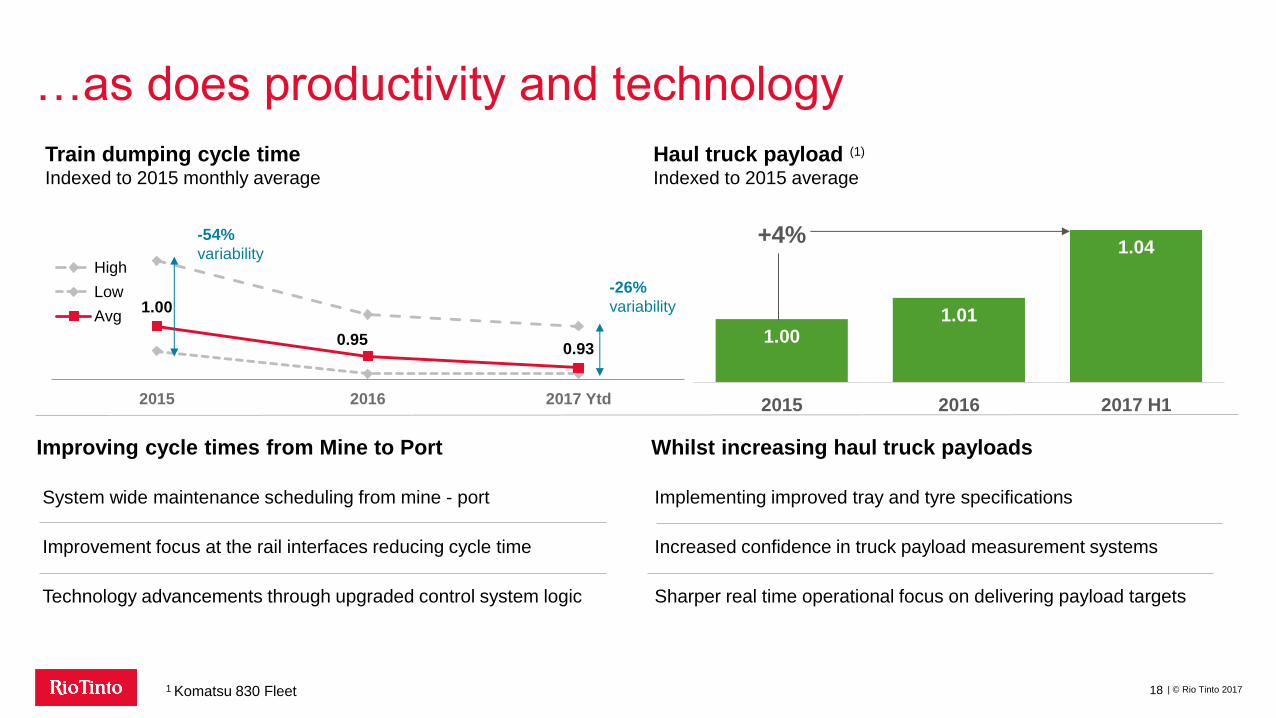
…as does productivity and technology
18
Improving cycle times from Mine to Port
1.00
0.95 0.93
2015 2016 2017 Ytd
High
Low
Avg
Train dumping cycle time Indexed to 2015 monthly average
-54%
variability
System wide maintenance scheduling from mine - port
Improvement focus at the rail interfaces reducing cycle time
Technology advancements through upgraded control system logic
-26%
variability
Haul truck payload (1)
Indexed to 2015 average
Whilst increasing haul truck payloads
Implementing improved tray and tyre specifications
Increased confidence in truck payload measurement systems
Sharper real time operational focus on delivering payload targets
1.00 1.01
1.04
2015 2016 2017 H1
+4%
1 Komatsu 830 Fleet

| © Rio Tinto 2017
AutoHaul® already delivering benefit
19
Significant progress made in 1H 2017:
of rail kilometres 1 now in
Autonomous mode
(with drivers on-board) 32%
Fewer train stoppages
Early benefits are being realised…
Reduced variability,
increased speed
Reduced in-train forces will
benefit maintenance
Force Extremes
Sta
tistical D
istr
ibutio
n
… and on-track to achieve full network capacity uplift by end 2018.
All sources Rio Tinto. 1 Excludes Deepdale line which is not within AutoHaul® territory.
Attended
mode
Manual
mode
Attended
mode Manual
mode
Average speed for track section
Sta
tistical D
istr
ibutio
n
Stretch Compression
>1hr reduction
in average
cycle time
of production tonnes1
now AutoHaul®-
enhanced 80%
– Avoids train stops for driver changes – Computerised driving improves cycle times

| © Rio Tinto 2017
Installed infrastructure offers high-value optionality
20
Port
Rail
Mines Silvergrass
and productivity
Autohaul®
and productivity
Production
optionality
Optimising system capacity Mt/a
360M
t
Mine capacity can be delivered through productivity
and low capital brownfields pathway
Rail capacity can be delivered through productivity,
low capital investment and progressive
implementation of Autohaul® from 2017/2018
Port capacity at 360Mt/a, with potential
to further optimise Production
optionality
2017 shipping guidance around 330Mt, weather dependent

| © Rio Tinto 2017
Silvergrass on track to deliver world-class investment returns
21
Silvergrass first production on-track for Q4 2017
Silvergrass project
1IRR calculated using consensus iron ore prices at May 2016
Mine sustains
Pilbara Blend quality
Autonomous Haul trucks
now operating
Conveyor being installed
IRR >100%1 ~21Mt/a at US$29/t
capital intensity (CI)

| © Rio Tinto 2017
High-quality, low-cost options available to offset depletion
22
Yandi Billiard South
Koodaideri option
-30
-
30
60
90
120
2012
2016
Bubble size indicates capacity
Greenfield replacement mine
New brownfield replacement mine Approved replacement mines
Pilbara mine development options US$/t Installed capital intensity
Low cost option leveraging existing infrastructure
– Yandi Billiard South Capital Intensity <$10/t; IRR
>100%1
Brownfield replacement mines to sustain current
production range (Capital Intensity $5-$20/t)
Koodaideri option underpins Pilbara Blend,
low-cost operations, in feasibility study. Present view:
– Phase 1 ~40Mt/a plant capacity at $55/t Capital
Intensity ($2.2bn)
– Potential capital spend from 2019
– Potential for first ore available around 2021
– Feasibility study includes full automation options 1 IRR calculated using consensus iron ore prices at May 2016

| © Rio Tinto 2017
Sustaining best value production
23
0.0
0.5
1.0
1.5
2016 2017F 2018F 2019F
Growth (mainly Silvergrass in 2017) Unapproved replacement mine capital
Approved replacement mine capital Sustaining capital
Capital expenditure US$bn (RT share) Silvergrass - majority of growth spend in 2017
~$100m approved replacement mine capital over next
three years, e.g.
– ~$64m Yandicoogina Oxbow
~$1bn unapproved replacement mine capital over
next three years
~$2.2bn sustaining capital over next three years, e.g.
– Mine mobile fleet replacements
– Process plant conveyors
– Rail track replacement

| © Rio Tinto 2017
Unlocking productivity through strong engagement
24
Safety remains fundamental priority
Strengthening workforce engagement
– Recognising great contributions from our people
– Enabling our inclusive and diverse culture
Enhancing our business through transformation
– Technology enabling our exciting future workplace
– Driving replication of great practice to unlock
productivity improvement
– Looking to new skill and capabilities required in
supply chain logistics, data analytics, automation
| © Rio Tinto 2017
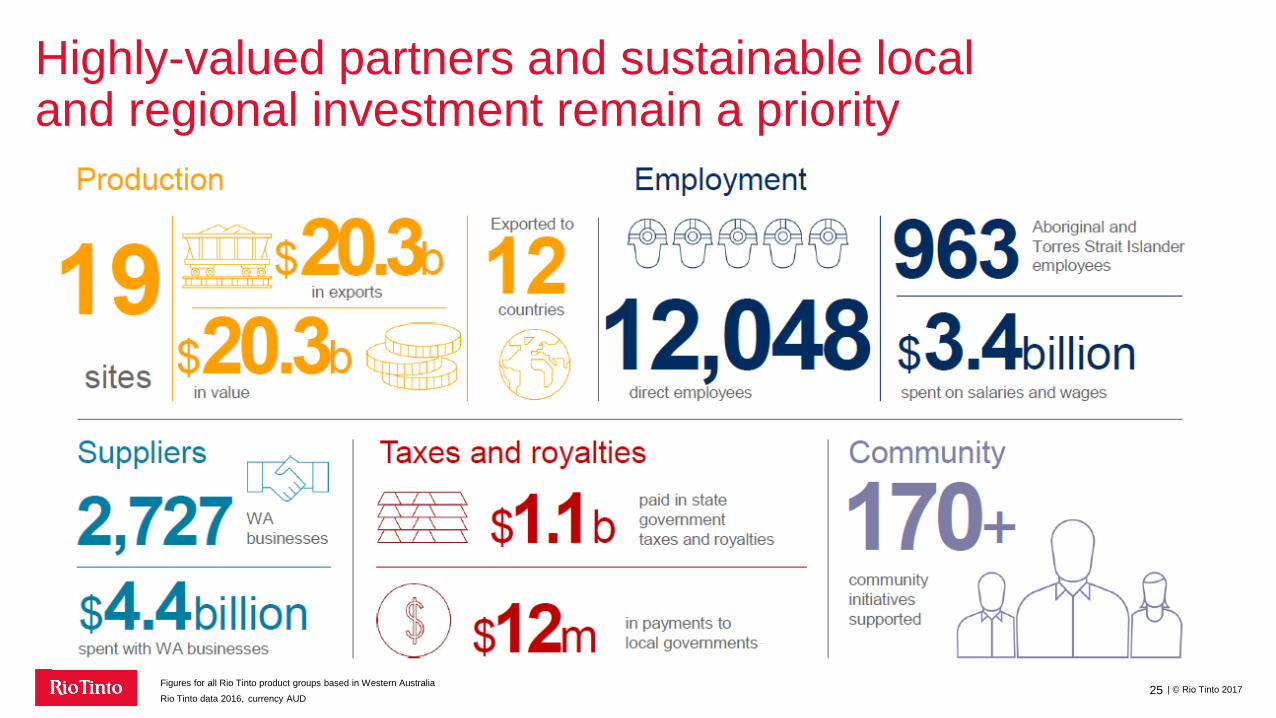
Highly-valued partners and sustainable local and regional investment remain a priority
25 Figures for all Rio Tinto product groups based in Western Australia
Rio Tinto data 2016, currency AUD

| © Rio Tinto 2017
Delivering optimal value from one of the world’s best businesses
26
Quality people and partners
Exclusively operated integrated asset, significant resource base, highly-valued product suite
Strong cash flows through the cycle
Focus on raising mine to market productivity
Multiple options to optimise system value
Low-capital intensity replacement mine options

Investor roadshow – August 2017
Iron Ore - delivering optimal value
Chris Salisbury, chief executive, Iron Ore