iron ore: price fundamentals - rc...
TRANSCRIPT
Resource Capital Research
December Quarter 2010, Iron Ore Review Disclaimer and disclosure attached. Copyright© 2010 by Resource Capital Research Pty Ltd. All rights reserved. 25
Iron Ore: Price Fundamentals
Analyst: Dr Trent Allen
Sector outlook and iron ore price forecast
Iron ore contract prices are set to increase by 7.7% into 1Q11, triggered
by a increase in spot market prices 3-4Q10. Overall, the iron ore market
remains stable, after a volatile period extending from the GFC to the
collapse of the annual benchmark pricing system and the introduction of
quarterly iron ore contracts in 2Q10.
Spot prices (China imports) reached US$186/t for 62% Fe CFB in April
2010, due to global economic regrowth but fell to US$116/t in July 2010
with increasing iron ore supply and destocking by Chinese steel mills in
anticipation of lower prices as growth moderated. Consequently, there
was a 13.3% drop in the quarterly contract fines price for 4Q10, to
USc205/dmtu or US$127/t at 62% Fe (average of the previous quarter’s
spot price, with a one month lag).
A gain of 7.7% to USc220.9/dmtu or US$137/t at 62% Fe fines is
expected for the quarterly price in 1Q11, because spot prices rose in the
September-November index window. Lump should be USc248.2/dmtu
(12.4% premium). The current spot price for China imports is
US$164.7/t, 11% below the April post-GFC high. The internal Chinese
spot price (Hebei) is 1370RMB/t, only 2% below the April high of
1400RMB/t. The gains could have been triggered by:
Australian and Brazilian producers passing on an increase in US$
operating costs, due to higher A$/US$ and Real/US$ exchange rates.
Supply difficulties in India, especially the Karnataka Government’s
ban on iron ore exports (citing illegal mining and conservation of
resources) which has removed ~30mtpa from supplies; also, the
monsoon in western India and supply disruption by Maoist insurgents.
Seasonal restocking by Chinese steel mills.
Anticipation of short term supply shortages, until significant mine and
infrastructure expansions begin to take effect, beyond 2H12.
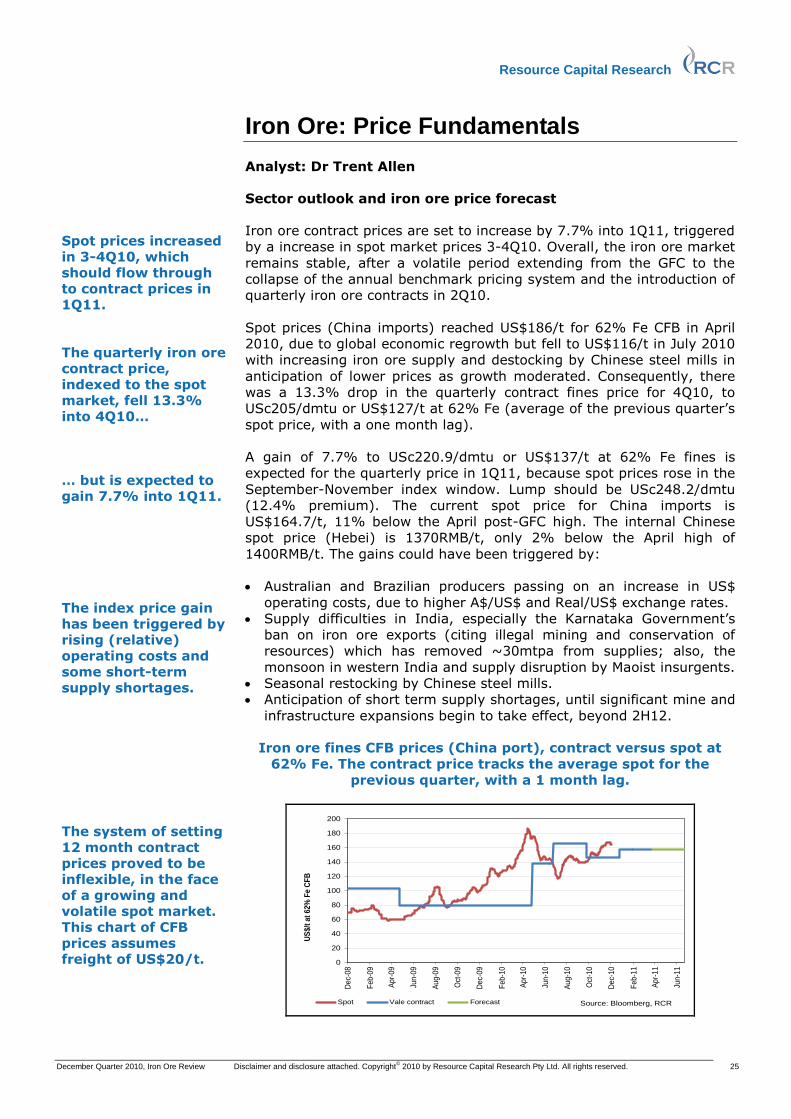
Iron ore fines CFB prices (China port), contract versus spot at
62% Fe. The contract price tracks the average spot for the
previous quarter, with a 1 month lag.
0
20
40
60
80
100
120
140
160
180
200
Dec-
08
Feb-0
9
Ap
r-09
Jun
-09
Au
g-0
9
Oct
-09
Dec-
09
Feb-1
0
Ap
r-10
Jun
-10
Au
g-1
0
Oct
-10
Dec-
10
Feb-1
1
Ap
r-11
Jun
-11
US
$/t
at
62%
Fe C
FB
Spot Vale contract Forecast Source: Bloomberg, RCR
Spot prices increased in 3-4Q10, which should flow through to contract prices in 1Q11. The quarterly iron ore contract price, indexed to the spot market, fell 13.3% into 4Q10… … but is expected to gain 7.7% into 1Q11. The index price gain has been triggered by rising (relative) operating costs and some short-term supply shortages. The system of setting 12 month contract prices proved to be inflexible, in the face of a growing and volatile spot market. This chart of CFB prices assumes freight of US$20/t.
Resource Capital Research
December Quarter 2010, Iron Ore Review Disclaimer and disclosure attached. Copyright© 2010 by Resource Capital Research Pty Ltd. All rights reserved. 26
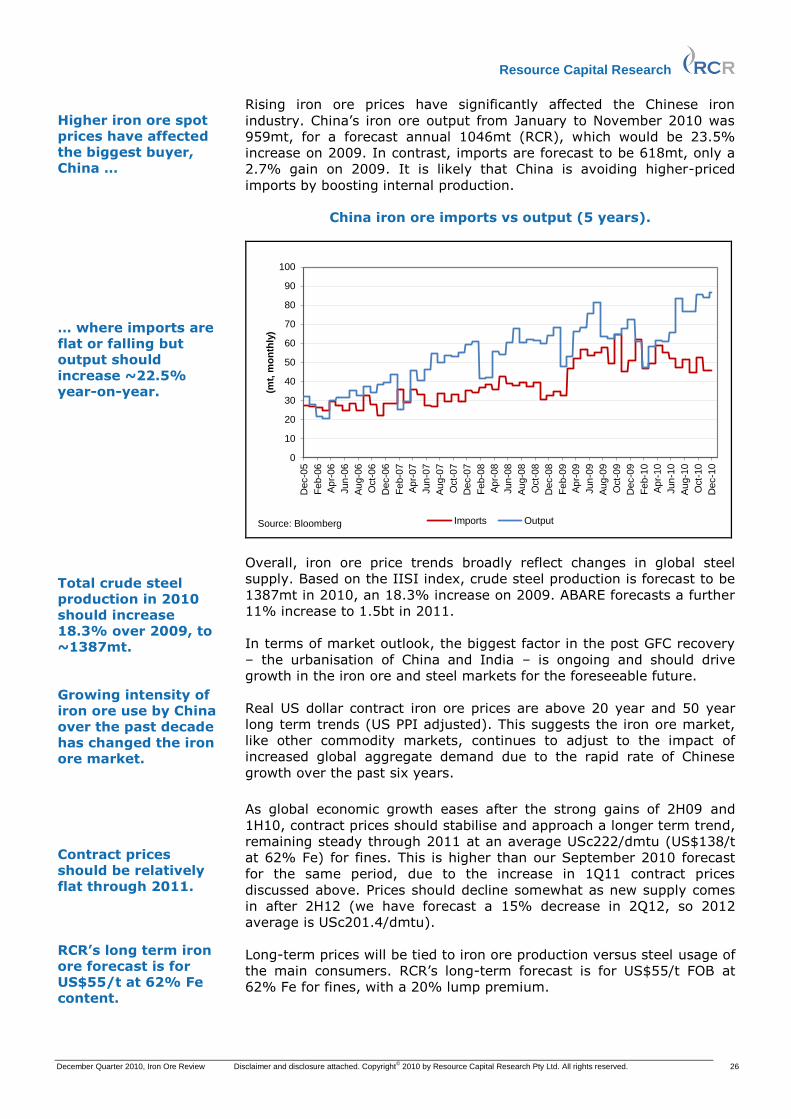
Rising iron ore prices have significantly affected the Chinese iron
industry. China’s iron ore output from January to November 2010 was
959mt, for a forecast annual 1046mt (RCR), which would be 23.5%
increase on 2009. In contrast, imports are forecast to be 618mt, only a
2.7% gain on 2009. It is likely that China is avoiding higher-priced
imports by boosting internal production.
China iron ore imports vs output (5 years).
0
10
20
30
40
50
60
70
80
90
100
Dec-0
5
Fe
b-0
6
Ap
r-06
Jun
-06
Au
g-0
6
Oct-
06
Dec-0
6
Feb-0
7
Ap
r-07
Jun
-07
Au
g-0
7
Oct-
07
Dec-0
7
Fe
b-0
8
Ap
r-08
Jun
-08
Au
g-0
8
Oct-
08
Dec-0
8
Fe
b-0
9
Ap
r-09
Jun
-09
Au
g-0
9
Oct-
09
Dec-0
9
Fe
b-1
0
Ap
r-10
Jun
-10
Au
g-1
0
Oct-
10
Dec-1
0
(mt,
mo
nth
ly)
Imports OutputSource: Bloomberg
Overall, iron ore price trends broadly reflect changes in global steel
supply. Based on the IISI index, crude steel production is forecast to be
1387mt in 2010, an 18.3% increase on 2009. ABARE forecasts a further
11% increase to 1.5bt in 2011.
In terms of market outlook, the biggest factor in the post GFC recovery
– the urbanisation of China and India – is ongoing and should drive
growth in the iron ore and steel markets for the foreseeable future.
Real US dollar contract iron ore prices are above 20 year and 50 year
long term trends (US PPI adjusted). This suggests the iron ore market,
like other commodity markets, continues to adjust to the impact of
increased global aggregate demand due to the rapid rate of Chinese
growth over the past six years.
As global economic growth eases after the strong gains of 2H09 and
1H10, contract prices should stabilise and approach a longer term trend,
remaining steady through 2011 at an average USc222/dmtu (US$138/t
at 62% Fe) for fines. This is higher than our September 2010 forecast
for the same period, due to the increase in 1Q11 contract prices
discussed above. Prices should decline somewhat as new supply comes
in after 2H12 (we have forecast a 15% decrease in 2Q12, so 2012
average is USc201.4/dmtu).
Long-term prices will be tied to iron ore production versus steel usage of
the main consumers. RCR’s long-term forecast is for US$55/t FOB at
62% Fe for fines, with a 20% lump premium.
Higher iron ore spot prices have affected the biggest buyer, China … … where imports are flat or falling but output should increase ~22.5% year-on-year. Total crude steel production in 2010 should increase 18.3% over 2009, to ~1387mt. Growing intensity of iron ore use by China over the past decade has changed the iron ore market. Contract prices should be relatively flat through 2011. RCR’s long term iron ore forecast is for US$55/t at 62% Fe content.
Resource Capital Research
December Quarter 2010, Iron Ore Review Disclaimer and disclosure attached. Copyright© 2010 by Resource Capital Research Pty Ltd. All rights reserved. 27
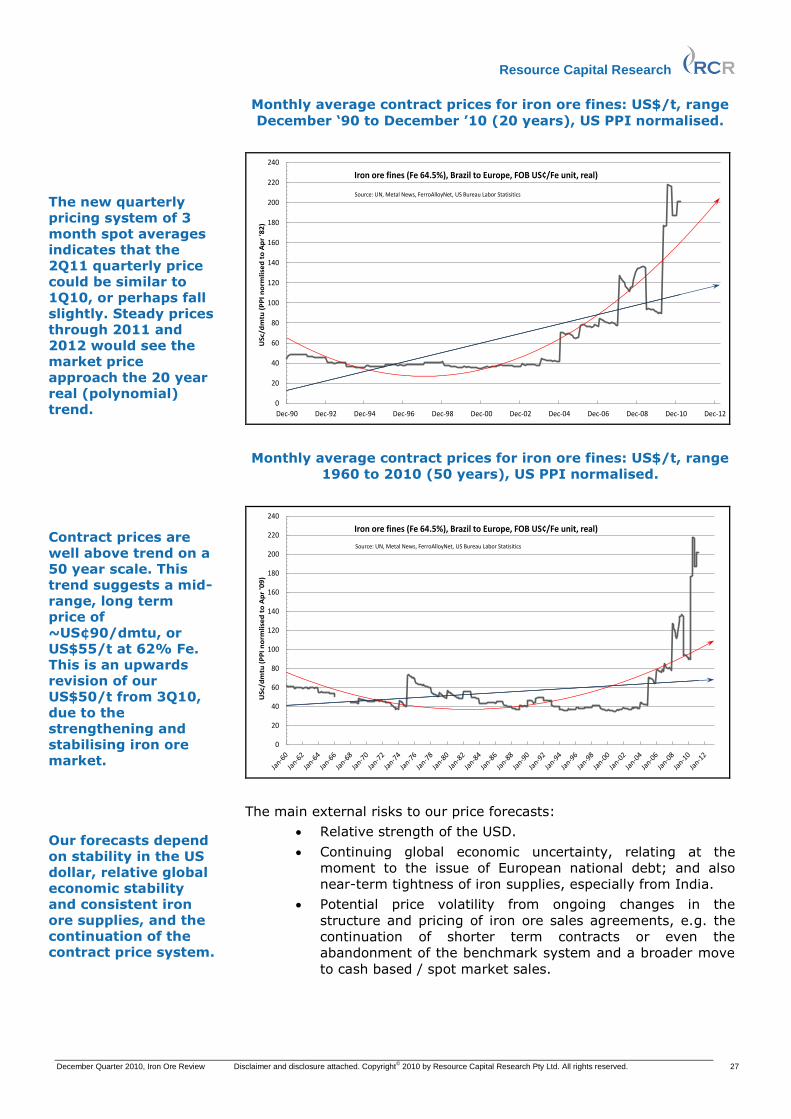
Monthly average contract prices for iron ore fines: US$/t, range
December ‘90 to December ’10 (20 years), US PPI normalised.
0
20
40
60
80
100
120
140
160
180
200
220
240
Dec-90 Dec-92 Dec-94 Dec-96 Dec-98 Dec-00 Dec-02 Dec-04 Dec-06 Dec-08 Dec-10 Dec-12
US
c/d
mtu
(P
PI
no
rmli
sed
to
Ap
r '8
2)
Iron ore fines (Fe 64.5%), Brazil to Europe, FOB US¢/Fe unit, real)
Source: UN, Metal News, FerroAlloyNet, US Bureau Labor Statisitics
Monthly average contract prices for iron ore fines: US$/t, range
1960 to 2010 (50 years), US PPI normalised.
0
20
40
60
80
100
120
140
160
180
200
220
240
US
c/d
mtu
(P
PI
no
rmli
sed
to
Ap
r '0
9)
Iron ore fines (Fe 64.5%), Brazil to Europe, FOB US¢/Fe unit, real)
Source: UN, Metal News, FerroAlloyNet, US Bureau Labor Statisitics
The main external risks to our price forecasts:
Relative strength of the USD.
Continuing global economic uncertainty, relating at the
moment to the issue of European national debt; and also
near-term tightness of iron supplies, especially from India.
Potential price volatility from ongoing changes in the
structure and pricing of iron ore sales agreements, e.g. the
continuation of shorter term contracts or even the
abandonment of the benchmark system and a broader move
to cash based / spot market sales.
The new quarterly pricing system of 3 month spot averages indicates that the 2Q11 quarterly price could be similar to 1Q10, or perhaps fall slightly. Steady prices through 2011 and 2012 would see the market price approach the 20 year real (polynomial) trend. Contract prices are well above trend on a 50 year scale. This trend suggests a mid-range, long term price of ~US¢90/dmtu, or US$55/t at 62% Fe. This is an upwards revision of our US$50/t from 3Q10, due to the strengthening and stabilising iron ore market. Our forecasts depend on stability in the US dollar, relative global economic stability and consistent iron ore supplies, and the continuation of the contract price system.
Resource Capital Research
December Quarter 2010, Iron Ore Review Disclaimer and disclosure attached. Copyright© 2010 by Resource Capital Research Pty Ltd. All rights reserved. 28
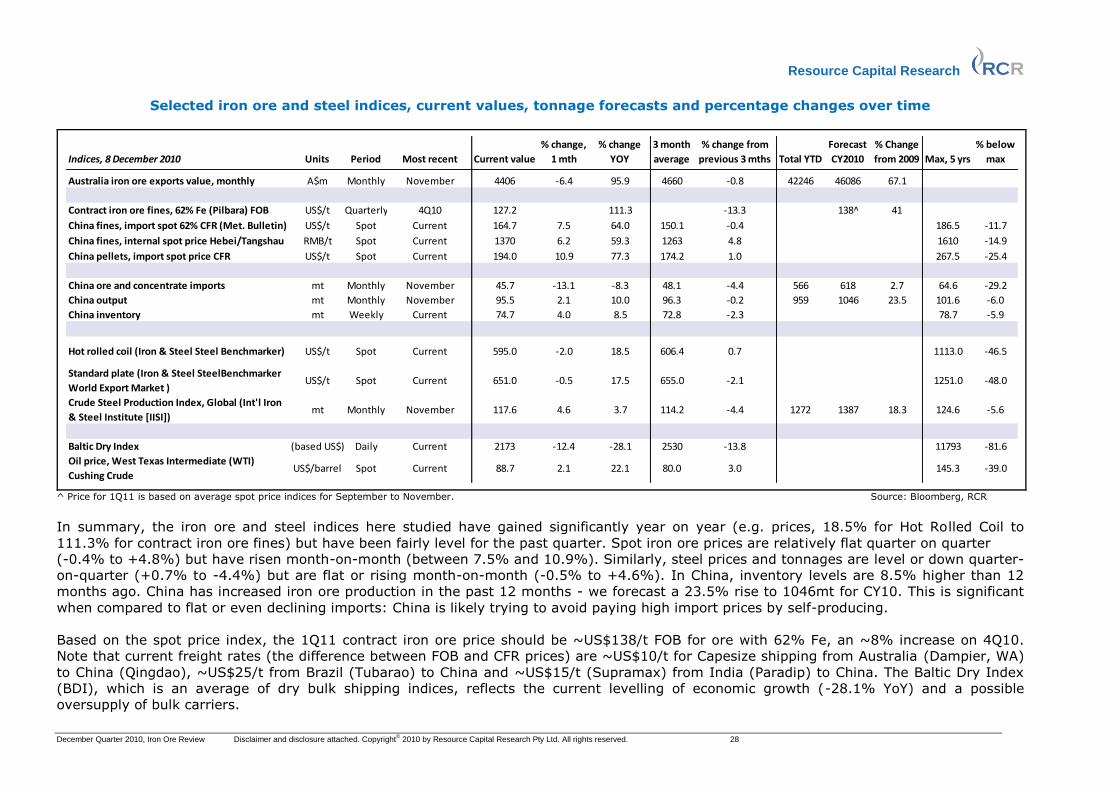
Selected iron ore and steel indices, current values, tonnage forecasts and percentage changes over time
Indices, 8 December 2010 Units Period Most recent Current value
% change,
1 mth
% change
YOY
3 month
average
% change from
previous 3 mths Total YTD
Forecast
CY2010
% Change
from 2009 Max, 5 yrs
% below
max
Australia iron ore exports value, monthly A$m Monthly November 4406 -6.4 95.9 4660 -0.8 42246 46086 67.1
Contract iron ore fines, 62% Fe (Pilbara) FOB US$/t Quarterly 4Q10 127.2 111.3 -13.3 138^ 41
China fines, import spot 62% CFR (Met. Bulletin) US$/t Spot Current 164.7 7.5 64.0 150.1 -0.4 186.5 -11.7
China fines, internal spot price Hebei/Tangshau RMB/t Spot Current 1370 6.2 59.3 1263 4.8 1610 -14.9
China pellets, import spot price CFR US$/t Spot Current 194.0 10.9 77.3 174.2 1.0 267.5 -25.4
China ore and concentrate imports mt Monthly November 45.7 -13.1 -8.3 48.1 -4.4 566 618 2.7 64.6 -29.2
China output mt Monthly November 95.5 2.1 10.0 96.3 -0.2 959 1046 23.5 101.6 -6.0
China inventory mt Weekly Current 74.7 4.0 8.5 72.8 -2.3 78.7 -5.9
Hot rolled coil (Iron & Steel Steel Benchmarker) US$/t Spot Current 595.0 -2.0 18.5 606.4 0.7 1113.0 -46.5
Standard plate (Iron & Steel SteelBenchmarker
World Export Market )US$/t Spot Current 651.0 -0.5 17.5 655.0 -2.1 1251.0 -48.0
Crude Steel Production Index, Global (Int'l Iron
& Steel Institute [IISI])mt Monthly November 117.6 4.6 3.7 114.2 -4.4 1272 1387 18.3 124.6 -5.6
Baltic Dry Index (based US$) Daily Current 2173 -12.4 -28.1 2530 -13.8 11793 -81.6
Oil price, West Texas Intermediate (WTI)
Cushing CrudeUS$/barrel Spot Current 88.7 2.1 22.1 80.0 3.0 145.3 -39.0
^ Price for 1Q11 is based on average spot price indices for September to November. Source: Bloomberg, RCR
In summary, the iron ore and steel indices here studied have gained significantly year on year (e.g. prices, 18.5% for Hot Rolled Coil to
111.3% for contract iron ore fines) but have been fairly level for the past quarter. Spot iron ore prices are relatively flat quarter on quarter
(-0.4% to +4.8%) but have risen month-on-month (between 7.5% and 10.9%). Similarly, steel prices and tonnages are level or down quarter-
on-quarter (+0.7% to -4.4%) but are flat or rising month-on-month (-0.5% to +4.6%). In China, inventory levels are 8.5% higher than 12
months ago. China has increased iron ore production in the past 12 months - we forecast a 23.5% rise to 1046mt for CY10. This is significant
when compared to flat or even declining imports: China is likely trying to avoid paying high import prices by self-producing.
Based on the spot price index, the 1Q11 contract iron ore price should be ~US$138/t FOB for ore with 62% Fe, an ~8% increase on 4Q10.
Note that current freight rates (the difference between FOB and CFR prices) are ~US$10/t for Capesize shipping from Australia (Dampier, WA)
to China (Qingdao), ~US$25/t from Brazil (Tubarao) to China and ~US$15/t (Supramax) from India (Paradip) to China. The Baltic Dry Index
(BDI), which is an average of dry bulk shipping indices, reflects the current levelling of economic growth (-28.1% YoY) and a possible
oversupply of bulk carriers.
Resource Capital Research
December Quarter 2010, Iron Ore Review Disclaimer and disclosure attached. Copyright© 2010 by Resource Capital Research Pty Ltd. All rights reserved. 29
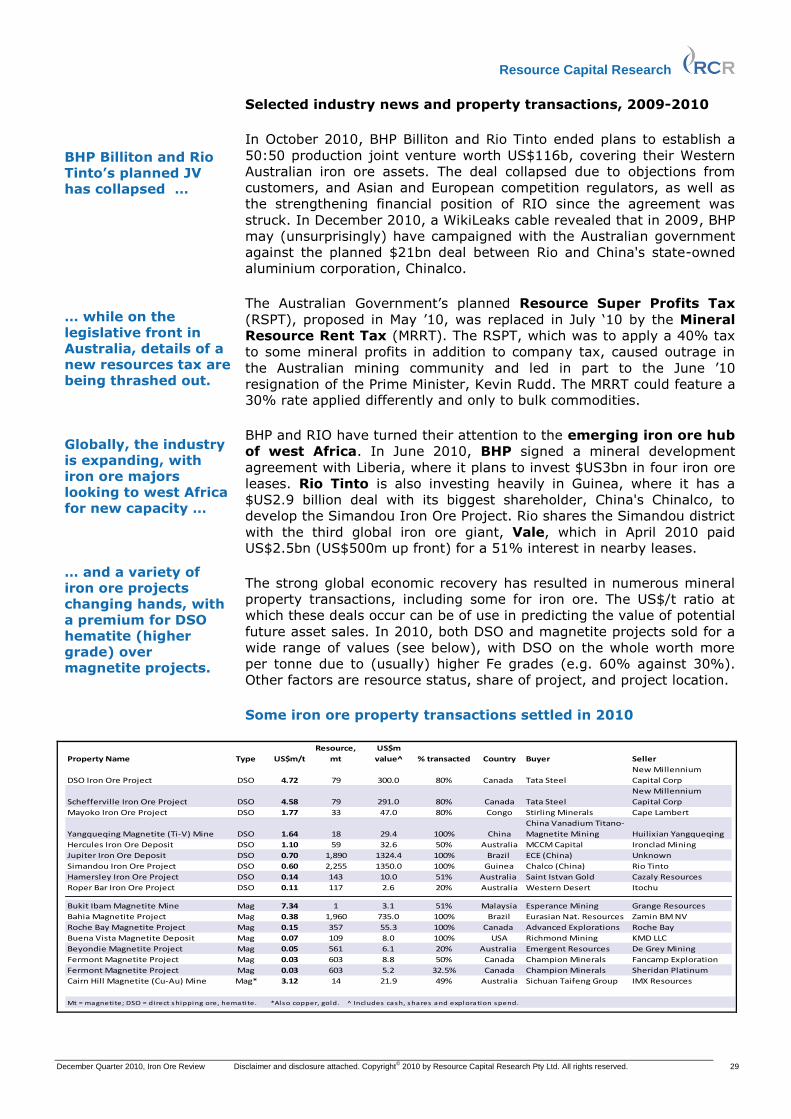
Selected industry news and property transactions, 2009-2010
In October 2010, BHP Billiton and Rio Tinto ended plans to establish a
50:50 production joint venture worth US$116b, covering their Western
Australian iron ore assets. The deal collapsed due to objections from
customers, and Asian and European competition regulators, as well as
the strengthening financial position of RIO since the agreement was
struck. In December 2010, a WikiLeaks cable revealed that in 2009, BHP
may (unsurprisingly) have campaigned with the Australian government
against the planned $21bn deal between Rio and China's state-owned
aluminium corporation, Chinalco.
The Australian Government’s planned Resource Super Profits Tax
(RSPT), proposed in May ’10, was replaced in July ‘10 by the Mineral
Resource Rent Tax (MRRT). The RSPT, which was to apply a 40% tax
to some mineral profits in addition to company tax, caused outrage in
the Australian mining community and led in part to the June ’10
resignation of the Prime Minister, Kevin Rudd. The MRRT could feature a 30% rate applied differently and only to bulk commodities.
BHP and RIO have turned their attention to the emerging iron ore hub
of west Africa. In June 2010, BHP signed a mineral development
agreement with Liberia, where it plans to invest $US3bn in four iron ore
leases. Rio Tinto is also investing heavily in Guinea, where it has a
$US2.9 billion deal with its biggest shareholder, China's Chinalco, to
develop the Simandou Iron Ore Project. Rio shares the Simandou district
with the third global iron ore giant, Vale, which in April 2010 paid US$2.5bn (US$500m up front) for a 51% interest in nearby leases.
The strong global economic recovery has resulted in numerous mineral
property transactions, including some for iron ore. The US$/t ratio at
which these deals occur can be of use in predicting the value of potential
future asset sales. In 2010, both DSO and magnetite projects sold for a
wide range of values (see below), with DSO on the whole worth more
per tonne due to (usually) higher Fe grades (e.g. 60% against 30%).
Other factors are resource status, share of project, and project location.
Some iron ore property transactions settled in 2010
Property Name Type US$m/t
Resource,
mt
US$m
value^ % transacted Country Buyer Seller
DSO Iron Ore Project DSO 4.72 79 300.0 80% Canada Tata Steel
New Millennium
Capital Corp
Schefferville Iron Ore Project DSO 4.58 79 291.0 80% Canada Tata Steel
New Millennium
Capital Corp
Mayoko Iron Ore Project DSO 1.77 33 47.0 80% Congo Stirling Minerals Cape Lambert
Yangqueqing Magnetite (Ti-V) Mine DSO 1.64 18 29.4 100% China
China Vanadium Titano-
Magnetite Mining Huilixian Yangqueqing
Hercules Iron Ore Deposit DSO 1.10 59 32.6 50% Australia MCCM Capital Ironclad Mining
Jupiter Iron Ore Deposit DSO 0.70 1,890 1324.4 100% Brazil ECE (China) Unknown
Simandou Iron Ore Project DSO 0.60 2,255 1350.0 100% Guinea Chalco (China) Rio Tinto
Hamersley Iron Ore Project DSO 0.14 143 10.0 51% Australia Saint Istvan Gold Cazaly Resources
Roper Bar Iron Ore Project DSO 0.11 117 2.6 20% Australia Western Desert Itochu
Bukit Ibam Magnetite Mine Mag 7.34 1 3.1 51% Malaysia Esperance Mining Grange Resources
Bahia Magnetite Project Mag 0.38 1,960 735.0 100% Brazil Eurasian Nat. Resources Zamin BM NV
Roche Bay Magnetite Project Mag 0.15 357 55.3 100% Canada Advanced Explorations Roche Bay
Buena Vista Magnetite Deposit Mag 0.07 109 8.0 100% USA Richmond Mining KMD LLC
Beyondie Magnetite Project Mag 0.05 561 6.1 20% Australia Emergent Resources De Grey Mining
Fermont Magnetite Project Mag 0.03 603 8.8 50% Canada Champion Minerals Fancamp Exploration
Fermont Magnetite Project Mag 0.03 603 5.2 32.5% Canada Champion Minerals Sheridan Platinum
Cairn Hill Magnetite (Cu-Au) Mine Mag* 3.12 14 21.9 49% Australia Sichuan Taifeng Group IMX Resources
Mt = magneti te; DSO = direct shipping ore, hematite. *Also copper, gold. ^ Includes cash, shares and exploration spend.
BHP Billiton and Rio Tinto’s planned JV has collapsed … … while on the legislative front in Australia, details of a new resources tax are being thrashed out. Globally, the industry is expanding, with iron ore majors looking to west Africa for new capacity … … and a variety of iron ore projects changing hands, with a premium for DSO hematite (higher grade) over magnetite projects.
Resource Capital Research
December Quarter 2010, Iron Ore Review Disclaimer and disclosure attached. Copyright© 2010 by Resource Capital Research Pty Ltd. All rights reserved. 30
Iron Ore Equity Performances
Yearly equity performances of 58 Australian listed iron ore juniors, with
a combined market capitalisation of A$36.9bn, have strongly
outperformed the S&P/ASX200: prices gained an average 38% in the
past 12 months (ASX200 +0.6%), gained 25% over the past three
months, and gained 4% over the past 1 month (ASX200 -1.5%). The
companies’ share prices, on average, are 28% below their 12-month
highs but 96% above their 12-month lows. The best performers on our
list include Sphere Minerals Ltd (ASX:SPH), up 299% for the year due to
a takeover bid by Xstrata, which wants SPH’s iron ore projects in
Mauritania; and Avonlea Minerals Limited (ASX:IRD), which gained
150% in three months (promising iron ore and rare metal exploration in
Namibia). Canadian listed stocks have also performed strongly, with 48
companies showing an average 12 month increase of 78% including a 3
month rise of 43%, and sitting 23% below yearly highs. One of the best
12 month performers was Advanced Explorations Inc (+311%), which
was re-rated in Sep ’10 after forming agreements with Chinese partners
to develop its Roche Bay Project.
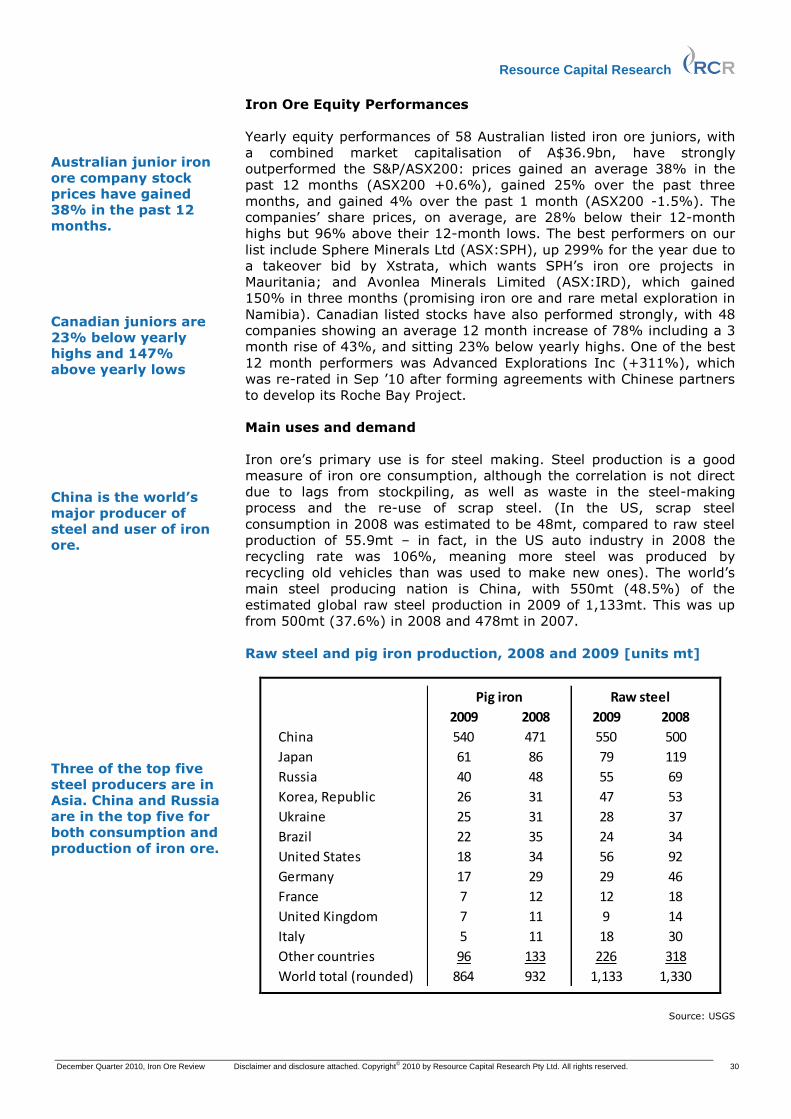
Main uses and demand
Iron ore’s primary use is for steel making. Steel production is a good
measure of iron ore consumption, although the correlation is not direct
due to lags from stockpiling, as well as waste in the steel-making
process and the re-use of scrap steel. (In the US, scrap steel
consumption in 2008 was estimated to be 48mt, compared to raw steel
production of 55.9mt – in fact, in the US auto industry in 2008 the
recycling rate was 106%, meaning more steel was produced by
recycling old vehicles than was used to make new ones). The world’s
main steel producing nation is China, with 550mt (48.5%) of the
estimated global raw steel production in 2009 of 1,133mt. This was up
from 500mt (37.6%) in 2008 and 478mt in 2007.
Raw steel and pig iron production, 2008 and 2009 [units mt]
2009 2008 2009 2008
China 540 471 550 500
Japan 61 86 79 119
Russia 40 48 55 69
Korea, Republic 26 31 47 53
Ukraine 25 31 28 37
Brazil 22 35 24 34
United States 18 34 56 92
Germany 17 29 29 46
France 7 12 12 18
United Kingdom 7 11 9 14
Italy 5 11 18 30
Other countries 96 133 226 318
World total (rounded) 864 932 1,133 1,330
Pig iron Raw steel
Source: USGS
Australian junior iron ore company stock prices have gained 38% in the past 12 months. Canadian juniors are 23% below yearly highs and 147% above yearly lows China is the world’s major producer of steel and user of iron ore. Three of the top five steel producers are in Asia. China and Russia are in the top five for both consumption and production of iron ore.
Resource Capital Research
December Quarter 2010, Iron Ore Review Disclaimer and disclosure attached. Copyright© 2010 by Resource Capital Research Pty Ltd. All rights reserved. 31
The USGS estimated that global steel production in 2009 was 1133mt.
The IISI crude steel production index indicates production for 2009 was
1172mt. Production in 2010 is likely to be higher, at 1387mt.
Ranking of individual steel producers, 2007 to 2009
2007
Rank mmt Rank mmt Rank mmt
1 73.2 ArcelorMittal UK 1 103.3 1 116.4
2 40.2 Hebei Steel Group China 5 33.3 na 31.1
3 38.9 Baosteel Group China 3 35.4 5 28.6
4 30.4 Wuhan Steel Group China 7 27.7 11 20.2
5 29.6 POSCO Korea 4 34.7 4 31.1
6 27.6 Nippon Steel Japan 2 37.5 2 35.7
7 26.4
Jiangsu Shagang
Group China 9 23.3 8 22.9
8 26.4
Shandong Steel
Group China 11 21.8 8 23.8
9 26.3 JFE Japan 6 33 3 34
10 21.9 Tata Steel India 8 24.4 6 26.5
11 20.2 Anshan Steel China 17 16 na 16.2
12 17.3 Shougang Group China 22 12.2 23 12.9
13 16.8 Severstal Russia 14 19.2 15 17.3
14 15.3 Evraz Russia 15 17.7 17 16.2
15 16.2 U.S. Steel USA 10 23.2 10 21.5
2009 2008
Company Country
Source: Metal Bulletin (2009), World Steel Association (2008, 2007)
In 2009, the largest individual supplier of steel was ArcelorMittal with
73.2mt, a 29.1% reduction from 103.3mt in 2008. Four of the top five
companies were the same in 2009 and 2008, and three were from
China. The year-on-year changes in production are strongly bimodal: for
these 15 companies, the Chinese producers increased production by
20.4%, while the non-Chinese producers decreased output by an
average 19.6%, which shows the speed at which the stimulus-driven
Chinese steel sector recovered from the GFC.
Iron ore production and reserves
In 2009, the largest iron ore producers in grade equivalent terms
(62.5% Fe) were Australia (394mt), China (365mt) and Brazil (300mt).
Total production was ~1688mt, a -2.7% year-on-year decline from
2008.
The three largest individual producers outside China were CVRD (Vale)
of Brazil, Rio of Australia/UK and BHP of Australia. In terms of absolute
tonnes, China was the largest producer at 880mt, but much of this was
at low grades.
According to Australian Government agency ABARE, the global seaborne
iron ore trade was ~ 914mt in 2009, up 3% from 887mt in 2008, and is
expected to increase to 998mt in 2010 (9.2%). The biggest exporter in
2009 and 2010 was and is expected to be Australia, with 352mt
(38.5%) and 394mt (39.5%) respectively.
The largest individual steel producer in 2007-2009 was ArcelorMittal (UK). The top Chinese steel producers, driven by Government stimulus in the GFC, increased production in 2009 by 20.4% - compared to a non-China decline of 19.6%. In 2009, the three major iron ore suppliers, by nation, were Australia (BHP & Rio Tinto), China, and Brazil (Vale). ABARE is forecasting a 9.2% increase in the iron ore trade from 2009 to 2010.
Resource Capital Research
December Quarter 2010, Iron Ore Review Disclaimer and disclosure attached. Copyright© 2010 by Resource Capital Research Pty Ltd. All rights reserved. 32
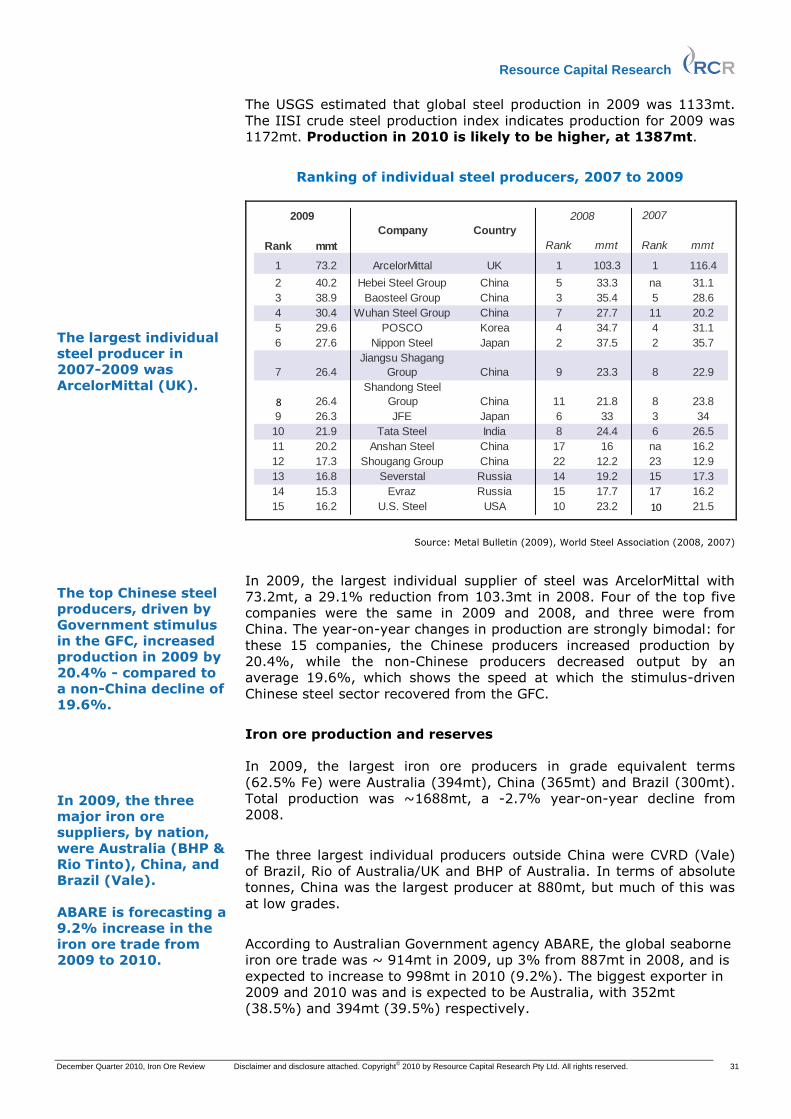
Global stainless steel production (kt)
Source: Vale
Global iron ore imports plus China domestic production
Source: BHP Billiton
Chinese regional steel intensity (use per capita 2009)
Source: Rio Tinto, Global Insight China regional Service
After falling during three consecutive years, into the GFC, global stainless steel output has recovered. Increasing iron ore consumption by China, both under contract and at floating prices (i.e. spot), has driven recent market growth. As nations and regions develop, steel intensity per capita grows with GDP. China is approaching mid-range intensity on a global scale but many provinces are just beginning to climb the intensity curve. This implies consistent or increasing steel demand for the foreseeable future.
Resource Capital Research
December Quarter 2010, Iron Ore Review Disclaimer and disclosure attached. Copyright© 2010 by Resource Capital Research Pty Ltd. All rights reserved. 33
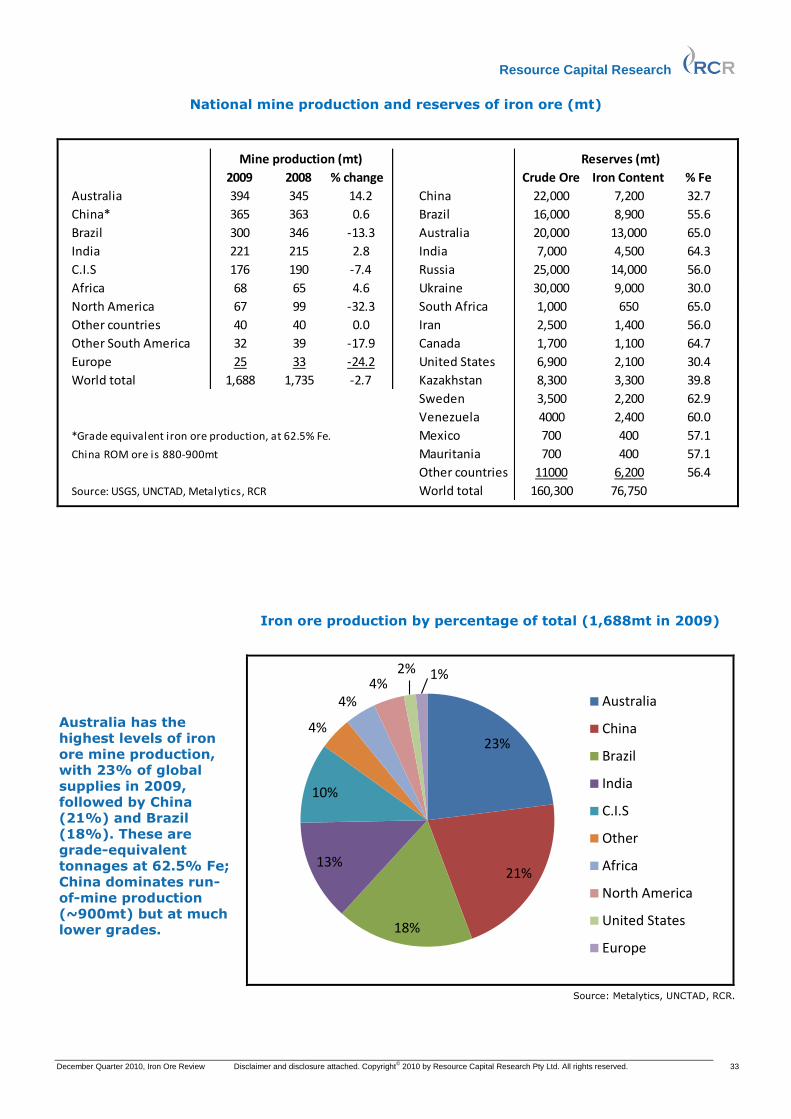
National mine production and reserves of iron ore (mt)
2009 2008 % change Crude Ore Iron Content % Fe
Australia 394 345 14.2 China 22,000 7,200 32.7
China* 365 363 0.6 Brazil 16,000 8,900 55.6
Brazil 300 346 -13.3 Australia 20,000 13,000 65.0
India 221 215 2.8 India 7,000 4,500 64.3
C.I.S 176 190 -7.4 Russia 25,000 14,000 56.0
Africa 68 65 4.6 Ukraine 30,000 9,000 30.0
North America 67 99 -32.3 South Africa 1,000 650 65.0
Other countries 40 40 0.0 Iran 2,500 1,400 56.0
Other South America 32 39 -17.9 Canada 1,700 1,100 64.7
Europe 25 33 -24.2 United States 6,900 2,100 30.4
World total 1,688 1,735 -2.7 Kazakhstan 8,300 3,300 39.8
Sweden 3,500 2,200 62.9
Venezuela 4000 2,400 60.0
*Grade equivalent iron ore production, at 62.5% Fe. Mexico 700 400 57.1
China ROM ore is 880-900mt Mauritania 700 400 57.1
Other countries 11000 6,200 56.4
Source: USGS, UNCTAD, Metalytics, RCR World total 160,300 76,750
Mine production (mt) Reserves (mt)
Iron ore production by percentage of total (1,688mt in 2009)
23%
21%
18%
13%
10%
4%
4%4%
2% 1%
Australia
China
Brazil
India
C.I.S
Other
Africa
North America
United States
Europe
Source: Metalytics, UNCTAD, RCR.
Australia has the highest levels of iron ore mine production, with 23% of global supplies in 2009, followed by China (21%) and Brazil (18%). These are grade-equivalent tonnages at 62.5% Fe; China dominates run-of-mine production (~900mt) but at much lower grades.
Resource Capital Research
December Quarter 2010, Iron Ore Review Disclaimer and disclosure attached. Copyright© 2010 by Resource Capital Research Pty Ltd. All rights reserved. 34
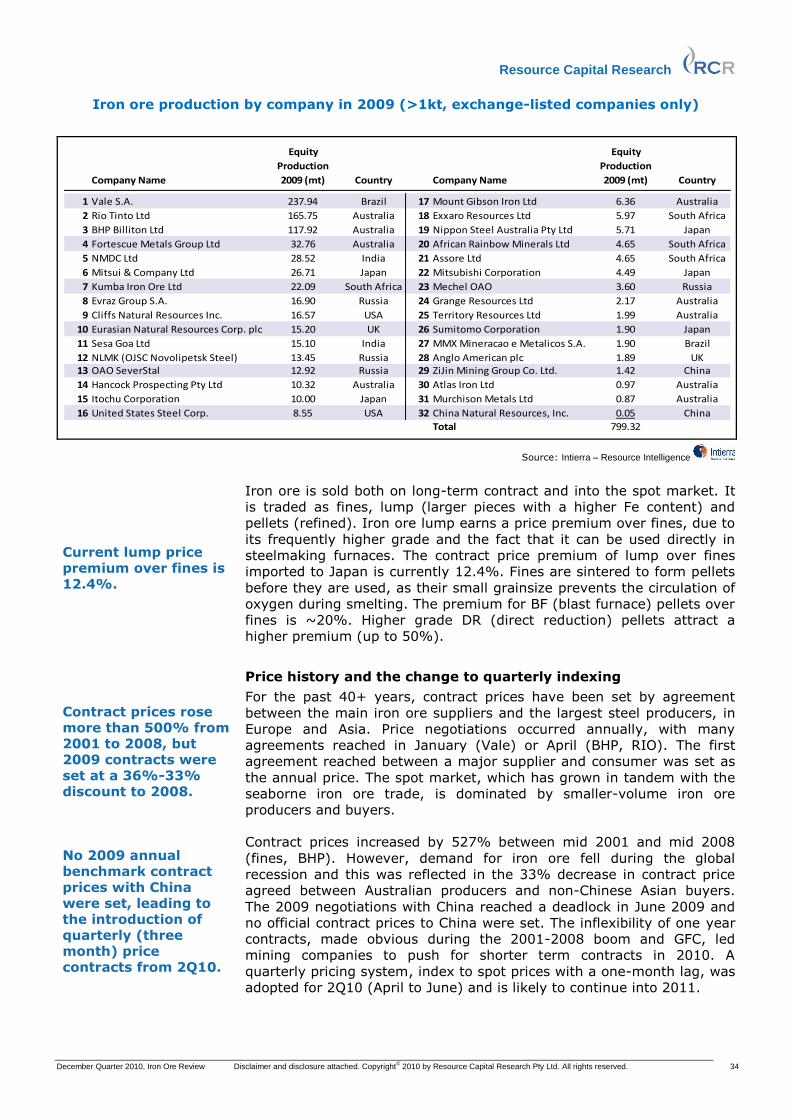
Iron ore production by company in 2009 (>1kt, exchange-listed companies only)
Company Name
Equity
Production
2009 (mt) Country Company Name
Equity
Production
2009 (mt) Country
1 Vale S.A. 237.94 Brazil 17 Mount Gibson Iron Ltd 6.36 Australia
2 Rio Tinto Ltd 165.75 Australia 18 Exxaro Resources Ltd 5.97 South Africa
3 BHP Billiton Ltd 117.92 Australia 19 Nippon Steel Australia Pty Ltd 5.71 Japan
4 Fortescue Metals Group Ltd 32.76 Australia 20 African Rainbow Minerals Ltd 4.65 South Africa
5 NMDC Ltd 28.52 India 21 Assore Ltd 4.65 South Africa
6 Mitsui & Company Ltd 26.71 Japan 22 Mitsubishi Corporation 4.49 Japan
7 Kumba Iron Ore Ltd 22.09 South Africa 23 Mechel OAO 3.60 Russia
8 Evraz Group S.A. 16.90 Russia 24 Grange Resources Ltd 2.17 Australia
9 Cliffs Natural Resources Inc. 16.57 USA 25 Territory Resources Ltd 1.99 Australia
10 Eurasian Natural Resources Corp. plc 15.20 UK 26 Sumitomo Corporation 1.90 Japan
11 Sesa Goa Ltd 15.10 India 27 MMX Mineracao e Metalicos S.A. 1.90 Brazil
12 NLMK (OJSC Novolipetsk Steel) 13.45 Russia 28 Anglo American plc 1.89 UK13 OAO SeverStal 12.92 Russia 29 ZiJin Mining Group Co. Ltd. 1.42 China
14 Hancock Prospecting Pty Ltd 10.32 Australia 30 Atlas Iron Ltd 0.97 Australia
15 Itochu Corporation 10.00 Japan 31 Murchison Metals Ltd 0.87 Australia
16 United States Steel Corp. 8.55 USA 32 China Natural Resources, Inc. 0.05 China
Total 799.32
Source: Intierra – Resource Intelligence
Iron ore is sold both on long-term contract and into the spot market. It
is traded as fines, lump (larger pieces with a higher Fe content) and
pellets (refined). Iron ore lump earns a price premium over fines, due to
its frequently higher grade and the fact that it can be used directly in
steelmaking furnaces. The contract price premium of lump over fines
imported to Japan is currently 12.4%. Fines are sintered to form pellets
before they are used, as their small grainsize prevents the circulation of
oxygen during smelting. The premium for BF (blast furnace) pellets over
fines is ~20%. Higher grade DR (direct reduction) pellets attract a
higher premium (up to 50%).
Price history and the change to quarterly indexing
For the past 40+ years, contract prices have been set by agreement
between the main iron ore suppliers and the largest steel producers, in
Europe and Asia. Price negotiations occurred annually, with many
agreements reached in January (Vale) or April (BHP, RIO). The first
agreement reached between a major supplier and consumer was set as
the annual price. The spot market, which has grown in tandem with the
seaborne iron ore trade, is dominated by smaller-volume iron ore
producers and buyers.
Contract prices increased by 527% between mid 2001 and mid 2008
(fines, BHP). However, demand for iron ore fell during the global
recession and this was reflected in the 33% decrease in contract price
agreed between Australian producers and non-Chinese Asian buyers.
The 2009 negotiations with China reached a deadlock in June 2009 and
no official contract prices to China were set. The inflexibility of one year
contracts, made obvious during the 2001-2008 boom and GFC, led
mining companies to push for shorter term contracts in 2010. A
quarterly pricing system, index to spot prices with a one-month lag, was
adopted for 2Q10 (April to June) and is likely to continue into 2011.
Current lump price premium over fines is 12.4%. Contract prices rose more than 500% from 2001 to 2008, but 2009 contracts were set at a 36%-33% discount to 2008. No 2009 annual benchmark contract prices with China were set, leading to the introduction of quarterly (three month) price contracts from 2Q10.
Resource Capital Research
December Quarter 2010, Iron Ore Review Disclaimer and disclosure attached. Copyright© 2010 by Resource Capital Research Pty Ltd. All rights reserved. 35
Iron ore: elemental facts
Iron is a chemical element with atomic number 26, specific gravity
7.874g/cm3 and the symbol Fe. It is the sixth-most abundant element in
the universe and composes ~5% of the Earth’s crust. At atmospheric
temperatures and pressures it is a lustrous greyish metal that oxidises
easily. Most of the world's iron ore is produced from large formations of
hematite (Fe2O3) and magnetite (Fe3O4). (Note, the traditional spelling
of hematite is hæmatite, but this has been simplified in recent years).
Iron ore, in commercial quantities, often occurs as sedimentary Banded
Iron Formations (BIF), or as an erosion product of such formations
called Channel Iron Deposits (CID) or Detrital Iron Deposits (DID).
When heated in the presence of a reductant, iron ore will yield metallic
iron (Fe). Due to its strength and abundance, iron is the most widely
used of all metals, both in its native state (e.g. cast and wrought iron,
which also contain carbon) and alloyed with other elements (e.g. silicon,
chromium, vanadium, tungsten, molybdenum, nickel) to form steels.
Stainless steel contains a minimum 11% of chromium by mass.
Hematite iron ore, when mined, is commonly crushed and split into lump
(i.e. golf-ball size) and fines components. There are systematic
differences between the lump and fines grades. Generally the lump
product is richer in iron and lower in the other minerals, compared to
the fines product. The grade differences between lump and fines,
together with the lump percentage, are referred to as the ‘lump
algorithm’ (Source: AUSIMM). Lump ore attracts a premium due to its
higher metal content. Iron ore fines can be processed into high-grade BF
and DR pellets, which assist with oxygen circulation during smelting.
Magnetite ore is often of lower grade than hematite (~30% vs ~60%)
but can be beneficiated, often using gravity and magnetism, to form a
saleable ~70% concentrate.
The price of a dry tonne of iron ore is calculated by multiplying the price
per dry mtu of iron (ie 10kg of iron) by the per cent content of iron in
the ore, times 100. For example, if the price of iron ore fines is 97¢/Fe
dmtu, then the value per tonne of ore at 62% Fe content is 97¢ x 100 x
62% = 6014¢ or US$60.14/t.
Contract prices are often set as FOB, or free on board, which means
they don’t include freight costs. Spot prices are usually quoted as CFR,
or Cost and Freight, which means the seller has organised carriage to
the destination port and added a freight charge. This varies depending
on transport distance – freight from Australia to China is currently
~US$12/t, while from Brazil it is ~US$30/t.
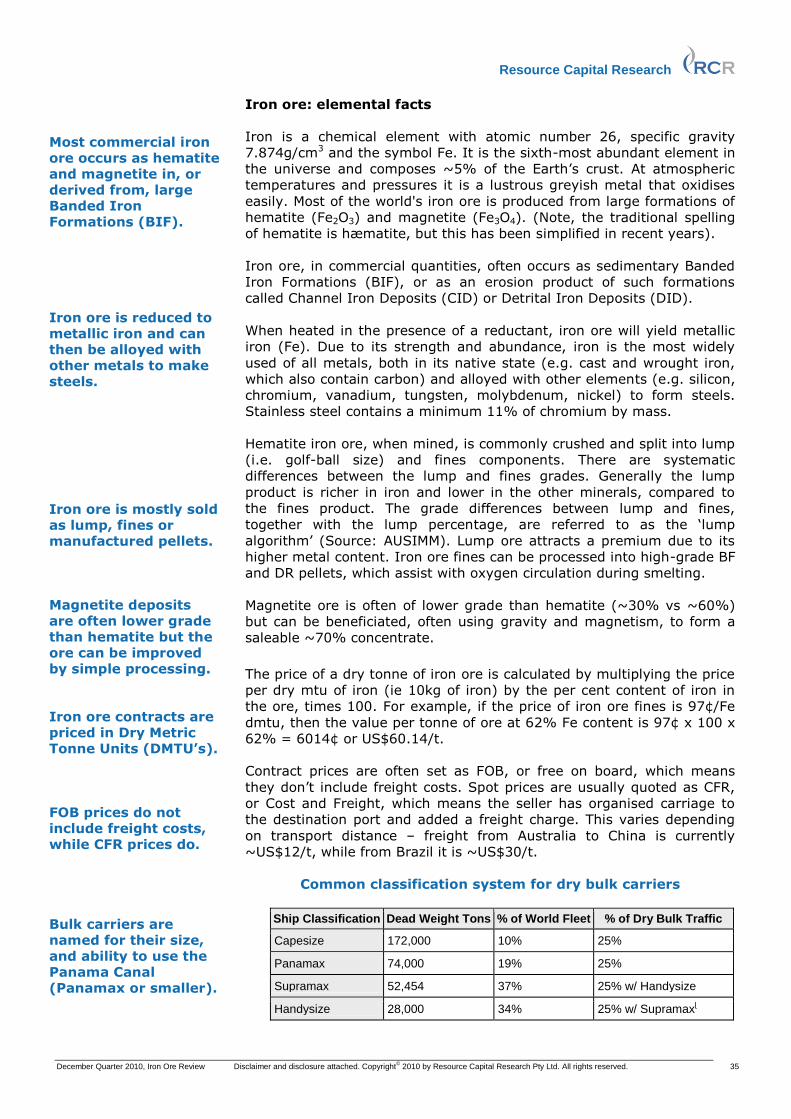
Common classification system for dry bulk carriers
Ship Classification Dead Weight Tons % of World Fleet % of Dry Bulk Traffic
Capesize 172,000 10% 25%
Panamax 74,000 19% 25%
Supramax 52,454 37% 25% w/ Handysize
Handysize 28,000 34% 25% w/ Supramax[
Most commercial iron ore occurs as hematite and magnetite in, or derived from, large Banded Iron Formations (BIF). Iron ore is reduced to metallic iron and can then be alloyed with other metals to make steels. Iron ore is mostly sold as lump, fines or manufactured pellets. Magnetite deposits are often lower grade than hematite but the ore can be improved by simple processing. Iron ore contracts are priced in Dry Metric Tonne Units (DMTU’s). FOB prices do not include freight costs, while CFR prices do. Bulk carriers are named for their size, and ability to use the Panama Canal (Panamax or smaller).

Resource Capital Research
December Quarter 2010, Iron Ore Review Disclaimer and disclosure attached. Copyright© 2010 by Resource Capital Research Pty Ltd. All rights reserved. 36
Summary of main Australian iron ore ports with current capacity and planned expansions
Port State DistrictCapacity/
Expansion (mt)Start/expansion Vessel size Owners/Planners (Fe and steel) Capex Comment
Ankatell Point WA Pilbara 40/350 2013/? Cape Aquila/FMG/MCC A$145m to date
Medium term capacity expansion to 350mtpa for third party users. EIS
under way, construction from 2011. Export cap to protect other ports.
May be threatened if FMG delays expansion plans due to RSPT.
Cape Lambert (Port Walcott) WA Pilbara 80/130/190/330Operating/2013/
2015/2016?Cape Rio Tinto (53% through Robe River Assoc) A$3.4bn
Adding 50mt by 2013 and 110mt by 2015 to existing capacity, further
expansion to 330mtpa announced Jul '10
Cape Preston WA Pilbara 28/150 4Q10/na na Citic PacificA$1.8bn (port and
infrastructure)
Built for Sino Iron Project (magnetite). Citic stated in 2007 that its Cape
Preston facilities could be avaiable for third party use. Magnetite slurry
will be moved by 25km pipe but there is also road access.
Dampier WA Pilbara 140/225/230Operating/2011/
2012Cape Rio Tinto
A$2bn to date /
A$101m / A$256mPhase 2 (140mtpa) completed 2007. Third party access unlikely
Port Hedland WA Pilbara 200/360 Operating Cape BHP, FMG naCurrently, the only export point for BHP and Fortescue iron ore.
Multiple expansions planned for next 3-5 years (see below).
" additional Inner Harbour
(NW Creek and Utah Point)WA Pilbara 110/155 2010/2013 Cape NWIOA/Hancock/PHPA* A$2.1bn (NWIOA)
NWIOA expansion planned for inner harbour (South West Creek) from
2010, ramp up to 2013, 20mtpa for new users. Hancock 30mtpa and up
to 55mtpa from near harbour mouth, must be dredged before NWIOA.
Utah Point Berth Project completed 2010 for A$225m, added 18mtpa.
" Outer Harbour WA Pilbara 400/400 2015/? Cape BHP A$10bn
BHP 200mt Quantum Project, plus 200mt for third parties, from 2015,
and potential to add a further 400mt within the decade; could be on
hold or not needed if RIO/BHP infrastructure deal goes ahead.
Oakajee Port and Rail WA
Midwest, 20km
N. Of
Geraldton
45/100 2014 na Murchison Metals, Mitsubishi A$4.3bn
Bankable Feasibility Study was submitted in March 2010. The project
includes 570km of rail, with spur lines to the Jack Hills and Weld Range
projects.
Darwin iron ore berth WA Darwin 2/5-6 Operating/2013Cape (current
Panamax)Darwin Ports A$336m Feasibility study to cost US$300m.
Whyalla SA Eyre Peninsula 8? Operating na Onesteel na Onsteel is unlikely to provide capacity for juniors
Port Bonython SAWhyalla, Eyre
Peninsula20 2012 na Spencer Gulf Port Link A$600m Progress is slow and potential users are sceptical of current timetable
Port Pirie SA Adelaide 3-4/7-8 2011/na na Flinders Ports naWestern Plains Resources has negotiated access from 2011 and will
build infrastructure, including a barge loader. Capex to be announced.
Port Lincoln SA Eyre Peninsula 1.6 2011 na Centrex A$65m Approved by SA Govt in 1Q10
Sheep Hill SA Eyre Peninsula 20 2013 Cape Centrex, EPMA A$150mPotential to share among iron ore juniors in new Eyre Peninsula Mining
Alliance. Now favoured long term over single site at Port Lincoln
Port Adelaide SA Adelaide 1.7 4Q10 na Flinders Ports IMX Resources Ltd shipping 1.7mtpa from Cairn Hill from Dec '10
Port Latta TAS NW2.6 (pellets and
concentrate)Operating Suezmax
Australian Bulk Minerals (90% Grange
Resources Ltd)na
Magnetite pellets shipped from Savage River Project, shipped in
Handymax or Panamax
Port Kembla NSW Illawarra na Operating na Bluescope Steel (main user) Could benefit possible western NSW iron ore miners
Potential total capacity by 2015
Abare iron ore production forecast for 2015 is 552mt, i.e., there should be ample capacity for expansion of production by 2015.
+1760mt
Potential capacity is 1760mt by 2015. ABARE (Australian Gov’t statistics) forecasts 552mt production by 2015, but excess port capacity
could stimulate further development. Infrastructure projects are promoted by alliances of junior resource companies. These include the
NWIOA (North West Iron Ore Alliance): Atlas Iron (ASX:AGO), Brockman Resources (ASX:BRM) and BC Iron (ASX:BCI); the GIOA (Geraldton
Iron Ore Alliance): Crossland Resources (50% Murchison, ASX:MMX), Gindalbie Metals (ASX:GBG), Golden West Resources (ASX:GWR) and
Asia Iron Ore Holdings; and the EPMA (Eyre Peninsula Mining Alliance): Centrex Metals (ASX:CXM), Lincoln Minerals (ASX:LML), Minotaur
Exploration (ASX:MEP) and Iron Road (ASX:IRD)