seismic stability analysis of sangan iron ore mine … · seismic stability analysis of sangan iron...
TRANSCRIPT

Seismic Stability Analysis of Sangan Iron Ore Mine Project Tailings Dam
Afshin DelavarFarshad Rashidi-NejadNavid Ganjian
Sydney, 28 July 2015
• Introduction
• Sangan Iron Ore Mines (SIOM) Tailings Dam
• Staged Development
• Stability Assessment of Tailings Dam
• Seismic Stability Analysis with Numerical
Methods
• Conclusion
Agenda
• TSFs are constructed not only to minimise orreduce the adverse environmental impactsassociated with tailings, but also to play a keyrole in recycling of process water andfreshwater conservation.
• A failure of a tailings dam can be much moreharmful than a failure of a water retaining dam.So, they are more sensitive to natural disasterslike earthquakes and floods.
Why TSFs?
• The current rate of major tailings damfailures has been estimated as being ofthe order of 2 to 5 per annum. Asaddressed yesterday by the keynotespeaker Professor Andy Fourie, there areextra failures that have not been includedin the statistics, because they have notbeen reported! For example there aresome unreported cases in Brazil and Iran.
Tailings Dams Failures
• It is not unusual to design a tailings dam in low riskseismic areas using a ‘pseudo-static method’.
• This method of analysis is very popular for seismicanalysis of embankments/dykes due to thesimplicity of the method, but such a design is notsufficient, in high risk seismic areas like Iran.
• The response of dams to ground shaking isdetermined by the properties of the constituentmaterial, the geometry, and the nature of theground motion.
Tailings Dams Design
• Sangan Iron Ore Mines (SIOM) is located in north eastIran and is the second largest iron ore recourse andthird largest iron ore operation of the country.
• Total mineral resources of the SOIM in three regions(W, C & E) were estimated to be 1.2 bt
• The existing TSF of Sangan has been designed forstorage of 45 Mm3 equivalent to 74 Mt of tailings
• Capacity of concentrator plant is 2.6 Mt/a (Phase 1)
• Expansion of the project to 15 Mt/a is underway.
Sangan Iron Ore Mines (SIOM) Tailings Dam
• SIOM located in a region of the Iranian Plateau thatexhibits diverse geological formations and seismicity.
• The original TSF for the project designed by Klohn-Crippen Consultants in 1998.
• Further design considerations to support the FS effortsdeveloped by AMEC (AMEC, 2007).
TSF Design Background
• As there are no specific regulations for the design oftailings embankments in Iran, the regulations developedby the Canadian Dam Association, InternationalCommission on Large Dams has been considered fordam design.
Regulations

Sangan Iron Ore Mines (SIOM) Tailings Dam

• Development of the TSF can be sequenced and built instages (Kerr and Ulrich, 2011). This causes deferral ofsome of the capital costs over the life of the mine.
• TSF of Sangan Project was designed to be developedin three phases.
• The three- celled TSF was located approximately 3 kmsouth-east of the processing facility.
TSF’s Staged Development
• In FS, due to the gentle sloping alluvial plain on whichthe TSF is located, a combination of excavation andearth-filled embankment configuration was determinedto be the most logical and feasible method ofconstructing the TSF.• Stage 1: Two years of tailings storage (3.5 Mm3)
(constructed using downstream dam raise methodology
• Stage 2: Four years of tailings storage (6 Mm3)• Stage 3: Eleven years (6.6 Mm3)
TSF’s Stage Development
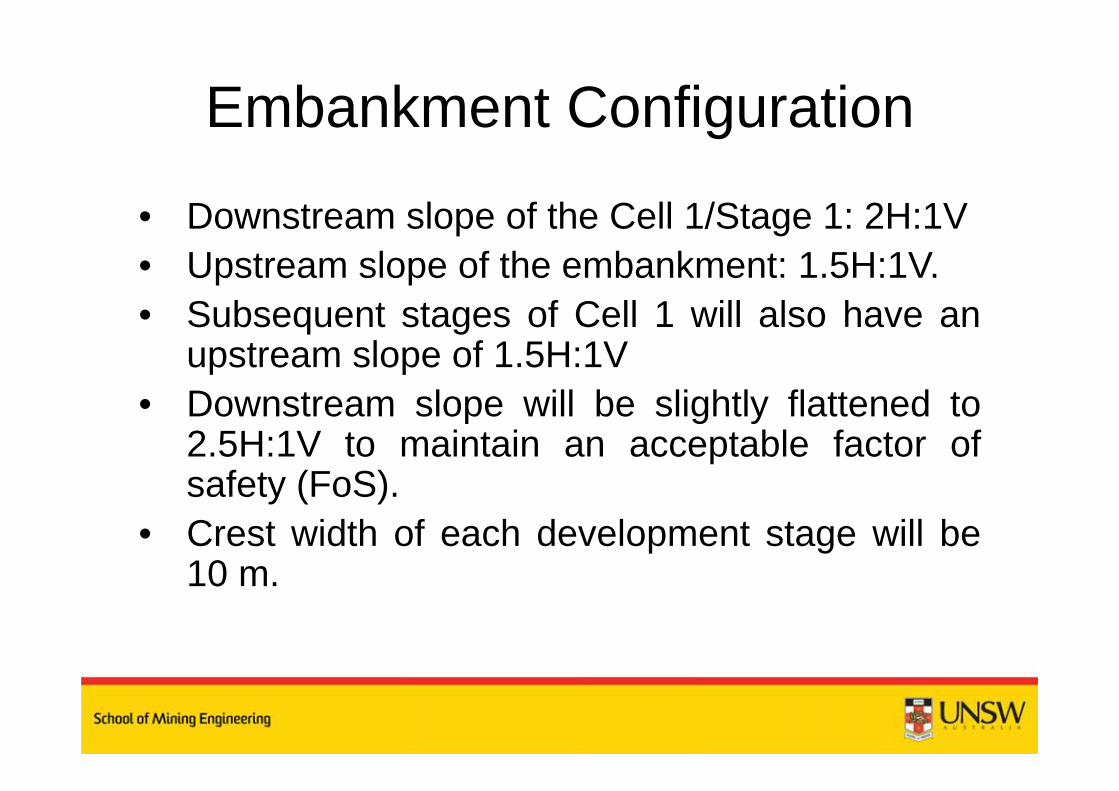
• Downstream slope of the Cell 1/Stage 1: 2H:1V• Upstream slope of the embankment: 1.5H:1V.• Subsequent stages of Cell 1 will also have an
upstream slope of 1.5H:1V• Downstream slope will be slightly flattened to
2.5H:1V to maintain an acceptable factor ofsafety (FoS).
• Crest width of each development stage will be10 m.
Embankment Configuration

Characteristics of Material Used in Embankment Construction

Typical Dam Sections and Details

• Performance of slopes during earthquakes, seismichazard analysis, ground motion characterisation;pseudo-static stability analysis and Newmark analysisare the most commonly used methods used for seismicanalyses of slopes (Wyllie and Mah, 2004).
• Two general scenarios have been considered:o Scenario 1: strictly addresses the stability of Stage 1
during operations. o Scenario 2: both the operational and uncertain.(a conservative phreatic surface was considered for stability assessment.)
Stability Assessment of Tailings Dam and Foundation

• Both static and pseudo-static analyses were completed forthe downstream portion of the final embankmentconfiguration of the Cell 1/Stage 3 embankment.
• There is no serious concern of the instability for the upstreamportion of the final embankment as the downstream damraise methodology is used and on the other hand, theupstream slope batters will be covered with tailings asimpoundment is filled.
• Liquefaction of both foundation and embankment materials isnot considered to be a threat to embankment stability at theSangan site due to the in situ density of the foundation soilsand prescribed density of the embankment fills.
Stability Assessment of Tailings Dam and Foundation
• According to the statistics published by ICOLDin United States in 2000, earthquake ranked asthe second-most important cause for seriousfailure of tailings dams after instability ofembankments.
Stability Assessment of Tailings Dam and Foundation
• FoS > 1.3 for short-term (static and pseudo-static stabilityanalyses), construction conditions (when excess, construction-induced pore pressures might exist within the dam fill
• FoS > 1.5 for long-term (Seismic stability analysis , steadystate (ie closure) conditions.
A pseudo-static stability analysis for the downstream portion ofStage 3 of the dam was evaluated using a Peak GroundAcceleration (PGA) of 0.3 g and a design earthquake magnitudeof 7.5.All modeled soil types were assumed to behave as Mohr–Coulomb materials.
Design Criteria
Two analytical scenarios carried out for the Cell 1/Stage 3(maximum height) during the stability assessment byAMEC were:
• Stage 3 end of construction with seepage entering theembankment from the tailings surface and exiting at thedownstream slope two metres above the groundsurface (high phreatic surface)
• Stage 3 end of construction with seepage from thetailings surface and exiting at the downstream toe (lowphreatic surface).
Stability Modelling Assumptions and Method of Analyses

• These scenarios were completed for both static andseismic load (earthquake) conditions.
• For seismic evaluation, the seismic loading applied wasfrom the PGA of 0.3 g was 0.12 g which is equal to 40per cent of the peak ground acceleration of the designearthquake.
• The results of the stability assessment indicate that thestructure would be stable for Cell 1.
Stability Modeling Assumptions and Method of Analyses

• Due to complexity of soil behaviour, phreaticconditions, dynamic pore pressure fluctuations,applicable PGAs, etc, assessment of seismic responsesfor these structures is challenging.
• FLAC 2D software with different features such asmeasuring large deformation, using different constitutivemodels and pore pressure has been used for seismicanalyses of Sangan Project’s TSF.
• Before seismic analyses, the embankment should bestatically stable in various scenarios.
Seismic Stability Analyses With Numerical Methods
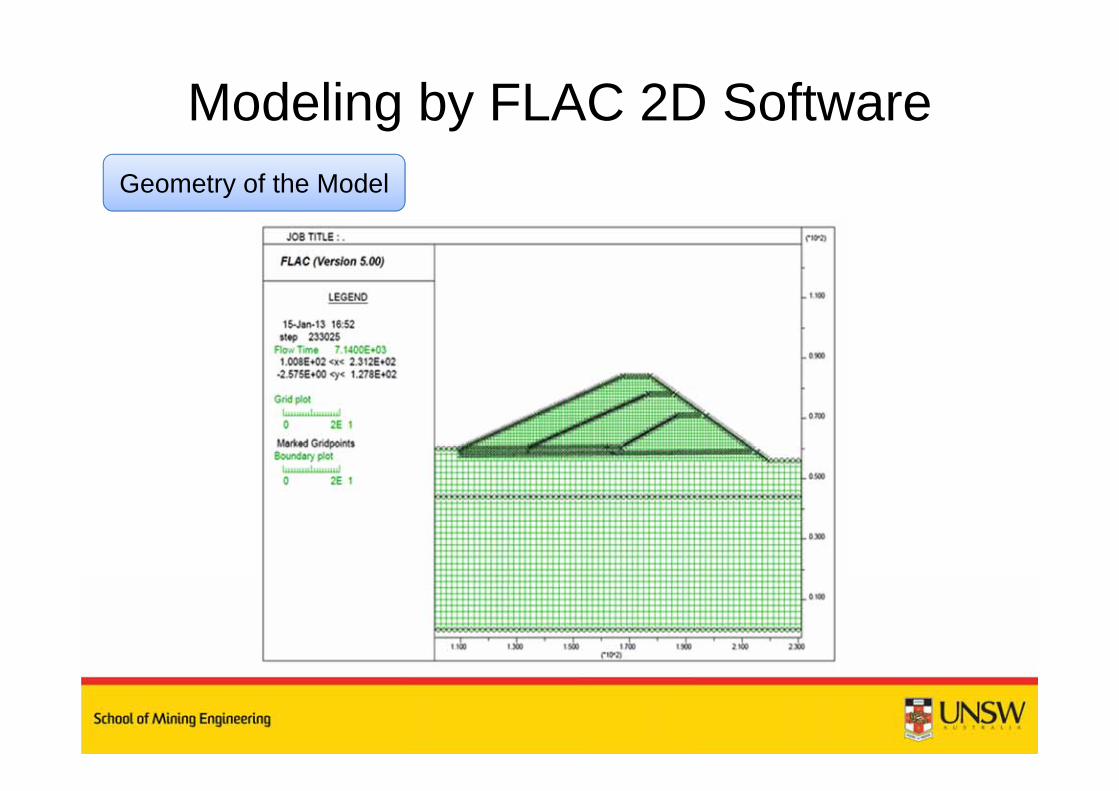
Geometry of the Model
Modeling by FLAC 2D Software
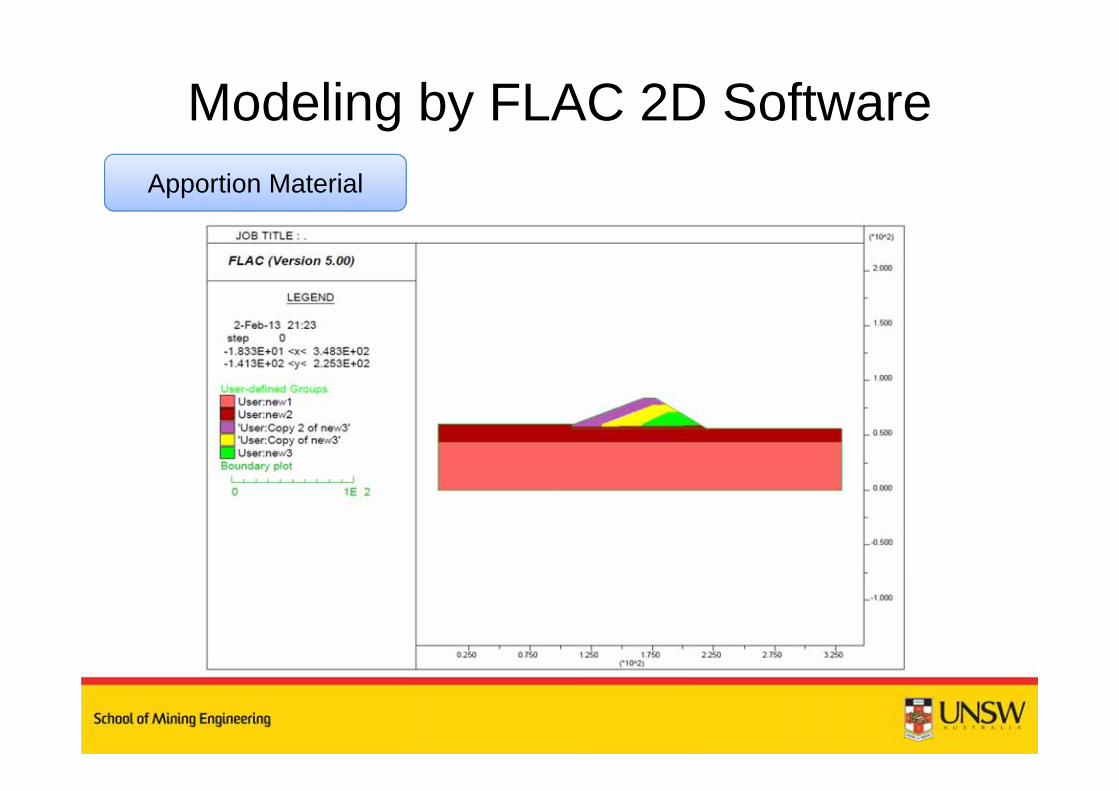
Apportion Material
Modeling by FLAC 2D Software

Fixed Boundaries
Modeling by FLAC 2D Software
fix y
Fix x Fix
x

Model Balancing
Modeling by FLAC 2D Software

• In FLAC, earthquake load can be applied in one of the following ways:
an acceleration history a velocity history a stress (or pressure) history a force history
Seismic Stability Analyses with Numerical Methods

In accordance with the ICOLD Guidelines:
1. Safety Evaluation Earthquake (SEE), Maximum Credible Earthquake (MCE), Maximum Design Earthquake (MDE),
2. Design Basis Earthquake (DBE), 3. Operating Basis Earthquake (OBE), 4. Construction Earthquake (CE),
Seismic Stability Analyses with Numerical Methods

In this study, seismic loading has been applied to themodel by using recorded accelerograms for Tabas (Iran-1978) and Chi Chi (Taiwan-1999) earthquakes.
At the moment of wave propagation in soil environmentduring seismic analysis, there is a possibility thatnumerical distortion may occur under undesirablecondition.
The amount of applied frequency to environment and wavevelocity could affect numerical accuracy of wave transfercondition. In order to have the accuracy in wavetransferring at soil or stone continuous environment, it isnecessary that the recommended condition satisfied byKuhlemeyer & Lysmer (1973).
Seismic Loading
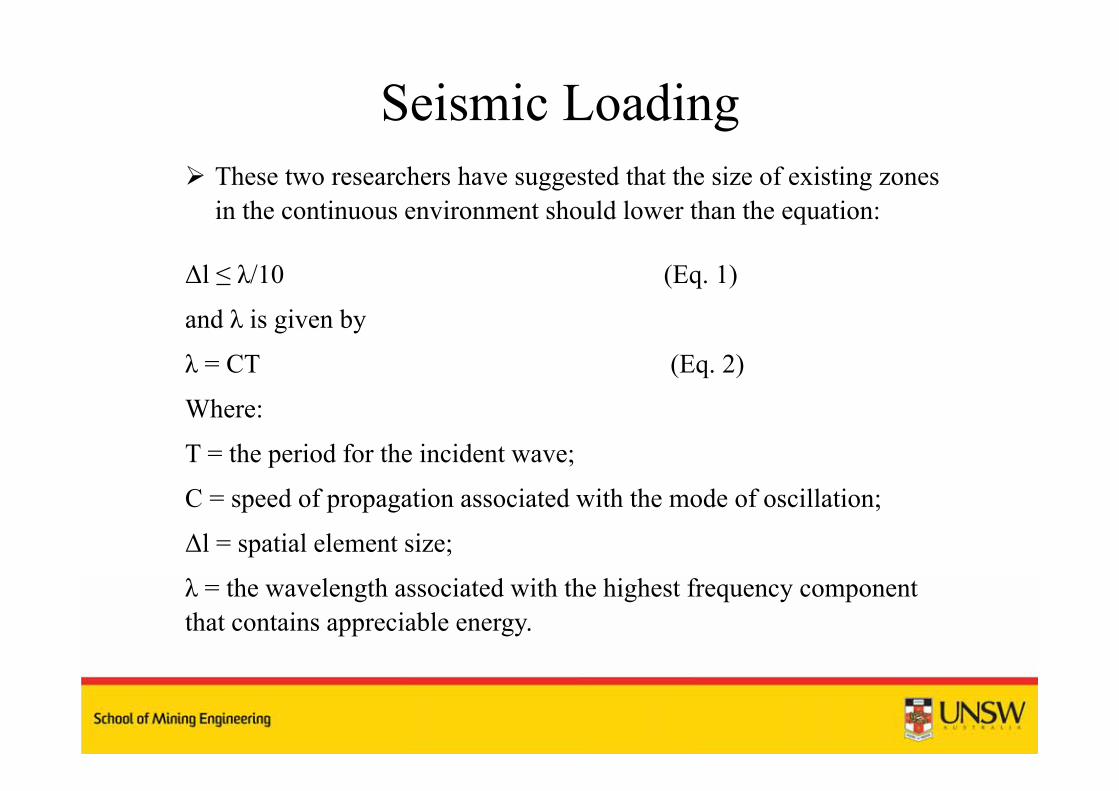
These two researchers have suggested that the size of existing zonesin the continuous environment should lower than the equation:
Δl ≤ λ/10 (Eq. 1)
and λ is given by
λ = CT (Eq. 2)
Where:
T = the period for the incident wave;
C = speed of propagation associated with the mode of oscillation;
Δl = spatial element size;
λ = the wavelength associated with the highest frequency component that contains appreciable energy.
Seismic Loading

For the selected earthquakes, the wavelength is 25.8,which means the size of biggest elements should belower or equal to 2.58 in order to prevent numericaldistortion.
Considering that elements selected for foundation ofmodel and dam are 2 m and 1 m respectively, in thismodel, it is predicted that numerical distortion will notoccur and the recommended condition by Kuhlemeyer &Lysmer is maintained.
Seismic Loading

Row Earthquake Name
Since the Earthquake Location Ms M ML
1 Tabas 1978.09.16 Tabas - Iran 7.4 7.4 7.72 Chi-Chi 1999.09.20 Chi-Chi - Taiwan 7.6 7.6 7.3
Characteristics of studies earthquakes have been listed in the Table :
Characteristics of studies earthquakes
Time [sec]87.576.565.554.543.532.521.510.50
Acce
lera
tion
[g] 0.5
0
-0.5
-1
Time [sec]6.565.554.543.532.521.510.50
Acce
lera
tion
[g]
0.60.40.2
0-0.2-0.4-0.6
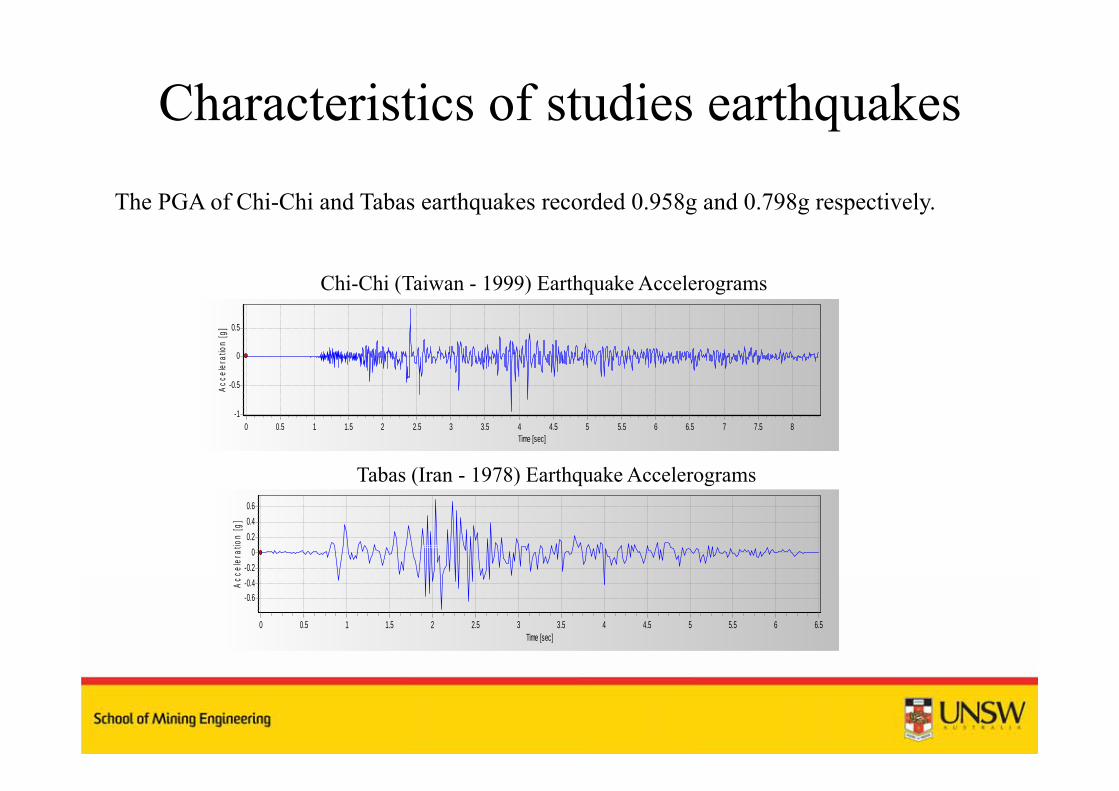
Chi-Chi (Taiwan - 1999) Earthquake Accelerograms
Tabas (Iran - 1978) Earthquake Accelerograms
The PGA of Chi-Chi and Tabas earthquakes recorded 0.958g and 0.798g respectively.
Characteristics of studies earthquakes
Damping type used in Sangan tailings dam analyses isRayleigh damping which is based on two parameters:
Natural frequency of model that could be measured by analysing modelin seismic state and load weight and oscillation of a point is evaluated.Vibration frequency of this point could be intended as natural frequencyof structure. In this study, natural frequency of Sangan dam in itsconstruction has been measured 2.5, 2 and 1.5 Hz for the first, second andthird stages respectively.
The second parameter, damping ratio, was considered 5%. What isnormally attempted in a seismic analysis is the reproduction of thefrequency-independent damping of materials at the correct level. Forgeotechnical materials, damping commonly falls in the range of 2 to 5%of critical.
Damping Type

In the area of 100 km radius of the site, 23 faults have been recognized.
Among the 23 faults, three of them, Khaf, Behdadan and Daruneh, have the potential to induce earthquake with magnitude of 7 to 7.4.
The highest PGA in the site because of earthquakes made from expected activity of these three faults have been 0.349g, 0.31g and 0.237g respectively. All these three faults are reverse.
Site Seismics

In this study, acceleration data have been scaled in SeismoSignal softwareaccording to maximum acceleration in the construction range of tailingsdam (0.349g) and the maximum acceleration will get raise to 0.349g.
Velocity data from this software (during earthquake time) convert to shearstress using equation 3 and they applied to bottom boundary of model.
s = 2 (ρ Cs) S
and CS is given by
Cs = (G/ρ)1/2
s = applied shear stress (Pa), ρ = density (kg/m3)
Cs = speed of s-wave propagation through medium (m/s)
S = input shear particle velocity (m/s) G = shear modulus (Pa),
Calculation Shear Stress

Shear stress was applied to bottom of the model in every three stage
Shear Stress
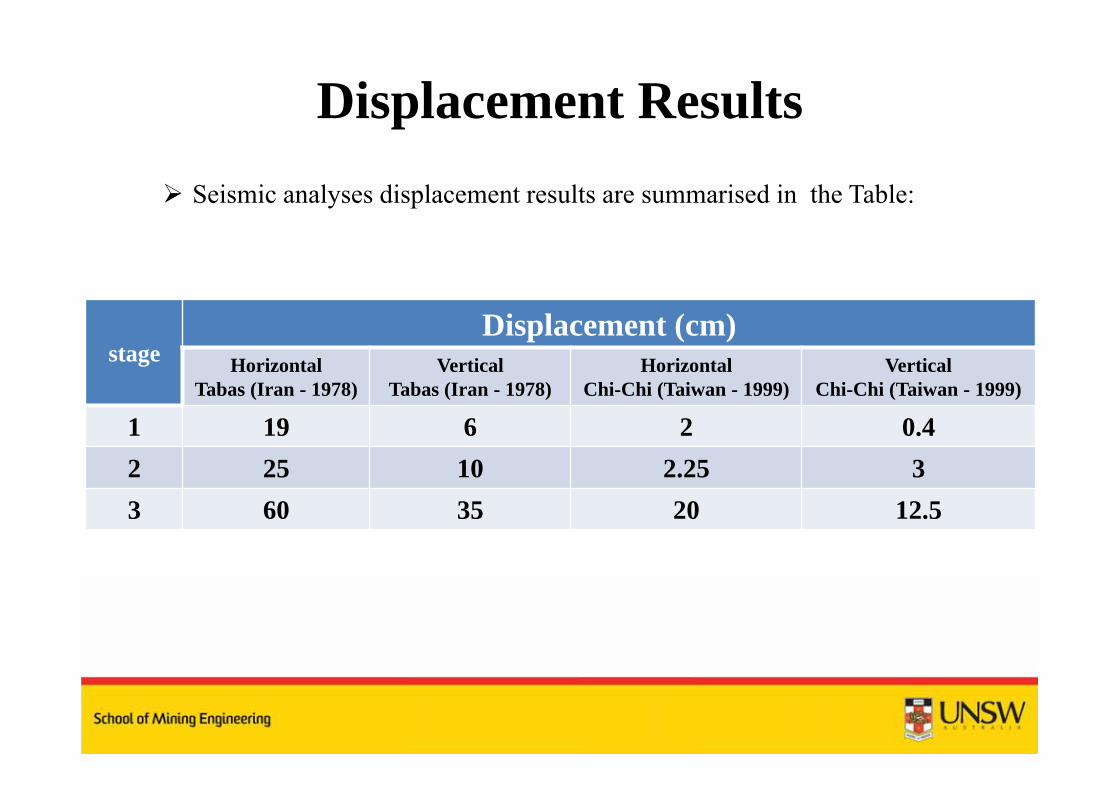
Seismic analyses displacement results are summarised in the Table:
Displacement (cm)stage Vertical
Chi-Chi (Taiwan - 1999)Horizontal
Chi-Chi (Taiwan - 1999)Vertical
Tabas (Iran - 1978)Horizontal
Tabas (Iran - 1978)
0.42619132.2510252
12.52035603
Displacement Results

Vertical displacement of the third stage after applying the Tabas earthquake
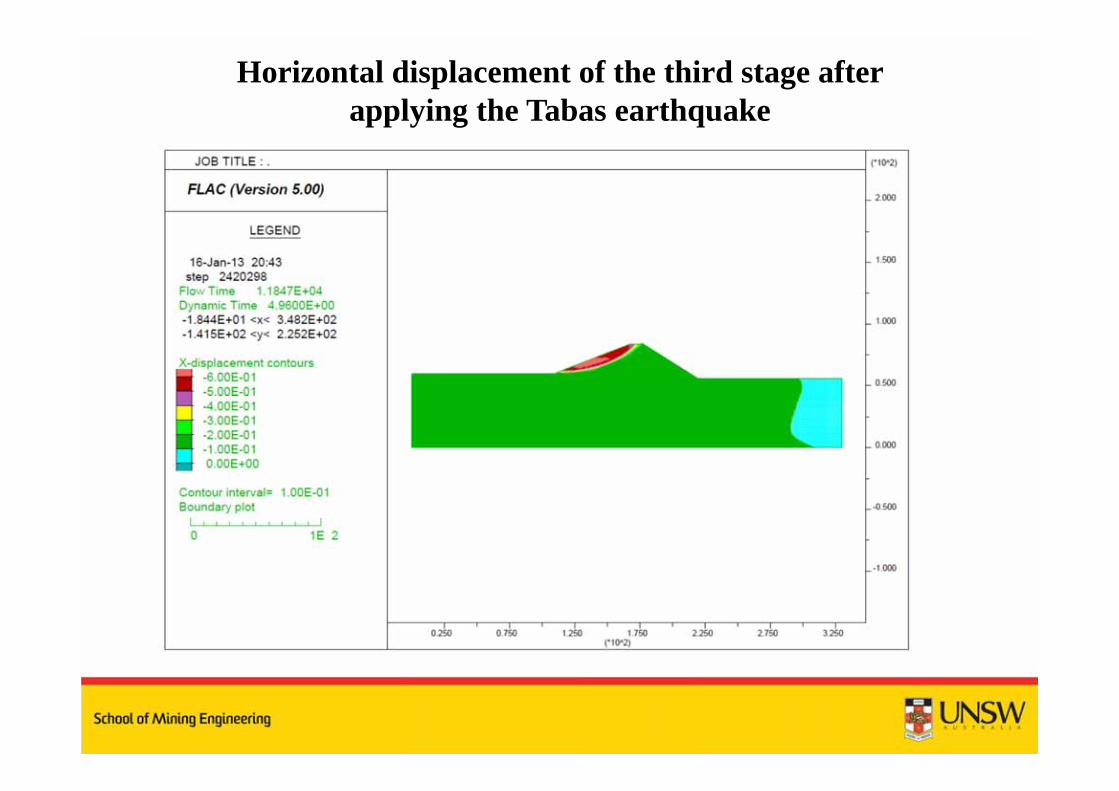
Horizontal displacement of the third stage after applying the Tabas earthquake

Shear strain increment in Seismic Analysis of the Sangan Tailings Dam are summarised in the Table:
shear strain increment stage
Chi-Chi (Taiwan - 1999)Tabas (Iran - 1978)
0.00250.03510.0050.0920.040.13
Results of Shear Strain Increment
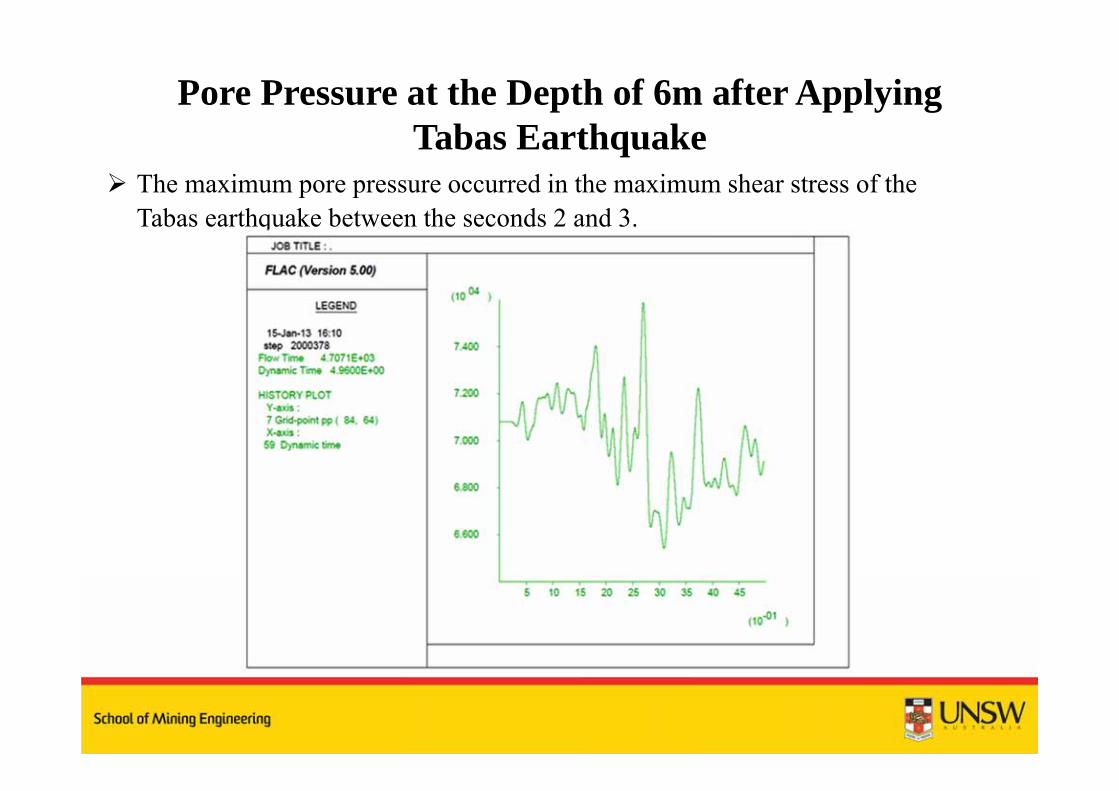
The maximum pore pressure occurred in the maximum shear stress of the Tabas earthquake between the seconds 2 and 3.
Pore Pressure at the Depth of 6m after Applying Tabas Earthquake

The crest and the upstream portion of the embankment were not experiencedsignificant horizontal displacements during earthquake period, but thedownstream portion of the embankment showed maximum horizontaldisplacement of 60 cm at the Stage 3 of the Cell 1 embankment. Alsomaximum vertical displacements by Tabas earthquake was 35 cm.
Comparison the results of the embankment response to Tabas and Chi-Chiearthquakes showed that displacement, shear stress and pore pressure by theTabas earthquake were higher than the case of Chi-Chi earthquake. Higherenergy of Tabas earthquake and the higher frequency near to the naturalfrequency of Tabas earthquake could be the reasons of this difference.
Conclusion

With respect to outcomes of this study, by applying Tabas (South KhorasanIran) earthquake as the Maximum Design Earthquake (MDE), displacement ofthe dam crest as well as the shear strain of the embankment were higher thanthe case of Chi-Chi earthquake.
The results of this case study confirm that if the studied tailings dam impactedby an earthquake of a similar magnitude to Tabas, the dam will be seismicallystable and the developed strains will not exceed allowable thresholds as definedin the earthquake bylaw (Iranian 2800 standard).
It should be noted that two-dimensional (2D) analyses were utilised and therewill be some beneficial three-dimensional (3D) to any strain surface which willbe performed in future.
Conclusion

Thank you for your attention
Any Questions?