seismic imaging with application to mine layout and ... · seismic imaging with application to mine...
TRANSCRIPT

Mine Site Exploration
and Ore Delineation
GOT
Author Index
Section Contents
Explor97 Master Page
Explor97 Contents
O Next PaperPrevious PaperPaper 77
Seismic Imaging with Application to
Mine Layout and Development
Greenhalgh, S.[1], and Mason, I.[2]
1. School of Earth Sciences, Flinders University, Adelaide, South Australia, Australia2. Dept. of Geology and Geophysics, University of Sydney, New South Wales, Australia
ABSTRACT
Significant progress has been made towards the goal of generating detailed seismic images as an aid to mining and explo-ration at Kambalda, Western Australia. Crosshole instrumentation including a slimline multi-element hydrophone arrayand a downhole electric discharge sparker sound source, have been developed.
Seismic trials at a number of mines have established that high frequency signals can be propagated over distances in excessof 100 metres. Tomographic as well as 3-D reflection imaging techniques have been applied to the data to produce usefulpictures of the ore and host rock. Ultrasonic measurements made on core samples are helpful in tomogram interpretation,but interpretation remains ambiguous. Combined seismic and radar experiments are needed to properly delineatemineralisation.
INTRODUCTION
The costs of exploration for nickel sulphide ore bodies in the Kambaldaarea of Western Australia have risen significantly by the need to drill todepths of over 600 m before encountering prospective horizons. It isimpossible at such depths to spatially sample the ore-bearing contactzone with anything like the sampling density required to detect anddelineate an ore body. Underground drilling experience suggests that itis necessary to core on a 20 × 20 m grid in order to be certain of not miss-ing any economically relevant ore bodies on the Lunnon Basalt–Ultramafic contact zone. The core from any borehole that just misses anore body carries very little evidence of the body’s presence. The coresthat are taken from an ore body give little indication of its size. Most orebodies are tubular in shape, less than two metres in thicknesses, and bro-ken up into surfaces often less than 20 m long.
The odds of striking ore while drilling blind would improve if we hadthe technology to support a ‘homing torpedo’ type of drill bit. The seis-mic method provides one such technology. Ground penetrating radar(GPR), applied potential (resistivity imaging), and radio wave imaging(RIM), are others.
These latter three methods all depend on there being sufficient elec-trical contrast between mineralisation and the host rock. Radar is beingused with considerable effect at Kambalda to detect and outline ore bod-ies underground within the mine by running borehole profiles and scans(Turner, pers. comm.). However, given the limited penetration of50 MHz radar signals (<50 m) even in favourably resistive rock, GPR
cannot be used in exploration from the surface because of the large holeseparation (>200 m) and the presence of saline water and other conduc-tors (e.g., salt lakes).
Applied potential (AP) measurements have been conducted onlysparingly at Kambalda to determine continuity of ore (conductors)between drillhole intersections. A research programme to extend AP tocross-hole resistivity imaging at Kambalda, involving numerous currentinjection points and borehole potential measurements, is about to start.
A new RIM tool is being built at Sydney University by one of us(IMM). It offers considerable scope for ore delineation but to date nosuch radio wave surveys have been undertaken in any of the Kambaldamines. We are aware that encouraging RIM results have been obtained incoal mines in Australia and the U.S., and for base metal exploration atBroken Hill and Mount Isa, Australia. RIM is expected to offer improvedpenetration (hundreds of metres) but less resolution than GPR.
There are potentially great economic benefits to be obtained from anability to seismically probe ahead of a mine face, or to image with a rea-sonable clarity a volume of rock surrounding an exploration or develop-ment borehole. The sort of geological information that a high frequency(200–2000 Hz) seismic technique can, in principle, provide includes:
• existence of ore,
• changes of rock type,
• offset of mineralisation,
• location of structure (faults, troughs, etc.),
• extent of shear zones.
In “Proceedings of Exploration 97: Fourth Decennial International Conference on Mineral Exploration” edited by A.G. Gubins, 1997, p. 585–598

586 Mine Site Exploration and Ore Delineation
The seismic technique offers good resolving power (a few metres)coupled with a sufficient degree of penetration (probing distance tens tohundreds of metres). However, ore bodies and associated structurespresent elusive seismic targets. To date, relatively few successful hardrock seismic surveys have been carried out in metalliferous miningareas. Surface reflection surveys for mapping mineralisation have beenreported by Singh (1983), Nelson (1984), Gal’perin (1984), Dahle et al.(1985), Campbell and Crotty (1988), Spencer et al. (1993), Wright et al.(1994) and Adam et al. (1996). Underground reflection and transmis-sion measurements in hard rock mines, and crosshole exploration sur-veys in crystalline rock, have been carried out in Germany (Schmidt,1959; Wachsmuth and Schmidt, 1962), Southern Africa (Reid et al.,1979; Mutyorauta, 1987; Carneiro and Gendzwill, 1996), USA (Gupta,1971; Price, 1974; Ruskey, 1981; Peterson, 1985; Freidel et al., 1995),Canada (Wong et al., 1984; Young et al., 1989; Gendzeill and Brehm,1993), Sweden (Gustavson et al., 1984), Finland (Cosma, 1983) andAustralia (Harman et al., 1987; Duncan et al., 1989; Sinadinovski et al.,1995).
In 1992 a major research programme was initiated by WesternMining Corp. at Kambalda to develop high resolution seismic and radarimaging techniques to aid mining of and exploration for nickel sulphideore bodies. The economic justification is improved cost effectiveness(and safety) of underground development, ore body delineation andsurface exploration. This paper provides a summary on some of the seis-mic work done and imaging results obtained at just one mine site withboth the seismic tomography and seismic reflection techniques.
THE KAMBALDA NICKEL SULPHIDE ENVIRONMENT
The Kambalda region is situated within the south central part of theNorseman-Wiluna greenstone belt, in the Eastern Goldfields Provinceof the Archaean Yilgarn Craton. The town of Kambalda is located560 km east of Perth.
The volcanic-sedimentary sequence at Kambalda, with its enclosedmagmatic nickel sulphide deposits, has undergone deformation, meta-morphism, intrusive activity and late stage gold mineralisation.(Cowden and Roberts, 1990).
Many rocks in this region have undergone upper greenschist to loweramphibolite-facies metamorphism. Serpentinisation and talc-carbonatealteration occurred with prograde metamorphism. There has also beena series of intrusions of mafic to felsic stocks, dykes and sills and grani-toid bodies.
The ribbon-like nickel sulphide bodies occur at the base of the low-ermost lava flows of a komatiite pile in the contact ore position immedi-ately overlying basalt, or at the base of the next one or two flows in thehanging wall position The sulphide bodies are typically stratified withsulphide content decreasing upwards. A lowermost massive ore (>80%)pyrrhotite-pentlandite layer is overlain by a matrix (40 to 80%) and dis-seminated (<40%) sulphide layers. There are significant differences inmineralogy between the massive, matrix and disseminated layers and innickel content (tenor) between different ore bodies.
The morphology of the ore zone is highly variable with the massivesulphide layers being irregular in thickness (generally less than 5 m).The matrix and disseminated layers are more regular in distribution andgenerally comprise 60 to 80% of the total thickness of the sulphide zone.
VELOCITIES AND DENSITIES OF ORESAND HOST ROCKS
Over 230 rock core samples from Kambalda were carefully selected andsubjected to ultrasonic velocity examination in the laboratory. Densitieswere also measured. The goal was to elicit the elastic properties of theore-bearing rocks to establish a physical basis (velocity and/or imped-ance contrast) for seismic investigations.
The cylindrical core samples (of diameter 51 mm and 35 mm) werecut to roughly 10 cm lengths and the ends squared to accommodate thepiezoelectric transducers. The specimens covered a wide range of rocks,including ultramafic, mafic sedimentary, felsic, intermediate and nickelsulphide ore (massive matrix disseminated). Most measurements weremade at atmospheric pressure, although 12 samples were analysedunder a uniaxial load of 12 kN (corresponding to burial depths of a fewhundred metres). The velocities measured under pressure were only 1%to 2% higher than the measurements carried out at atmospheric pres-sure. We concluded that the pressure effect was minor and could besafely ignored for our purposes.
Table I summarises the longitudinal velocities and densities, givingrange as well as mean values. There is considerable overlap in velocitybetween the various rock types so it is not possible to unambiguouslyidentify the rock on the basis of P-wave velocity alone. The variabilitywithin each rock type is due to differences in mineralogy, rockfabric/texture, and rock alteration. Figure 1 shows velocity variationwith density for the nickel sulphide ore samples. A definite inverse cor-relation exists. Density is directly related to ore grade, which is shown inunits of $ symbols in Figure 1. High density massive ore is characterisedby low velocity.
The laboratory sonic velocities were determined at a frequency of500 kHz, and proved to be about 20% lower than those measured under-ground at the Foster mine in a cross-gallery experiment (Fullager et al.
1. Insufficient samples
Table 1: Longitudinal wave velocities and densities of ore and rock samples from Kambalda, Western Australia.
Longitudinal Velocity (m/s)
DensityMean ± Std. Dev (g/cm3)Rock type
Number of
samples RangeMean ± std. dev.
Massive ore 9 4190–5750 4880 ± 450 4.30 ± 0.46
Matrix ore 8 4700–6050 5160 ± 440 3.52 ± 0.29
Disseminated ore
45 4140–6610 5440 ± 570 3.06 ± 0.23
Mafic 65 3890–7000(main cluster6000–6500)
6050 ± 730 2.93 ± 0.12
Ultramafic 68 2870–7000(main cluster5000–6500)
5540 ± 640 2.87 ± 0.09
Felsic [1] 5 3690–5050 4560 ± 530 2.70 ± .01
Intermediate [1] 4 5270–6290 5880 ± 340 2.82 ± 0.05
Sedimentary [1] 5 5170–6200 5770 ± 340 2.75 ± 0.06

Greenhalgh, S., and Mason, I.SEISMIC IMAGING WITH APPLICATION TO
MINE LAYOUT AND DEVELOPMENT 587
1992). Compressional (P) and shear (S) waves from small explosionsand hammer blows were observed on a geophone spread over distancesof ten to hundreds of metres. Frequencies were 1–3 kHz and velocity ofbasalt very fast: 6.7 km/s for P wave and 4.0 km/s for S waves.
The normal incidence reflection coefficients for the various rock andore contacts are listed in Table 2; they are based on the average velocityand densities given in Table I. Boundaries are considered to be detect-able by reflection means if the reflection coefficient exceeds 0.03. Thusit appears that there is sufficient density contrast between the ore and thehost rock, and sufficient velocity contrast between the basalt and theultramafics for the seismic method to work at Kambalda. But we still facea formidable set of unknowns. Impedance variations can only bemapped, and the maps interpreted, if the target field is sparselypopulated; if seismic waves can be coupled cleanly into and out of thehost continuum; if mode conversions and multiple scattering are
limited; if surface wave noise is not too severe; and if the site access is suf-ficient to sample the wave fields after they have interacted with the target.Most of these questions can only be answered by field trials.
SEISMIC MODELLING
Tomography
Figure 2 shows a simplified model, containing a faulted ore body sittingbetween two horizontal underground boreholes 60 m apart. The ore haslow velocity compared to the rock. A set of 24 shots and 24 geophonesare placed in the boreholes to simulate a seismic tomography experi-ment. Shot and detector spacing is 5 m. Raypaths are shown for firstarrivals. The synthetic arrival times were then inverted by a DMLStomography algorithm (Zhou et al., 1992) to produce the tomogram ofFigure 3. The ore zones have been recovered albeit with some blurringand distortion due to the limited angular coverage. This model clearlydemonstrates the possibilities of tomography in crosswell exploration.
Reflection
To assess the likelihood of detecting reflections from the basalt-ultramafic contact (which contains mineralised portions), a 2-D syn-thetic shot gather has been computed using a full elastic heterogeneousfinite difference code (Cao and Greenhalgh, 1992). The shot receivergeometry replicated that from a typical underground experiment suchas that performed at Foster (Fullager et al., 1992). A combined P&S wavesource was placed 1.5 m from the decline wall (to simulate an explosivein a shallow shot hole), and a 2-component receiver array of eight sta-
Table 2: Reflection coefficients for various rock and ore contacts.
Contact R
Ultramafic/Mafic 0.05
Mafic/Massive ore 0.08
Ultramafic/Massive ore 0.15
Mafic/Matrix ore 0.01
Ultramafic/Matrix ore 0.08
Mafic/Disseminated ore 0.03
Ultramafic/Disseminated ore 0.03
Figure 1: P-wave velocity versus density for nickel sulphide ore samples.

588 Mine Site Exploration and Ore Delineation
tions, spaced 2.5 m apart, was located at a minimum distance of 60 mfrom the source. The perpendicular distance from the shot-geophoneline to the reflector was set at 50 m. A dominant signal frequency of1000 Hz was used, to match field observations.
For the purposes of modelling, the in situ values were adopted forbasalt and likely values selected for the ultramafic:
Basalt: Vp = 6.7 km/s; Vs = 4 km/s; ∆ = 3 gkcKomatiite: Vp = 5.5 km/s; Vs = 3.8 km/s; ∆ = 2.87 gkc
This represents a most favourable situation, with P-wave reflectioncoefficient of 0.12. Furthermore, the modelling assumes a plane specu-lar reflector of infinite extent, whereas the actual interface is likely to beirregular, reducing its effectiveness as a seismic reflector. However, themodelling certainly provides a good indication of the likely timing ofevents, given the accurate basalt velocity and the appropriate geometry.It also conveys the relative amplitudes of the various arrivals.
Figure 4 shows the computed seismograms. The two componentsrepresent motion parallel (Y) and perpendicular (X) to the geophonearray. The direct P wave is dominant on the Y component; the direct Sand Rayleigh wave on the X component. The amplitude of theshear/Rayleigh-wave is more than double the P-wave amplitude. Twoseparate reflections from the interface can be seen: a pure S reflection(SS), and a mode converted readily distinguished SP reflection. The PPreflection arrives at about the same time as the direct S/Rayleigh wave,and is obscured by it. The SP and SS reflection amplitudes are only 2%that of the direct S wave. For more realistic reflection coefficients, whichare likely to be only one-third that assumed in the simulation, the detec-tion and identification of the signal reflected from the contact would beextremely difficult, especially in the presence of noise (such as due tomachinery, which can be quite high in a mine).
Figure 2: Synthetic 2-D crosshole seismic experiment showing ore bodymodel and raypaths.
Figure 3: Velocity tomogram reconstructed for the ore body model ofFigure 2.

Greenhalgh, S., and Mason, I.SEISMIC IMAGING WITH APPLICATION TO
MINE LAYOUT AND DEVELOPMENT 589
CROSSHOLE/VSP SEISMIC FIELD SYSTEM
Seismic source
The most commonly used seismic sources for the mine developmentsurveys conducted to date, and the crosshole/VSP experiments reportedherein, are hammer blows and detonators. For early exploration-stageseismic surveying (e.g., surface reflection profiling) more energeticsources, such as 1 kg explosive charges in 5 m deep shotholes, arerequired to achieve the requisite range and depth.
Returning to the in-mine experiments, hammer impacts areachieved using a 10 lb sledge hammer which is struck against the wall ofthe mine tunnel. Various means of triggering have been tried, but themost successful seems to be a piezoelectric inertia switch mounted on
the handle of the hammer. Careful attention needs to be paid to the con-sistency of the hammering, to ensure a repeatable source signal. In someenvironments the signal-to-noise ratio is not very good, making the useof the hammer source undesirable, even for distances of 50 m or less.
The electric detonator appears to be a most reliable source. It is ahighly repeatable source and can be used in both underground (in-mine) and surface (crosswell) seismic surveys. The detonators are smallenough to avoid damaging the boreholes in which they are fired but theholes must be water stemmed to prevent energy dissipation. One prob-lem with using detonators down boreholes is that a new detonator has tobe lowered downhole, sometimes several hundred meters, each time anew shot is required. This makes their use, in surveys involving sourcesin boreholes, very labor intensive and time consuming.
In general, explosive sources produce higher frequencies and largeramplitudes than hammer sources, making them more desirable in high-resolution imaging.
A new downhole electric discharge (sparker) seismic source, with thecapacitors downhole, has been developed at Flinders University; it isdescribed by Greenhalgh and Bierbaum (1997). The sparker system con-sists of a battery powered surface current source, connected via wirelinewinch cable to the downhole sparker probe (Figure 5). The probe itselfis encased in 70 mm stainless steel tubing that is approximately 3 m long,weighing 22 kg. A digitally encoded manual winch makes accurateplacement of the probe within a borehole. The accuracy is 2 mm in 10 m.The sparker is capable of rapid firing (every 15 seconds), the waveformis remarkably repeatable and each shot produces 500 Joules of energy.The signal from a single discharge is about equivalent to a detonator.
Receivers
For the various seismic experiments conducted over the past fewyears by the Flinders University group, two main types of receivers havebeen utilized, a hydrophone array and triaxial geophones.
Downhole hydrophone array
The hydrophone array, or borehole eel, used in these investigationswas designed specifically for our requirements and was constructed byAustralian Sonar Systems in Adelaide in 1993.
The primary factors considered in its design were that it had to fitinto the narrow boreholes (≈ 46 mm) in the underground mine environ-ment, it had to be rigid enough to be ‘pushed’ into the horizontal ordeclined holes and must be robust enough to stand a lot of wear and tear.Given the scale of the mine seismic problem the hydrophone elementshad to be close together, of the order of one to two metres. Figure 6 showsthe basic configuration of the array (acoustic module, support cable andend connectors) with details of the hydrophones and general assembly.It is a 24-channel array of 50 m aperture, connected to a 150 m longleader cable. At a diameter of 30 mm and base radius of 0.5 m, the eel issuitable for deployment in boreholes of 45 mm diameter to a depth of200 m. The hydrophones have a frequency range of 50–2000 Hz anddynamic range of 80 dB.
The array is provided with a Front End Conditioner (FEC) whichprovides power to the array pre-amplifiers, buffers the array channeloutputs and enables the level of the output to match the input of therecording device.
Figure 4: Theoretical 2-component seismograms for a single reflector(basalt/ultramafic contact) 60 m from the tunnel wall containing sourceand receiver array. The PP reflection is obscured by the direct S andRayleigh arrivals.

590 Mine Site Exploration and Ore Delineation
The hydrophones are immersed in foam rubber with the wireswrapped and twisted on the outside. Each hydrophone has a sensitivity-200 dB re 1(Pa and is attached to a low noise preamplifier of high outputimpedance, with a gain of 45 dB. The array core is filled with a low den-sity electrically inert fluid (isoparaffin) to give it neutral buoyancy.
The array/cable assembly is capable of withstanding a tensile load of30 kN (3 tonnes applied axially and 1 tonne applied tangentially). Themodule is mounted on a winch drum of 500 mm radius and was there-fore designed to withstand the stresses and strains of repeated bendingaround the drum while subject to a tensile load of 10 kN. The hydro-phone is covered by a jacket made of a thermoplastic material whichprovides protection from abrasion during the deployment/retrievaloperation in the borehole. The total power supply for the complete sys-tem can be provided by standard 12V batteries. Figure 7 shows thehydrophone array being deployed in a surface crosshole experiment.
Triaxial geophones
Triaxial geophones have been used for in-mine cross-gallery, reflec-tion, and VSP investigations. These sensors, designed and built atFlinders University, utilize three 100 Hz Geospace GS 100 moving coilelements. These are high frequency geophones having 0.7 V/cm/s intrin-sic voltage sensitivity. The three component sensors, placed in mutuallyperpendicular positions, are housed inside a 50 mm × 200 mm solid PVCtube. The detector is usually positioned with the longitudinal componentalong the borehole, the transverse component parallel to the gallery and
Figure 5: Block diagram showing major components of the downhole sparker sound source.
Figure 6: Configuration of the downhole hydrophone array.

Greenhalgh, S., and Mason, I.SEISMIC IMAGING WITH APPLICATION TO
MINE LAYOUT AND DEVELOPMENT 591
the vertical component along the hole. (Before processing the data thecomponents are vector rotated into the 3-D mine coordinate system).
Each detector unit is fitted to a special anchor which is permanentlygrouted to the bottom of specially drilled holes in the tunnel wall.Although the anchor provides good detector-rock coupling it is still notfree of the effects of cantilever resonance. Ideally, to reduce these reso-nance effects, the geophones should be sacrificed in the hole by sur-rounding the entire unit with grout and thus achieving rigid coupling. Inview of the expense of manufacture of the geophones and the limitednumber available for each survey, the decision not to entomb the unitswas made at the risk of inferior performance.
Digital recording system
A 24-channel Bison 7024 digital instantaneous floating point signalstacking seismograph has been used as the recording device in all exper-iments. The detector outputs are sent to the seismograph via two twelvechannel multi-core spread cables. The seismograph offers high dynamicrange and a wide choice of input parameters such as record length, sam-ple rate, filter settings, delay times etc. Record lengths are usually 100 mswith a sample rate of 0.1 ms. A built-in high resolution, high contrastthermal printer provides monitor records, if required, for each shot.
The seismograph is powered by a 12V lead-acid battery, which needsto be recharged on a daily basis. A second battery is used to power aToshiba laptop computer which is connected to the seismograph via aRS-242 cable and used to observe each shot record. The digital data
Figure 8: Hunt mine seismic test site showing source-receiver boreholes,geophone array along decline, and stope geometry 20 m above decline.
Figure 7: Photograph of the eel on its drum after being lowered downhole.

592 Mine Site Exploration and Ore Delineation
retained in the stacking memory of the Bison is downloaded to thecomputer, where each Bison file is converted to SEG-Y format. All filesare backed up on floppy disc for storage and later processing.
UNDERGROUND SEISMIC IMAGING
A combined seismic tomography and reflection experiment was carriedout at Hunt mine, 16 level, so as to assess the usefulness of undergroundseismic methods in mapping stope geometry and hard rock geologicalstructure. A companion borehole radar experiment was carried out atthe same site (Mason et al., 1994) but only the seismic results will be pre-sented here.
The test site
Figure 8 is a plan view of the test site. It shows the locations of theseismic boreholes DDH 16-18 and DDH 16-20 in relation to the D zonedecline at the 16 level, and the overlying stopes. The stations G1,G2 …G8 are the collar positions of the triaxial geophones along the tun-nel as well as being hammer impact points (see next section). The bore-holes 16–18 and 16–20 were drilled downwards at an angle of 30° fromthe horizontal (so as to hold water), to a depth of 45 m. The distancebetween borehole collars is approximately 55 m. The volume of rock tobe imaged was largely bounded by the decline, the two boreholes, andhorizontal planes located 50 m above and below the level of the decline.The stopes of the BO5 ore surface are at a height of about 20 m above theborehole collars. This can be seen in Figure 9 which gives two geologicalcross-sections in the vertical planes of the boreholes. The additional pairof upward inclined boreholes shown, DDH 16-19 and DDH 16-08, wereused for the radar experiment. Most of the ore in the vicinity of the seis-mic/radar test site has been mined out. The 16 level represents the deep-est development of the mine. Extraction is continuing to the immediatesouth of the survey area. In fact, mining activity dictated that the geo-physical work be undertaken on the afternoon and night shifts, whenboggers were not operating in the decline.
Figure 9 gives two geological cross sections in the vertical planes ofboreholes. The original ore shoot (pre-mined) is about 2 m thick and20–30 m wide, and occupies the base of several troughs within the con-tact surface between the footwall basalt and the hanging wall ultra-mafics. There is remnant ore in the stopes where the surface hasthickened in the form of local “jags”. The ore has about a 2:1 densitycontrast with the enclosing rock, and possibly presents a slight velocitydecrease (say, 5000 m/s vs 6000 m/s). The computed reflection coeffi-cient for the idealised case of a plane, laterally continuous mineralisedsurface is about -0.11. In practice, the finite width of the ore, its discon-tinuous nature, and the roughness of the surface would greatly diminishits reflectivity, especially for wavelengths of comparable size to the struc-ture. The ore would behave more as a diffuse diffractor than as a mirror.Furthermore, the target will only “reflect” sound back to the receiverarray if illuminated from the right angle. The stope cavities themselves,rather than the small remnant mineralisation within them, are the morelikely reflectors in this survey. The air/rock interface presents a perfectreflecting surface (reflection coefficient of -1), but once again thereceived signal will be downgraded by the finite extent (length andwidth) of the tunnels, and the finite wavelength. For a 1000 hz seismicsignal, the wavelength is about 6 m (not unlike the radar wavelength),which is of the same order as the width of each stope.
The host medium is hardly homogeneous. Even within the footwallbasalt there is considerable variability in composition and alteration,and hence elastic properties, as revealed by the two drill cores. There areseveral faults, fractures and quartz veins, as well as a porphyry sheet (seeFigure 9), which disturb the host rock.
Seismic experiments
Three separate experiments: Crosshole survey, Hammer source VSPsurvey, and Explosive source inverted VSP, were conducted at the siteshown in Figure 8.
Crosshole survey
The crosshole survey entailed shots in hole H16-20 at 1 m depthspacing, from 3.2 m to 42.3 m, and recording on a hydrophone array inhole H16-18, at 1 m spacing, over the depth range 0 m to 41 m. Since the
Figure 9: Cross section at boreholes H16-18 and H16-20, showingsimplified stope geometry and ore troughs.

Greenhalgh, S., and Mason, I.SEISMIC IMAGING WITH APPLICATION TO
MINE LAYOUT AND DEVELOPMENT 593
hydrophone array has its detectors at 2 m intervals, and is limited to just24 channels, the 1 m receiver array was synthesised by shooting twice ateach depth level in hole H16-20, once for hydrophones at positions 0 m,2 m, … 40 m, and again after displacing the eel by 1 m in the hole suchthat the elements were as positions 1 m, 3 m, … 41 m. It was not possibleto push the hydrophone streamer into the hole any deeper than 43 m.The first hydrophone element lies one metre from the end of the eel. Thelength of the active section is 46 m (for 24 elements = 23 × 2 m), and sothe top two elements of the streamer were actually out of the hole in thedecline on each deployment. These two channels (1 and 2) were ignored,along with channel 24 (base of the eel), which had been damaged by saltwater incursion into the preamplifier on a previous deployment. Thusthe number of useable recording channels was reduced from 24 to 21 oneach shot. The total number of seismic records collected in the crosswellexperiment was 40 × 2 × 21 = 1680.
It would have been desirable to have collected the seismic data at acloser spacing (shot and receiver interval of 0.5 m or less), but this wouldhave greatly increased the acquisition time. We were limited largely bythe time to load and place each shot.
Hammer VSP experiment
The hammer VSP experiment was the first phase of the work under-taken. It involved placing the hydrophone array in hole H16-18, withdetectors at 2 m intervals over the depth range 1 m to 41 m, and impact-ing the tunnel wall with a 10 lb sledge hammer along the decline, at one-quarter station positions, from G1 to G8.5 (1.25 m intervals). This is amultilevel, walkaway VSP recording geometry. The number of seismo-grams collected was 31 × 21 = 651.
Triaxial VSP experiment
This experiment was a reversed multilevel walkaway inverted VSP. Itentailed having shots at 1 m spacing in both holes H16-18 (depth range3.2 m to 42.3 m) and H16-20 (depth range 3.6 m to 42.6 m) and record-ing on eight three-component geophones along the decline wall, (G1 toG8—see Figure 8) at a nominal spacing of 5 m. The sensors were placedin 2 m deep horizontal holes drilled perpendicular to the tunnel axis,oriented into position, and then grouted permanently into each hole.The orientation system was such that the X component was parallel tothe decline, with its positive terminal pointing northwest (up thedecline), the Y component pointing along and into the axis of the hole(northeast), and the Z component vertically downwards. The purposeof using 3-component receivers was to achieve directional sensitivity inthe response, which is of potential benefit in 3-D imaging with a limitednumber of sensors arranged in a fairly short linear array.
The number of records acquired in the triaxial VSP experiment was40 × 2 × 8 × 3 = 1920.
SIGNAL CHARACTERISTICS AND NOISE
Figure 10 is a sample set of shot gather records from the crosshole exper-iment. Each panel represents a separate shot (depth 22.2 m, 23.2 m, etc.)recorded on 21 hydrophone receivers at depths of 1 m, 3 m, … 41 m. Thefirst arrival is the direct P wave. The record is full of other events whichseem to move out in both directions with the approximate speed ofsound in water. This is best seen on receiver gathers (Figure 11), whichreveal the origin of these events as the top, bottom and middle of theshothole. These secondary events are tube wave to P and S conversions
Figure 10: Set of shot gather crosswell hydrophone records for shots in hole H16-20 and receivers in hole H16-18. Shot depth spacing is 1 m, receiverspacing is 2 m.

594 Mine Site Exploration and Ore Delineation
at each end of the hole, and also from an impedance boundary (fracturezone) midway along the hole. The top and bottom of the hole presentbarriers to the shock front set up from the actual source in the hole. Theybehave as secondary “sources” of body waves, which then radiate outinto the medium and are recorded on the receiver array, superimposedon the direct and reflected arrivals from the actual shot.
There is a family of tube waves in the shothole (velocities 1.2 km/s to1.5 km/s), each of which undergoes mode conversion. The body waves(from true and secondary sources) can then excite tube wave arrivals inthe receiver hole from both ends as well as from any fractures or other dis-continuities in the hole. This makes for a very cluttered record and repre-sents a severe form of coherent noise contamination. It is difficult toremove. Velocity filtering is partially effective (due to low water wavevelocity in the receiver gather domain) but it can only be done if the wavesare not velocity aliased, which means a very close shot spacing (say,0.25 m). Unfortunately this was not the case with the Hunt experiment.The tube wave problem arises largely from shooting in a water-filled hole.Explosions in dry holes don’t generate tube waves, but they don’t generatemuch body wave energy either, because of the very poor coupling.
The detonator source produced high amplitude, high frequency (upto 3000 Hz) signals. The high frequencies are important for gettingreflections from small objects like ore shoots, and for having the requis-ite resolution.
The 1 m shot and receiver interval used on the crosshole survey, the5 m geophone spacing used on the triaxial VSP, and the 2 m hydrophoneinterval/1.25 m impact interval used on the Hammer VSP, were inade-quate to combat the low velocity coherent noise, which became aliasedat the high (KHz) frequencies involved.
The seismic work at Hunt was conducted mainly at night. Back-ground noise was plentiful, and included vibrations from ventilationfans, pumps, surface drilling above, inductive pickup, and boggers
operating nearby. On some occasions the noise was so high that therecording had to be discontinued. Apart from the noise, the seismic sur-vey was interrupted by several instrument malfunctions.
TOMOGRAPHIC IMAGING
Procedure
Tomography is a two-dimensional image reconstruction procedure.The image plane in the present context was formed by the two dippingboreholes and the section of decline joining the two hole collars. Thesethree observation lines are not actually straight nor perfectly co-planar,because of the slight irregularity of the tunnel and the drillholes. But asa starting point for tomographic inversion, we computed the best-fitplane to the three lines and projected the actual shot-receiver positionsonto this plane.
The input data comprised the first arrival times (after static correc-tion) for the crosshole and the hammer VSP records. That is, only thehydrophone data were used in the reconstruction. Over 2300 raypathscriss-cross the image plane to yield good angular and spatial coverage.The source and receiver positions along the three arrays used to form the“U” geometry are at roughly 1 m spacing. The medium was divided upinto cells of dimension 0.25 m × 0.25 m.
The tomography procedure begins with a uniform (average) velocitymodel and then iterates through using a multistage, sub-space method(Cao and Greenhalgh, 1995) in which the long spatial wavelength veloc-ity variations are solved for first, progressively adding in the short wave-length features. A conjugate gradient type algorithm is at the heart of themodel update procedure, details of which are given by Zhou, Greenhalghand Sinadinovski (1993).
Figure 11: Set of receiver gathers for crosswell experiment, showing direct P and S waves plus tube wave generated events at top, bottom and middle ofshothole. Trace spacing is 1 m.

Greenhalgh, S., and Mason, I.SEISMIC IMAGING WITH APPLICATION TO
MINE LAYOUT AND DEVELOPMENT 595
Tomogram features
Figure 12 shows the final tomogram obtained. The colour code at theside of the map defines the various velocity values. The boreholes havebeen superimposed on the tomogram to give the proper perspective.(The crosses ‘+’ denote collar positions in the decline).
The velocities vary from about 5300 m/s to 6400 m/s. From the geo-logical log of the holes we know that the rock type is entirely basalt, butthe velocity field is anything but homogeneous. The inhomogeneity ispresumably due to changes in alteration and geochemistry of the basalt.The presence of quartz veins and fractures will also affect the measuredvelocity values.
Ultrasonic velocity measurements were carried out on eight coresamples taken from the two holes, to aid tomogram interpretation. Thesamples included the major change in basalt type and condition. Velocityresults are given in Table 3. The massive basalt gives high velocity of5900 m/s. That having abundant disseminated magnetite yields lowervelocity, as expected, through the effect of increased density. Theankerite-albite altered basalt gives much lower velocity, of just 2700 m/s.The massive quartz vein gives a velocity of 4700 m/s, similar to that of theamphibole rich basalt. These velocities are all lower than those obtainedin situ from the seismic tomography experiment. This can be largelyexplained by the fact that the rock in situ is under considerable lithostaticpressure. It is well known that pressure increases velocity due to theclosing of fractures and reduction of porosity.
Table 3: Ultrasonic velocities of core samples from Hunt H16-18.
Sample No. Rock DescriptionLongitudinal Velocity (m/s)
1 Amphibolite rich basalt 4640
2 Massive basalt 5930
3 Massive basalt with abundant disseminated magnetite
3990
4 Massive quartz vein 4690
5 Awaiting XRD results 5710
6 Epidote altered basalt 6130
7 Biotite-rich basalt and disseminate pyrite
5240
8 Alteration zone: ankerite–albite altered basalt
2680
Figure 12: Tomographic reconstruction of the first arrival VSP and crosshole data at Hunt mine.
596 Mine Site Exploration and Ore Delineation
If the relative velocity variations, rather than the absolute variationare considered along borehole H16-18, then the tomogram velocityvariation is well matched by the ultrasonic velocities. The high, mediumand low velocity zones in the tomogram seem to correlate well with themineralogy and alteration of the basalt. This is an encouraging result,especially given the fact that only single sample determinations for eachrock “type” were made. Apart from random errors on single samples,which can be smoothed out by multiple sample measurements, it shouldalso be remembered that the laboratory sample may not be representa-tive of the rock behaviour in situ, because of the absence of macrofea-tures such as fractures. Alternatively, macrofeatures such as 1 m widequartz veins may have little effect on 6 m long seismic wavelengths in thefield, but multiple mm wide fractures in a laboratory sample may dra-matically affect the velocity obtained using a 1 cm long ultrasonic wave.
It thus appears that seismic tomography at this location offers a use-ful lithologic mapping tool. It is unfortunate that no mineralisation lieswithin the image plane. The boreholes dip downwards, whereas the oreis in the stopes above the decline.
THREE-DIMENSIONAL REFLECTOR IMAGING
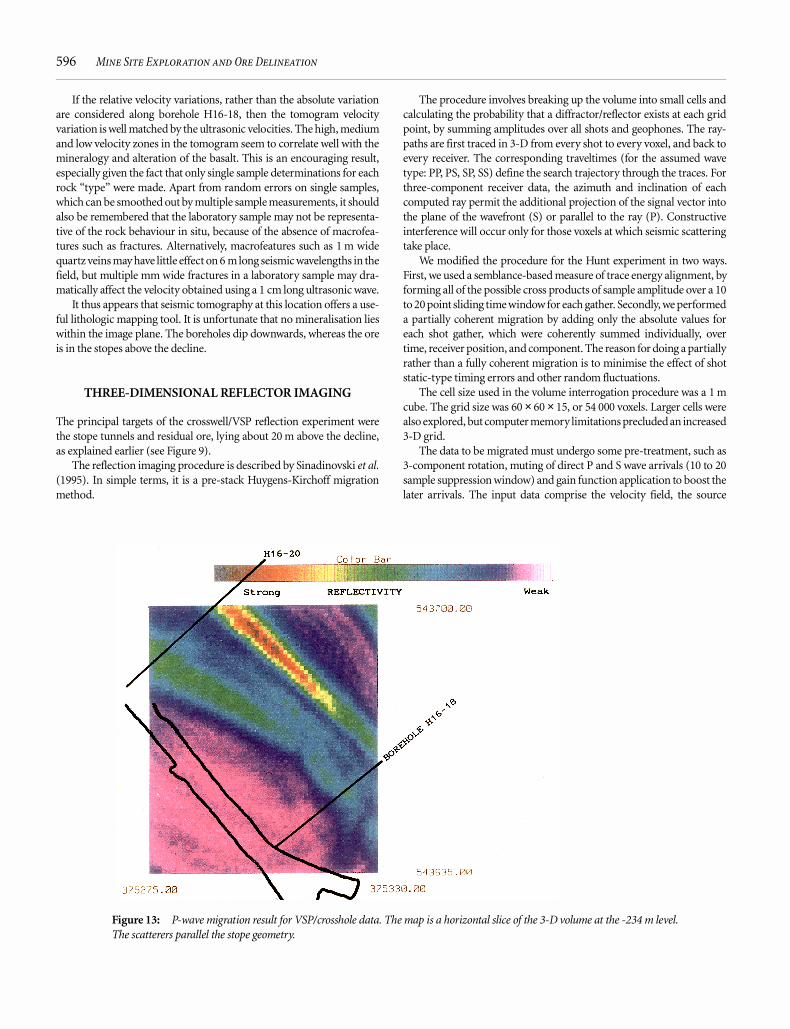
The principal targets of the crosswell/VSP reflection experiment werethe stope tunnels and residual ore, lying about 20 m above the decline,as explained earlier (see Figure 9).
The reflection imaging procedure is described by Sinadinovski et al.(1995). In simple terms, it is a pre-stack Huygens-Kirchoff migrationmethod.
The procedure involves breaking up the volume into small cells andcalculating the probability that a diffractor/reflector exists at each gridpoint, by summing amplitudes over all shots and geophones. The ray-paths are first traced in 3-D from every shot to every voxel, and back toevery receiver. The corresponding traveltimes (for the assumed wavetype: PP, PS, SP, SS) define the search trajectory through the traces. Forthree-component receiver data, the azimuth and inclination of eachcomputed ray permit the additional projection of the signal vector intothe plane of the wavefront (S) or parallel to the ray (P). Constructiveinterference will occur only for those voxels at which seismic scatteringtake place.
We modified the procedure for the Hunt experiment in two ways.First, we used a semblance-based measure of trace energy alignment, byforming all of the possible cross products of sample amplitude over a 10to 20 point sliding time window for each gather. Secondly, we performeda partially coherent migration by adding only the absolute values foreach shot gather, which were coherently summed individually, overtime, receiver position, and component. The reason for doing a partiallyrather than a fully coherent migration is to minimise the effect of shotstatic-type timing errors and other random fluctuations.
The cell size used in the volume interrogation procedure was a 1 mcube. The grid size was 60 × 60 × 15, or 54 000 voxels. Larger cells werealso explored, but computer memory limitations precluded an increased3-D grid.
The data to be migrated must undergo some pre-treatment, such as3-component rotation, muting of direct P and S wave arrivals (10 to 20sample suppression window) and gain function application to boost thelater arrivals. The input data comprise the velocity field, the source
Figure 13: P-wave migration result for VSP/crosshole data. The map is a horizontal slice of the 3-D volume at the -234 m level.The scatterers parallel the stope geometry.

Greenhalgh, S., and Mason, I.SEISMIC IMAGING WITH APPLICATION TO
MINE LAYOUT AND DEVELOPMENT 597
receiver coordinates, and the field seismograms. The process is repeatedfor the various modes (PP, SS, etc.), if desired.
The output from the migration is a set of positive numbers at eachpoint in the 3-D grid, which represent the scatterer probabilities. Thesenumbers are colour coded according to some appropriate non-linearsale (e.g., logarithms) and the image planes (horizontal slices throughthe volume) then displayed at various depths.
Results
The data subsets used for the migration were the statically correctedand pre-processed records from:
• the triaxial VSP experiment: 80 shots, 8 receivers, and
• Crosswell experiment: 40 shots, 2 × 21 receivers.
The individual data sets were migrated separately, as well as beingcombined into a single migration. The attraction of a combined geo-metry is that the reflectors are illuminated from a greater range of angles.
Figure 13 is a horizontal slice through the final P-wave migration 3-Dvolume at the -234 m elevation level. This elevation corresponds to theapproximate average position of the stope floor across the survey area.The southwest stope tunnel actually drops a depth of about 4 m over ahorizontal distance of 55 m between the two boreholes, from an eleva-tion of -231 at the northern end to an elevation of -235 m in the south.The northeastern stope floor maintains an elevation of -234 m over itsnorthern extent.
The warm colours (brown, red, yellow) in Figure 13 indicate thestrongest scatterer positions, whereas the cold colours (blue, purple)indicate the absence of any reflectors. Geographical coordinates, as wellas the projected position of the D zone decline (20 m below the elevationshown), are given on the map to aid location/identification of features.The migration results show a striking correlation with the known mineworkings (see Figure 8). The two green coloured elongate zones of mod-erate reflectivity, which sub-parallel the decline, delineate the stopes.The southwestern ridge bends in close to the decline at its northern end,following the actual stope cavity. The region of strong reflectivity,coloured red, seems to coincide with the far boundary of the northeast-ern tunnel. The reflectivity may well be enhanced by the curvature of theore trough and the sharp lip of the structure, as seen in Figure 9. Thiswould cause a focussing of back-scattered energy, as observed myMason et al. (1992) in the decline radar profile. The presence of residual,unmined ore on this side of the stope (see Figure 9) may also be contrib-uting to the strong reflection signal.
It is interesting to observe on the computer how the reflection (migra-tion) pattern changes with elevation. Migration slices at the -230 m andthe -240 m levels (not shown), which are just above and below the stopefloor and roof elevations, respectively, yield reduced reflectivity from themaximum which occurs within the -237 m to -236 m depth range.
The finite time window used in forming the semblance, as well as thefinite wave length of the signal (say, 6 m) means that resolution is lim-ited, and features get averaged, or smoothed in the migration, over aspatial distance of at least several metres. Migration images obtained atelevations of -226 m and -246 m (not shown), exhibit almost no struc-ture, confirming that the reflectors are confined in depth to the vicinityof the stopes.
CONCLUSIONS
A high resolution seismic hardware-software system has been developedfor cross-hole/VSP imaging of ore bodies and associated hardrock geo-logical structure, either within mines or from the Earth’s surface usingavailable boreholes.
A body of laboratory data on the elastic properties of nickel sul-phides and host rocks has been acquired as an aid to interpretation.
Although the seismic signals are of high frequency and high quality,records are strongly contaminated by tube wave and mode conversionnoise. Dense arrays of sources and/or receivers are needed to enableproper pre-processing of the data prior to imaging.
An example of an underground survey at the Hunt mine, Kambalda,demonstrates the possibility of both tomographic imaging, to mapvelocity inhomogeneities, and reflection imaging to delineate stopegeometry. The seismic maps show a striking correlation with the knowngeology.
The seismic images (especially reflection) are difficult to obtain andnot easy to relate to mineralisation. Companion electrical images suchas radar, RIM and applied potential, are needed to aid interpretation andare likely to see increased use in mine development over the next fewyears. The seismic method offers great promise in prospect exploration.We are working on improvements to borehole geophysical instrumenta-tion and at developing more versatile image reconstruction procedures.
ACKNOWLEDGEMENTS
We wish to acknowledge the support and cooperation of Peter Williamsand Greg Turner from Western Mining Corp. in the conduct of this work.
REFERENCES
Adam, E., Milkereit, B., Arnold, G., and Pineault., 1996, Seismic response of theBell Allard orebody, Matogami Québec: 66th Annual SEG Meeting, Denver,Colorado, Nov. 10-13, Abstracts 634-637.
Campbell, G., and Crotty, J.H., 1988, The application of 3-D seismic surveys tomine planning: South African Chamber of Mines MINTEK Seminar,4th March, 1988.
Cao, S., and Greenhalgh, S.A., 1992, Finite-difference simulation of P-SV wavepropagation: a displacement potential approach: Geophys. J. Int. 109, 525-535.
Cao, S., and Greenhalgh, S.A., 1995, Relative-error based non-linear inversion:application to seismic travel time tomography: Geophys. J. Int. 121, 684-694.
Carneico, D., and Gendzwill, D., 1996, High-resolution seismic reflection surveyin a deep gold mine: 66th Annual SEG Meeting, Denver, Colorado, Nov.10-13, Abstracts 2069-2071.
Cosma, C., 1983, Determination of rock mass quality by a crosshole seismicmethod: Bull. Intl. Assoc. Eng. Geol., 26-27.
Cowden and Roberts, 1990, Komatiite hosted nickel sulphide deposits Kambalda:In Geol. and Min. Dep. of Aust. and PNG, Hughes, F.E., ed., Aust. Inst. Min.Met., Melbourne, 567-581.
Dahle, A., Gjoystdal, H., Grammeltvedt, G., and Soyland Hansen, T., 1985,Applications of seismic reflection methods for ore prospecting in crystallinerock: First Break, 3, 9-16.
Duncan, G., Downey, M., Leung, L., and Harman, P., 1989, The development ofcrosshole seismic techniques and case studies: Exploration Geophysics 20(1/2), 127-130.
Friedel, M.J., Jackson, M.J., Scott, D.E., Williams, T.J., and Olson, M.S. 1995, 3-Dtomographic imaging of anomalous conditions in a deep silver mine:J. Applied Geophysics 34, 1-22.

598 Mine Site Exploration and Ore Delineation
Fullagar, P., Mason, I.M., and Greenhalgh, S.A. 1992, High resolution geophysicalimaging for exploration and development of nickel sulphide orebodies:Western Mining Corp., Report K/3470.
Galperin, E.I., 1984, The Polarisation Method of Seismic Exploration: D. ReidelPublishing Co., Boston.
Gendzwill, D.J., and Brehm, R. 1993, High resolution seismic reflections in apotash mine: Geophysics 58, 741-748.
Greenhalgh, S.A., and Bierbaum, S., 1997, A downhole sparker sound source formineral seismic applications: Submitted for publication.
Gustavsson, M., Moren, P., Pihl, R., and Ivansson, S., 1984, An experiment with theseismic cross-hole method in an iron mine: The Leading Edge 3: 11, 143-145.
Harman, P., Leung, L., and Downey, M., 1987, Cross-hole seismic survey for min-eral exploration in the West Kimberley Area, Western Australia: ExplorationGeophysics 18, 80-83.
Mutyorata, J.J., 1987, High resolution seismic reflection an exploration tool in anunderground environment—example from Zimbabwe: Jour. African EarthSci. 6(1), 109-115.
Nelson, R.G., 1984, Seismic reflection and mineral prospecting: Expl. Geophys.15, 229-250.
Peterson, J.E., Paullson,, and McEvilly, T.V., 1985, Applications of algebraic recon-struction techniques to crosshole seismic data: Geophysics 50, 1556-1580.
Price, T.O., 1974, Accoustical holography as a tool for geological prediction:In Subsurface Exploration for Underground Excavation and HeavyConstruction, Am. Soc. Civil. Engrs.
Reid, A.B., Polome, L.G., and Greene, B.W., 1979, Ultra-high resolution reflec-tion in chromite detection: Presented at the 49th Ann. Int’l. Mtg. Soc. Expl.Geophys. New Orleans.
Ruskey, F., 1981, High-resolution seismic methods for hard rock mining: InPremining investigations for hardrock mines: Proc. U.S. Bureau of MinesTechnology Transfer, Seminar Denver, 4-28.
Schmidt, G., 1959, Results of underground seismic reflection investigations in thesiderite district of the Siegerland: Geophys. Prosp. 7, 287-290.
Sinadinovski, C., Greenhalgh, S.A., and Mason, I.N., 1995, Three-dimensionalreflector imaging of in-mine high frequency crosshole seismic data: Expl.Geophysics 26, 325-330.
Singh, S., 1983, A study of shallow reflection seismics for placer-tin reserve eval-uation and mining: Geoexploration 21, 105-135.
Spencer, C., Thurlow, G., Wright, J., White, D., Caroll, P., Milkereit, B., and Reed,C., 1993, A vibroseis reflection seismic survey at the Buchans mine in centralNewfoundland: Geophysics 58, 154-166.
Wachsmuth, C.,, and Schmidt, E., 1962, Experience with the reflection seismo-graph in a mine within a slat plug: Geophys. Prosp. 10, 491-496.
Wong, J., Hurley P., and West, G.F., 1984, Crosshole audio-frequency seismologyin granitic rocks using piezoelectric transducers as sources and detectors:Geoexplor. 22, 261-280.
Wright, C., Wright, J.A., and Hall, J., 1994, Seismic reflection techniques for basemetal exploration in eastern Canada: examples from Buchans, Newfoundland:J.Applied Geophysics 32, 105-116.
Young, R.P., Hutchins, D.A., McGaughey, J., Towers, J., Jansen, D., and Bostock,M., 1989, Geotomographic imaging in the study of mine induced seismicity:Pure and Applied Geophysics 129, Nos 2/3, 571-596.
Zhou, B., Greenhalgh, S.A., and Sinadinovski, C. 1992, Iterative inverse tech-niques for DMNLS in seismic tomography: In Geotomography—Vol II,Society of Expl. Geophys. Japan, p.111-128.