relationship between particle size and radiocesium in fluvial suspended sediment related to the...
TRANSCRIPT
Relationship between particle size and radiocesium in fluvialsuspended sediment related to the Fukushima Daiichi NuclearPower Plant accident
Kazuya Tanaka • Hokuto Iwatani • Aya Sakaguchi •
Yoshio Takahashi • Yuichi Onda
Received: 2 February 2014
� Akademiai Kiado, Budapest, Hungary 2014
Abstract We collected fluvial suspended sediments in
Fukushima after the Fukushima Daiichi Nuclear Power
Plant (FDNPP) accident and analyzed the 137Cs concen-
tration in bulk and size-fractioned samples to investigate
the particle-size-dependent distribution of radiocesium.
The 137Cs concentration in bulk suspended sediments
decreased from August to December 2011, possibly
reflecting a decrease of radiocesium concentration in its
source materials. Smaller particles had higher radiocesium
concentrations, reflecting larger specific surface areas. Silt-
and sand-size fractions occupied more than 95 % of the
total 137Cs in the suspended sediments. The contribution of
clay-size fractions, which had the highest 137Cs concen-
tration, was quite small because of their low frequency. A
line of the data showed that the particle size distribution of
radiocesium was essential to evaluate the migration and
distribution of radiocesium in river systems where radioc-
esium is mainly present as particulate form after the
FDNPP accident.
Keywords Fukushima � Radiocesium � Particle size �Suspended sediment
Introduction
The distribution and migration of radionuclides, in partic-
ular radiocesium (134Cs and 137Cs), have been extensively
investigated since the Fukushima Daiichi Nuclear Power
Plant (FDNPP) accident. The initial stage of radiocesium
distribution in the environment has been gradually clarified
by the efforts of many researchers [1–7]. Radiocesium
deposited on the ground was rapidly and strongly adsorbed
by soils and sediments, and was fixed at the very surface
layers within 5 cm from the surface [8–11]. Once radioc-
esium is fixed on soil and sediment particles, it is not
readily desorbed from the solid phase [10, 12–14]. Such
radiocesium-bearing particles would be eroded and trans-
ported through river systems [15, 16]. Indeed, we observed
the migration of river particulate matter maintaining strong
radioactivity [14]. Thus, particulate matter can be the main
carrier of radiocesium rather than the dissolved form [17].
Eroded soil particles are transported, and finally deposited
on the bottom of rivers, lakes, estuaries and oceans,
depending on their particle size and flow rate of river
water. Therefore, with time, transportation of radiocesium-
bearing particles via rivers would increase the degree of
contamination in downstream areas.
It is well known that smaller particles have higher radi-
ocesium concentration, reflecting larger specific surface
areas [12, 18–20]. He and Walling [21] demonstrated that
radiocesium was distributed more in smaller particles based
on empirical observations in laboratory experiments. As
erosion and transportation are particle-size-dependent pro-
cesses, the distribution of radiocesium in different size
K. Tanaka (&)
Institute for Sustainable Sciences and Development, Hiroshima
University, 1-3-1 Kagamiyama, Higashi-Hiroshima,
Hiroshima 739-8530, Japan
e-mail: [email protected]
H. Iwatani � A. Sakaguchi � Y. Takahashi
Department of Earth and Planetary Systems Science, Graduate
School of Science, Hiroshima University, 1-3-1 Kagamiyama,
Higashi-Hiroshima, Hiroshima 739-8526, Japan
Y. Onda
Center for Research in Isotopes and Environmental Dynamics,
University of Tsukuba, 1-1-1 Tennodai, Tsukuba,
Ibaraki 305-8572, Japan
123
J Radioanal Nucl Chem
DOI 10.1007/s10967-014-3159-1
fractions is important for evaluating the fate of radiocesium
in the environment. It is possible that fine-grained suspended
particle-associated transport dominates the land–ocean flux
of radiocesium transported via rivers. We investigated the
dependence of radiocesium distribution on particle size in
riverbed sediments in Fukushima after the FDNPP accident
[22]. Analytical results of different particle size fractions
suggested that the smaller particle size fractions having
higher radiocesium concentration were more selectively
transported downstream from upstream sites. However, such
a particle size-dependent distribution has not been investi-
gated in truly ‘‘suspended’’ sediment in a river, which is the
particulate matter in ongoing transportation in rivers.
Obtaining the distribution of radiocesium with particle size
information is of fundamental importance for studies
concerned with the transportation of radiocesium-bearing
particles. In this study, therefore, we analyzed radiocesium in
fluvial suspended sediments after separation into different
particle size fractions.
Samples and methods
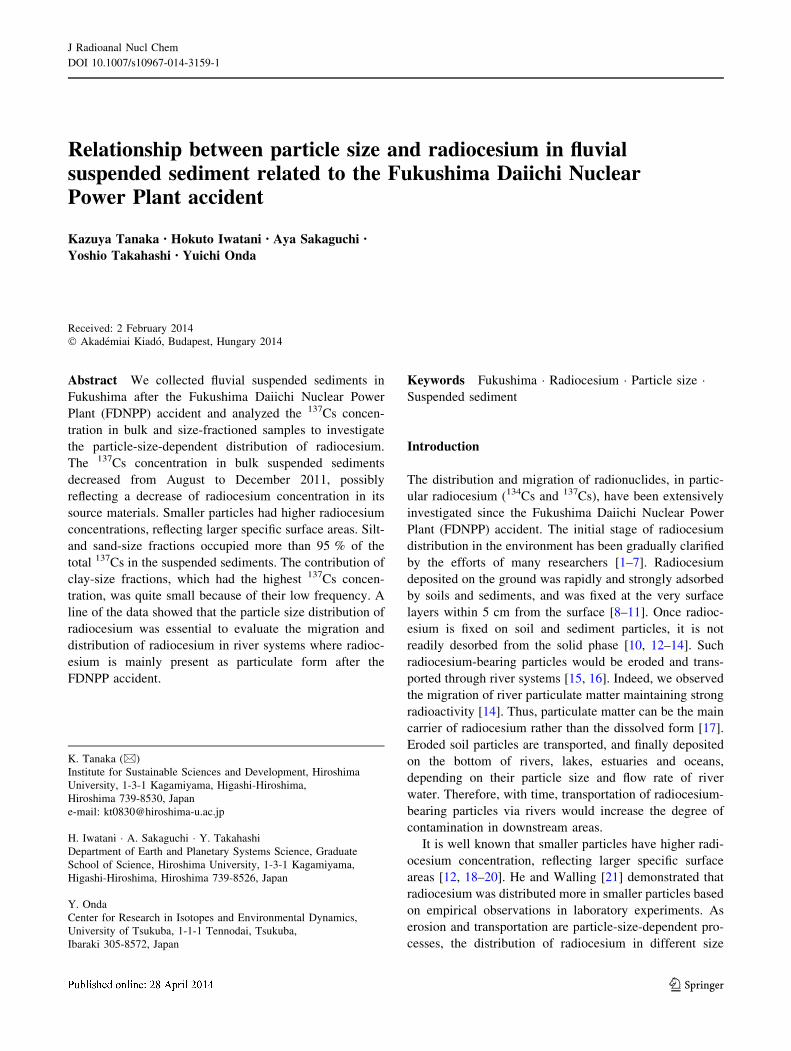
We collected fluvial suspended sediments at upstream and
downstream sites, labeled KUS and KDS, in the Kuchibuto
River (Fig. 1). The Kuchibuto River is one of tributaries of
the Abukuma River, which is the largest river in Fuku-
shima Prefecture. Relatively large amounts of samples
were necessary to measure the radiocesium concentration
in each fraction after size separation. Therefore, the
Fig. 1 Sampling locations of
fluvial suspended sediment in
the Kuchibuto River. Enlarged
view showing the sampling
points in the Kuchibuto River as
cited from the Digital Japan
Web System [34]. A and
B indicate the upstream (KUS)
and downstream sites (KDS),
respectively
J Radioanal Nucl Chem
123

suspended sediment samples were collected using a time-
integrated suspended sediment sampler [23]. Time-inte-
grated samples were collected during two different periods
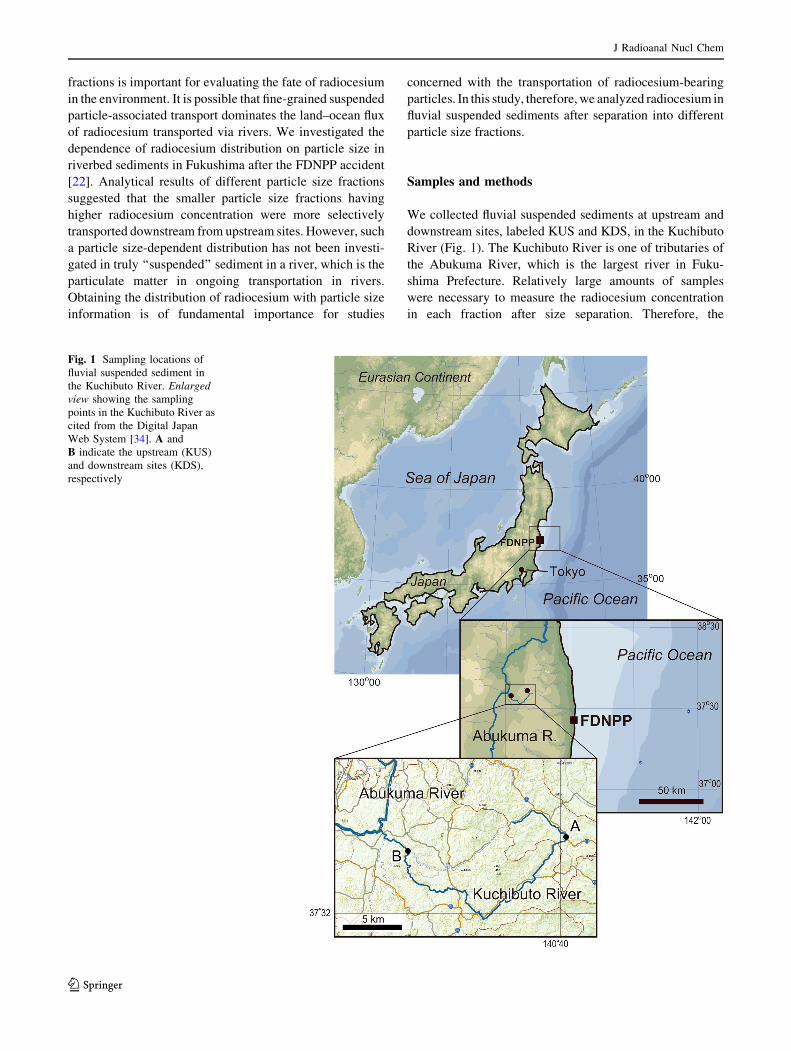
at both KUS and KDS (Table 1). Table 1 shows only the
amounts of suspended sediments used in this study that
were part of the collected samples. The remaining sedi-
ments were stored as archives.
We separated suspended sediments into different parti-
cle size fractions by two methods. One was filtration for the
KUS samples, and the other was sedimentation for the
KDS samples based on Stokes’ law [18, 19, 24]. Before
separation by filtration or sedimentation, the samples were
sufficiently suspended in water. First, for both the KUS and
KDS samples, particles larger than silt size (i.e. [63 lm)
were separated by sieving. In particular, two-step sieving
was carried out to separate fragments of plants larger than
125 lm for the KUS samples. Finally, the KUS samples
were divided into five fractions of particles with [125,
63–125, 20–63, 3–20 and 0.2–3 lm by sieving and filtra-
tion. The KDS samples were separated into six fractions,
corresponding to [63, 40–63, 20–40, 10–20, 2–10 and
\2 lm size fractions, using sieving and sedimentation.
Separation was performed by the sedimentation method
based on Stokes’ law, assuming an average density of
2.6 g/mL (= kaolinite) and a spherical shape for all parti-
cles. It should be noted that we did not remove organic
materials for the size separation to avoid any changes in the
original samples. Furthermore, we did not use a dispersing
agent for aggregates. Raw samples without any treatment
may affect the precise separation of the particles. The
specific surface areas of separated particles were deter-
mined with a Brunauer-Emmett-Teller (BET) analyzer
(BELSORP-mini, BEL Japan, Inc). Also, X-ray diffraction
(XRD) patterns for separated fractions of fluvial suspended
sediments were measured with a powder X-ray diffrac-
tometer (MultiFlex, Rigaku Co.) using CuKa radiation at
40 mA and 40 kV. All the samples were scanned over
4�–70� at a rate of 1.0� min-1 with a step interval of 0.02�.
After the size separation, homogenized samples of each
fraction were loaded into a cylindrical polystyrene container
with inner diameter of 2.0 cm and height of 4.5 cm. The
amounts of 0.2–3 lm size fractions for the KUS samples
were fairly small (Table 1), and therefore the filters on which
the particles were collected were folded and packed into a
plastic bag (4.5 9 4.5 cm2). Each sample was placed on a
planar-type Ge semiconductor detector (GC4018/7915-30/
ULB-GC, CANBERRA) to determine the count rate of c-
rays emitted from 137Cs (662 keV). The detection efficiency
on the geometry of the samples was determined using the
International Atomic Energy Agency (IAEA) reference
material IAEA-444 [25]. Count rates were converted to
radioactivity, and then the radiocesium concentration was
calculated in units of Bq/g. All the samples except one
(KUS_Dec_3) were measured within a 5 % error (1r stan-
dard deviation from counting statistics). All the activities
were corrected to the corresponding sampling dates. The
radiocesium concentration in bulk (not separated) samples
was also determined in the same way. More detailed infor-
mation on the measurement is given in Tanaka et al. [25].
Results and discussion
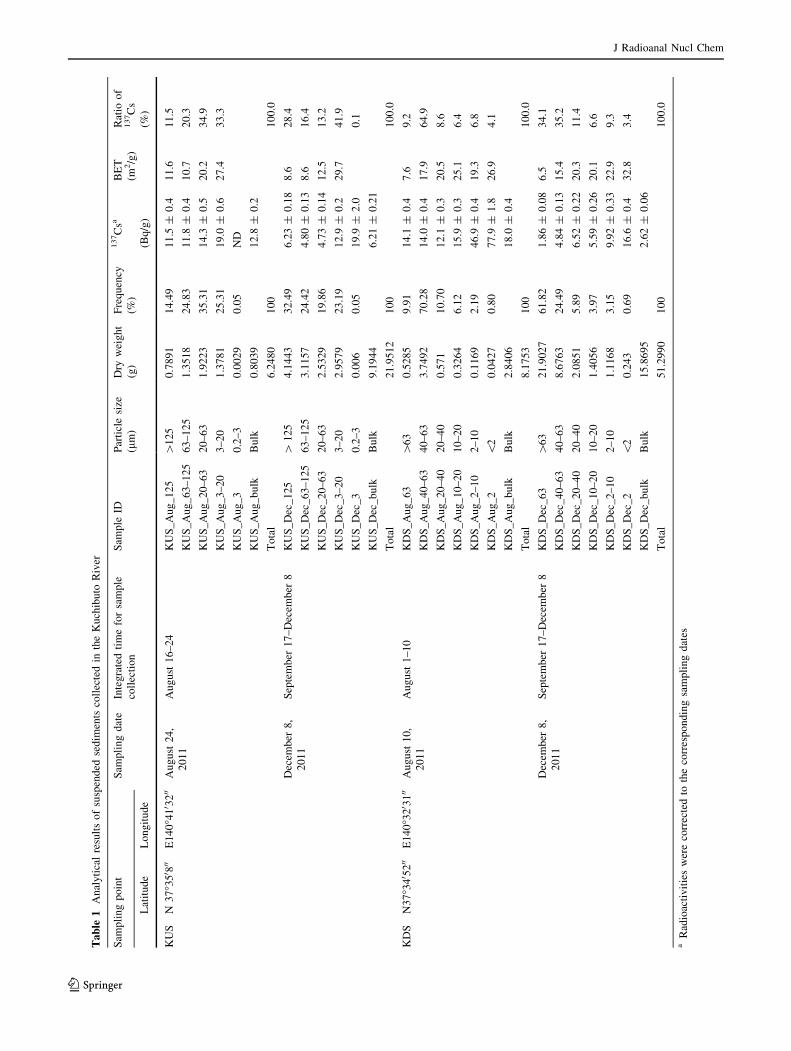
Distribution of particle size in suspended sediment
Particles larger than 2 mm were not found in fluvial sus-
pended sediment samples. The frequency of size distribu-
tion shows that the sand-size fraction (i.e. [63 lm)
occupied 40–60 % of weight in the KUS and KDS_Dec
samples, but they were 10 % in the KDS_Aug sample
(Table 1; Fig. 2). The frequencies of the clay-size (i.e.
0.2–3 or\2 lm) fractions for all the samples were less than
1 % in weight. Thus, the corresponding silt-size fractions
were 40–60 % in the KUS and KDS_Dec samples, but
90 % in the KDS_Aug sample. The December samples
(KUS_Dec and KDS_Dec) contained larger amounts of
sand-size fractions ([63 lm) than the August samples
(KUS_Aug and KDS_Aug) possibly because the December
samples were integrated for longer time, reflecting heavy
rainfall events, for example, on September 21, 2011 [26],
when larger particles were transported more efficiently.
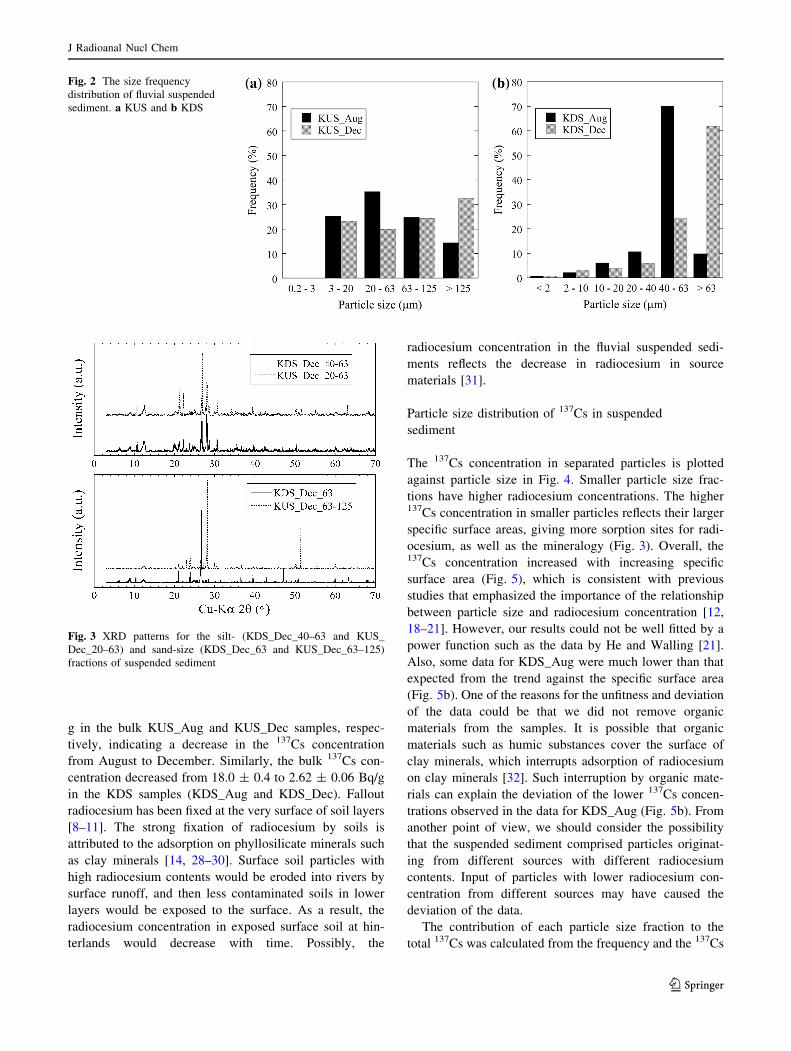
Mineralogy of suspended sediment
XRD patterns for separated fractions are shown in Fig. 3.
Two large peaks around 27� and 28� are attributed to quartz
and plagioclase, respectively. Considering the geology of
the sampling areas, i.e. granitic rocks [27], the appearance
of the two peaks, as well as other sharp peaks is quite
reasonable. The particle size fractions that were smaller
than 63 lm had similar XRD characteristics to those
observed in previously reported river sediments and sus-
pended particulate matters in Fukushima [14, 28].
Although the strong intensity of quartz and plagioclase
suppressed that of other minerals, XRD patterns for the silt-
size fractions showed peaks around 8.8�, corresponding to
smectite, mica and/or illite. The XRD patterns indicated
qualitatively that micaceous clay minerals were present
more in the silt-size fractions than in the sand-size frac-
tions. Two peaks around 12.4� and 25� corresponded to
chlorite and/or kaolinite.
137Cs concentration in bulk suspended sediment
The analytical results of 137Cs are tabulated in Table 1. The137Cs concentrations were 12.8 ± 0.2 and 6.21 ± 0.21 Bq/
J Radioanal Nucl Chem
123
Ta
ble
1A
nal
yti
cal
resu
lts
of
susp
end
edse
dim
ents
coll
ecte
din
the
Ku
chib
uto
Riv
er
Sam
pli
ng
po
int
Sam
pli
ng
dat
eIn
teg
rate
dti
me
for
sam
ple
coll
ecti
on
Sam
ple
IDP
arti
cle
size
(lm
)
Dry
wei
gh
t
(g)
Fre
qu
ency
(%)
137C
saB
ET
(m2/g
)
Rat
ioo
f137C
s
Lat
itu
de
Lo
ng
itu
de
(Bq
/g)
(%)
KU
SN
37�3
50 800
E1
40
�410 3
200
Au
gu
st2
4,
20
11
Au
gu
st1
6–
24
KU
S_
Au
g_
12
5[
12
50
.78
91
14
.49
11
.5±
0.4
11
.61
1.5
KU
S_
Au
g_
63
–1
25
63
–1
25
1.3
51
82
4.8
31
1.8
±0
.41
0.7
20
.3
KU
S_
Au
g_
20
–6
32
0–
63
1.9
22
33
5.3
11
4.3
±0
.52
0.2
34
.9
KU
S_
Au
g_
3–
20
3–
20
1.3
78
12
5.3
11
9.0
±0
.62
7.4
33
.3
KU
S_
Au
g_
30
.2–
30
.00
29
0.0
5N
D
KU
S_
Au
g_
bu
lkB
ulk
0.8
03
91
2.8
±0
.2
To
tal
6.2
48
01
00
10
0.0
Dec
emb
er8
,
20
11
Sep
tem
ber
17
–D
ecem
ber
8K
US
_D
ec_
12
5[
12
54
.14
43
32
.49
6.2
3±
0.1
88
.62
8.4
KU
S_
Dec
_6
3–
12
56
3–
12
53
.11
57
24
.42
4.8
0±
0.1
38
.61
6.4
KU
S_
Dec
_2
0–
63
20
–6
32
.53
29
19
.86
4.7
3±
0.1
41
2.5
13
.2
KU
S_
Dec
_3
–2
03
–2
02
.95
79
23
.19
12
.9±
0.2
29
.74
1.9
KU
S_
Dec
_3
0.2
–3
0.0
06
0.0
51
9.9
±2
.00
.1
KU
S_
Dec
_b
ulk
Bu
lk9
.19
44
6.2
1±
0.2
1
To
tal
21
.95
12
10
01
00
.0
KD
SN
37
�340 5
200
E1
40
�320 3
100
Au
gu
st1
0,
20
11
Au
gu
st1
–1
0K
DS
_A
ug
_6
3[
63
0.5
28
59
.91
14
.1±
0.4
7.6
9.2
KD
S_
Au
g_
40
–6
34
0–
63
3.7
49
27
0.2
81
4.0
±0
.41
7.9
64
.9
KD
S_
Au
g_
20
–4
02
0–
40
0.5
71
10
.70
12
.1±
0.3
20
.58
.6
KD
S_
Au
g_
10
–2
01
0–
20
0.3
26
46
.12
15
.9±
0.3
25
.16
.4
KD
S_
Au
g_
2–
10
2–
10
0.1
16
92
.19
46
.9±
0.4
19
.36
.8
KD
S_
Au
g_
2\
20
.04
27
0.8
07
7.9
±1
.82
6.9
4.1
KD
S_
Au
g_
bu
lkB
ulk
2.8
40
61
8.0
±0
.4
To
tal
8.1
75
31
00
10
0.0
Dec
emb
er8
,
20
11
Sep
tem
ber
17
–D
ecem
ber
8K
DS
_D
ec_
63
[6
32
1.9
02
76
1.8
21
.86
±0
.08
6.5
34
.1
KD
S_
Dec
_4
0–
63
40
–6
38
.67
63
24
.49
4.8
4±
0.1
31
5.4
35
.2
KD
S_
Dec
_2
0–
40
20
–4
02
.08
51
5.8
96
.52
±0
.22
20
.31
1.4
KD
S_
Dec
_1
0–
20
10
–2
01
.40
56
3.9
75
.59
±0
.26
20
.16
.6
KD
S_
Dec
_2
–1
02
–1
01
.11
68
3.1
59
.92
±0
.33
22
.99
.3
KD
S_
Dec
_2
\2
0.2
43
0.6
91
6.6
±0
.43
2.8
3.4
KD
S_
Dec
_b
ulk
Bu
lk1
5.8
69
52
.62
±0
.06
To
tal
51
.29
90
10
01
00
.0
aR
adio
acti
vit
ies
wer
eco
rrec
ted
toth
eco
rres
po
nd
ing
sam
pli
ng
dat
es
J Radioanal Nucl Chem
123
g in the bulk KUS_Aug and KUS_Dec samples, respec-
tively, indicating a decrease in the 137Cs concentration
from August to December. Similarly, the bulk 137Cs con-
centration decreased from 18.0 ± 0.4 to 2.62 ± 0.06 Bq/g
in the KDS samples (KDS_Aug and KDS_Dec). Fallout
radiocesium has been fixed at the very surface of soil layers
[8–11]. The strong fixation of radiocesium by soils is
attributed to the adsorption on phyllosilicate minerals such
as clay minerals [14, 28–30]. Surface soil particles with
high radiocesium contents would be eroded into rivers by
surface runoff, and then less contaminated soils in lower
layers would be exposed to the surface. As a result, the
radiocesium concentration in exposed surface soil at hin-
terlands would decrease with time. Possibly, the
radiocesium concentration in the fluvial suspended sedi-
ments reflects the decrease in radiocesium in source
materials [31].
Particle size distribution of 137Cs in suspended
sediment
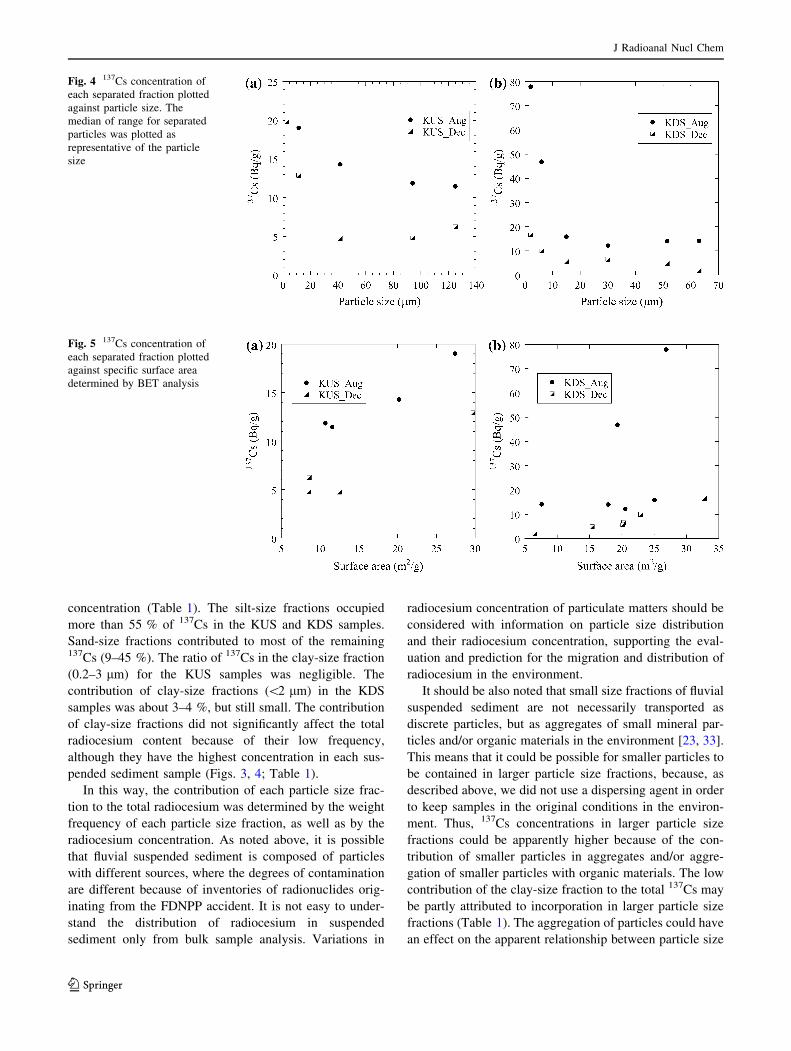
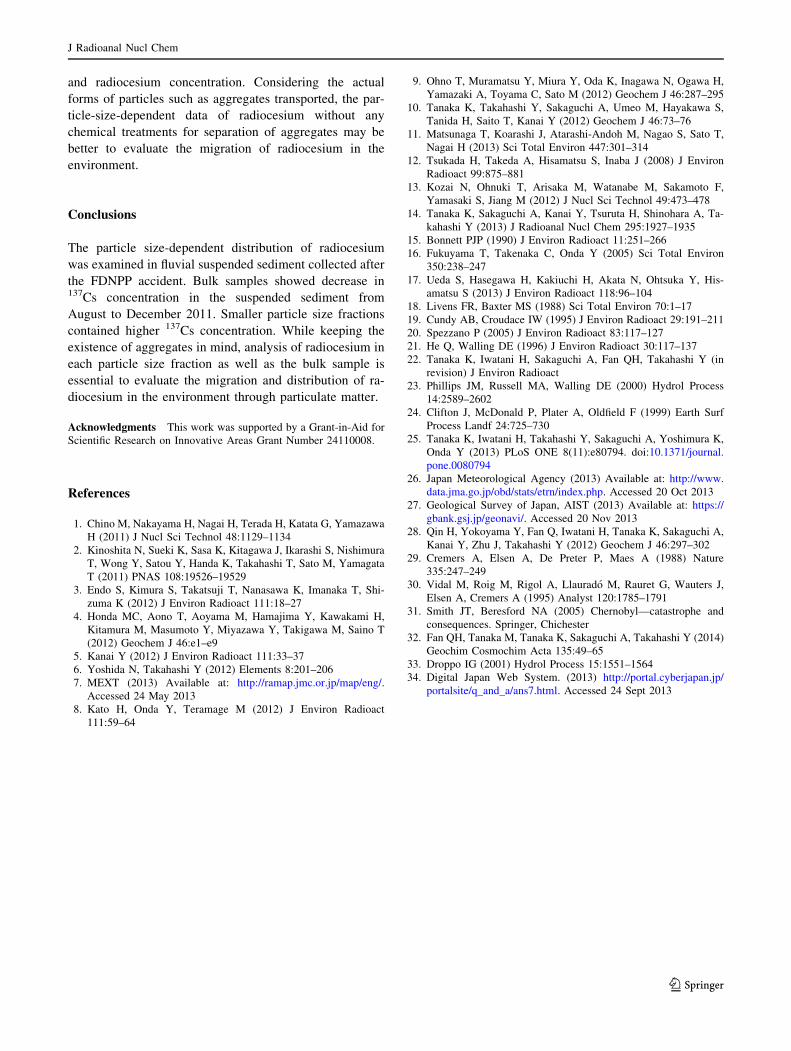
The 137Cs concentration in separated particles is plotted
against particle size in Fig. 4. Smaller particle size frac-
tions have higher radiocesium concentrations. The higher137Cs concentration in smaller particles reflects their larger
specific surface areas, giving more sorption sites for radi-
ocesium, as well as the mineralogy (Fig. 3). Overall, the137Cs concentration increased with increasing specific
surface area (Fig. 5), which is consistent with previous
studies that emphasized the importance of the relationship
between particle size and radiocesium concentration [12,
18–21]. However, our results could not be well fitted by a
power function such as the data by He and Walling [21].
Also, some data for KDS_Aug were much lower than that
expected from the trend against the specific surface area
(Fig. 5b). One of the reasons for the unfitness and deviation
of the data could be that we did not remove organic
materials from the samples. It is possible that organic
materials such as humic substances cover the surface of
clay minerals, which interrupts adsorption of radiocesium
on clay minerals [32]. Such interruption by organic mate-
rials can explain the deviation of the lower 137Cs concen-
trations observed in the data for KDS_Aug (Fig. 5b). From
another point of view, we should consider the possibility
that the suspended sediment comprised particles originat-
ing from different sources with different radiocesium
contents. Input of particles with lower radiocesium con-
centration from different sources may have caused the
deviation of the data.
The contribution of each particle size fraction to the
total 137Cs was calculated from the frequency and the 137Cs
Fig. 2 The size frequency
distribution of fluvial suspended
sediment. a KUS and b KDS
Fig. 3 XRD patterns for the silt- (KDS_Dec_40–63 and KUS_
Dec_20–63) and sand-size (KDS_Dec_63 and KUS_Dec_63–125)
fractions of suspended sediment
J Radioanal Nucl Chem
123
concentration (Table 1). The silt-size fractions occupied
more than 55 % of 137Cs in the KUS and KDS samples.
Sand-size fractions contributed to most of the remaining137Cs (9–45 %). The ratio of 137Cs in the clay-size fraction
(0.2–3 lm) for the KUS samples was negligible. The
contribution of clay-size fractions (\2 lm) in the KDS
samples was about 3–4 %, but still small. The contribution
of clay-size fractions did not significantly affect the total
radiocesium content because of their low frequency,
although they have the highest concentration in each sus-
pended sediment sample (Figs. 3, 4; Table 1).
In this way, the contribution of each particle size frac-
tion to the total radiocesium was determined by the weight
frequency of each particle size fraction, as well as by the
radiocesium concentration. As noted above, it is possible
that fluvial suspended sediment is composed of particles
with different sources, where the degrees of contamination
are different because of inventories of radionuclides orig-
inating from the FDNPP accident. It is not easy to under-
stand the distribution of radiocesium in suspended
sediment only from bulk sample analysis. Variations in
radiocesium concentration of particulate matters should be
considered with information on particle size distribution
and their radiocesium concentration, supporting the eval-
uation and prediction for the migration and distribution of
radiocesium in the environment.
It should be also noted that small size fractions of fluvial
suspended sediment are not necessarily transported as
discrete particles, but as aggregates of small mineral par-
ticles and/or organic materials in the environment [23, 33].
This means that it could be possible for smaller particles to
be contained in larger particle size fractions, because, as
described above, we did not use a dispersing agent in order
to keep samples in the original conditions in the environ-
ment. Thus, 137Cs concentrations in larger particle size
fractions could be apparently higher because of the con-
tribution of smaller particles in aggregates and/or aggre-
gation of smaller particles with organic materials. The low
contribution of the clay-size fraction to the total 137Cs may
be partly attributed to incorporation in larger particle size
fractions (Table 1). The aggregation of particles could have
an effect on the apparent relationship between particle size
Fig. 4 137Cs concentration of
each separated fraction plotted
against particle size. The
median of range for separated
particles was plotted as
representative of the particle
size
Fig. 5 137Cs concentration of
each separated fraction plotted
against specific surface area
determined by BET analysis
J Radioanal Nucl Chem
123
and radiocesium concentration. Considering the actual
forms of particles such as aggregates transported, the par-
ticle-size-dependent data of radiocesium without any
chemical treatments for separation of aggregates may be
better to evaluate the migration of radiocesium in the
environment.
Conclusions
The particle size-dependent distribution of radiocesium
was examined in fluvial suspended sediment collected after
the FDNPP accident. Bulk samples showed decrease in137Cs concentration in the suspended sediment from
August to December 2011. Smaller particle size fractions
contained higher 137Cs concentration. While keeping the
existence of aggregates in mind, analysis of radiocesium in
each particle size fraction as well as the bulk sample is
essential to evaluate the migration and distribution of ra-
diocesium in the environment through particulate matter.
Acknowledgments This work was supported by a Grant-in-Aid for
Scientific Research on Innovative Areas Grant Number 24110008.
References
1. Chino M, Nakayama H, Nagai H, Terada H, Katata G, Yamazawa
H (2011) J Nucl Sci Technol 48:1129–1134
2. Kinoshita N, Sueki K, Sasa K, Kitagawa J, Ikarashi S, Nishimura
T, Wong Y, Satou Y, Handa K, Takahashi T, Sato M, Yamagata
T (2011) PNAS 108:19526–19529
3. Endo S, Kimura S, Takatsuji T, Nanasawa K, Imanaka T, Shi-
zuma K (2012) J Environ Radioact 111:18–27
4. Honda MC, Aono T, Aoyama M, Hamajima Y, Kawakami H,
Kitamura M, Masumoto Y, Miyazawa Y, Takigawa M, Saino T
(2012) Geochem J 46:e1–e9
5. Kanai Y (2012) J Environ Radioact 111:33–37
6. Yoshida N, Takahashi Y (2012) Elements 8:201–206
7. MEXT (2013) Available at: http://ramap.jmc.or.jp/map/eng/.
Accessed 24 May 2013
8. Kato H, Onda Y, Teramage M (2012) J Environ Radioact
111:59–64
9. Ohno T, Muramatsu Y, Miura Y, Oda K, Inagawa N, Ogawa H,
Yamazaki A, Toyama C, Sato M (2012) Geochem J 46:287–295
10. Tanaka K, Takahashi Y, Sakaguchi A, Umeo M, Hayakawa S,
Tanida H, Saito T, Kanai Y (2012) Geochem J 46:73–76
11. Matsunaga T, Koarashi J, Atarashi-Andoh M, Nagao S, Sato T,
Nagai H (2013) Sci Total Environ 447:301–314
12. Tsukada H, Takeda A, Hisamatsu S, Inaba J (2008) J Environ
Radioact 99:875–881
13. Kozai N, Ohnuki T, Arisaka M, Watanabe M, Sakamoto F,
Yamasaki S, Jiang M (2012) J Nucl Sci Technol 49:473–478
14. Tanaka K, Sakaguchi A, Kanai Y, Tsuruta H, Shinohara A, Ta-
kahashi Y (2013) J Radioanal Nucl Chem 295:1927–1935
15. Bonnett PJP (1990) J Environ Radioact 11:251–266
16. Fukuyama T, Takenaka C, Onda Y (2005) Sci Total Environ
350:238–247
17. Ueda S, Hasegawa H, Kakiuchi H, Akata N, Ohtsuka Y, His-
amatsu S (2013) J Environ Radioact 118:96–104
18. Livens FR, Baxter MS (1988) Sci Total Environ 70:1–17
19. Cundy AB, Croudace IW (1995) J Environ Radioact 29:191–211
20. Spezzano P (2005) J Environ Radioact 83:117–127
21. He Q, Walling DE (1996) J Environ Radioact 30:117–137
22. Tanaka K, Iwatani H, Sakaguchi A, Fan QH, Takahashi Y (in
revision) J Environ Radioact
23. Phillips JM, Russell MA, Walling DE (2000) Hydrol Process
14:2589–2602
24. Clifton J, McDonald P, Plater A, Oldfield F (1999) Earth Surf
Process Landf 24:725–730
25. Tanaka K, Iwatani H, Takahashi Y, Sakaguchi A, Yoshimura K,
Onda Y (2013) PLoS ONE 8(11):e80794. doi:10.1371/journal.
pone.0080794
26. Japan Meteorological Agency (2013) Available at: http://www.
data.jma.go.jp/obd/stats/etrn/index.php. Accessed 20 Oct 2013
27. Geological Survey of Japan, AIST (2013) Available at: https://
gbank.gsj.jp/geonavi/. Accessed 20 Nov 2013
28. Qin H, Yokoyama Y, Fan Q, Iwatani H, Tanaka K, Sakaguchi A,
Kanai Y, Zhu J, Takahashi Y (2012) Geochem J 46:297–302
29. Cremers A, Elsen A, De Preter P, Maes A (1988) Nature
335:247–249
30. Vidal M, Roig M, Rigol A, Llaurado M, Rauret G, Wauters J,
Elsen A, Cremers A (1995) Analyst 120:1785–1791
31. Smith JT, Beresford NA (2005) Chernobyl—catastrophe and
consequences. Springer, Chichester
32. Fan QH, Tanaka M, Tanaka K, Sakaguchi A, Takahashi Y (2014)
Geochim Cosmochim Acta 135:49–65
33. Droppo IG (2001) Hydrol Process 15:1551–1564
34. Digital Japan Web System. (2013) http://portal.cyberjapan.jp/
portalsite/q_and_a/ans7.html. Accessed 24 Sept 2013
J Radioanal Nucl Chem
123