regional climate variability and change · regional climate variability and change. 1 . ... source:...
TRANSCRIPT

Regional Climate Variability and Change
1
Dr. Cedric J. VAN MEERBEECK – Climatologist ([email protected])
Ms. Wazita B. SCOTT – Assistant Climate Forecaster ([email protected])
http://rcc.cimh.edu.bb

Climate variability and predictability in the Caribbean
2
3
Adapted from: GFCS
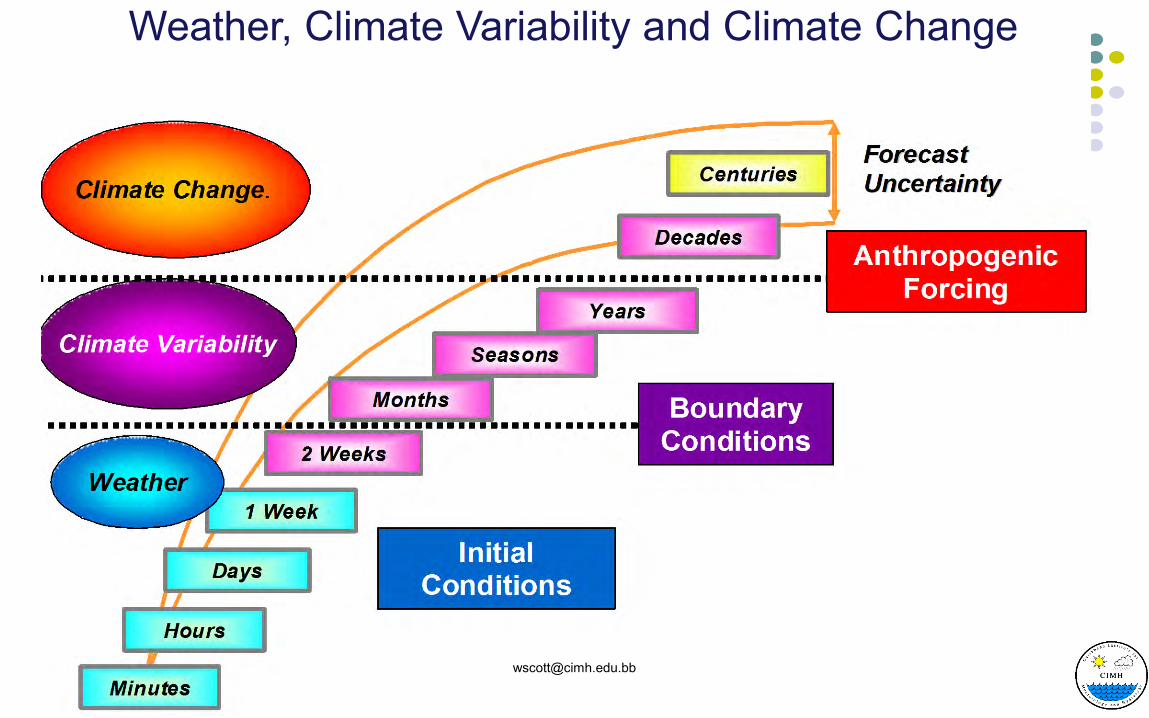
Weather, Climate Variability and Climate Change
variability
change
variability
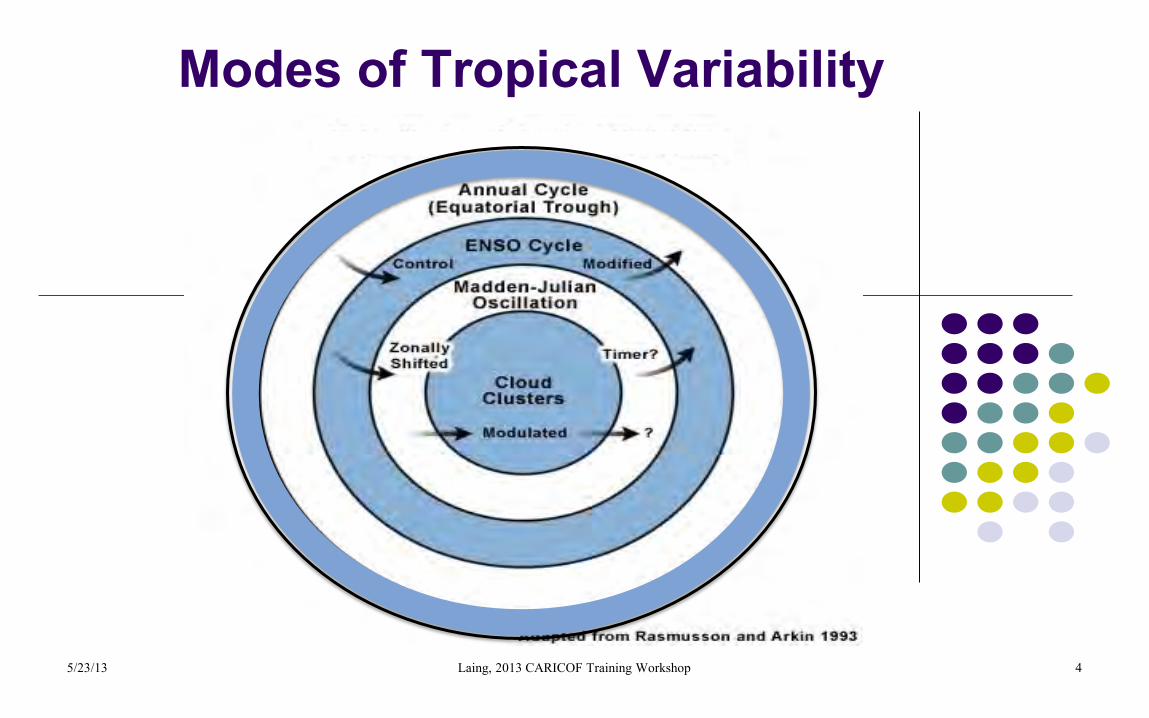
Modes of Tropical Variability
5/23/13 Laing, 2013 CARICOF Training Workshop 4
Decadal Oscillations

Main modes of variability influencing our climate at seasonal to inter-annual time scales
5
ENSO NAO Saharan dust MJO

Our Caribbean Climate Outlook Newsletter tells us: EL NIÑO • El Niño is…
– Warmer than normal sea surface temperatures across the east-central equatorial Pacific (off the coast of South America).
– Due to ocean currents and winds shift near equator.
– Occurs every 2-7 years • El Niño stabilises the atmosphere, tears up
storm clouds and leads to dryness in our region… EXCEPT northern Caribbean, where El Niños tend to bring more dry season rains.
• El Niño 2015, the 2nd strongest since at least 1950, will last throughout the 2015-6 dry season.
Source: CariCOF Caribbean Climate Outlook Newsletter
El Niño conditions
Normal conditions
WETWET
WET
DRY
DRYDRY
El Niño events involve unusual warming of the eastern equatorial PacificOcean. They typically occur every 2-7 years and last about 6-18 months.During the dry season, El Niño often weakens the development of rain-and thunderstorms in the eastern and southern Caribbean.
Why the ongoing drought?

Drought & El Niño in time Most of the intense droughts coincide with El Niño
7
-6
-5
-4
-3
-2
-1
0
1
2
3
4
5
6
1971
1971
1972
1973
1973
1974
1975
1975
1976
1977
1977
1978
1979
1979
1980
1981
1981
1982
1983
1983
1984
1985
1985
1986
1987
1987
1988
1989
1989
1990
1991
1991
1992
1993
1993
1994
1995
1995
1996
1997
1997
1998
1999
1999
2000
2001
2001
2002
2003
2003
2004
2005
2005
2006
2007
2007
2008
2009
2009
2010
2011
2011
2012
2013
2013
2014
2015
2015
St Lucia, G Charles SPI
1mth
3mth
6mth
12mth

La Niña
8
Essentially the opposite of El Niño
Unusually cold ocean temperatures in the tropical Pacific
The impact on rainfall also mirrors El Niños

Currently in the news – drought!!
Antigua From August: “No surface water exploitable, 83% desalination” (Antigua & Barbuda Met Services) From October: 100% desalinated water
Barbados record driest year resulting in water outages in central and northern part of the island.
St. Kitts & Nevis water rationing resumes in January 2016 after second driest year on record. No water sold to cruise ships since September.
St. Lucia two driest years on record in 2014 & 2015 led to water restrictions for all households.
Dominica Tropical Storm Erika amidst drought: 1.3 billion EC$ damage and losses.
Potworks Dam in Antigua
Mona reservoir in Jamaica
Carraizo reservoir in Puerto Rico
https://anumetservice.wordpress.com/2015/08/17/antigua-is-out-of-surface-water-again/ http://jamaica-gleaner.com/article/lead-stories/20150807/drought-affecting-lives-across-caribbean http://www.washingtontimes.com/news/2015/aug/5/parched-caribbean-faces-widespread-drought-water-s/?page=all http://jamaica-gleaner.com/article/lead-stories/20150706/st-thomas-struggles-cope-water-crisis http://www.jamaicaobserver.com/news/Drought-fuels-bush-fires-in-Manchester
2015: record dry in many places

Currently in the news – drought!!
Antigua From August: “No surface water exploitable, 83% desalination” (Antigua & Barbuda Met Services) From October: 100% desalinated water
Barbados record driest year resulting in water outages in central and northern part of the island.
St. Kitts & Nevis water rationing resumes in January 2016 after second driest year on record. No water sold to cruise ships since September.
St. Lucia two driest years on record in 2014 & 2015 led to water restrictions for all households.
Dominica Tropical Storm Erika amidst drought: 1.3 billion EC$ damage and losses.
Dominica after TS Erika https://anumetservice.wordpress.com/2015/08/17/antigua-is-out-of-surface-water-again/ http://jamaica-gleaner.com/article/lead-stories/20150807/drought-affecting-lives-across-caribbean http://www.washingtontimes.com/news/2015/aug/5/parched-caribbean-faces-widespread-drought-water-s/?page=all http://jamaica-gleaner.com/article/lead-stories/20150706/st-thomas-struggles-cope-water-crisis http://www.jamaicaobserver.com/news/Drought-fuels-bush-fires-in-Manchester
2015: record dry in many places

Currently in the news – drought!!
Belize Millions $ losses in agriculture.
Cuba most severe drought since 2004 with water deficits in 45% of country and 100,000 people depending on water delivery by tanks.
Dominican Republic 11% decrease in agricultural production.
Guyana Guyana Water Inc. updated water rationing and management practices for Georgetown
Haïti 200,000 families affected by ongoing drought, with a 30% reduction in harvest over 2015
Puerto Rico streamflows well below average, eastern PR under drought, rationed water supply to San Juan up till October. (PR Met Service)
Potworks Dam in Antigua
Mona reservoir in Jamaica
Carraizo reservoir in Puerto Rico
https://anumetservice.wordpress.com/2015/08/17/antigua-is-out-of-surface-water-again/ http://jamaica-gleaner.com/article/lead-stories/20150807/drought-affecting-lives-across-caribbean http://www.washingtontimes.com/news/2015/aug/5/parched-caribbean-faces-widespread-drought-water-s/?page=all http://jamaica-gleaner.com/article/lead-stories/20150706/st-thomas-struggles-cope-water-crisis http://www.jamaicaobserver.com/news/Drought-fuels-bush-fires-in-Manchester
2015: record dry in many places

Our drought monitoring products E.g. the map below shows 12-month drought severity
between February 2015 and January 2015
LEGEND Source: Caribbean Drought Bulletin
Exceptionally Dry most severe very rare
Normal usual common
Exceptionally Wet most severe very rare
How do we know? OBSERVATIONS: • Short-term drought in
Lesser Antilles & Guyana. Medium- and long-term drought throughout the Antilles (except Cuba).
IMPLICATIONS: • Areas in short- to medium-
term drought: (i) more bush fires, (ii) low agricultural yields, (iii) possible price increase in local goods.
• Areas in long-term drought: (i) unreliable water supply due to water shortages & (ii) water consumption restrictions.

When can we expect drought relief?
El Niño subsiding El Niño weakening since December 2015; it is expected to
disappear by June 2016. AND: more likely than not, El Niño might make way for opposite:
La Niña.
Drought subsiding after dry season … BUT: As the 2015-6 dry season goes on, drought impacts will
worsen. AND: In case of La Niña, higher flood risk during the wet/Hurricane
season.
The current El Niño and drought to subside by June 2016

14
North Atlantic Oscillation • NAO = interannual variability in winter (DJF) atmospheric circulation over North
Atlantic region defined by strength of gradient between semi-permanent Azores-Bermuda High & Iceland Low.
• NAO-index = normalized pressure difference between Azores & Iceland.

Predictability of rainfall and NAO: A positive NAO carries drier air to the Eastern Caribbean, in particular during the early part of the year, along with stronger trade winds. That means the east tends to be drier during positive NAO phases, and the opposite is true for negative phases, BUT: there is currently very limited predictability of the NAO itself. So even if we understand NAO influences rainfall, we can’t use it for seasonal forecasting.
NOAA CPC – NAO monitoring

Saharan Dust impacts our weather
16
Dust interacts with radiation influences on the energy budget
Dust absorbs LW radiation warming of the layer these aerosols are located
Is transported through the globe in layers throughout the depth of the atmosphere

MJO Impacts on Caribbean
5/23/13 Laing, 2013 CARICOF Training Workshop 17
• MJO can cause ½ a month or more of enhanced convection or suppression of convection
• Should monitor its state and forecast and explain its impact to users

MJO & Hurricane Activity
5/23/13 Laing, 2013 CARICOF Training Workshop 18

Observed trends in temperature and rainfall extremes in the Caribbean
19

EGU GA 2013 - Vienna Austria
Stephenson et al. (2014, Intl. J. Climatology)
20

Significant region-wide temperature trends!!
increase TNmean +1.4°C
vs
TXmean +0.95°C
decrease in diurnal temperature range
(DTR).
a) TXmean
b) TNmean
c) DTR
1961-2010 1986-2010
21 EGU GA 2013 - Vienna Austria
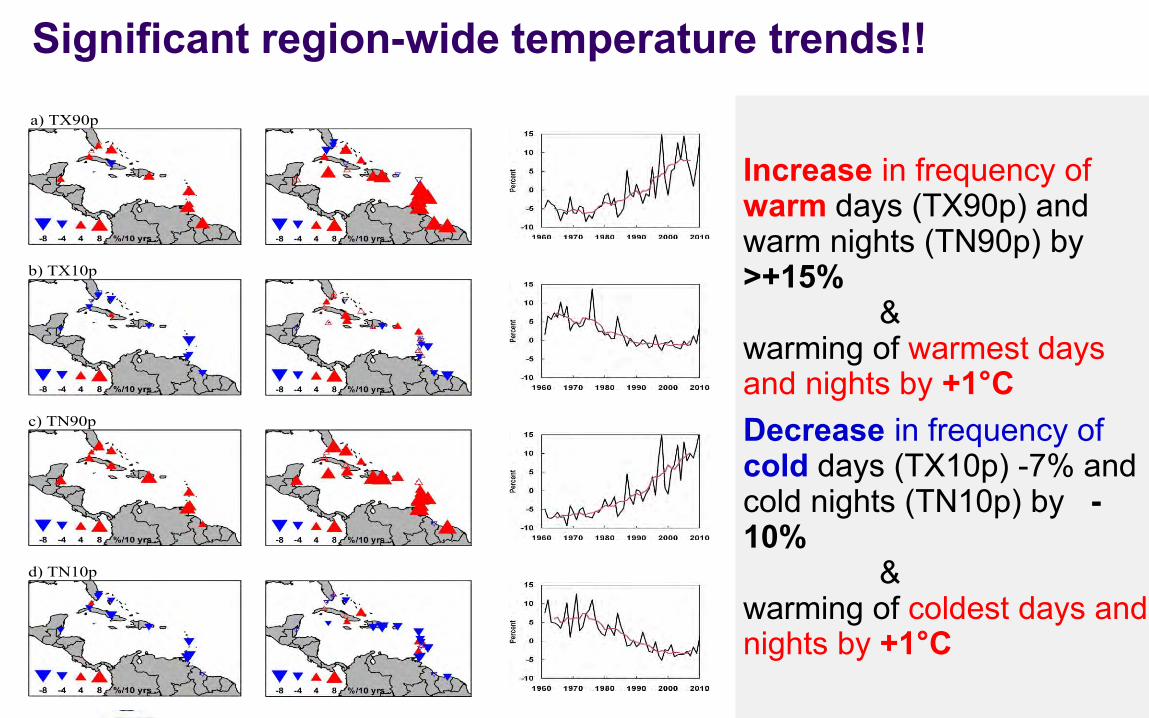
Significant region-wide temperature trends!! 1961-2010 1986-2010
a) TX90p
b) TX10p
c) TN90p
d) TN10p
22
1961-2010 1986-2010
Increase in frequency of warm days (TX90p) and warm nights (TN90p) by >+15% & warming of warmest days and nights by +1°C Decrease in frequency of cold days (TX10p) -7% and cold nights (TN10p) by -10% & warming of coldest days and nights by +1°C

Significant region-wide rainfall trends?? a) PRCPTOT
b) SDII
c) CDD
1961-2010 1986-2010
23
EGU GA 2013 - Vienna Austria
Despite recent apparent rise (boxed)
No annual RR change (PRCPTOT) No change in single rainfall event intensity (SDII) No change in dry spells (CDD)

a) R20mm
b) RX5day
c) R95p
Significant region-wide rainfall trends?? 1961-2010 1986-2010
24 EGU GA 2013 - Vienna Austria
No significant change in
RR from heavy rainfall events
Significant rise in extreme rainfall (R95p)
since about 1990

Comparison to previous assessment A similar workshop in 2001 resulted in a paper by Peterson et al. (2002,
JGR), noting: dramatic increase in # warm days and nights decrease in # very cool days and nights decrease in dry spell duration increase in # heavy rainfall events for a mean Caribbean.
Those results were calculated from 16 stations for TX/TN and 29 stations for RR running from 1958-1999, including data gaps.
All of their results except dry spell duration – no significant decrease – are corroborated by our findings.
25 EGU GA 2013 - Vienna Austria

Tight coupling land temperature
variability and Atlantic Multi-decadal Oscillation
(AMO)
Coupling very weak between rainfall and AMO
Decadal variability tied to AMO?
a) TX90p
d) SDII
b) TN90p
e) R50mm
c) TN10p
f) R50p
EGU GA 2013 - Vienna Austria

EGU GA 2013 - Vienna Austria
Take Home Messages The regional ETCCDI workshops continue to be a very efficient way of
rescuing climate data and updating our knowledge of climate trends and extremes.
Robust trends are: warming of mean and extreme daily maximum and minimum temperatures;
increase in number and temperature of very warm days and nights;
decrease in number and temperature of very cool days and nights.
Despite that models predict an increase in extreme precipitation, longer dry spells and reduced annual rainfall in the Caribbean, no long-term change is observed as yet…
… save for an emerging rising trend in extreme rainfall since 1990.
27

Future Climate Change projections for the Caribbean
28

29
Mean changes in the annual rainfall for 2071-2099 with respect to 1961-1989, as simulated by PRECIS_ECH and PRECIS_Had for SRESA2 and SRESB2.
Downscaled climate change projections for the end of 21st Century
(using IPCCC SRES scenarios)
- general drying trend for the Caribbean Basin
- Drying of 25% to 30%
- November to April possibly wetter far north
Climate Change
Adapted from: Taylor et al. (GFCS – Caribbean RWCS, Trinidad, 2013)

30
EARLY WORKS – MODEL PROJECTIONS
Projected Precipitation Change
Drying exceeds natural variability
June-October – wet season drier!
Adapted from: Taylor et al. (GFCS – Caribbean RWCS, Trinidad, 2013)
31
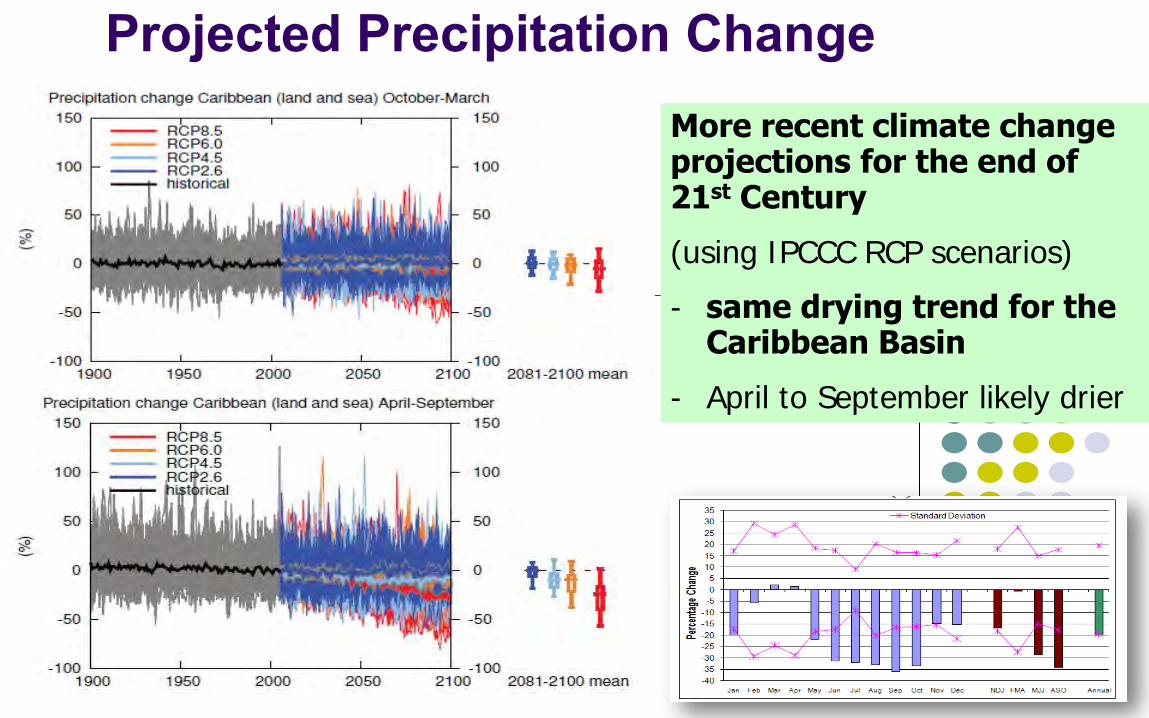
Projected Precipitation Change More recent climate change projections for the end of 21st Century
(using IPCCC RCP scenarios)
- same drying trend for the Caribbean Basin
- April to September likely drier

32
hot hotter
Taylor et al. (2011)
Why?
Projected Precipitation Change
Adapted from: Taylor et al. (GFCS – Caribbean RWCS, Trinidad, 2013)

Correlation of 925 zonal wind & Precipitation
5/23/13 Laing, 2013 CARICOF Training Workshop 33
more heating in east Pacific than in Caribbean more subsidence over Caribbean + stronger easterlies less rainfall
Munoz et al. 2008
Projected Precipitation Change
Why?

Mean changes in the annual mean surface temperature for 2071-2099 with respect to 1961-1989, as simulated by PRECIS_ECH and PRECIS_Had for SRESA2 and SRESB2.
Warming by the end of 21st Century 1 to 5oC
Warming consistent with projections for other parts of globe.
Warming far exceeds natural variability
Projected Temperature Change
Adapted from: Taylor et al. (GFCS – Caribbean RWCS, Trinidad, 2013)

35
More recent climate change projections for the end of 21st Century
(using IPCCC RCP scenarios)
Same conclusions as before
1oC to 5oC warming
Projected Temperature Change

Questions?
36